1
A 3-DIMENSIONAL GRAPH EDITOR IN HASKELL
by
O. Halabieh
N. Liu
W. S. Tan
L. Zhao
COMPUTER SCIENCE 4ZP6 PROJECT
FINAL REPORT
Supervised by Dr. Kahl
Department of Computing and Software
McMaster University
Hamilton, Ontario L8S 4K1
2004
ABSTRACT & SUMMARY
As the title suggests, this project deals with viewing and editing 3-dimensional graphs.
Although most graph editors available in the market handle 2-dimensional graphs, there are a limited number of 3-dimensional graph editing tools. However, none of the existing tools are written
in Haskell, so they fail to interface with other software written in that language thus our motivation
to develop such a tool. Our work involved, therefore, creating an interactive editing environment
for 3-dimensional graphs in Haskell using HOpenGL. This project also involved developing a
library for such graphs so that components of this library may be reused in other Haskell programs.
This project was done for Dr.Wolfram Kahl, associate professor of software engineering at
McMaster University, who is interested in such tool since he has many other programs which
generate 3-dimensional graphs and he would like to view and edit them. In addition he is also
keen on Haskell, thus our requirement to use that language.
This project was done by Omar Halabieh, Ning Liu, Wern Sern Tan and Lei Zhao in collaboration
with Jun Wu, a graduate student at McMaster University supervised by Dr. Kahl. We would
like to take this opportunity to thank Jun Wu for her contribution into the implementation
of this tool, Gordon Uszkay who helped us throughout the work with his expertise in project
management, Dr. Anand and Dr. Zucker for their efforts in coordinating this course, and last but
not least our supervisor Dr.Kahl for his continuous support and belief in us.
The project was completed successfully and was demonstrated to work for graphs with small
number of nodes and edges. However, the tool has proven too slow on larger graphs (more than
twenty nodes). A number of areas in which performance might be improved were identified, and
these would form a good project for a subsequent group.
ii
Contents
1 REQUIREMENTS ANALYSIS
1.1 Background . . . . . . . . . . . . . . . . . . . . . . . . . . . . . . . . . . . . . . . . . . . . . . . . . . .
1.2 Functional Requirements . . . . . . . . . . . . . . . . . . . . . . . . . . . . . . . . . . . . . . . . . . . .
1.3 Non-Functional Requirements . . . . . . . . . . . . . . . . . . . . . . . . . . . . . . . . . . . . . . . . .
1
1
2
6
2 HIGH LEVEL DESIGN
8
3 IMPLEMENTATION
3.1 Literate Code . . . . . . . . . . . . . . . . . . . . . . . . . . . . . . . . . . . . . . . . . . . . . . . . . .
4 VERIFICATION
4.1 High Level Test Plan
4.2 White Box Testing .
4.3 Black Box Testing .
4.4 Issue Tracking . . . .
4.5 Evaluation of Work .
.
.
.
.
.
.
.
.
.
.
.
.
.
.
.
.
.
.
.
.
.
.
.
.
.
.
.
.
.
.
.
.
.
.
.
.
.
.
.
.
.
.
.
.
.
.
.
.
.
.
.
.
.
.
.
.
.
.
.
.
.
.
.
.
.
.
.
.
.
.
.
.
.
.
.
.
.
.
.
.
.
.
.
.
.
.
.
.
.
.
.
.
.
.
.
.
.
.
.
.
.
.
.
.
.
.
.
.
.
.
.
.
.
.
.
.
.
.
.
.
.
.
.
.
.
.
.
.
.
.
.
.
.
.
.
.
.
.
.
.
.
.
.
.
.
.
.
.
.
.
.
.
.
.
.
.
.
.
.
.
.
.
.
.
.
.
.
.
.
.
.
.
.
.
.
.
.
.
.
.
.
.
.
.
.
.
.
.
.
.
.
.
.
.
.
.
.
.
.
.
.
.
.
.
.
.
.
.
.
.
.
.
.
.
.
.
.
.
.
.
.
.
.
.
.
.
.
.
.
.
REFERENCES
A USER MANUAL
A.1 OVERVIEW .
A.2 GRAPHS . . .
A.3 VIEWS . . . .
A.4 SETTINGS . .
17
19
121
121
121
122
122
124
125
.
.
.
.
.
.
.
.
.
.
.
.
.
.
.
.
.
.
.
.
.
.
.
.
.
.
.
.
.
.
.
.
.
.
.
.
.
.
.
.
.
.
.
.
.
.
.
.
.
.
.
.
.
.
.
.
.
.
.
.
.
.
.
.
.
.
.
.
.
.
.
.
.
.
.
.
.
.
.
.
.
.
.
.
.
.
.
.
.
.
.
.
.
.
.
.
.
.
.
.
.
.
.
.
.
.
.
.
.
.
.
.
.
.
.
.
.
.
.
.
.
.
.
.
.
.
.
.
.
.
.
.
.
.
.
.
.
.
.
.
.
.
.
.
.
.
.
.
.
.
.
.
.
.
.
.
.
.
.
.
.
.
.
.
.
.
.
.
.
.
.
.
.
.
.
.
.
.
.
.
.
.
.
.
.
.
.
.
.
.
.
.
.
.
.
.
126
127
129
133
135
B WHITEBOX TESTING RESULTS
137
C BLACKBOX TESTING RESULTS
161
D SCHEDULE LISTING
188
iii
List of Tables
1
2
3
White Box Testing Results . . . . . . . . . . . . . . . . . . . . . . . . . . . . . . . . . . . . . . . . . . 160
Black Box Testing Results . . . . . . . . . . . . . . . . . . . . . . . . . . . . . . . . . . . . . . . . . . . 187
Project Plan . . . . . . . . . . . . . . . . . . . . . . . . . . . . . . . . . . . . . . . . . . . . . . . . . . 189
iv
List of Figures
1
2
Module Diagram . . . . . . . . . . . . . . . . . . . . . . . . . . . . . . . . . . . . . . . . . . . . . . . . 16
Issue Tracking . . . . . . . . . . . . . . . . . . . . . . . . . . . . . . . . . . . . . . . . . . . . . . . . . . 123
v
1
1.1
REQUIREMENTS ANALYSIS
Background
Despite the fact that there are many graph editor software out there in the market, most of
them are two dimensional. While visualization of graphs in two dimensions can be very useful,
visualization in three dimensions can open up new applications and new ways of interacting with
old applications.
In addition to the relatively low amount of 3-dimensional graph editors out there, there are no
existing 3-dimensional graph editors that have been developed in Haskell. This poses a problem as
many Haskell applications out there will not be able to interface with these existing non-Haskell
graph editors when needed to.
Thus our motivation for working on this project is to present a 3-dimensional graph editor
developed in Haskell using HOpenGL which enables other Haskell developers to adapt or reuse
this software according to their needs.
Finally, the main objective of this project consists of creating a toolkit and library implementing
a comprehensive interface for exposing 3-dimensional graph visualization and interaction, in
Haskell, in a way that can be used for diverse applications.
1
2
1.2
Functional Requirements
The approach adapted to gather and analyse the requirements is based on that discussed in Dr.
Khedri’s Software Requirements Activities courseware [Khe03].
Before discussing the functional requirements, it would be helpful to define some terminology that
will be used. A graph is a set of nodes connected by edges. The layout of a graph describes the
positioning of the nodes and edges in the space. A view of a graph is a point in space from where
we are looking at the graph and a direction vector along which we are viewing. Finally, a node or
an edge attribute are physical properties of the object such as color, shape, thickness...
We will give the functional requirements for the Haskell 3-D graph library accompanying the
software first, and then those of the graph editor tool. The requirements are similar to those
presented in the extended project proposal with few minor changes, such as rephrasing them;
in addition a new requirement for undoing/redoing graph changes has been introduced. These
changes can be tracked via issues CZJ18 and CZJ29 in figure (2).
Functional requirements for the Haskell 3-D graph library:
1.2.1
File Management
Graphs with layout information will be associated with files. There will also be view files
associated with each graph which contain different views for that graph. These files can be opened
and saved, and new files can be created.
1.2.2
Graph Nodes Manipulation
Nodes can be added to or removed from a graph. Nodes can also be moved to different positions
in the graph and their attributes (color, label, stacks, slices, radius) can be modified. Any such
changes to the graph should be reflected in all existing views of that graph.
1.2.3
Graph Edges Manipulation
Edges can be added to or removed from a graph. Edges can also be bent and their attributes
(color, label, stacks, slices, radius) can be modified. Any such changes to the graph should be
reflected in all existing views of that graph.
1.2.4
Graph View Manipulation
A view of a graph can be rotated and also can be zoomed in from or out of.
1.2.5
Graph Manipulation
A graph can be rotated around a given axis(X,Y,Z) and can be scaled by a certain scalar factor.
Any such changes to the graph should be reflected in all existing views of that graph.
3
Functional requirements for the graph editor tool:
1.2.6
Close Graph Scenario
If the user wishes to close the existing graph, he selects the appropriate option in the menu and
the program will close the current graph.
1.2.7
Open Graph Scenario
If the user wishes to load an existing graph, he selects the appropriate option in the menu and the
program will ask the user for the graph file location together with its file name. If the file exists
and is of valid type, the graph is loaded into the editor with the default view. If the graph file
does not exist or is of invalid type nothing is done.
1.2.8
Save Graph Scenario
If the user wishes to save the current graph, he selects the appropriate option in the menu and he
is asked for the location together with the name of the file he wishes to save the graph into. If
the specified file already exists, the program will ask the user for permission to overwrite that file.
Otherwise, the specified file will be created and the graph will be saved into it.
1.2.9
New View Scenario
If the user wishes to add another view of the graph, he selects the appropriate option in the menu
and the program will then open another window with the same view as the default one. The user
can then edit the view in that new window.
1.2.10
Save View File Scenario
If the user wishes to save the view(s) of an opened graph, he selects the appropriate option in
the menu and he is asked for the location together with the name of the file he wishes to save
the view into. If the specified file already exists, the program will ask the user for permission
to overwrite that file. Otherwise, the specified file will be created and the view will be saved into it.
1.2.11
Close View Scenario
If the user wishes to close an opened view of an opened graph, he selects the appropriate option
in the menu and the associated window is closed.
1.2.12
Open View File Scenario
If the user wishes to open a certain view file for an opened graph, he selects the appropriate
option in the menu and the program will ask the user for the view file location and its file name.
If the file exists and is of valid type the graph will be displayed in the different views specified by
the files. Otherwise, nothing is done.
4
1.2.13
Add Node Scenario
If the user wishes to add a node, he selects the appropriate option in the menu and the program
will add a node with default shape, color and size in the location pointed to by the pointing
device, given that no node is already present there.
1.2.14
Remove Node Scenario
If the user wishes to remove an edge, he selects the appropriate option in the menu with the
desired node and chooses to delete it. The node is then removed from the graph and all incident
edges on that node are also removed.
1.2.15
Add Edge Scenario
If the user wishes to add an edge, he selects the appropriate option in the menu together with the
node upon which the edge is to be incident. The edge is then inserted in such a way that it does
not coincide with another edge.
1.2.16
Remove Edge Scenario
If the user wishes to remove an edge, he selects the appropriate option in the menu together with
the desired edge and then chooses to remove it. The edge is then deleted from the graph.
1.2.17
Bend Edge Scenario
If the user wishes to bend an edge, he selects the appropriate option in the menu and drags the
edge using his pointing device. The edge will stay connected with its nodes while being bent.
Before the bending occurs the resulting movement is checked for collision, if no collision is detected
then the edge is bent.
1.2.18
Move Node Scenario
If the user wishes to move a node, he selects the appropriate option in the menu together with
the desired node and drags it to the desired location using his pointing device. Before the moving
occurs the resulting movement is checked for collision, if no collision is detected then the node is
moved.
1.2.19
Edit Edge/Node Attribute Scenario
If the user wishes to edit an edge’s/node’s attribute (color, label, slices, stacks, radius ), he selects
the appropriate option in the menu after which he selects the edge/node and chooses the attribute
he wishes to change and enters its new value. The attribute of the edge/node is then updated.
1.2.20
Rotate Graph Around Axis Scenario
If the user wishes to rotate the graph around a given axis (X,Y or Z), he selects the appropriate
option in the menu together with the appropriate rotation mode and axis and then he rotates the
graph.
5
1.2.21
Rotate View Scenario
If the user wishes to rotate the view , he selects the appropriate option in the menu and then
rotates the view.
1.2.22
Zoom View Scenario
If the user wishes to zoom into or out of the graph, he selects the appropriate option in the menu
and zooms. There will be a limit on how much the user can zoom into or out of the graph. The
view is then updated.
1.2.23
Scaling Graph Scenario
If the user wishes to scale the graph by some scalar factor, he selects the appropriate option in
the menu and scales the graph. There will be a limit on how much the user can scale the graph
by. The graph is then updated.
1.2.24
Undo/Redo Scenario
If the user wishes to undo/redo changes done to the graph, he selects the appropriate option
in the menu which will enable him to undo/redo the latest changes done to the graph. This
requirement was added at a later stage and can be tracked via issues CZJ18 and CZJ29 in figure (2).
1.2.25
Exit Scenario
If the user wishes to exit the program , he selects the appropriate option in the menu . After that,
the program will exit.
6
1.3
Non-Functional Requirements
1.3.1
Look and Feel requirements
The graph window shall occupy the majority of the user’s screen in order to offer him a true
3-dimensional experience. Menus and controls shall not intrude into the user’s working space.
1.3.2
a)
Usability Requirements
Ease of use
The product shall be easy for anyone to use. The controls shall be intuitive and provided through
easy-to-navigate menus.
b)
Ease of learning
The product shall be easy to learn by anyone. If necessary, the user’s manual can be consulted for
help.
1.3.3
a)
Performance Requirements
Speed requirements
Reasonable response time is required on a recent machine even if that compromises the detail of
the graph to be displayed.
b)
Capacity requirements
The product is required to handle graphs comprising hundreds of nodes gracefully. Performance
for large graphs should be optimized as much as possible given both the time constraint of the
project and the hardware used.
We failed to meet this requirement. We tried to do profiling on the application to see where the
slow downs are happening due to large graphs, however some of the packages being used, namely
WxHaskell and HaXml do not support profiling by default. We strongly suspect that the slow
down is caused by the numerous interactions with the graph data structure (read and update),
as it was not implemented with performance in mind. This issue be tracked via issue CZJ30 in
figure (2).
1.3.4
a)
Operational Requirements
Partner applications
The product shall interface with other programs/applications written in Haskell.
7
1.3.5
a)
Maintainability and Portability Requirements
How easy must it be to maintain this product?
The product shall be maintained by its end-users (programmers/developers) who are familiar with
the Haskell programming language and the HOpenGL interface. Upgrades to the existing features
of the product are expected to be relatively easy. Moreover, the addition of new functionality
shall only necessitate the addition of new modules and possibly some very minor changes in the
existing implementation. To ensure this requirement is satisfied, the principles of modularization,
encapsulation and separation of concerns will be used wherever appropriate. The extensive
documentation together with the literate program style will contribute in the same direction.
b)
Portability requirements
The product is required to run under the Linux operating system. However, it should not use
any functionality that is platform specific so that it may run on other operating systems as well.
To ensure this requirement is met, all hardware access shall be handled through the published
interfaces of Haskell and HOpenGL.
1.3.6
User Documentation
The implementation shall be produced in the shape of a literate program that will help programmers and developers maintain/update the existing implementation. In addition, three layers of
documentation, each targeting a specific audience will be provided.
a) User manual
The first layer of documentation will serve as a user manual for the interactive portion of the
software. Its purpose is to teach the user how to use the tool and its different functionalities.
This document will include screen shots and detailed textual descriptions about the graphical
user interface (GUI).
b) Introduction to interface documentation
The second layer of documentation, intended to be used by developers/ programmers, will serve
as an introduction to the interface documentation accompanying the Haskell library.
c) Interface documentation
Finally, the third layer of documentation, namely the interface documentation, will be used by
developers/programmers as mentioned above to assist them in using the functionality provided
by the library.
2
HIGH LEVEL DESIGN
The specification of the system to be used for development are as follows:
CPU: Intel Pentium 4 Processor or AMD Athlon 1.4 Ghz
Operating System: Linux Redhat 8-9
Software Requirements:
a) A Haskell Compiler (Preferably GHC 6.2 with OpenGL enabled)
b) WxHaskell package
c) HaXml package
Memory: 512 MB RAM
Video: A 3D accelerator video card with support for OpenGL and at least 64 MB of video memory
is required.
The target platform should have similar specifications as the development system or better.
Given the stringent non-functional requirements elicited above in what concerns maintainability
and modifiability, a heavily modularized design is a must. After analyzing the system, the
following decomposition into modules has been reached. Each module will be described in terms
of what are the details(secrets) that it hides and the functionality(services) that it offers. The
module description, serves as a general overview of the project and the work done.
Jun Wu contributed in the project by providing us the data structure that will be used to store
the graph, a set of functions to manipulate it and an interface to read from/write to GXL files
[Wu03]. Some additional functions have been introduced to manipulate the graph data structure
as we will see in the module description to follow.
This high-level design was revised after the extended project proposal was submitted mainly due
to the fact that our understanding of the problem became much clearer after our work on the
proof of concept. These changes can be tracked via issue CZJ28 in figure (2).
8
9
a) Module Graph Data Structure
Secret: The internal data structure used to represent the graph.
Service: The following interface is offered:
In addition to the functions described below, there are also a set of functions used from Jun’s
implementation of the GXL graphset which are listed in her documentation instead [Wu03].
getItemStacks: This function is called to get the number of stacks of an item in the graph (node
or edge).
getItemSlices: This function is called to get the number of slices of an item in the graph (node or
edge).
getItemRadius: This function is called to get the radius of an item in the graph (node or edge).
bendEdgeMidPoint: This function is called before we bend an edge, in case it is straight we add a
midpoint for it to serve as a control point. Then in any case we return that control Point.
defaultNoMidPoint: This constant function is called so that we can tell if the edge is bent or not.
getNode: This function returns the information necessary to draw a given node.
getEdgeQuadricStyle: This function returns the information necessary to draw a given edge.
getItemLabel: This function is called to get the label of an item in the graph (node or edge).
getListOfNodes: This function is called to get the list of the id’s of nodes in the graph.
getListOfEdges: This function is called to get the list of the id’s of edges in the graph.
getItemColor4: This function is called to get the color of an item in the graph (node or edge).
getEdgeMidPoint: This function is called to get the control point of an edge.
getToNode: This function is called to get the node id that the edge is origination from.
getFromNode: This function is called to get the node id that the edge is terminating into.
getDirectedOrNot: This function is called to distinguish whether the edge is directed or not.
10
b) Module Graph Manipulation
Secret: Algorithms involved in manipulating the graph.
Service: The following interface is offered:
scaleGraph: This function is called to scale the graph.
graphRotationButtonDown: This function is called to rotate the graph around the vertical and
horizontal axis.
addNode: This function is called to add a node to a graph at a specified location with default
attributes.
moveNodeButtonDown: This function is called to move a node in the vertical and horizontal
directions.
moveNodeWheelUp: This function is called to move a node in depth inwards.
moveNodeWheelDown: This function is called to move a node in depth outward.
addEdge: This function is called to add an edge to a graph to connect two nodes with default
attributes.
bendEdgeWheelUp: This function is called to bend an edge in depth inwards.
bendEdgeWheelDown: This function is called to bend an edge in depth outward.
bendEdgeButtonDown: This function is called to bend an edge in the vertical and horizontal
directions.
removeItem: This function is called to remove an item (node or edge) from a graph.
colorChange: This function is called to change the color of an item (node or edge) of a graph.
radiusChange: This function is called to change the radius of an item (node or edge) of a graph.
stacksChange: This function is called to change the number of stacks of an item (node or edge) of
a graph.
slicesChange: This function is called to change the number of slices of an item (node or edge) of a
graph.
labelChange: This function is called to change the label of an item (node or edge) of a graph.
11
c) Module Graph File Manager
Secret: The file format used to hold the graph.
Service: The following interface is offered:
saveGraph: This function is called to save the current graph into a GXL file specified by the user.
openGraph: This function is called to load a graph from a GXL file specified by the user into the
program.
closeGraph: This function is called to close the current graph.
d) Module Layout
Secret: Algorithm used to generate the layout.
Service: The following interface is offered:
generateLayout: This function is called to generate a layout for the current graph if this
information is partial or not present.
e) Module Collision
Secret: Algorithm used to detect collisions.
Service: The following interface is offered:
addNodeCollision: This function is called to see if the node to be added creates a collision.
bendEdgeCollision: This function is called to see if the edge that is being bent will create a
collision in its new position.
newEdgeCollision: This function is called to see if the edge to be added creates a collision.
moveNodeCollision: This function is called to see if the node that is being moved will create a
collision in its new position.
12
f ) Module Undo Data Structure
Secret: The data structure used to be able to undo and redo.
Service: The following interface is offered:
initUndoDataStructure: This function is called to initialize the undo data structure to an empty
one.
newUndoDataStructure: This function is called to create a new undo data structure.
updateGraphDataStructure: This function is called when we need to update the current graph so
that we keep a copy of the old one thus enabling us to undo and redo.
undo: This function is called to undo the latest change made to the graph.
redo: This function is called to redo the latest change that was undone.
g) Module Draw Graph
Secret: The method used to extract the information from the current graph and display it.
Service: The following interface is offered:
displayGraph: This function is called to display the current graph on the screen from a certain
view and under certain settings.
13
h) Module View Data Structure
Secret: Internal representation of the views.
Service: The following interface is offered:
getHorizontal: This function is called to give us the horizontal component of the point we are
looking to the graph from.
getVertical: This function is called to give us the vertical component of the point we are looking
to the graph from.
getCameraDistance: This function is called to give us the depth component of the point we are
looking to the graph from.
changeHorizontal: This function is called to change the horizontal component of the point we are
looking to the graph from.
changeVertical: This function is called to change the vertical component of the point we are
looking to the graph from.
changeCameraDistance: This function is called to change the depth component of the point we
are looking to the graph from.
initView: This function is called to initialize the view to the default value.
14
i) Module View File Manager
Secret: File format used to store views.
Service: The following interface is offered:
openView: This function is called to load a view from a view file specified by the user into the
program.
saveView: This function is called to save the current view into a view file specified by the user.
closeView: This function is called to close the current view.
j) Module View Manipulation
Secret: Algorithms used to manipulate views.
Service: The following interface is offered:
rotateViewButtonDown: This function is called to rotate the view around the vertical and
horizontal axis.
rotateViewWheelUp: This function is called to zoom the view into the graph.
rotateViewWheelDown: This function is called to zoom the view out of the graph.
k) Module Settings Data Structure
Secret: Internal representation of the settings.
Service: The following interface is offered:
initSettingsDataStructure: This function is called to initialize the settings data structure to the
default one.
newSettingsDataStructure: This function is called to create a new settings data structure.
getNumOfCylinders: This function is called to get the number of cylinders being used to render a
bent edge.
getCollisionOn: This function is called to see if collision detection is on or not.
getAxisOn: This function is called to see if the user wants the axis displayed or not.
changeCylinderNumber: This function is called to prompt the user for new number of cylinders
to be used and set it accordingly.
changeCollisionDetection: This function is called to prompt the user to toggle collision detection
and set it accordingly.
15
changeAxisDisplay: This function is called to prompt the user to toggle axis rendering and set it
accordingly.
updateNumOfCylinders: This function is called to change the number of cylinders being used to
render a bent edge.
updateCollisionOn: This function is called to toggle collision detection.
updateAxisOn: This function is called to toggle axis rendering.
l) Module Settings File Manager
Secret: File format used to store settings.
Service: The following interface is offered:
openSettings: This function is called to load settings from a settings file specified by the user into
the program.
saveSettings: This function is called to save the current settings into a settings file specified by
the user.
l) Module Main
Secret: The way the program is setup and run.
Service: The following interface is offered:
userInterface: This function is called to open a new view of the current view.
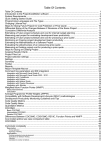
Figure (1) summarizes the different modules that compose the design. Modules that interact
with each other are connected with a straight line. A simplification was made so that the diagram is not cluttered with lines, module Main is supposed to be connected to the following modules:
-
Module
Module
Module
Module
Module
Module
Module
Module
Module
Module
Undo Data Structure
Graph Data Structure
Graph Manipulation
Graph File Manager
Draw Graph
View File Manager
View Data Structure
View Manipulation
Settings Data Structure
Settings File Manager
For further information on detailed design decisions, please refer to the documented source files.
16
Figure 1: Module Diagram
3
IMPLEMENTATION
The specifications of the system used to build the tool can be found in the high level design
section 1.3.
The programming language used to develop the tool is Haskell, the compiler used is GHC 6.2 with
HOpenGL enabled. Several references were used to learn Haskell in great depth [Hud00] [Dav92]
and to learn OpenGL [SWND03] [Len03] [Hil00].
Two additional packages were used: HaXml, a package to manipulate XML files from Haskell
which was used when dealing with GXL files and WxHaskell, a GUI development package which
was used for several purposes namely handling file dialogs and input dialogs.
Instructions to build the tool can be found in section A.1.
Implementation was done in teams of two, where Omar Halabieh and Tan Wern Sern formed one
team and Ning Liu and Lei Zhao formed the other.
In this project, no advanced algorithms or methods were used. This is because the focus
was on developing all the required functionalities, so no specific attention was given to a particular aspect where an advanced algorithm would be used to optimize the functionality in question.
For example, for collision detection, to detect collision between two nodes, we check the distance
between their two centers as they are spheres and compare it with the sum of the radius of each.
To detect collision for edges, we fill the cylindrical edge with spheres of small radius and treat the
collision similar to a node to node collision as done above.
Another example, is rendering bent edges. What is done here is that a bent edge is treated as a
series of smaller straight edges. So a bent edge is a sequence of straight edges connecting the two
nodes.
We will try to outline how we went about implementing the tool after the design was laid out.
Rather then using the prototype developed for the proof of concept as a throw away prototype,
we adapted the approach of an adaptive prototype. That is, we made the proof of concept the
starting point of implementation and carried on from there, adapting rather an iterative scheme
where by each iteration would add a new feature/functionality to the existing implementation.
Therefore we would test each functionality in isolation and only integrate it into the existing
implementation if it fulfilled its requirements [Khe03].
In addition, the issue tracking system, Scarab, was extensively used during this phase (Figure
(2)) to facilitate and document communication among the different team members and reporting issues relating to the functionality. A schedule was also maintained to make sure that
we were on track in regards to time management. A copy of the schedule is included in appendix D.
17
18
An important aspect of the project was the data structure used to hold the graph, this data
structure was developed by Jun Wu and supplied us with an interface to enable us to read
from/write to GXL files as well as to edit the data structure [Wu03]. We collaborated with Jun
to curtail the data structure interface to our needs in addition to the changes and additions we
made to the data structure ourselves.
The module/file association is as follows:
Module View File Manager is implemented by the file ViewFileManager.lhs
Module Settings File Manager is implemented by the file SettingsFileManager.lhs
Module Graph File Manager is implemented by the file GraphFileManager.lhs
Module Graph Manipulation is implemented by the following files: Node.lhs, NodeManipulation.lhs, EdgeManipulation.lhs, ItemManipulation.lhs and GraphManipulation.lhs
Module View Data Structure is implemented by the file: ViewDataStructure.lhs
Module View Manipulation is implemented by the file ViewManipulation.lhs
Module Settings Data Structure is implemented by the file SettingsDataStructure.lhs
Module Undo Data Structure is implemented by the file UndoDataStructure.lhs
Module Graph Interface is implemented by the file GraphInterface.lhs
Module Draw Graph is implemented by the file DrawGraph.lhs
Module Layout is implemented by the file Layout.lhs
Module Collision is implemented by the file Collision.lhs
Module Main is implemented by the file Main.lhs
The source code was written in a literate fashion and the literate code follows. The code has been
extensively documented with all the implementation details/decisions at both the module level
and the function level.
19
3.1
Literate Code
Module Collision, as the name indicates, provides us with functions to determine if there collision between objects
in the graph. The functions are named according to the user’s actions. Collision detection is implemented for the
following actions, adding node, bending edge, adding edge and moving node, hence the four appropriately named
functions in the interface. The secret of the module is that it hides how collision is detected between various objects
in the graph and what method is used to resolve a collision. The collision detection algorithms that are implemented
are not sophisticated ones but rather the straightforward obvious ones. Collision detection may not be efficient due
to this in the case of more than tens of nodes.
module Collision(addNodeCollision,bendEdgeCollision,newEdgeCollision, moveNodeCollision) where
import Text.XML.HaXml.Xml2Haskell
import Gxl_1_0_1_DTD
import GXL_DTD
import INIT
import Utils
import Interface
import Data.Set
import Data.FiniteMap
import Additional
import Data.IORef
import Graphics.Rendering.OpenGL.GL
import Graphics.Rendering.OpenGL.GLU
import Graphics.Rendering.OpenGL.GLU.Quadrics
import Graphics.UI.GLUT
import Graphics.UI.WX hiding (WxcTypes.Id,KeyUp,KeyDown,color,motion,WXCore.WxcTypes.Size,
Classes.position,Attributes.get)
import Graphics.UI.WXCore.Frame
import Node
import GxlGraphSetManage
import GxlGraphSetXml
import Text.XML.HaXml.OneOfN
import SettingsDataStructure
import GraphInterface
Here we define the default radius for adding new edges between nodes.
--Default new edge radius
defaultNewEdgeRadius = 0.3
The collision module is designed by exhausting the types of collisions that can happen in the graph. So in the graph
editor that we currently have, the possible objects for collision are nodes, straight edges and bent edges. Therefore
we classify each of the collision cases this way, node to node collision, bent edge to node collision, straight edge to
node collision, straight edge to straight edge collision, etc. As seen above in the interface, the functions supplied are
addNodeCollision, bendEdgeCollision, newEdgeCollision and moveNodeCollision. For each of them, there are several
types of collisions to be checked, for example, adding a node, we have to check node to node collision, node to straight
edge collision and node to bent edge collision. So all of this functions are implemented by smaller functions which we
will discuss below.
It is important to state that, all the methods used in this module just basically reduces a problem we have into
a problem of detecting collision between a node and a node. For example, in an edge, the edge is simulated by a
sequence of spheres(nodes) and then node to node collision is performed on it, similarly with bent edges.
20
Firstly we start with the simplest collision, which is node to node collision. The method of determining collision
here is just by calculating whether the distance between the nodes is smaller than the sum of their radiuses. If it is,
then we know collision has occurred.
For node to node collision, several possibilities of actions may cause it. Such as moving a node and adding a node.
Therefore we separated these two cases to be handled by two separate functions. Function nodeToNode does the
calculation of the collision detection and returns true if collision was detected, otherwise false. It takes in two node ids
and the position of the first node. The purpose of the node ids is so that we can get its radius through getItemRadius
and in the case of the second node, its position too. Once all the proper information is extracted about the nodes,
the distances are calculated and the result is returned as a boolean value. Note that if the two node id’s are the same,
it will return false and is handled seperately.
nodeToNode :: IORef GxlGraphSet -> Id -> Id ->Vector3 GLfloat -> IO (Prelude.Bool)
nodeToNode dataStructure nodeA nodeB newPosA = do
if (nodeA==nodeB)
then do return (False)
else do myNodeA <- getNode nodeA dataStructure
nodeARadius <- getItemRadius nodeA dataStructure
myNodeB <- getNode nodeB dataStructure
let nodeBLayout = extractLayout myNodeB
nodeBRadius <- getItemRadius nodeB dataStructure
return ((((realToFrac $ distance newPosA nodeBLayout)::GLdouble) < (nodeARadius + nodeBRadius)) )
-- The distance function that is used above to calculate the distance between two three dimensional coordinates
distance :: Vector3 GLfloat -> Vector3 GLfloat -> GLfloat
distance a b = sqrt( (xcoord a - xcoord b)^2 + (ycoord a - ycoord b)^2 + (zcoord a - zcoord b)^2)
The above function deals with one node collision with one node, if the user moves a node in a graph with 10 nodes,
we need to detect collision for the moved node with all the existing nodes. Therefore this function below serves this
purpose. nodeToNodeCollision takes in the graphset, the new node and the list of nodes in the graphset, and the
new position of the moved node. This function then recursively goes through all of the nodes in the list by checking
collision for each one of them with the moved node.
nodeToNodeCollision :: IORef GxlGraphSet -> Id -> [Id] -> Vector3 GLfloat -> IO (Prelude.Bool)
nodeToNodeCollision dataStructure myItem (x:xs) newPosA = do
result <- nodeToNode dataStructure myItem x newPosA
if (result==True)
then return(True)
else nodeToNodeCollision dataStructure myItem xs newPosA
nodeToNodeCollision _ _ _ _ = return (False)
However, moving a node is not the only way to get a node to node collision, addition of a node is also a problem.
Therefore a function is seperately done to take care of this case. The above function could be combined to handle both,
but for simplicity and easier understanding, seperate functions with appropriate names are used. newNodeToNode is
the function which handles collision of addition of new nodes. It is similar with the above case except that the posA
argument is the new position where the node is to be placed instead of where it is to be moved.
newNodeToNode :: IORef GxlGraphSet -> Id ->Vector3 GLfloat ->GLdouble -> IO (Prelude.Bool)
newNodeToNode dataStructure nodeB posA radiusA = do
myNodeB <- getNode nodeB dataStructure
let nodeBLayout = extractLayout myNodeB
nodeBRadius <- getItemRadius nodeB dataStructure
return ((((realToFrac $ distance posA nodeBLayout)::GLdouble) < (radiusA + nodeBRadius)) )
21
As in the moving node collision case, the below function compares all the nodes in the graph with the new added
node.
newNodeToNodeCollision :: IORef GxlGraphSet -> [Id] -> Vector3 GLfloat -> GLdouble -> IO (Prelude.Bool)
newNodeToNodeCollision dataStructure (x:xs) newPosA radius = do
result <- newNodeToNode dataStructure x newPosA radius
if (result==True)
then return(True)
else newNodeToNodeCollision dataStructure xs newPosA radius
newNodeToNodeCollision _ _ _ _ = return (False)
Now that node to node collisions are taken care of in both the moving node and adding node case, node with
straight edge collision is handled below. The method that is used to detect collision between nodes and straight edges
is by using the node to node collision. The straight edges are simulated by a sequence of nodes and this simplifies the
problem into a one node to many-node collision. As above, node to straight edge collisions can happen in two ways,
when the node is moved, when a node is added or when a straight edge is added.
Below is the case of a moved node with straight edge connected.
The nodeToStraightEdge function below does the collision detection by simulating a straight edge as a sequence
of connected nodes or spheres. The parameters a and a rad represents the node position and node radius currently
involved in the detection and b,c and edge rad represents the two nodes that form the edge with radius edge rad. By
getting the edge radius and the to and from nodes, we are able to construct a sequence of nodes from one end to
another for this detection.
nodeToStraightEdge :: Vector3 GLfloat -> GLdouble -> Vector3 GLfloat -> Vector3 GLfloat -> GLdouble -> Prelude.Bool
nodeToStraightEdge a a_rad b c edge_rad =
if (acos ((d1^2+d2^2-d3^2)/(2*d1*d2)) > ( pi/2 )) then
False
else if (acos ((d3^2+d2^2-d1^2)/(2*d3*d2)) > ( pi/2 )) then
False
else if ((realToFrac$sin(acos ((d1^2+d2^2-d3^2)/(2*d1*d2)))* d1:: GLdouble) > a_rad+edge_rad) then
False
else
True
where d1 = distance a b
d2 = distance b c
d3 = distance c a
Since the function above takes care of one simple case, the function below generalizes it to include all the edges
in the graph, nodeToStraightEdgeCollision takes in the list of edges, the node to be compared with, its position and
the graphset.
nodeToStraightEdgeCollision :: IORef GxlGraphSet -> Id -> [Id] -> Vector3 GLfloat -> IO (Prelude.Bool)
nodeToStraightEdgeCollision dataStructure myItem (x:xs) newPosA = do
myNodeA <- getNode myItem dataStructure
let nodeALayout = extractLayout myNodeA
nodeARadius <- getItemRadius myItem dataStructure
edgeRadius <- getItemRadius x dataStructure
myGraphSet <- readIORef dataStructure
let listOfGraphId = getGxlGraphs myGraphSet
--Get the position of the node connected on one end of the edge with edge id x.
let nodeB = to myGraphSet (head (listOfGraphId)) x
myNodeB <- getNode nodeB dataStructure
22
let nodeBLayout = extractLayout myNodeB
--Get the position of the node connected on the other end of the edge with edge id x.
let nodeC = from myGraphSet (head (listOfGraphId)) x
myNodeC <- getNode nodeC dataStructure
let nodeCLayout = extractLayout myNodeC
--Calculate the collision detection result
let result = nodeToStraightEdge nodeALayout nodeARadius nodeBLayout nodeCLayout edgeRadius
--If there was a collision and the node involved in the comparison isn’t connected to the edge
--then return true else continue with the next edge.
if ((result==True) && (myItem/=nodeB)&&(myItem/=nodeC))
then return(True)
else nodeToStraightEdgeCollision dataStructure myItem xs newPosA
nodeToStraightEdgeCollision _ _ _ _ = return (False)
Here the second case is handled, which is a new added node with straight edges. When a new node is added, this
function is called to detect if it is colliding with any straight edges in the graph. It is similar as the above, but again
for simplicity, two seperate functions are used for both of them.
newNodeToStraightEdgeCollision :: IORef GxlGraphSet -> [Id] -> Vector3 GLfloat -> GLdouble -> IO (Prelude.Bool)
newNodeToStraightEdgeCollision dataStructure (x:xs) newPosA radius = do
edgeRadius <- getItemRadius x dataStructure
myGraphSet <- readIORef dataStructure
let listOfGraphId = getGxlGraphs myGraphSet
let nodeB = to myGraphSet (head (listOfGraphId)) x
let nodeC = from myGraphSet (head (listOfGraphId)) x
myNodeB <- getNode nodeB dataStructure
let nodeBLayout = extractLayout myNodeB
myNodeC <- getNode nodeC dataStructure
let nodeCLayout = extractLayout myNodeC
let result = nodeToStraightEdge newPosA radius nodeBLayout nodeCLayout edgeRadius
if (result==True)
then return(True)
else newNodeToStraightEdgeCollision dataStructure xs newPosA radius
newNodeToStraightEdgeCollision _ _ _ _ = return (False)
Now that nodes to straight edge collision is taken care of, the next step is to resolve straight edge to straight edge
collisions. This collision only occurs in two cases, when a straight edge is added or when a node with a straight edge
connected to it is moved. There are again, handled by two different functions, one is sedgeTosedgeCollision which
is for the case of movement of a node with a connected edge, and the other is newEdgeCollision which is explained
further on. The method of detecting collision for straight edge to straight edge is similar to node to straight edge. So
the below function takes in two edge id’s and the new position of the node newPosA is the new position of the node
with a straight edge connected to it, myNode is the node id of the node that is currently being moved. sedgeTosedge
is called in the below function for the actual calculation of detection between two edges.
sedgeTosedgeHandler:: IORef GxlGraphSet -> Vector3 GLfloat -> Id ->Id ->Prelude.Int -> Id -> IO(Prelude.Bool)
sedgeTosedgeHandler dataStructure newPosA edgeId1 edgeId2 step myNode = do
Acquire the radiuses of the 2 edges.
23
edgeRadius1 <- getItemRadius edgeId1 dataStructure
edgeRadius2 <- getItemRadius edgeId2 dataStructure
Get the ’to’ node or target node of edge with edgeId1 which is the edge that is connected to the node that is currently
being moved.
myGraphSet <- readIORef dataStructure
let listOfGraphId = getGxlGraphs myGraphSet
let nodeA = to myGraphSet (head (listOfGraphId)) edgeId1
There are two possibilities if a node is moved and we are checking for straight edge to straight edge collision. Whether
the node that is moved is the node that is the source of the edge or is the target of the edge. If the node the is moved
is the target of the edge, then it is handled in this if block, otherwise it is handled in the else block.
if (myNode==nodeA)
then do let nodeB = from myGraphSet (head (listOfGraphId)) edgeId1
let nodeC = to myGraphSet (head (listOfGraphId)) edgeId2
let nodeD = from myGraphSet (head (listOfGraphId)) edgeId2
myNodeB <- getNode nodeB dataStructure
let nodeBLayout = extractLayout myNodeB
myNodeC <- getNode nodeC dataStructure
let nodeCLayout = extractLayout myNodeC
myNodeD <- getNode nodeD dataStructure
let nodeDLayout = extractLayout myNodeD
let result = sedgeTosedge newPosA nodeBLayout edgeRadius1 nodeCLayout nodeDLayout edgeRadius2 step
return(result)
else do
This section is similar to the above except that nodeB now is the target node instead of the source node.
let nodeB = to myGraphSet (head (listOfGraphId)) edgeId1
let nodeC = to myGraphSet (head (listOfGraphId)) edgeId2
let nodeD = from myGraphSet (head (listOfGraphId)) edgeId2
myNodeB <- getNode nodeB dataStructure
let nodeBLayout = extractLayout myNodeB
myNodeC <- getNode nodeC dataStructure
let nodeCLayout = extractLayout myNodeC
myNodeD <- getNode nodeD dataStructure
let nodeDLayout = extractLayout myNodeD
let result = sedgeTosedge newPosA nodeBLayout edgeRadius1 nodeCLayout nodeDLayout edgeRadius2 step
return(result)
Notice that it calls the nodeToStraightEdge function, it simulates the edge fo be compared with with a sequence
of nodes, and then reduces it to be problem of straight edge to node collision. The function below calculates the
collision detection by simulating an edge with a series of spheres and calling nodeToStraightEdge. Step is how many
spheres would be fitted from one end of the edge to another. The sedgeToEdge function below does all the calculation
of collision between two individual edges. It recursively calculates collision between one of the nodes fitted into the
edge with the edge involved in the movement of the node until it exhausts all of the nodes fitted to simulate the edge.
If none reports a collision, then no collision is detected.
sedgeTosedge :: Vector3 GLfloat -> Vector3 GLfloat -> GLdouble ->Vector3 GLfloat ->Vector3 GLfloat -> GLdouble
-> Prelude.Int -> Prelude.Bool
sedgeTosedge a b rad1 c d rad2 0
= nodeToStraightEdge b rad1 c d rad2
sedgeTosedge a b rad1 c d rad2 step
= (nodeToStraightEdge a rad1 c d rad2) || (sedgeTosedge (Vector3 x y z) b rad1 c d rad2 (step-1))
24
where x= xcoord a +((xcoord b - xcoord a)/(fromIntegral step))
y= ycoord a +((ycoord b - ycoord a)/(fromIntegral step))
z= zcoord a +((zcoord b - zcoord a)/(fromIntegral step))
The function below is the main function which utilizes the sedgeTosedgeHandler above. It is noted that 100 is
the default step size, which is how many spheres are used to simulate a straight edge. This function is called with an
edge, which is the edge that is moving, or the edge that is new, the position of on of the nodes that it is connected
to(newPosA) and the list of edges in the graph.
sedgeTosedgeCollision :: IORef GxlGraphSet -> Id -> [Id] -> Vector3 GLfloat -> Id ->
sedgeTosedgeCollision dataStructure myEdge (x:xs) newPosA myNode= do
result <- sedgeTosedgeHandler dataStructure newPosA myEdge x 100 myNode
IO (Prelude.Bool)
if ((result==True) && (myEdge/=x))
then return(True)
else sedgeTosedgeCollision dataStructure myEdge xs newPosA myNode
sedgeTosedgeCollision _ _ _ _ _ = return (False)
Now that straight edge to straight edge collision is handled for the case of moving a node. The case of adding a new
edge is handled below. This function compares a list of edges in the graph and the added edge. newEdgeToEdgeCollision takes in the source node and target node for the new edge, the list of edges already existing in the graph and
determines if a collision would occur if the new edge is added.
newEdgeToEdgeCollision :: IORef GxlGraphSet -> [GXL_DTD.Id] -> Id -> Id -> Prelude.Int
-> IORef SettingsDataStructure -> IO(Prelude.Bool)
newEdgeToEdgeCollision dataStructure (x:xs) sourceNode targetNode step settings = do
myGraphSet <- readIORef dataStructure
let listOfGraphId = getGxlGraphs myGraphSet
source <- getNode sourceNode dataStructure
target <- getNode targetNode dataStructure
-- Get number of cylinders
mySettings <- readIORef settings
myNumOfCylindersIORef <- getNumOfCylinders mySettings
myNumOfCylinders <- readIORef myNumOfCylindersIORef
-- Get the layout of the edge to be added
let sourceLayout = extractLayout source
let targetLayout = extractLayout target
--- Get the layout of one of the edge in the list of edges
let fromNode = from myGraphSet (head (listOfGraphId)) x
let toNode = to myGraphSet (head (listOfGraphId)) x
myFromNode <- getNode fromNode dataStructure
myToNode <- getNode toNode dataStructure
let fromNodeLayout = extractLayout myFromNode
let toNodeLayout = extractLayout myToNode
(bentEdges,straightEdges) <- getListOfSeperateEdges dataStructure (x:xs) ([],[])
-- Get the midPoint of one of the edge in the list of edges
midPointVertex <- getEdgeMidPoint x myGraphSet
let midPoint = vertexToVector midPointVertex
edgeRadius <- getItemRadius x dataStructure
Since we are extracting the source node and target node information for each edge in the list of edges already
existing, when comparing all the edges of the graph with the new edge, we must dismiss the case where the source
node or target node of the new edge is compared to itself or to its opposite.
25
if ( (sourceNode/=fromNode) && (targetNode/=fromNode) && (sourceNode/=toNode) && (targetNode/=toNode) )
then
Since this function handles the addition of new edge collision in a general way, it will compare the added edge
with all the existing edges in the graph whether straight or bent. If the edge compared to is bent, then sedgeTobedge
will be called to do this. This function will be discussed later in the collisions involving bent edges section. If the
edge compared to is not bent, then the function explained above sedgeTosedge is used.
if (isMember x bentEdges)
then do let result = sedgeTobedge sourceLayout targetLayout (defaultNewEdgeRadius) fromNodeLayout midPoint
toNodeLayout edgeRadius myNumOfCylinders
if (result==True)
then return(True)
else newEdgeToEdgeCollision dataStructure (xs) sourceNode targetNode step settings
else do let result = sedgeTosedge fromNodeLayout toNodeLayout edgeRadius sourceLayout targetLayout
(defaultNewEdgeRadius) step
if (result==True)
then return(True)
else newEdgeToEdgeCollision dataStructure (xs) sourceNode targetNode step settings
else newEdgeToEdgeCollision dataStructure (xs) sourceNode targetNode step settings
newEdgeToEdgeCollision dataStructure [] sourceNode targetNode step settings = return(False)
When a new edge is added, it needs to be checked against all the nodes in the graph and all the edges in the graph,
from above edge to edge collision is done for addition of new edges, in the function below, it will detect if collision
will occur against nodes upon addition of the new edge. It calls the nodeToStraightEdge function from above which
we defined to compare each node in the list of nodes in the graph with the new edge. If the new edge fails collision
detection, it will not be added.
newEdgeToNodeCollision :: IORef GxlGraphSet -> [GXL_DTD.Id] -> Id -> Id -> IORef SettingsDataStructure
-> IO(Prelude.Bool)
newEdgeToNodeCollision dataStructure (x:xs) sourceNode targetNode settings = do
source <- getNode sourceNode dataStructure
target <- getNode targetNode dataStructure
currentNode <- getNode x dataStructure
let sourceLayout = extractLayout source
let targetLayout = extractLayout target
let currentNodeLayout = extractLayout currentNode
currentNodeRadius <- getItemRadius x dataStructure
Here the actual collision checking is done by calling nodeToStraightEdge. If there is a collision and the nodes that
were checked against were not the edge’s own nodes, then return true, else continue checking with the rest of the
nodes in the graph.
let result = nodeToStraightEdge currentNodeLayout currentNodeRadius sourceLayout targetLayout
(defaultNewEdgeRadius)
if ((result==True) && (x/=sourceNode) && (x/=targetNode))
then return(True)
else newEdgeToNodeCollision dataStructure xs sourceNode targetNode settings
newEdgeToNodeCollision dataStructure [] sourceNode targetNode settings = return (False)
26
The below function is the main function for checking collision of addition of new edges, it joins the previous edge
collision functions into one main function which is called whenever an edge is to be added.
newEdgeCollision::IORef GxlGraphSet -> [ GXL_DTD.Id] -> [GXL_DTD.Id] -> Id -> Id -> Prelude.Int
-> IORef SettingsDataStructure -> IO(Prelude.Bool)
newEdgeCollision dataStructure myListOfNodes myListOfEdges sourceNode targetNode step settings = do
mySettings <- readIORef settings
myNumOfCylindersIORef <- getNumOfCylinders mySettings
myNumOfCylinders <- readIORef myNumOfCylindersIORef
result1 <- newEdgeToNodeCollision dataStructure myListOfNodes sourceNode targetNode settings
result2 <- newEdgeToEdgeCollision dataStructure myListOfEdges sourceNode targetNode step settings
return(result1||result2)
Addition of new nodes must also be handled in the same fashion, compare the new node with the other nodes in
the graph, compare the new node with all the straight edges in the graph and compare the new node with all the
bent edges in the graph. If none of these fail collision detection, then there is no collision. From above, node to node
and node to straight edge collisions are already done. Below defines the collision detection for addition of new nodes
against bent edges in the graph.
newNodeToBentEdgeCollision :: IORef GxlGraphSet -> [Id] -> Vector3 GLfloat -> GLdouble
-> Prelude.Int -> IO (Prelude.Bool)
newNodeToBentEdgeCollision dataStructure (x:xs) newPosA radius numOfCylinders = do
myGraphSet <- readIORef dataStructure
edgeRadius <- getItemRadius x dataStructure
midPointVertex <- getEdgeMidPoint x myGraphSet
let midPoint = vertexToVector midPointVertex
myGraphSet <- readIORef dataStructure
let listOfGraphId = getGxlGraphs myGraphSet
let nodeB = to myGraphSet (head (listOfGraphId)) x
let nodeC = from myGraphSet (head (listOfGraphId)) x
myNodeB <- getNode nodeB dataStructure
let nodeBLayout = extractLayout myNodeB
myNodeC <- getNode nodeC dataStructure
let nodeCLayout = extractLayout myNodeC
Actual collision detection is done here by the function nodeToBentEdge which takes in a node, which in this case
is the node to be added and the bent edge’s information.
let result = nodeToBentEdge newPosA radius nodeBLayout midPoint nodeCLayout edgeRadius numOfCylinders
if (result==True)
then return(True)
else newNodeToBentEdgeCollision dataStructure xs newPosA radius numOfCylinders
newNodeToBentEdgeCollision _ _ _ _ _ = return (False)
Finally to merge it all together, all the checks are done at once in one function called addNodeCollision as defined
below. If one of the tests fail, then collision is concluded to have occured for the addition of that node.
27
addNodeCollision::IORef GxlGraphSet -> [GXL_DTD.Id] -> [GXL_DTD.Id] -> Vector3 GLfloat -> GLdouble
->IORef SettingsDataStructure -> IO(Prelude.Bool)
addNodeCollision dataStructure myListOfNodes myListOfEdges newNodeLayout defaultRadius settings = do
seperatedList is a tuple of bent edge ids and straight edge ids, it helps seperate the bent edges and straight edges so
the collision functions would be more efficient. For example, when node to straight edge collision is needed to be used,
we can reduce the comparisons done on the edges on the graph to only the straight edges, instead of going through
every edge in the graph. Therefore, node to straight edge collision uses the second component of seperatedList which
is the list straight edges and node to bent edge collision uses the first component of seperatedList which is the list
bent edges.
seperatedList <- getListOfSeperateEdges dataStructure myListOfEdges ([],[])
result1 <- newNodeToNodeCollision dataStructure myListOfNodes newNodeLayout defaultRadius
result2 <- newNodeToStraightEdgeCollision dataStructure (snd(seperatedList)) newNodeLayout defaultRadius
mySettings <- readIORef settings
myNumOfCylindersIORef <- getNumOfCylinders mySettings
myNumOfCylinders <- readIORef myNumOfCylindersIORef
result3 <- newNodeToBentEdgeCollision dataStructure (fst(seperatedList)) newNodeLayout
defaultRadius myNumOfCylinders
return((result1||result2||result3))
For moving a node, it is possible to move a node and collide with a bent edge, from above, the cases where it
collides with a straight edge or a node is handled, the function below outlines the method used to detect collision
between a node and a bent edge in the case of node movement. The deepest part of the calculation of the collision
detection for nodes against bent edges will be discussed here. Here is where the method of determining whether
collision occurs for nodes against bent edges. Basically, a bent edge is a bunch of straight edges drawn through an
interpolated curve through some mid point. So the idea to detect if collision occured between a node and a bent edge
is by simulating the bent edge by a sequence of spheres through the curve and comparing each sphere with the node.
The number of spheres used to simulate the bent edge is same as the number of cylinders used to draw the edge.
Below is the function which does this generally, it takes in one node and compares it with all the bent edges in the
graph.
nodeToBentEdgeCollision :: IORef GxlGraphSet -> Id -> [Id] -> Vector3 GLfloat -> Prelude.Int -> IO (Prelude.Bool)
nodeToBentEdgeCollision dataStructure myItem (x:xs) newPosA numOfCylinders = do
myGraphSet <- readIORef dataStructure
myNodeA <- getNode myItem dataStructure
let nodeALayout = extractLayout myNodeA
nodeARadius <- getItemRadius myItem dataStructure
edgeRadius <- getItemRadius x dataStructure
midPointVertex <- getEdgeMidPoint x myGraphSet
let midPoint = vertexToVector midPointVertex
myGraphSet <- readIORef dataStructure
let listOfGraphId = getGxlGraphs myGraphSet
let nodeB = to myGraphSet (head (listOfGraphId)) x
let nodeC = from myGraphSet (head (listOfGraphId)) x
myNodeB <- getNode nodeB dataStructure
let nodeBLayout = extractLayout myNodeB
myNodeC <- getNode nodeC dataStructure
let nodeCLayout = extractLayout myNodeC
28
nodeToBentEdge is the function of importance here, it will be discussed after, it does what was stated above to a
node and an edge. If a collision was detected, and the edges we are comparing with are not associated with the node
that is currently being moved, then it can be concluded that collision did occur.
let result = nodeToBentEdge newPosA nodeARadius nodeBLayout midPoint nodeCLayout edgeRadius numOfCylinders
if ((result==True) && (myItem/=nodeB)&&(myItem/=nodeC))
then return(True)
else nodeToBentEdgeCollision dataStructure myItem xs newPosA numOfCylinders
nodeToBentEdgeCollision _ _ _ _ _ = return (False)
getListOfSeperateEdges:: IORef GxlGraphSet -> [Id] -> ([Id],[Id]) -> IO(([Id],[Id]))
getListOfSeperateEdges dataStructure (x:xs) (bentEdges,straightEdges) = do
myGraphSet <- readIORef dataStructure
midPointVertex <- getEdgeMidPoint x myGraphSet
if (midPointVertex /= defaultNoMidPoint )
then getListOfSeperateEdges dataStructure xs ((x:bentEdges),(straightEdges))
else getListOfSeperateEdges dataStructure xs ((bentEdges),(x:straightEdges))
getListOfSeperateEdges dataStructure [] result = return result
The inner workings of the node to bent edge collision mechanism is defined below. fx, fy and fz are the interpolation
functions. interp applies these functions to the coordinates desired.
fx :: Vector3 GLfloat -> Vector3 GLfloat -> Vector3 GLfloat -> GLfloat -> GLfloat
fx a b c t = (1.0-t)^2*(xcoord a) + 2.0*t*(1.0-t)*(xcoord b) + t^2 * (xcoord c)
fy :: Vector3 GLfloat -> Vector3 GLfloat -> Vector3 GLfloat -> GLfloat -> GLfloat
fy a b c t = (1.0-t)^2*(ycoord a) + 2.0*t*(1.0-t)*(ycoord b) + t^2 * (ycoord c)
fz :: Vector3 GLfloat -> Vector3 GLfloat -> Vector3 GLfloat -> GLfloat -> GLfloat
fz a b c t = (1.0-t)^2*(zcoord a) + 2.0*t*(1.0-t)*(zcoord b) + t^2 * (zcoord c)
interp :: (Vector3 GLfloat -> Vector3 GLfloat -> Vector3 GLfloat -> GLfloat -> GLfloat) -> Vector3 GLfloat
-> Vector3 GLfloat -> Vector3 GLfloat -> [GLfloat] -> [GLfloat]
interp f a b c list = map (f a b c) list
nodeToBentEdge is the main function which takes in the list of coordinates needed to interpolate and applies
detection1 to it. detection1 function is same as the function which draws the bent edge by interpolation, only in this
case, a sphere is simulated instead of a cylinder and nodeToStraightEdge is called each time against the node that is
being moved for the collision detection.
nodeToBentEdge :: Vector3 GLfloat -> GLdouble -> Vector3 GLfloat -> Vector3 GLfloat -> Vector3 GLfloat
-> GLdouble -> Prelude.Int ->Prelude.Bool
nodeToBentEdge a a_rad c d e e_rad numOfCylinders =
detection1 a a_rad xlist ylist zlist e_rad
where xlist = interp fx c d e (tFunction numOfCylinders)
ylist = interp fy c d e (tFunction numOfCylinders)
zlist = interp fz c d e (tFunction numOfCylinders)
detection1 :: Vector3 GLfloat -> GLdouble -> [GLfloat] -> [GLfloat] -> [GLfloat] -> GLdouble -> Prelude.Bool
29
detection1 node node_rad [] [] [] _ = False
detection1 node node_rad (x1:[]) (y1:[]) (z1:[]) _ = False
detection1 node node_rad (x1:x2:xlist) (y1:y2:ylist) (z1:z2:zlist) edge_rad =
((nodeToStraightEdge node node_rad (Vector3 x1 y1 z1) (Vector3 x2 y2 z2) edge_rad)
|| (detection1 node node_rad (x2:xlist) (y2:ylist) (z2:zlist) edge_rad))
When moving a node, the edge connected to it may also move, therefore collision is checked on the edges of that
node. edgeLoop does exactly that, it compares every edge with every other edge in the graph for collision. This
function seperates the list of edges into straight edges and bent edges, and calls the four appropriate functions with
them depending on whether its comparing bent edge to bent edge, bent edge to straight edge, straight edge to bent
edge and straight edge to straight edge.
edgeLoop :: IORef GxlGraphSet -> Id -> [Id] -> ([Id],[Id]) -> Vector3 GLfloat
-> Prelude.Int -> IO (Prelude.Bool)
edgeLoop dataStructure myNode edgeList edgePairList newPosA numOfCylinders= do
edgesConnected <- getEdgesConnected dataStructure myNode (edgeList) []
seperatedList <- getListOfSeperateEdges dataStructure edgesConnected ([],[])
-- Compare bent to bent
result4 <- bentEdgeToBentEdgeRecursion dataStructure (fst edgePairList) (fst seperatedList) newPosA
numOfCylinders myNode
-- Compare bent to straight
result3 <- bentEdgeTosedgeRecursion dataStructure (snd edgePairList) (fst seperatedList) newPosA
numOfCylinders myNode
-- Compare straight to bent
result2 <- sedgeToBentEdgeRecursion dataStructure (snd seperatedList) (fst edgePairList) newPosA
numOfCylinders myNode
-- Compare sTraight to straight
result <- sedgeTosEdgeRecursion dataStructure (snd seperatedList) (snd edgePairList) newPosA
myNode
return (result||result2||result3||result4)
The function below, sedgeToBentEdgeRecursion recursively goes through all the straight edges and calls sedgeTobedgeCollision on each of them with the list of bent edges in the graph. This is called specifically by edgeLoop for when a node
is moved. This compares all the straight edges in the graph with all the bent edges in the graph to see if collision has
occured.
sedgeToBentEdgeRecursion :: IORef GxlGraphSet -> [Id] -> [Id] -> Vector3 GLfloat -> Prelude.Int
-> Id -> IO (Prelude.Bool)
sedgeToBentEdgeRecursion dataStructure (x:xs) edgeList newPosA numOfCylinders myNode = do
value <- sedgeTobedgeCollision dataStructure x edgeList newPosA numOfCylinders myNode
if (value==True) then return(True)
else sedgeToBentEdgeRecursion dataStructure xs edgeList newPosA numOfCylinders myNode
sedgeToBentEdgeRecursion dataStructure [] edgeList newPosA numOfCylinders myNode = return(False)
The function sedgeTobedgeCollision used above to compare the straight edge with a list of bent edges is defined
below. It calls the handler defined above for the individual one edge to one edge comparison, while it recursively goes
through the list of bent edges.
sedgeTobedgeCollision :: IORef GxlGraphSet -> Id -> [Id] -> Vector3 GLfloat ->
-> Id -> IO (Prelude.Bool)
Prelude.Int
30
sedgeTobedgeCollision dataStructure myEdge (x:xs) newPosA numOfCylinders myNode = do
result <- sedgeTobedgeHandler dataStructure newPosA myEdge x numOfCylinders myNode
if ((result==True) && (myEdge/=x))
then return(True)
else sedgeTobedgeCollision dataStructure myEdge xs newPosA numOfCylinders myNode
sedgeTobedgeCollision _ _ _ _ _ _ = return (False)
bentEdgeTosedgeRecursion recursively goes through all the bent edges and calls bentEdgeTosedgeCollision on
each of them with the list of straight edges in the graph.
bentEdgeTosedgeRecursion :: IORef GxlGraphSet -> [Id] -> [Id] -> Vector3 GLfloat -> Prelude.Int
-> Id -> IO (Prelude.Bool)
bentEdgeTosedgeRecursion dataStructure (x:xs) edgeList newPosA numOfCylinders myNode = do
value <- bentEdgeTosedgeCollision dataStructure x edgeList newPosA numOfCylinders myNode
if (value==True) then return(True)
else bentEdgeTosedgeRecursion dataStructure xs edgeList newPosA numOfCylinders myNode
bentEdgeTosedgeRecursion dataStructure [] edgeList newPosA numOfCylinders myNode = return(False)
Here we explain the bentEdgeTosedgeCollision function. This takes in one bent edge and the list of straight edges,
and recursively goes through all of the straight edges and determines if the bent edge collides with any of them. This
is done through calling the bedgeTosedgeHandler which compares one bent edge to one straight edge.
bentEdgeTosedgeCollision :: IORef GxlGraphSet -> Id -> [Id] -> Vector3 GLfloat -> Prelude.Int
-> Id -> IO (Prelude.Bool)
bentEdgeTosedgeCollision dataStructure myEdge (x:xs) newPosA numOfCylinders myNode = do
result <- bedgeTosedgeHandler dataStructure newPosA myEdge x numOfCylinders myNode
if ((result==True) && (myEdge/=x))
then return(True)
else bentEdgeTosedgeCollision dataStructure myEdge xs newPosA numOfCylinders myNode
bentEdgeTosedgeCollision _ _ _ _ _ _ = return (False)
bentEdgeToBentEdgeRecursion recursively goes through all the bent edges in the graph and calls bentEdgeToBentEdgeCollision on it. Which then calls the bentEdgeToBendEdgeToHandler function which compares specfically
one bent edge to another one bent edge.
bentEdgeToBentEdgeRecursion :: IORef GxlGraphSet -> [Id] -> [Id] -> Vector3 GLfloat -> Prelude.Int
-> Id -> IO (Prelude.Bool)
bentEdgeToBentEdgeRecursion dataStructure (x:xs) edgeList newPosA numOfCylinders myNode = do
value <- bentEdgeToBentEdgeCollision dataStructure x edgeList newPosA numOfCylinders myNode
if (value==True) then return(True)
else bentEdgeToBentEdgeRecursion dataStructure xs edgeList newPosA numOfCylinders myNode
bentEdgeToBentEdgeRecursion dataStructure [] edgeList newPosA numOfCylinders myNode = return (False)
sedgeTosEdgeRecursion performs similarly as above, it goes through all the straight edges in the graph and for
each straight edge, it calls sedgeTosedgeCollision with on it together with the list of all straight edges in the graph.
31
sedgeTosEdgeRecursion :: IORef GxlGraphSet -> [Id] -> [Id] -> Vector3 GLfloat -> Id -> IO (Prelude.Bool)
sedgeTosEdgeRecursion dataStructure (x:xs) edgeList newPosA myNode = do
value <- sedgeTosedgeCollision dataStructure x edgeList newPosA myNode
if (value==True) then return(True)
else sedgeTosEdgeRecursion dataStructure xs edgeList newPosA myNode
sedgeTosEdgeRecursion dataStructure [] edgeList newPosA myNode = return(False)
This function is used by edgeLoop to acquire the list of bent edges and straight edges and seperate them in a
tuple of lists. The first component of the tuple represents the bent edges while the second component represents the
straight edges.
getEdgesConnected :: IORef GxlGraphSet -> GXL_DTD.Id -> [ItemId] -> [ItemId] -> IO([ItemId])
getEdgesConnected currentGraphSet id (edge:edges) result = do
myGraphSet <- readIORef currentGraphSet
let listOfGraphId = getGxlGraphs myGraphSet
if ( (to myGraphSet (head (listOfGraphId)) edge==id) || (from myGraphSet (head (listOfGraphId)) edge==id) )
then do getEdgesConnected currentGraphSet id edges (edge:result)
else do getEdgesConnected currentGraphSet id edges result
getEdgesConnected currentGraphSet id []
result
= return (result)
Now that all the needed functions for node movement collision are properly defined, it can all be merge and used
in one main function, defined below. When moving a node, all types of collision can happen. Below is the function
which put all of the functions we have implemented above to its real use. When a node is moved(myNode), 4 checks
are done on it, which is if it is colliding with another node, a straight edge, a bent edge or its own edge colliding with
any other object in the graph(edgeLoop). The names that are used explain the type of collision they are handling
clearly and therefore need not be explained further. If any one of these detections fail, this function will return false,
therefore signifying a collision for the movement of the node.
moveNodeCollision dataStructure myListOfNodes myListOfEdges myNode newNodeLayout settings = do
seperatedList <- getListOfSeperateEdges dataStructure myListOfEdges ([],[])
mySettings <- readIORef settings
myNumOfCylindersIORef <- getNumOfCylinders mySettings
myNumOfCylinders <- readIORef myNumOfCylindersIORef
result1 <- nodeToStraightEdgeCollision dataStructure myNode (snd(seperatedList)) newNodeLayout
result2 <- nodeToNodeCollision dataStructure myNode myListOfNodes newNodeLayout
result3 <- edgeLoop dataStructure myNode myListOfEdges seperatedList newNodeLayout myNumOfCylinders
result4 <- nodeToBentEdgeCollision dataStructure myNode (fst(seperatedList)) newNodeLayout myNumOfCylinders
return((result1||result2||result3||result4))
Collision detection for addition of nodes, addition of edges and movement of nodes are already done. One major
part that is left in the collision module is when the user bends an edge. When the user bends an edge, the bended
edge must be checked against all the nodes and edges (other than itself) in the graph. Starting from the simplest case,
bent edge against other nodes, we will explain how all these cases are merged in the end for a bending edge collision
function. Below we define the function bentEdgeToNodeCollision which handles collision detection for edges that are
bent and nodes. It takes in a list of nodes in the graph, and a bent edge, and reports whether a collision has occured
between them or not. The important function in it is nodeToBentEdge, which was defined and explained above.
32
bentEdgeToNodeCollision :: IORef GxlGraphSet -> [Id] -> Id -> Vertex3 GLfloat
-> IORef SettingsDataStructure -> IO(Prelude.Bool)
bentEdgeToNodeCollision dataStructure (x:xs) edgeId newMidPoint settings = do
myGraphSet <- readIORef dataStructure
let listOfGraphId = getGxlGraphs myGraphSet
mySettings <- readIORef settings
myNumOfCylindersIORef <- getNumOfCylinders mySettings
myNumOfCylinders <- readIORef myNumOfCylindersIORef
-- Retrieve the layout of source and target nodes for the bent edge
let fromNode = from myGraphSet (head (listOfGraphId)) edgeId
let toNode = to myGraphSet (head (listOfGraphId)) edgeId
myFromNode <- getNode fromNode dataStructure
myToNode <- getNode toNode dataStructure
let fromNodeLayout = extractLayout myFromNode
let toNodeLayout = extractLayout myToNode
-- Retrive the layout of current node
currentNode <- getNode x dataStructure
let currentNodeLayout = extractLayout currentNode
-- Retrieve Current node’s radius that is to be compared with
nodeRadius <- getItemRadius x dataStructure
-- Retrieve the bent edge’s radius
edgeRadius <- getItemRadius edgeId dataStructure
-- Convert future edge midpoint to vector
let midPoint = vertexToVector newMidPoint
let result = nodeToBentEdge currentNodeLayout nodeRadius fromNodeLayout midPoint toNodeLayout edgeRadius
myNumOfCylinders
if ((result==True) && (x/=fromNode) && (x/=toNode) )
then return(True)
else bentEdgeToNodeCollision dataStructure (xs) edgeId newMidPoint settings
bentEdgeToNodeCollision dataStructure [] edgeId newMidPoint settings = return (False)
Below, we define bentEdgeToStraightEdgeCollision, the function which handles collision detection between the
bended edge and the straight edges in the graph. It takes in the new mid point which is specified by the mouse in
the user’s bending edge action, the edge id of the edge the user is bending and the list of straight edges in the graph.
bentEdgeToStraightEdgeCollision :: IORef GxlGraphSet -> [Id] -> Prelude.Int -> Id -> Vertex3 GLfloat
-> IORef SettingsDataStructure -> IO(Prelude.Bool)
bentEdgeToStraightEdgeCollision dataStructure (x:xs) step myItem newMidPoint settings = do
myGraphSet <- readIORef dataStructure
let listOfGraphId = getGxlGraphs myGraphSet
mySettings <- readIORef settings
myNumOfCylindersIORef <- getNumOfCylinders mySettings
myNumOfCylinders <- readIORef myNumOfCylindersIORef
-- Retrieve the layout of source and target nodes for the bent edge
let fromNode = from myGraphSet (head (listOfGraphId)) myItem
let toNode = to myGraphSet (head (listOfGraphId)) myItem
myFromNode <- getNode fromNode dataStructure
myToNode <- getNode toNode dataStructure
let fromNodeLayout = extractLayout myFromNode
let toNodeLayout = extractLayout myToNode
33
-- Retrieve the layout of source and target nodes for the bent edge
let currentFromNode = from myGraphSet (head (listOfGraphId)) x
let currentToNode = to myGraphSet (head (listOfGraphId)) x
myCurrentFromNode <- getNode currentFromNode dataStructure
myCurrentToNode <- getNode currentToNode dataStructure
let fromCurrentNodeLayout = extractLayout myCurrentFromNode
let toCurrentNodeLayout = extractLayout myCurrentToNode
currentEdgeRadius <- getItemRadius x dataStructure
bentEdgeRadius <- getItemRadius myItem dataStructure
let midPoint = vertexToVector newMidPoint
sedgeTobedge is the core function in which the bent edge is as mentioned above, seperated into a curve of sequence
of spheres which then simplifies the problem to straight edge to straight edge collision.
let result = sedgeTobedge fromCurrentNodeLayout toCurrentNodeLayout currentEdgeRadius fromNodeLayout midPoint
toNodeLayout bentEdgeRadius myNumOfCylinders
putStrLn(show result)
if ( (result==True) && (x/=myItem) )
then return (True)
else bentEdgeToStraightEdgeCollision dataStructure xs step myItem newMidPoint settings
bentEdgeToStraightEdgeCollision dataStructure [] step myItem newMidpoint settings = return (False)
sedgeTobedgeCollision :: IORef GxlGraphSet -> Id -> [Id] -> Vector3 GLfloat -> Prelude.Int
-> Id -> IO (Prelude.Bool)
sedgeTobedgeCollision dataStructure myEdge (x:xs) newPosA numOfCylinders myNode = do
result <- sedgeTobedgeHandler dataStructure newPosA myEdge x numOfCylinders myNode
if ((result==True) && (myEdge/=x))
then return(True)
else sedgeTobedgeCollision dataStructure myEdge xs newPosA numOfCylinders myNode
sedgeTobedgeCollision _ _ _ _ _ _ = return (False)
sedgeTobedge is defined below. It works together with detection2, similarly as detection1. sedgeTobedge gets
the list of points to interpolate across and detection2 does the collision detection at each step of the interpolation.
This time sedgeTosedge is called. sedgeTosedge is a function which in turn, simulates the straight edge into sequence
of spheres and checks them together. The whole method of collision detection used here is just by simplifying the
problem into straight edge to node collision.
detection2 :: Vector3 GLfloat -> Vector3 GLfloat -> GLdouble -> [GLfloat] -> [GLfloat] -> [GLfloat]
-> GLdouble -> Prelude.Int -> Prelude.Bool
detection2 n1 n2 s_rad [] [] [] _ _ = False
detection2 n1 n2 s_rad (x1:[]) (y1:[]) (z1:[]) _ _ = False
detection2 n1 n2 s_rad (x1:x2:xlist) (y1:y2:ylist) (z1:z2:zlist) b_rad numOfCylinders=
((sedgeTosedge n1 n2 s_rad (Vector3 x1 y1 z1) (Vector3 x2 y2 z2) b_rad numOfCylinders)
|| (detection2 n1 n2 s_rad (x2:xlist) (y2:ylist) (z2:zlist) b_rad numOfCylinders))
sedgeTobedge :: Vector3 GLfloat -> Vector3 GLfloat -> GLdouble -> Vector3 GLfloat
34
-> Vector3 GLfloat -> Vector3 GLfloat -> GLdouble -> Prelude.Int -> Prelude.Bool
sedgeTobedge n1 n2 s_rad n3 n4 n5 b_rad numOfCylinders=
detection2 n1 n2 s_rad xlist ylist zlist b_rad numOfCylinders
where xlist = interp fx n3 n4 n5 (tFunction numOfCylinders)
ylist = interp fy n3 n4 n5 (tFunction numOfCylinders)
zlist = interp fz n3 n4 n5 (tFunction numOfCylinders)
While bending an edge, it may also collide with another bent edge, a similar approach is used, simulate both bent
edges by a sequence of spheres and then perform collision detection on every sphere on the first edge with every sphere
on the second edge. This function below takes in a list of bent edge ids and one bent edge, and determines if that
bent edge is causing a collision on the graph. bentToBentToEdgeHandler is the main function for bent edge to bent
edge comparison.
bentEdgeToBentEdgeCollision :: IORef GxlGraphSet -> Id -> [Id] -> Vector3 GLfloat -> Prelude.Int
-> Id -> IO (Prelude.Bool)
bentEdgeToBentEdgeCollision dataStructure myEdge (x:xs) newPosA numOfCylinders myNode = do
result <- bedgeToBentToEdgeHandler dataStructure newPosA myEdge x numOfCylinders myNode
if ((result==True) && (myEdge/=x))
then return(True)
else bentEdgeToBentEdgeCollision dataStructure myEdge xs newPosA numOfCylinders myNode
bentEdgeToBentEdgeCollision _ _ _ _ _ _ = return (False)
The above function handles all the list of edges, the below function is what is used to compare one bent edge to
another bent edge in the case of bending an edge. It calls the last deepest function which does the interpolation and
simulates the bent edges with sequence of spheres.
bedgeToBentToEdgeHandler:: IORef GxlGraphSet -> Vector3 GLfloat -> Id ->Id ->Prelude.Int
-> Id -> IO(Prelude.Bool)
bedgeToBentToEdgeHandler dataStructure newPosA edgeId1 edgeId2 numOfCylinders myNode = do
edgeRadius1 <- getItemRadius edgeId1 dataStructure
edgeRadius2 <- getItemRadius edgeId2 dataStructure
myGraphSet <- readIORef dataStructure
let listOfGraphId = getGxlGraphs myGraphSet
let nodeA = to myGraphSet (head (listOfGraphId)) edgeId1
There is two cases if a node is moved and a bent edge is connected to it, if the node that is moved has the bent
edge going towards it, the block of if statement below handles the case, if it is not that the else block does it. These
two cases have to be handled seperately because the arguments on the bedgeTobedge function will be of different
order of arrangement depending on what is changing.
if (myNode==nodeA)
then do
let nodeB = from myGraphSet (head (listOfGraphId)) edgeId1
let nodeC = to myGraphSet (head (listOfGraphId)) edgeId2
let nodeD = from myGraphSet (head (listOfGraphId)) edgeId2
myGraphSet <- readIORef dataStructure
midPointVertexEdge1 <- getEdgeMidPoint edgeId1 myGraphSet
midPointVertexEdge2 <- getEdgeMidPoint edgeId2 myGraphSet
let midPointEdge1 = vertexToVector midPointVertexEdge1
let midPointEdge2 = vertexToVector midPointVertexEdge2
35
myNodeB <- getNode nodeB dataStructure
let nodeBLayout = extractLayout myNodeB
myNodeC <- getNode nodeC dataStructure
let nodeCLayout = extractLayout myNodeC
myNodeD <- getNode nodeD dataStructure
let nodeDLayout = extractLayout myNodeD
let result = bedgeTobedge nodeBLayout midPointEdge1 newPosA edgeRadius1 nodeDLayout midPointEdge2
nodeCLayout edgeRadius2 numOfCylinders
return(result)
else do let nodeB = to myGraphSet (head (listOfGraphId)) edgeId1
let nodeC = to myGraphSet (head (listOfGraphId)) edgeId2
let nodeD = from myGraphSet (head (listOfGraphId)) edgeId2
myGraphSet <- readIORef dataStructure
midPointVertexEdge1 <- getEdgeMidPoint edgeId1 myGraphSet
midPointVertexEdge2 <- getEdgeMidPoint edgeId2 myGraphSet
let midPointEdge1 = vertexToVector midPointVertexEdge1
let midPointEdge2 = vertexToVector midPointVertexEdge2
myNodeB <- getNode nodeB dataStructure
let nodeBLayout = extractLayout myNodeB
myNodeC <- getNode nodeC dataStructure
let nodeCLayout = extractLayout myNodeC
myNodeD <- getNode nodeD dataStructure
let nodeDLayout = extractLayout myNodeD
let result = bedgeTobedge newPosA midPointEdge1 nodeBLayout edgeRadius1 nodeDLayout midPointEdge2
nodeCLayout edgeRadius2 numOfCylinders
return(result)
This is the function which puts it all together, when an edge is bent, these three functions are called in this main
function to check if the bent edge actually caused a collision or not.
bendEdgeCollision:: IORef GxlGraphSet -> [Id] -> [Id] -> Id -> Vertex3 GLfloat
-> IORef SettingsDataStructure -> IO(Prelude.Bool)
bendEdgeCollision dataStructure myListOfNodes myListOfEdges myItem newLayoutAttribute settings = do
mySettings <- readIORef settings
result1 <- bentEdgeToNodeCollision dataStructure myListOfNodes myItem newLayoutAttribute settings
result2 <- bentEdgeToStraightEdgeCollision dataStructure myListOfEdges 100 myItem newLayoutAttribute settings
result3 <- bentEdgeToBentEdgeCollision dataStructure myListOfEdges step myItem settings
return (result1||result2||result3)
This is the function which reduces the problem of collision between bent edges and bent edges to straight edges
and bent edges. Similarly as with the other cases, the bent edge is simulated as a bunch of straight edges through an
interpolated curve, and each of these straight edges are checked for collision using the sedgeTobedge function.
detection3 :: [GLfloat] -> [GLfloat] -> [GLfloat] -> GLdouble -> Vector3 GLfloat -> Vector3 GLfloat
-> Vector3 GLfloat -> GLdouble -> Prelude.Int -> Prelude.Bool
detection3 (a1:[]) (b1:[]) (c1:[]) _ _ _ _ _ _ = False
detection3 [] [] [] _ _ _ _ _ _ = False
detection3 (a1:a2:alist) (b1:b2:blist) (c1:c2:clist) b1_rad n1 n2 n3 b2_rad numOfCylinders =
((sedgeTobedge (Vector3 a1 b1 c1) (Vector3 a2 b2 c2) b1_rad n1 n2 n3 b2_rad numOfCylinders)
|| (detection3 (a2:alist) (b2:blist) (c2:clist) b1_rad n1 n2 n3 b2_rad numOfCylinders))
36
bedgeTobedge n1 n2 n3 b1_rad n4 n5 n6 b2_rad numOfCylinders =
detection3 xlist ylist zlist b1_rad n4 n5 n6 b2_rad numOfCylinders
where xlist = interp fx n1 n2 n3 (tFunction numOfCylinders)
ylist = interp fy n1 n2 n3 (tFunction numOfCylinders)
zlist = interp fz n1 n2 n3 (tFunction numOfCylinders)
tFunction :: Prelude.Int -> [GLfloat]
tFunction numOfCylinders = [fromIntegral i/fromIntegral numOfCylinders | i<-[0..numOfCylinders]]
Function bendEdgeCollision function below is the main function which determines if collision occured while bending
an edge. The edge id is recorded in the argument ’myItem’ and the functions explained above are merged together
into this one. It checks if the bent edge collided with a node,a straight edge or another bent edge. If anyone of these
checks fail (collision occurred), then it will return true for collision detected.
bendEdgeCollision:: IORef GxlGraphSet -> [Id] -> [Id] -> Id -> Vertex3 GLfloat
-> IORef SettingsDataStructure -> IO(Prelude.Bool)
bendEdgeCollision dataStructure myListOfNodes myListOfEdges myItem newLayoutAttribute settings = do
mySettings <- readIORef settings
result1 <- bentEdgeToNodeCollision dataStructure myListOfNodes myItem newLayoutAttribute settings
result2 <- bentEdgeToStraightEdgeCollision dataStructure myListOfEdges 100 myItem newLayoutAttribute settings
result3 <- bentEdgeToBentEdgeCollision dataStructure myListOfEdges step myItem settings
return (result1||result2||result3)
The two big functions below are the functions which compares a bent edge with a straight edge for collision and
a straight edge with a bent edge for collision. Two seperate functions were needed for this as sedgeTobedge takes in
different arrangement of arguments depending on which edge is changing according to which node is currently being
moved.
bedgeTosedgeHandler:: IORef GxlGraphSet -> Vector3 GLfloat -> Id ->Id ->Prelude.Int -> Id -> IO(Prelude.Bool)
bedgeTosedgeHandler dataStructure newPosA edgeId1 edgeId2 numOfCylinders myNode = do
edgeRadius1 <- getItemRadius edgeId1 dataStructure
edgeRadius2 <- getItemRadius edgeId2 dataStructure
myGraphSet <- readIORef dataStructure
let listOfGraphId = getGxlGraphs myGraphSet
let nodeA = to myGraphSet (head (listOfGraphId)) edgeId2
When the node being moved is the target node of the bent edge that is connected to that node, then sedgeTobedge
again, takes in a different arrangement of arguments. Anything that is changing is on the right side of the sedgeTobedge
function. Therefore if the current node that is being moved is nodeA, then the position of nodeA will be in the 6th
argument of the sedgeTobedge function. Otherwise, the current node that is being moved is nodeB which means that
the position of nodeB will be in the 6th argument now.
if (myNode==nodeA)
then do let nodeB = from myGraphSet (head (listOfGraphId)) edgeId2
let nodeC = to myGraphSet (head (listOfGraphId)) edgeId1
let nodeD = from myGraphSet (head (listOfGraphId)) edgeId1
myGraphSet <- readIORef dataStructure
midPointVertex <- getEdgeMidPoint edgeId2 myGraphSet
37
let midPoint = vertexToVector midPointVertex
myNodeB <- getNode nodeB dataStructure
let nodeBLayout = extractLayout myNodeB
myNodeC <- getNode nodeC dataStructure
let nodeCLayout = extractLayout myNodeC
myNodeD <- getNode nodeD dataStructure
let nodeDLayout = extractLayout myNodeD
let result = sedgeTobedge nodeCLayout nodeDLayout edgeRadius1 nodeBLayout midPoint newPosA
edgeRadius2 numOfCylinders
return(result)
else do let nodeB = to myGraphSet (head (listOfGraphId)) edgeId2
let nodeC = to myGraphSet (head (listOfGraphId)) edgeId1
let nodeD = from myGraphSet (head (listOfGraphId)) edgeId1
myGraphSet <- readIORef dataStructure
midPointVertex <- getEdgeMidPoint edgeId2 myGraphSet
let midPoint = vertexToVector midPointVertex
myNodeB <- getNode nodeB dataStructure
let nodeBLayout = extractLayout myNodeB
myNodeC <- getNode nodeC dataStructure
let nodeCLayout = extractLayout myNodeC
myNodeD <- getNode nodeD dataStructure
let nodeDLayout = extractLayout myNodeD
let result = sedgeTobedge nodeCLayout nodeDLayout edgeRadius1 newPosA midPoint nodeBLayout
edgeRadius2 numOfCylinders
return(result)
Similarly as above, the reason we have so many cases and if statements is because which node that is changing or
moving is important to the sedgeTobedge function. Notice the different order of the arguments from the above. This
function functions the same as above except for different arrangement of arguments.
sedgeTobedgeHandler:: IORef GxlGraphSet -> Vector3 GLfloat -> Id ->Id ->Prelude.Int -> Id -> IO(Prelude.Bool)
sedgeTobedgeHandler dataStructure newPosA edgeId1 edgeId2 numOfCylinders myNode = do
edgeRadius1 <- getItemRadius edgeId1 dataStructure
edgeRadius2 <- getItemRadius edgeId2 dataStructure
myGraphSet <- readIORef dataStructure
let listOfGraphId = getGxlGraphs myGraphSet
let nodeA = to myGraphSet (head (listOfGraphId)) edgeId1
if (myNode==nodeA)
then do let nodeB = from myGraphSet (head (listOfGraphId)) edgeId1
let nodeC = to myGraphSet (head (listOfGraphId)) edgeId2
let nodeD = from myGraphSet (head (listOfGraphId)) edgeId2
myGraphSet <- readIORef dataStructure
midPointVertex <- getEdgeMidPoint edgeId2 myGraphSet
let midPoint = vertexToVector midPointVertex
myNodeB <- getNode nodeB dataStructure
let nodeBLayout = extractLayout myNodeB
myNodeC <- getNode nodeC dataStructure
let nodeCLayout = extractLayout myNodeC
myNodeD <- getNode nodeD dataStructure
let nodeDLayout = extractLayout myNodeD
let result = sedgeTobedge newPosA nodeBLayout edgeRadius1 nodeCLayout midPoint nodeDLayout
edgeRadius2 numOfCylinders
return(result)
38
else do let nodeB = to myGraphSet (head (listOfGraphId)) edgeId1
let nodeC = to myGraphSet (head (listOfGraphId)) edgeId2
let nodeD = from myGraphSet (head (listOfGraphId)) edgeId2
myGraphSet <- readIORef dataStructure
midPointVertex <- getEdgeMidPoint edgeId2 myGraphSet
let midPoint = vertexToVector midPointVertex
myNodeB <- getNode nodeB dataStructure
let nodeBLayout = extractLayout myNodeB
myNodeC <- getNode nodeC dataStructure
let nodeCLayout = extractLayout myNodeC
myNodeD <- getNode nodeD dataStructure
let nodeDLayout = extractLayout myNodeD
let result = sedgeTobedge newPosA nodeBLayout edgeRadius1 nodeCLayout midPoint nodeDLayout
edgeRadius2 numOfCylinders
return(result)
These are utility functions and default values/attributes for the new nodes that are to be added.
xcoord :: Vector3 a -> a
xcoord (Vector3 a b c) = a
ycoord :: Vector3 a -> a
ycoord (Vector3 a b c) = b
zcoord :: Vector3 a -> a
zcoord (Vector3 a b c) = c
isMember :: Id -> [Id] -> Prelude.Bool
isMember x (y:ys) = (x==y) && isMember x ys
isMember x []
= False
vertexToVector (Vertex3 a b c ) = ( Vector3 a b c )
xe sci Ptg module DrawEdge provides a function to render the edges of the graph. The secret this module hides is
the way this is achieved. The basic concept is that we go through the list of edges and render them one by one. There
are 4 types of edges in this case. Directed both bent and straight and also undirected both bent and stright. Some
design decisions to be noted are that:
1- A bent edge is represented by several straight edges, where the number of those can be adjusted by the user
depending on the tradeoff between speed of rendering and quality.
2- A directed edge is represented by an edge that decreases in radius as we go from the source to the target.
module DrawEdge (edgeDrawLoop) where
import
import
import
import
import
import
System.Exit ( exitWith, ExitCode(ExitSuccess) )
Graphics.UI.GLUT
System.Exit(exitWith, ExitCode(ExitSuccess), exitFailure)
LabelDisplay
GraphInterface
Gxl_1_0_1_DTD
39
import GXL_DTD
import Data.IORef ( IORef, newIORef, readIORef, modifyIORef, writeIORef)
import SettingsDataStructure
type Label = String
Here we define some color constants that we will be using when we draw the edge.
diffuseColor::Color4 GLfloat
diffuseColor = Color4 0.1 0.5 0.8 1.0
specularColor::Color4 GLfloat
specularColor = Color4 1.0 1.0 1.0 1.0
shininess::GLfloat
shininess = 50.0
emisionColor::Color4 GLfloat
emisionColor = Color4 0.0 0.0 0.0 1.0
A bent edge is draw as a number of straight edges. The number of straight edges used is determined by step and
what tFunction returns is the positions of those straight edges along the bent edge
tFunction :: Prelude.Int -> [GLfloat]
tFunction step = [fromIntegral i/fromIntegral step | i<-[0..step]]
edgeDrawLoop is a function which given a graph set and the list of edges forming that graph set will loop through all
the edges in the list and draw them. So the way the function works is by first getting an edge from the list , extract
its color, label, quadric style and the two nodes it connects and possibly the control point. If the control point is not
there a straight edge is drawn otherwise a bent edge is drawn. Each edge is assigned an ID on the name stack before
its drawn. This process is done for every edge in the list, recursively, until we go thorugh all the list.
edgeDrawLoop :: IORef GxlGraphSet -> [GXL_DTD.Id] -> IORef SettingsDataStructure -> IO()
edgeDrawLoop dataStructure (x:xs) settings = do
myGraphSet <- readIORef dataStructure
myColor <- getItemColor4 x dataStructure
myQuadricStyle <- getEdgeQuadricStyle x dataStructure
myLabel <- getItemLabel x dataStructure
myRadius <- getItemRadius x dataStructure
mySlices <- getItemSlices x dataStructure
myStacks <- getItemStacks x dataStructure
myGraphSet <- readIORef dataStructure
mySettings <- readIORef settings
myNum <- getNumOfCylinders mySettings
step <- readIORef (myNum)
p1 <- getFromNode x myGraphSet
p2 <- getEdgeMidPoint x myGraphSet
p3 <- getToNode x myGraphSet
40
loadName (Name (read (show x)::GLuint))
--straight edge case
if (p2==defaultNoMidPoint)
then do
isEdgeDirected<-getDirectedOrNot x myGraphSet
if (isEdgeDirected==True)
--straight directed Edge
then do drawStraightDirectedEdge (xcoord p1) (ycoord p1) (zcoord p1) (xcoord p3) (ycoord p3)
(zcoord p3) myQuadricStyle myLabel myColor myRadius
mySlices myStacks
--straight undirected Edge
else do drawUndirectedEdge (xcoord p1) (ycoord p1) (zcoord p1) (xcoord p3) (ycoord p3) (zcoord p3)
myQuadricStyle myLabel myColor myRadius
mySlices myStacks
edgeDrawLoop dataStructure xs settings
--bent edge
else do
isEdgeDirected<-getDirectedOrNot x myGraphSet
if (isEdgeDirected==True)
--bent directed edge
then do drawDirectedBentEdge p1 p2 p3 (tFunction step) myQuadricStyle myLabel myColor
myRadius mySlices myStacks settings
--bent undirected edge
else do drawUndirectedBentEdge p1 p2 p3 (tFunction step) myQuadricStyle myLabel myColor myRadius
mySlices myStacks settings
edgeDrawLoop dataStructure xs settings
edgeDrawLoop dataStructure _ _ = do
return ()
decrease is a function which will help us to compute the radius of the directed edge which decreases as we go along
from the source to the target.
decrease :: Prelude.Int -> GLdouble -> GLdouble
decrease step = \r -> (r - r/fromIntegral step)
Here are three functions which return the x-coordinate, the y-coordinate and the z-coordinate of a Vertex respectively.
xcoord::Vertex3 a -> a
xcoord (Vertex3 a b c) = a
ycoord::Vertex3 a -> a
ycoord (Vertex3 a b c) = b
zcoord::Vertex3 a -> a
zcoord (Vertex3 a b c) = c
fx,fy,fz are the three components of the interpolation function, which will give us the points we will pass the edge
through. Three points will be given p1,p2,p3 where they represent the center of the source node, the center of the
target node and the control point.
fx :: (Vertex3 GLfloat) -> (Vertex3 GLfloat) -> (Vertex3 GLfloat) -> GLfloat -> GLfloat
fx p1 p2 p3 t = (1.0-t)**2*(xcoord p1) + 2.0*t*(1.0-t)*(xcoord p2) + t**2 * (xcoord p3)
41
fy :: (Vertex3 GLfloat) -> (Vertex3 GLfloat) -> (Vertex3 GLfloat) -> GLfloat -> GLfloat
fy p1 p2 p3 t = (1.0-t)**2*(ycoord p1) + 2.0*t*(1.0-t)*(ycoord p2) + t**2 * (ycoord p3)
fz :: (Vertex3 GLfloat) -> (Vertex3 GLfloat) -> (Vertex3 GLfloat) -> GLfloat -> GLfloat
fz p1 p2 p3 t = (1.0-t)**2*(zcoord p1) + 2.0*t*(1.0-t)*(zcoord p2) + t**2 * (zcoord p3)
interp is a function which maps the a set of points into their correspondent interpolation.
interp :: ((Vertex3 GLfloat) -> (Vertex3 GLfloat) -> (Vertex3 GLfloat) -> GLfloat -> GLfloat) -> (Vertex3 GLfloat)
-> (Vertex3 GLfloat) -> (Vertex3 GLfloat) -> [GLfloat] -> [GLfloat]
interp f p1 p2 p3 list = map (f p1 p2 p3) list
checkForError is a function used in order to handle errors caused by render quadric.
checkForError :: IO (Maybe Error) -> IO ()
checkForError action = do
maybeError <- action
case maybeError of
Nothing -> return ()
Just (Error _category description) -> do exitFailure
drawStraightDirectedEdge is a function which given the coordinates of the centers of two nodes will draw a straight
directed edge between them. This is used when want to draw one edge only. drawDirectedEdge will be used when we
want to draw several of them to form a bent edge.
drawStraightDirectedEdge :: GLfloat ->GLfloat ->GLfloat ->GLfloat ->GLfloat ->GLfloat ->QuadricStyle -> Label
-> Color4 GLfloat -> GLdouble->GLint ->GLint -> IO()
drawStraightDirectedEdge x1 y1 z1 x2 y2 z2 myQuadricStyle myLabel myColor myRadius mySlices myStacks= do
preservingMatrix $ do
--move to the source node
translate (Vector3 x1 y1 z1 :: Vector3 GLfloat)
rotate (angle :: GLfloat) (Vector3 rx ry 0)
--set the color
materialAmbient
Front $= myColor
materialDiffuse
Front $= diffuseColor
materialSpecular Front $= specularColor
materialShininess Front $= shininess
materialEmission Front $= emisionColor
--draw the directed edge with a decreasing radius from source to target
checkForError $renderQuadric myQuadricStyle
(Cylinder myRadius (myRadius/2) ((realToFrac length)::GLdouble) mySlices myStacks)
swapBuffers
where rx
= (y1-y2)
ry
= (x2-x1)
length= sqrt((x2-x1)**2+(y2-y1)**2 +(z2-z1)**2)
angle = (180.0/pi)*acos((z2-z1)/(sqrt((x2-x1)**2+(y2-y1)**2 +(z2-z1)**2)))
drawDirectedEdge is a function which given the coordinates of two points will draw a straight directed edge between
them. This is used when want to draw a bent edge as we will call it recursively. Each time we go through we decrease
the radius to make it look like its going from one node to another.
42
drawDirectedEdge :: GLfloat ->GLfloat ->GLfloat ->GLfloat ->GLfloat ->GLfloat ->QuadricStyle -> Label
-> Color4 GLfloat -> GLdouble ->GLint ->GLint -> IORef SettingsDataStructure -> IO()
drawDirectedEdge x1 y1 z1 x2 y2 z2 myQuadricStyle myLabel myColor myRadius mySlices myStacks settings= do
preservingMatrix $ do
--move to the source point
translate (Vector3 x1 y1 z1 :: Vector3 GLfloat)
rotate (angle :: GLfloat) (Vector3 rx ry 0)
mySettings <- readIORef settings
myNum <- getNumOfCylinders mySettings
step <- readIORef (myNum)
--set the color
materialAmbient
Front $= myColor
materialDiffuse
Front $= diffuseColor
materialSpecular Front $= specularColor
materialShininess Front $= shininess
materialEmission Front $= emisionColor
--draw the directed edge with a decreasing radius from source to target
checkForError $renderQuadric myQuadricStyle
(Cylinder myRadius (myRadius-myRadius/fromIntegral step) ((realToFrac length)::GLdouble) mySlic
swapBuffers
where rx
=
ry
=
length=
angle =
(y1-y2)
(x2-x1)
sqrt((x2-x1)^2+(y2-y1)^2 +(z2-z1)^2)
(180.0/pi)*acos((z2-z1)/(sqrt((x2-x1)^2+(y2-y1)^2 +(z2-z1)^2)))
drawUnDirectedEdge is a function which given the coordinates of any two points in space will draw a straight
undirected edge between them. Here the radius is the same all the way through since it is undirected.
drawUndirectedEdge :: GLfloat ->GLfloat ->GLfloat ->GLfloat ->GLfloat ->GLfloat -> QuadricStyle -> Label
-> Color4 GLfloat -> GLdouble ->GLint ->GLint ->IO()
drawUndirectedEdge x1 y1 z1 x2 y2 z2 myQuadricStyle myLabel myColor myRadius mySlices myStacks = do
preservingMatrix $ do
--move to the source point
translate (Vector3 x1 y1 z1 :: Vector3 GLfloat)
rotate (angle :: GLfloat) (Vector3 rx ry 0)
--set the color
materialAmbient
Front $= myColor
materialDiffuse
Front $= diffuseColor
materialSpecular Front $= specularColor
materialShininess Front $= shininess
materialEmission Front $= emisionColor
--draw the undirected edge with a constant radius from source to target
checkForError $renderQuadric myQuadricStyle
(Cylinder myRadius myRadius ((realToFrac length)::GLdouble) mySlices myStacks)
swapBuffers
where rx
= (y1-y2)
ry
= (x2-x1)
length= sqrt((x2-x1)**2+(y2-y1)**2 +(z2-z1)**2)
angle = (180.0/pi)*acos((z2-z1)/(sqrt((x2-x1)**2+(y2-y1)**2 +(z2-z1)**2)))
43
getknotDirected is the function which goes throught the intermediate points of a bent directed edge and calls the
drawing function to render smaller straight edges between those points. This is done recursivily until we go through
all the intermediate points we have. As mentionned before the radius decreases as we go along and the number of
cylinders used is controlled by the user.//
getknotDirected :: [GLfloat] -> [GLfloat] -> [GLfloat] -> QuadricStyle -> Label -> Color4 GLfloat
-> GLdouble ->GLint ->GLint -> IORef SettingsDataStructure -> IO()
getknotDirected [] [] [] _ _ _ _ _ _ _
= return()
getknotDirected (x:[]) (y:[]) (z:[]) _ _ _ _ _ _ _
= return()
getknotDirected (x1:x2:x) (y1:y2:y) (z1:z2:z) myQuadricStyle myLabel myColor myRadius mySlices myStacks settings = do
mySettings <- readIORef settings
myNum <- getNumOfCylinders mySettings
step <- readIORef (myNum)
drawDirectedEdge x1 y1 z1 x2 y2 z2 myQuadricStyle myLabel myColor myRadius mySlices myStacks settings
getknotDirected (x2:x) (y2:y) (z2:z) myQuadricStyle myLabel myColor (decrease step myRadius) mySlices myStacks
getknotUnDirected is the function which goes throught the intermediate points of a bent undirected edge and calls the
drawing function to render smaller straight edges between those points. This is done recursivily until we go through
all the intermediate points we have. As mentionned before the radius here does not change as we go along and the
number of cylinders used is controlled by the user.//
getknotUndirected :: [GLfloat] -> [GLfloat] -> [GLfloat] -> QuadricStyle -> Label -> Color4 GLfloat
-> GLdouble ->GLint ->GLint -> IO()
getknotUndirected [] [] [] _ _ _ _ _ _
= return()
getknotUndirected (x:[]) (y:[]) (z:[]) _ _ _ _ _ _
= return()
getknotUndirected (x1:x2:x) (y1:y2:y) (z1:z2:z) myQuadricStyle myLabel myColor myRadius mySlices myStacks = do
drawUndirectedEdge x1 y1 z1 x2 y2 z2 myQuadricStyle myLabel myColor myRadius mySlices myStacks
getknotUndirected (x2:x) (y2:y) (z2:z) myQuadricStyle myLabel myColor myRadius mySlices myStacks
drawDirectedBentEdge is the top level function which coordinates the process of rendering a directed bent edge, by
calling the functions mentionned above. The Label is displayed and then control is passed on to the rest of the
functions.
drawDirectedBentEdge :: (Vertex3 GLfloat) -> (Vertex3 GLfloat) -> (Vertex3 GLfloat) -> [GLfloat]
->QuadricStyle -> Label -> Color4 GLfloat-> GLdouble ->GLint -> GLint
-> IORef SettingsDataStructure -> IO()
drawDirectedBentEdge p1 p2 p3 t myQuadricStyle myLabel myColor myRadius mySlices myStacks settings = do
--clear the color
clearColor $= Color4 0 0.0 0.0 0.0
--display the label
fontOffset <- makeRasterFont
let myVector = vertexToVector p2
translate myVector
glRasterPos2s (0) (0)
printString fontOffset myLabel
--go back to original position
translate (reverseTranslate myVector)
--get the number of cyliders to be used
mySettings <- readIORef settings
44
myNum <- getNumOfCylinders mySettings
step <- readIORef (myNum)
--interpolate and draw
let xlist = interp fx p1 p2 p3 (tFunction step)
let ylist = interp fy p1 p2 p3 (tFunction step)
let zlist = interp fz p1 p2 p3 ((tFunction step)::[GLfloat])
getknotDirected xlist ylist zlist myQuadricStyle myLabel myColor myRadius mySlices myStacks settings
drawUnDirectedBentEdge is the top level function which coordinates the process of rendering an undirected bent
edge, by calling the functions mentionned above. The Label is displayed and then control is passed on to the rest of
the functions.
drawUndirectedBentEdge :: (Vertex3 GLfloat) -> (Vertex3 GLfloat) -> (Vertex3 GLfloat) -> [GLfloat]
->QuadricStyle -> Label -> Color4 GLfloat-> GLdouble ->GLint -> GLint
-> IORef SettingsDataStructure -> IO()
drawUndirectedBentEdge p1 p2 p3 t myQuadricStyle myLabel myColor myRadius mySlices myStacks settings = do
--clear the color
clearColor $= Color4 0 0.0 0.0 0.0
--display the label
fontOffset <- makeRasterFont
let myVector = vertexToVector p2
translate myVector
glRasterPos2s (0) (0)
printString fontOffset myLabel
--go back to original position
translate (reverseTranslate myVector)
mySettings <- readIORef settings
myNum <- getNumOfCylinders mySettings
step <- readIORef (myNum)
--interpolate and draw
let xlist = interp fx p1 p2 p3 (tFunction step)
let ylist = interp fy p1 p2 p3 (tFunction step)
let zlist = interp fz p1 p2 p3 (tFunction step)
getknotUndirected xlist ylist zlist myQuadricStyle myLabel myColor myRadius mySlices myStacks
vertextoVector is a function which gives us the vector corresponding to the vertex we pas to it.
vertexToVector :: (Vertex3 GLfloat) -> (Vector3 GLfloat)
vertexToVector (Vertex3 a b c) = Vector3 a b c
reverseTranslate is a function which gives us the vector opposite in direction to the one we pass to it.
reverseTranslate :: (Vector3 GLfloat) -> (Vector3 GLfloat)
reverseTranslate (Vector3 x y z) = (Vector3 (-x) (-y) (-z))
Module DrawGraph, as the name indicates, gives us functions and facilities to draw a given graph. The secret it hides
is how the graph is drawn.
module DrawGraph (displayGraph)
import Data.IORef
import IO
where
( IORef, newIORef, readIORef, modifyIORef, writeIORef)
45
import
import
import
import
import
import
import
import
import
import
import
import
import
import
import
import
Graphics.Rendering.OpenGL.GL
Graphics.Rendering.OpenGL.GLU
Graphics.UI.GLUT
System.Exit(exitWith, ExitCode(ExitSuccess), exitFailure)
Node
LabelDisplay
GraphInterface
Gxl_1_0_1_DTD
GXL_DTD
ViewDataStructure
GxlGraphSetManage
Data.FiniteMap
Text.XML.HaXml.OneOfN
DrawEdge
DrawNode
SettingsDataStructure
displayGraph is a function which given a view and a graphSet it displays that graph from that particular view. This
is achieved in the following manner, first the color buffer and the depth buffer are cleared, the background color is
set to black and the view is loaded by setting the corresponding horizontal component, vertical component and the
camera distance. After this is done, the graph is displayed. The transformations done to change the view are saved
so that we can go back to the original coordinate system when it is necessary to do so. Since when we rotate the view
the axis are changed.
displayGraph ::IORef View -> IORef GxlGraphSet -> IORef [GLdouble] -> IORef SettingsDataStructure -> DisplayCallback
displayGraph view dataStructure matrixStore settings = do
clear [ColorBuffer, DepthBuffer]
color (Color3 1.0 1.0 1.0 :: Color3 GLfloat)
myView <- readIORef view
preservingMatrix $ do
let depth = getCameraDistance myView
--rotate the view vertically
let v = getVertical myView
rotate ((read (show v))::Prelude.Float) (Vector3 1 0 0)
--rotate the view horizontally
let h = getHorizontal myView
rotate ((read (show h))::Prelude.Float) (Vector3 0 1 0)
--get the current transformation matrix
m1@(mvMatrix::(GLmatrix GLdouble)) <- get currentMatrix
component <- getMatrixComponents ColumnMajor m1
--zoom the view according to old coordinate system
newVector <- transformVector (Vector3 0.0 0.0 depth) component
translate newVector
--update the transformation matrix
m1@(mvMatrix::(GLmatrix GLdouble)) <- get currentMatrix
component <- getMatrixComponents ColumnMajor m1
--save the transformation matrix
modifyIORef matrixStore (\x -> component)
--draw the gaph
drawGraph dataStructure matrixStore settings
swapBuffers
drawGraph is a function which coordinates the drawing of the graph from a given graph set. Basically, it reads the
graph set and extracts the list of nodes and the list of edges and appropriately calls the drawing functions for nodes
46
and edges.It also displays the x, y and z axis if this option is toggled on.
drawGraph :: IORef GxlGraphSet -> IORef [GLdouble] -> IORef SettingsDataStructure -> IO()
drawGraph dataStructure matrixStore settings = do
myGraphSet <- readIORef dataStructure
--get the list of nodes and draw them
myNodeList <- getListOfNodes myGraphSet
nodeDrawLoop dataStructure myNodeList
--get the list of edges and draw them
myEdgeList <- getListOfEdges myGraphSet
edgeDrawLoop dataStructure myEdgeList settings
--draw and label the different axis if the display axis is toggled on
mySettings <- readIORef settings
myAxisOnIORef <- getAxisOn mySettings
myAxisOn <- readIORef myAxisOnIORef
if (myAxisOn == True)
then do fontOffset <- makeRasterFont
translate (Vector3 (5) 0.2 0.0 :: Vector3 GLfloat)
glRasterPos2s 0 0
printString fontOffset "X-AXIS"
translate (Vector3 (-5) (-0.2) 0.0 :: Vector3 GLfloat)
renderPrimitive Lines $ do
vertex3f(Vertex3 (-10) 0 0)
vertex3f(Vertex3 10 0 0)
fontOffset <- makeRasterFont
translate (Vector3 0.2 (5) 0.0 :: Vector3 GLfloat)
glRasterPos2s 0 0
printString fontOffset "Y-AXIS"
translate (Vector3 (-0.2) (-5) 0.0 :: Vector3 GLfloat)
renderPrimitive Lines $ do
vertex3f(Vertex3 0 (-10) 0)
vertex3f(Vertex3 0 10 0)
fontOffset <- makeRasterFont
translate (Vector3 0.0 0.2 (5) :: Vector3 GLfloat)
glRasterPos2s 0 0
printString fontOffset "Z-AXIS"
translate (Vector3 0.0 (-0.2) (-5) :: Vector3 GLfloat)
renderPrimitive Lines $ do
vertex3f(Vertex3 0 0 (-10))
vertex3f(Vertex3 0 0 10)
return()
else do return()
--vertex3f is an auxilliaury function to gives us the type IO from Vertex3
vertex3f = vertex :: Vertex3 GLfloat -> IO ()
transformVector and transformVertex are functions which given a Vector or a Vertex respectively and a list representing
the matrix that the sapce has been multiplied by, will give us the new transformed Vector/Vertex according to
the new set of axis in the current space. This is important so that when we rotate the space we conserve the
horizontal/vertical/depth movement irregardless of the direction of the axis.
47
transformVector :: Vector3 GLfloat -> [GLdouble] -> IO (Vector3 GLfloat)
transformVector (Vector3 a b c) xs = do
let newa = ((read(show(xs !! 0))::GLfloat) * a) + ((read(show(xs !! 1))::GLfloat) * b) +
( (read(show(xs !! 2))::GLfloat) * c)
let newb = ((read(show(xs !! 4))::GLfloat) * a) + ((read(show(xs !! 5))::GLfloat) * b) +
( (read(show(xs !! 6))::GLfloat) * c)
let newc = ((read(show(xs !! 8))::GLfloat) * a) + ((read(show(xs !! 9))::GLfloat) * b) +
( (read(show(xs !! 10))::GLfloat) * c)
return (Vector3 newa newb newc)
transformVertex :: Vertex3 GLdouble -> [GLdouble] -> IO (Vertex3 GLdouble)
transformVertex (Vertex3 a b c) xs = do
let newa = ((read(show(xs !! 0))::GLdouble) * a) + ((read(show(xs !! 1))::GLdouble) * b) +
( (read(show(xs !! 2))::GLdouble) * c)
let newb = ((read(show(xs !! 4))::GLdouble) * a) + ((read(show(xs !! 5))::GLdouble) * b) +
( (read(show(xs !! 6))::GLdouble) * c)
let newc = ((read(show(xs !! 8))::GLdouble) * a) + ((read(show(xs !! 9))::GLdouble) * b) +
( (read(show(xs !! 10))::GLdouble) * c)
return (Vertex3 newa newb newc)
Module DrawNode provides a function to render the nodes of the graph. The secret this module hides is the way this
is achieved. The basic concept is that we go through the list of nodes and render them one by one.//
module DrawNode (nodeDrawLoop) where
import
import
import
import
import
import
import
import
import
System.Exit ( exitWith, ExitCode(ExitSuccess) )
Graphics.UI.GLUT
System.Exit(exitWith, ExitCode(ExitSuccess), exitFailure)
LabelDisplay
GraphInterface
Gxl_1_0_1_DTD
GXL_DTD
Node
Data.IORef ( IORef, newIORef, readIORef, modifyIORef, writeIORef)
checkForError is a function used in order to handle errors caused by render quadric.
checkForError :: IO (Maybe Error) -> IO ()
checkForError action = do
maybeError <- action
case maybeError of
Nothing -> return ()
Just (Error _category description) -> do exitFailure
Here we define some color constants that we will be using when we draw the node.
diffuseColor::Color4 GLfloat
diffuseColor = Color4 0.1 0.5 0.8 1.0
specularColor::Color4 GLfloat
48
specularColor = Color4 1.0 1.0 1.0 1.0
shininess::GLfloat
shininess = 50.0
emisionColor::Color4 GLfloat
emisionColor = Color4 0.0 0.0 0.0 1.0
drawNode is a function which given a Node data structure it displays the corresponding node on the screen. This is
done by first resetting the color to white. Then the label associated with the node is displayed. Finally the object is
rendered with the appropriate attributes.
drawNode :: Node.Node -> IO()
drawNode node = do
--get the necessary information
let myLabel = extractLabel node
let myQuadricStyle = extractQuadricStyle node
let myQuadricPrimitive = extractQuadricPrimitive node
let myColor = extractColor node
--reset the color to white
clearColor $= Color4 0 0.0 0.0 0.0
--display the label
fontOffset <- makeRasterFont
translate (Vector3 (0.8) 0.2 0.0 :: Vector3 GLfloat)
glRasterPos2s 0 0
printString fontOffset myLabel
translate (Vector3 (-0.8) (-0.2) 0.0 :: Vector3 GLfloat)
--setup the colors and render node
materialAmbient
Front $= myColor
materialDiffuse
Front $= diffuseColor
materialSpecular Front $= specularColor
materialShininess Front $= shininess
materialEmission Front $= emisionColor
checkForError $
renderQuadric myQuadricStyle myQuadricPrimitive
nodeDrawLoop is a function which given a graph set and the list of nodes forming that graph set will loop through
all the nodes in the list and draw them at the appropriate location given by the layout. Each transformation done to
reach the correct position must be undone so that the next transformation starts from the beginning. So the way the
function works is by first getting a node from the list, extract its layout information, apply the correct transformation,
assign it an ID on the name stack, draw it and then undo the transformation. This process is done for every node in
the list, recursively, until we go thorugh all the list.
nodeDrawLoop :: IORef GxlGraphSet -> [GXL_DTD.Id] -> IO()
nodeDrawLoop dataStructure (x:xs) = do
myNode <- getNode x dataStructure
let myVector = extractLayout myNode
translate (myVector)
loadName (Name (read (show x)::GLuint))
drawNode myNode
translate (reverseTranslate (myVector) )
49
nodeDrawLoop dataStructure xs
nodeDrawLoop myGraphSet _ = do return ()
reverseTranslate is a function which gives us the vector opposite in direction to the one we pass to it.
reverseTranslate :: (Vector3 GLfloat) -> (Vector3 GLfloat)
reverseTranslate (Vector3 x y z) = (Vector3 (-x) (-y) (-z))
Module EdgeManipulation is responsible for the manipulation of the edges in the program. Any change to the edges
in the graph corresponds to changes in the graph data structure. The information in the graph data structure is updated according to how the nodes are manipulated. The only possible changes that can be done to edges that requires
changes to the data structure are addition and bending of edges. Changes such as removal of edges and attribute
changes(color,size,etc.) are generalized in the ItemManipulation module for both nodes and edges. The functions
that are of concern here deals with addition and bending of an edge. The functions which manipulate bending of an
edge is represented by how the user bends the edge. Dragging the mouse after clicking on an edge corresponds to
’bendEdgeButtonDown’ while bending the edge in the Z-plane using the wheel corresponds to ’bendEdgeWheelUp’
and ’bendEdgeWheelDown’.
The service of this module is that it provides a set of functions to add edges in the graph data structure and bend
the edges. The secret of this module is the way the edges are added and the methods that are used to bend an edge.
module EdgeManipulation (addEdge,bendEdgeWheelUp,bendEdgeWheelDown,bendEdgeButtonDown)
import
import
import
import
import
import
import
import
import
import
import
import
import
import
import
import
import
import
import
where
Text.XML.HaXml.Xml2Haskell
Gxl_1_0_1_DTD
GXL_DTD
INIT
Data.IORef
Graphics.Rendering.OpenGL.GL
Graphics.Rendering.OpenGL.GLU
Graphics.UI.GLUT
ViewDataStructure
UndoDataStructure
GraphInterface
Text.XML.HaXml.OneOfN
Node
Utils
GxlGraphSetManage
PickObject
SettingsDataStructure
Collision
Additional
Function addEdge is the function which is called by the keyboard mouse callback in the main program for adding
an edge on a particular point on the screen. It takes in as parameters: a) the Graph data structure to be modified b)
the coordinates where the user clicked the mouse on c) the Undo data structure to save a copy of the data structure
before the node is added d) the current transformation matrix to determine where to place the node according to
the graph’s axis e) the View data structure to determine the current distance of the camera from the objects f) the
Settings data structure to determine if collision is toggled on or off
50
Adding an edge is done by selecting the source node and then selecting the target node. If the source node and
target node is valid, then an edge will added from the source node to the target node.
addEdge :: IORef GxlGraphSet -> GLsizei -> GLsizei -> IORef View -> IORef GXL_DTD.Id -> IORef GXL_DTD.Id
-> Prelude.String -> IORef UndoDataStructure ->IORef [GLdouble] -> IORef SettingsDataStructure -> IO()
addEdge dataStructure x y view currentItem1 currentItem2 directedOrNot undoDataStructure matrixStore settings = do
This function starts off by checking if the source node has been selected yet. If it is, the node which was selected will
be recorded. If the source node has been selected already, then the function proceeds by using the mouse coordinates
to record the target node. If both nodes are properly recorded, then the function can proceed.
sourceNode <- readIORef currentItem1
if (sourceNode==0)
then do selectedNode <- selectObject view x y dataStructure matrixStore settings
let newSelectedNode = (read ( show selectedNode))::GXL_DTD.Id
modifyIORef currentItem1 (\x->newSelectedNode)
else do selectedNode <- selectObject view x y dataStructure matrixStore settings
let newSelectedNode = (read ( show selectedNode))::GXL_DTD.Id
sourceNode <- readIORef currentItem1
if ((newSelectedNode==0)||(sourceNode==newSelectedNode))
then do return()
else do modifyIORef currentItem2 (\d->newSelectedNode)
myGraphSet <- readIORef dataStructure
let listOfGraphID = getGxlGraphs myGraphSet
let graphGXLid = unMaybe (getGXLId myGraphSet (head listOfGraphID))
let edgeMode =getGraphEdgeMode myGraphSet graphGXLid
If the Gxl file that we are dealing with has its edgemode as undirected, then the user is not allowed to add a directed
edge and vice versa. Those two cases are handled here by resetting the recorded source and target nodes to zero
again.
if (((edgeMode==Graph_edgemode_undirected)&&(directedOrNot=="Item_isdirected_true"))||
((edgeMode==Graph_edgemode_directed)&&(directedOrNot=="Item_isdirected_false")))
then do modifyIORef currentItem1 (\x-> 0)
modifyIORef currentItem2 (\x-> 0)
return()
Here we call the function newEdge which actually does the adding of the edge into the graph data structure.
else do newEdge dataStructure currentItem1 currentItem2 directedOrNot settings undoDataStructure
return()
return()
newEdge does the actual construction of a new edge with default attributes and adds it into the graph data
structure.
newEdge :: IORef GxlGraphSet -> IORef (GXL_DTD.Id) -> IORef (GXL_DTD.Id) -> Prelude.String ->
IORef SettingsDataStructure -> IORef UndoDataStructure -> IO()
newEdge dataStructure currentItem1 currentItem2 directedOrNot settings undoDataStructure = do
sourceNode <- readIORef currentItem1
targetNode <- readIORef currentItem2
mydataStructure <- readIORef dataStructure
let listOfGraphID = getGxlGraphs mydataStructure
let graphGXLid = unMaybe (getGXLId mydataStructure (head listOfGraphID))
myListOfEdges <- getListOfEdges mydataStructure
myListOfNodes <- getListOfNodes mydataStructure
mySettings <- readIORef settings
collisionOnIORef <- getCollisionOn mySettings
51
Collision checking is done before the edge is added. The adding edge collision checking function checks if there would
be a collision when a particular edge is added before it is added. If it does not cause a collision, the function proceeds
as normal to add the edge.
collisionOn<-readIORef (collisionOnIORef)
collisionDetected <- collisionDetectionNewEdge collisionOn dataStructure myListOfNodes myListOfEdges sourceNode
targetNode settings
if (collisionDetected==False)
then do
This section of the function constructs and adds the information about the edge into the graph data structure through
the addItem function. A tentacle also has to be added in the graph data structure in the case of edges.
let numberOfEdges =length(myListOfEdges)
let newdataStructure = addItem (myEdgeItemInfo numberOfEdges directedOrNot) graphGXLid mydataStructure
modifyIORef dataStructure (\x -> newdataStructure)
mydataStructure2 <- readIORef dataStructure
let sourceNodeGxlId = unMaybe (getGXLId mydataStructure2 sourceNode)
let targetNodeGxlId = unMaybe (getGXLId mydataStructure2 targetNode)
tentOut <- myTentacleInfoOut dataStructure numberOfEdges targetNodeGxlId
let newGraphSet1 = addTent tentOut mydataStructure2
modifyIORef dataStructure (\x -> newGraphSet1)
mydataStructure3 <- readIORef dataStructure
tentIn <- myTentacleInfoIn dataStructure numberOfEdges sourceNodeGxlId
let finaldataStructure = addTent tentIn mydataStructure3
--trick to make undo work restore so that if undone go back
modifyIORef dataStructure (\x ->mydataStructure)
updateGraphDataStructure finaldataStructure dataStructure undoDataStructure
modifyIORef currentItem1 (\x-> 0)
modifyIORef currentItem2 (\x-> 0)
else do modifyIORef currentItem1 (\x-> 0)
modifyIORef currentItem2 (\x-> 0)
collisionDetectionNewEdge is the function which returns true when collision is detected for adding a specified edge in
the data structure, or false if collision is not detected.
collisionDetectionNewEdge::Prelude.Bool-> IORef GxlGraphSet -> [GXL_DTD.Id] -> [GXL_DTD.Id]
-> GXL_DTD.Id -> GXL_DTD.Id -> IORef SettingsDataStructure-> IO(Prelude.Bool)
collisionDetectionNewEdge collisionOn dataStructure myListOfNodes myListOfEdges sourceNode targetNode settings =
if (collisionOn==True) then do collisionDetected <- newEdgeCollision dataStructure myListOfNodes
myListOfEdges sourceNode targetNode 10 settings
return(collisionDetected)
else do return(False)
myTentacleInfoIn returns a complete tentacle that is associated with the source node that is constructed for the edge.
myTentacleInfoIn dataStructure numberOfEdges nodeFrom = do
newTentacleIn <- myTentacleAttrIn dataStructure numberOfEdges nodeFrom
let completeTentacleIn = TentacleInfo [] newTentacleIn
return (completeTentacleIn)
myTentacleInfoOut returns a complete tentacle that is associated with the target node that is constructed for the
edge.
myTentacleInfoOut dataStructure numberOfEdges nodeTo = do
newTentacleOut <- myTentacleAttrOut dataStructure numberOfEdges nodeTo
let completeTentacleOut = TentacleInfo [] newTentacleOut
return (completeTentacleOut)
52
myTentacleAttrOut returns a tentacle attribute specifically for specifying where the target node of the edge, used in
the construction of a complete tentacle. The Gxl Id for the new edge would be ”Edge x” where x is the number of
edges in the graph.
myTentacleAttrOut dataStructure numberOfEdges nodeTo = do
mydataStructure <- readIORef dataStructure
let edgeItemId = getInnerId mydataStructure ("Edge"++" "++(show(numberOfEdges)))
let myTentacleOut = TentacleAttr edgeItemId nodeTo Nothing (Just Out) Nothing Nothing
return (myTentacleOut)
myTentacleAttrIn returns a tentacle attribute specifically for specifying where the source node of the edge, used in
the construction of a complete tentacle. The Gxl Id for the new edge would be ”Edge x” where x is the number of
edges in the graph.
myTentacleAttrIn dataStructure numberOfEdges nodeFrom = do
mydataStructure <- readIORef dataStructure
let edgeItemId = getInnerId mydataStructure ("Edge"++" "++(show(numberOfEdges)))
let myTentacleIn = TentacleAttr edgeItemId nodeFrom Nothing (Just In) Nothing Nothing
return (myTentacleIn)
myEdgeItemAttr returns a default ItemAttr for the new edge item for the construction of a new edge.
myEdgeItemAttr numberOfEdges directedOrNot = ItemAttr FEdge (Just ("Edge"++" "++(show(numberOfEdges))))
(Just ((read directedOrNot)::Item_isdirected))
myEdgeItemInfo numberOfEdges directedOrNot = ItemInfo Nothing [] [] [] (myEdgeItemAttr
numberOfEdges directedOrNot)
bendEdgeWheelUp is the function which handles bending of edges in the z axis of the screen(towards and away
from user). The control point of the edge is shifted appropriately to simulate the edge bending in and out of the
screen.
bendEdgeWheelUp ::IORef GxlGraphSet -> GXL_DTD.Id -> IORef SettingsDataStructure -> IORef [GLdouble]
-> IORef UndoDataStructure -> IO()
bendEdgeWheelUp dataStructure myItem settings matrixStore undoDataStructure = do
let moveDiff = 0.1
if (myItem/=0)
then do myGraphSet <- readIORef dataStructure
updateGraphDataStructure myGraphSet dataStructure undoDataStructure
myEdgeMidPoint <- bendEdgeMidPoint myItem dataStructure
let xcoordinate = xcoordVertex myEdgeMidPoint
let ycoordinate = ycoordVertex myEdgeMidPoint
let zcoordinate = zcoordVertex myEdgeMidPoint
The translation vector which would translate the control point of the bended edge an appropriate amount is determined
by multiplying the transformation matrix and the vector for z axis translation. This would then appropriately move
the control point relative to the screen rather than the axis in the window.
transformationMatrix <- readIORef matrixStore
(Vector3 a b c) <- transformVector (Vector3 0 0 (-moveDiff)) transformationMatrix
let newxcoordinate = xcoordinate + a
let newycoordinate = ycoordinate + b
let newzcoordinate = zcoordinate + c
let newEdgeLayout = Vertex3 newxcoordinate newycoordinate (newzcoordinate::GLfloat)
let newLayoutAttribute = processLayoutVertex newEdgeLayout
myListOfEdges <- getListOfEdges myGraphSet
myListOfNodes <- getListOfNodes myGraphSet
mySettings <- readIORef settings
53
Collisions for bending edges are detected here. If collision detection is passed, then the edge will be added to the
graph data structure finally. The undo data structure is also updated to the graph set previously before the edge is
added.
collisionOnIORef <- getCollisionOn mySettings
collisionOn<-readIORef (collisionOnIORef)
collisionDetected <- collisionDetectionBendEdge collisionOn dataStructure myListOfNodes
myListOfEdges myItem newEdgeLayout settings
if (collisionDetected==False)
then do mydataStructure <- readIORef dataStructure
changeAttr dataStructure "midPoint" myItem newLayoutAttribute
myseconddatastructure <-readIORef dataStructure
modifyIORef dataStructure (\x -> mydataStructure)
updateGraphDataStructure myseconddatastructure dataStructure undoDataStructure
else do return ()
else return()
This is similar with bendEdgeWheelUp, just a change in the direction of the z axis in the translation vector because
this would be called when the user wants to bend an edge out of the screen.
bendEdgeWheelDown ::IORef GxlGraphSet -> GXL_DTD.Id -> IORef SettingsDataStructure -> IORef [GLdouble]
-> IORef UndoDataStructure -> IO()
bendEdgeWheelDown dataStructure myItem settings matrixStore undoDataStructure = do
let moveDiff = 0.1
if (myItem/=0)
then do myGraphSet <- readIORef dataStructure
updateGraphDataStructure myGraphSet dataStructure undoDataStructure
myEdgeMidPoint <- bendEdgeMidPoint myItem dataStructure
let xcoordinate = xcoordVertex myEdgeMidPoint
let ycoordinate = ycoordVertex myEdgeMidPoint
let zcoordinate = zcoordVertex myEdgeMidPoint
transformationMatrix <- readIORef matrixStore
(Vector3 a b c) <- transformVector (Vector3 0 0 moveDiff) transformationMatrix
let newxcoordinate = xcoordinate + a
let newycoordinate = ycoordinate + b
let newzcoordinate = zcoordinate + c
let newEdgeLayout = Vertex3 newxcoordinate newycoordinate (newzcoordinate::GLfloat)
let newLayoutAttribute = processLayoutVertex newEdgeLayout
myListOfEdges <- getListOfEdges myGraphSet
myListOfNodes <- getListOfNodes myGraphSet
mySettings <- readIORef settings
collisionOnIORef <- getCollisionOn mySettings
collisionOn<-readIORef (collisionOnIORef)
collisionDetected <- collisionDetectionBendEdge collisionOn dataStructure myListOfNodes
myListOfEdges myItem newEdgeLayout settings
if (collisionDetected==False)
then do mydataStructure <- readIORef dataStructure
changeAttr dataStructure "midPoint" myItem newLayoutAttribute
myseconddatastructure <-readIORef dataStructure
modifyIORef dataStructure (\x -> mydataStructure)
updateGraphDataStructure myseconddatastructure dataStructure undoDataStructure
else do return ()
else return()
collisionDetectionBendEdge is a speciallized collision detection mechanism made specially for bending edges. It
returns true if collision is detected.
54
collisionDetectionBendEdge::Prelude.Bool-> IORef GxlGraphSet -> [GXL_DTD.Id] -> [GXL_DTD.Id] ->
GXL_DTD.Id -> Vertex3 GLfloat -> IORef SettingsDataStructure-> IO(Prelude.Bool)
collisionDetectionBendEdge collisionOn dataStructure myListOfNodes myListOfEdges myItem newLayoutAttribute
settings =
if (collisionOn==True)
then do collisionDetected <- bendEdgeCollision dataStructure myListOfNodes myListOfEdges myItem
newLayoutAttribute settings
return(collisionDetected)
else do return(False)
bendEdgeButtonDown is responsible for edge bending while the left mouse button is held down. This together
with motion call back simulates bending of edges in the x-y plane while the left mouse button is being held down.
bendEdgeButtonDown :: IORef View -> IORef GLfloat -> IORef GLfloat -> IORef GLfloat -> IORef GLfloat
-> IORef GxlGraphSet -> IORef GXL_DTD.Id -> IORef UndoDataStructure -> IORef SettingsDataStructure
-> IORef [GLdouble] -> GLsizei -> GLsizei -> IO()
bendEdgeButtonDown view oldx oldy newx newy currentGraphSet currentItem1 undoDataStructure settings matrixStore x y = d
myItem <- readIORef currentItem1
if (myItem/=0)
then do oy <- readIORef oldy
ox <- readIORef oldx
modifyIORef newy (\d ->(fromIntegral y))
modifyIORef newx (\d ->(fromIntegral x))
calculateBendEdge is called here to do the actual bending of the edge and the calculations on how much to bend it
in accordance to the mouse movement.
ny <- readIORef newy
nx <- readIORef newx
calculateBendEdge oldx oldy newx newy view currentGraphSet currentItem1
settings matrixStore undoDataStructure
modifyIORef oldx (\d ->nx)
modifyIORef oldy (\d ->ny)
return()
else return()
calculateBendEdge does the calculation and actual bending of the edges according to how the mouse is moved.
calculateBendEdge :: IORef GLfloat -> IORef GLfloat -> IORef GLfloat -> IORef GLfloat -> IORef View
-> IORef GxlGraphSet -> IORef GXL_DTD.Id -> IORef SettingsDataStructure
->IORef [GLdouble] -> IORef UndoDataStructure -> IO()
calculateBendEdge oldx oldy newx newy view currentGraphSet currentItem1 settings matrixStore undoDataStructure = do
let moveDiff = 0.05
ny <- readIORef newy
oy <- readIORef oldy
nx <- readIORef newx
ox <- readIORef oldx
myEdge <- readIORef currentItem1
The difference between the old mouse coordinates and new mouse coordinates is calculated and 4 cases are developed.
Each case determines if the edge is to be bent up or down or left or right. Only the translation matrix is changed in
each case accordingly.
let diffy = ny-oy
let diffx = nx-ox
if (diffy <=(-1))
55
then do myGraphSet <- readIORef currentGraphSet
myEdgeMidPoint <- bendEdgeMidPoint myEdge currentGraphSet
let xcoordinate = xcoordVertex myEdgeMidPoint
let ycoordinate = ycoordVertex myEdgeMidPoint
let zcoordinate = zcoordVertex myEdgeMidPoint
The translation vector which would translate the control point of the bended edge an appropriate amount is determined
by multiplying the transformation matrix and the translation vector. This would then appropriately move the control
point relative to the screen rather than the axis in the window. Collision is
transformationMatrix <- readIORef matrixStore
(Vector3 a b c) <- transformVector (Vector3 0 moveDiff 0) transformationMatrix
let newxcoordinate = xcoordinate + a
let newycoordinate = ycoordinate + b
let newzcoordinate = zcoordinate + c
let newEdgeLayout = Vertex3 newxcoordinate newycoordinate (newzcoordinate::GLfloat)
let newLayoutAttribute = processLayoutVertex newEdgeLayout
myListOfEdges <- getListOfEdges myGraphSet
myListOfNodes <- getListOfNodes myGraphSet
mySettings <- readIORef settings
Collision detection is done here. The change is only applied when the collision detection function returns false which
indicates there will be no collision when the edge is bent.
collisionOnIORef <- getCollisionOn mySettings
collisionOn<-readIORef (collisionOnIORef)
collisionDetected <- collisionDetectionBendEdge collisionOn currentGraphSet myListOfNodes
myListOfEdges myEdge newEdgeLayout settings
if (collisionDetected==False)
then do mydataStructure <- readIORef currentGraphSet
changeAttr currentGraphSet "midPoint" myEdge newLayoutAttribute
myseconddatastructure <-readIORef currentGraphSet
modifyIORef currentGraphSet (\x -> mydataStructure)
updateGraphDataStructure myseconddatastructure currentGraphSet undoDataStructure
postRedisplay Nothing
else do postRedisplay Nothing
else if (diffy >=1)
then do myGraphSet <- readIORef currentGraphSet
myEdgeMidPoint <- bendEdgeMidPoint myEdge currentGraphSet
let xcoordinate = xcoordVertex myEdgeMidPoint
let ycoordinate = ycoordVertex myEdgeMidPoint
let zcoordinate = zcoordVertex myEdgeMidPoint
transformationMatrix <- readIORef matrixStore
(Vector3 a b c) <- transformVector (Vector3 0 (-moveDiff) 0) transformationMatrix
let newxcoordinate = xcoordinate + a
let newycoordinate = ycoordinate + b
let newzcoordinate = zcoordinate + c
let newEdgeLayout = Vertex3 newxcoordinate newycoordinate (newzcoordinate::GLfloat)
let newLayoutAttribute = processLayoutVertex newEdgeLayout
myListOfEdges <- getListOfEdges myGraphSet
myListOfNodes <- getListOfNodes myGraphSet
mySettings <- readIORef settings
collisionOnIORef <- getCollisionOn mySettings
collisionOn<-readIORef (collisionOnIORef)
collisionDetected <- collisionDetectionBendEdge collisionOn currentGraphSet myListOfNodes
myListOfEdges myEdge newEdgeLayout settings
56
if (collisionDetected==False)
then do mydataStructure <- readIORef currentGraphSet
changeAttr currentGraphSet "midPoint" myEdge newLayoutAttribute
myseconddatastructure <-readIORef currentGraphSet
modifyIORef currentGraphSet (\x -> mydataStructure)
updateGraphDataStructure myseconddatastructure currentGraphSet undoDataStructure
postRedisplay Nothing
else do postRedisplay Nothing
else if (diffx <=(-1))
then do myGraphSet <- readIORef currentGraphSet
myEdgeMidPoint <- bendEdgeMidPoint myEdge currentGraphSet
let xcoordinate = xcoordVertex myEdgeMidPoint
let ycoordinate = ycoordVertex myEdgeMidPoint
let zcoordinate = zcoordVertex myEdgeMidPoint
transformationMatrix <- readIORef matrixStore
(Vector3 a b c) <- transformVector (Vector3 (-moveDiff) 0 0) transformationMatrix
let newxcoordinate = xcoordinate + a
let newycoordinate = ycoordinate + b
let newzcoordinate = zcoordinate + c
let newEdgeLayout = Vertex3 newxcoordinate newycoordinate (newzcoordinate::GLfloat)
let newLayoutAttribute = processLayoutVertex newEdgeLayout
myListOfEdges <- getListOfEdges myGraphSet
myListOfNodes <- getListOfNodes myGraphSet
mySettings <- readIORef settings
collisionOnIORef <- getCollisionOn mySettings
collisionOn<-readIORef (collisionOnIORef)
collisionDetected <- collisionDetectionBendEdge collisionOn currentGraphSet myListOfNodes
myListOfEdges myEdge newEdgeLayout settings
if (collisionDetected==False)
then do mydataStructure <- readIORef currentGraphSet
changeAttr currentGraphSet "midPoint" myEdge newLayoutAttribute
myseconddatastructure <-readIORef currentGraphSet
modifyIORef currentGraphSet (\x -> mydataStructure)
updateGraphDataStructure myseconddatastructure currentGraphSet undoDataStructure
postRedisplay Nothing
else do postRedisplay Nothing
else if (diffx >= 1)
then do myGraphSet <- readIORef currentGraphSet
myEdgeMidPoint <- bendEdgeMidPoint myEdge currentGraphSet
let xcoordinate = xcoordVertex myEdgeMidPoint
let ycoordinate = ycoordVertex myEdgeMidPoint
let zcoordinate = zcoordVertex myEdgeMidPoint
transformationMatrix <- readIORef matrixStore
(Vector3 a b c) <- transformVector (Vector3 (moveDiff) 0 0) transformationMatrix
let newxcoordinate = xcoordinate + a
let newycoordinate = ycoordinate + b
let newzcoordinate = zcoordinate + c
let newEdgeLayout = Vertex3 newxcoordinate newycoordinate (newzcoordinate::GLfloat)
let newLayoutAttribute = processLayoutVertex newEdgeLayout
myListOfEdges <- getListOfEdges myGraphSet
myListOfNodes <- getListOfNodes myGraphSet
mySettings <- readIORef settings
collisionOnIORef <- getCollisionOn mySettings
collisionOn<-readIORef (collisionOnIORef)
57
collisionDetected <-
collisionDetectionBendEdge collisionOn currentGraphSet myListOfNodes
myListOfEdges myEdge newEdgeLayout settings
if (collisionDetected==False)
then do mydataStructure <- readIORef currentGraphSet
changeAttr currentGraphSet "midPoint" myEdge newLayoutAttribute
myseconddatastructure <-readIORef currentGraphSet
modifyIORef currentGraphSet (\x -> mydataStructure)
updateGraphDataStructure myseconddatastructure currentGraphSet undoDataStructure
postRedisplay Nothing
else do postRedisplay Nothing
else return()
unMaybe ignores the Maybe type and just returns what it contains.
unMaybe :: Maybe a -> a
unMaybe (Just a) = a
These are utility functions to get certain components from the Vertex3 type
xcoordVertex :: Vertex3 a -> a
xcoordVertex (Vertex3 a b c) = a
ycoordVertex :: Vertex3 a -> a
ycoordVertex (Vertex3 a b c) = b
zcoordVertex :: Vertex3 a -> a
zcoordVertex (Vertex3 a b c) = c
processLayout converts the Vector3 type into the AttrValue type so that Vector3 types can be inserted into the graph
data structure.
processLayoutVertex :: Vertex3 GLfloat -> AttrValue
processLayoutVertex (Vertex3 first second third) = (TenOf10 (Tup [Tup_Float (Gxl_1_0_1_DTD.Float (show first)),
Tup_Float (Gxl_1_0_1_DTD.Float (show second)),Tup_Float (Gxl_1_0_1_DTD.Float (show third))]))
transformVector and transformVertex are functions which given a Vector or a Vertex respectively and a list representing
the matrix that the sapce has been multiplied by, will give us the new transformed Vector/Vertex according to
the new set of axis in the current space. This is important so that when we rotate the space we conserve the
horizontal/vertical/depth movement irregardless of the direction of the axis.
transformVector :: Vector3 GLfloat -> [GLdouble] -> IO (Vector3 GLfloat)
transformVector (Vector3 a b c) xs = do
let newa = ((read(show(xs !! 0))::GLfloat) * a) + ((read(show(xs !! 1))::GLfloat) * b) +
( (read(show(xs !! 2))::GLfloat) * c)
let newb = ((read(show(xs !! 4))::GLfloat) * a) + ((read(show(xs !! 5))::GLfloat) * b) +
( (read(show(xs !! 6))::GLfloat) * c)
let newc = ((read(show(xs !! 8))::GLfloat) * a) + ((read(show(xs !! 9))::GLfloat) * b) +
( (read(show(xs !! 10))::GLfloat) * c)
return (Vector3 newa newb newc)
transformVertex :: Vertex3 GLdouble -> [GLdouble] -> IO (Vertex3 GLdouble)
transformVertex (Vertex3 a b c) xs = do
let newa = ((read(show(xs !! 0))::GLdouble) * a) + ((read(show(xs !! 1))::GLdouble) * b) +
58
( (read(show(xs !! 2))::GLdouble) * c)
let newb = ((read(show(xs !! 4))::GLdouble) * a) + ((read(show(xs !! 5))::GLdouble) * b) +
( (read(show(xs !! 6))::GLdouble) * c)
let newc = ((read(show(xs !! 8))::GLdouble) * a) + ((read(show(xs !! 9))::GLdouble) * b) +
( (read(show(xs !! 10))::GLdouble) * c)
return (Vertex3 newa newb newc)
Module GraphFileManager, as the name indicates, gives us functions and facilities to open, save and close Graph
Files. The secret it hides is how the graph files are manipulated to get this result. Few things to note here: first the
GXL (graph exchange language) is the file format that will be used to hold graph information. Second, is that when a
graph is loaded we made a decision to generate a layout for it if such information is missing or is partial. In addition
when a graph is loaded the current graph is overwritten thus we can only have one graph active at a time. Finally
when a graph is closed we automatically load the emprty graph so that the user can manipulate it straight away.
module GraphFileManager (saveGraph,openGraph,closeGraph) where
import Text.XML.HaXml.Xml2Haskell
import Gxl_1_0_1_DTD
import GXL_DTD
import INIT
import Data.IORef
import Graphics.Rendering.OpenGL.GL
import Graphics.Rendering.OpenGL.GLU
import Graphics.UI.GLUT
import Graphics.UI.WX hiding (WxcTypes.Id,KeyUp,KeyDown,color,motion,WXCore.WxcTypes.Size,
Classes.position,Attributes.get)
import Graphics.UI.WXCore.Frame
import ViewDataStructure
import GxlGraphSetXml
import GxlGraphSetManage
import UndoDataStructure
import Layout
Here we specify the filter that will appear when we load a file. In this case when we are manipulating graphs we are
only interested in .gxl extension, which represents GXL graphs.
graphFiles:: [(String, [String])]
graphFiles = [("GXL files",["*.gxl"])]
This section concerns loading a gxl graph, this is achieved by first prompting the user for a gxl file via a file dialog
provided by wxHaskell. The file is then parsed and read via functions provided by another module and the graph set
corresponding to the loaded graph is returned.
OpenGraph is a function which will prompt the user for a graph to load, which is done by the facilities provided by
wxHaskell. Once the user choose a graph, the graph is read and returned as an IORef. A layout for that graph is
generated if no such information is present or is partial.
openGraph :: IORef GxlGraphSet -> IORef View -> IORef UndoDataStructure -> IO()
openGraph dataStructure view undoDataStructure = do
--prompt the user with a file dialog
tempGraph <-onOpenGraph
--if no file is selected then don’t do anything
59
if (tempGraph == Nothing)
then do
return()
else do
--reset the view
myView <- (initView)
modifyIORef view (\x ->myView)
--load the graph
tempGraph1 <- readIORef (unMaybe(tempGraph))
modifyIORef dataStructure (\x -> tempGraph1)
--reset the undo data structure
undoDataStructureIORef <- newUndoDataStructure
myUndoDataStructure <- readIORef undoDataStructureIORef
modifyIORef undoDataStructure (\x-> myUndoDataStructure)
--generate the layout for the graph
generateLayout dataStructure
onOpenGraph is the function that opens a file dialog for the user and prompts him for the graph file he whishes to
open.
onOpenGraph ::IO (Maybe (IORef GxlGraphSet))
onOpenGraph
= do f <- frameCreateDefault ("File Dialog")
mbfname <- fileOpenDialog f False True "Open Graph" graphFiles "" ""
if (mbfname==Nothing)
then do return(Nothing)
else do let myFile = unMaybe (mbfname)
gxlfile <- (fReadXml myFile)::IO Gxl
let newGraphSet = initGxlGraphSet (gxlfile)
myGraphSet <- newIORef newGraphSet
return (Just myGraphSet)
This section concerns saving a gxl graph, this is achieved by first prompting the user for a gxl file via a file dialog
provided by wxHaskell. The current graph is then saved into then file.
SaveGraph is a function which will prompt the user for a graph to load, which is done by the facilities provided by
wxHaskell. Once the user chooses a file, the current graph is saved in that file.
saveGraph :: IORef GxlGraphSet -> IO()
saveGraph dataStructure
= do f <- frameCreateDefault ("File Dialog")
myDataStructure <- readIORef dataStructure
mbfname <- fileSaveDialog f True True "Save Graph" "" ""
if (mbfname==Nothing)
then do return()
else do let myFile = unMaybe (mbfname)
wrtGxlGraphSetToXmlV1 myDataStructure myFile
return ()
This section concerns closing a gxl graph, this is achieved by simply loading the empty grah to replace the current
existing one.
60
closeGraph:: IORef GxlGraphSet -> IORef View -> IORef UndoDataStructure -> IO()
closeGraph dataStructure view undoDataStructure = do
--reset the view
myView <- (initView)
--replace the current graph with the empty one
let newGraphSet = addEmptyGraph newEmptyGraphSet "Graph"
modifyIORef dataStructure (\x-> newGraphSet)
myGraphSet <- readIORef dataStructure
--reset the undo data structure
undoDataStructureIORef <- newUndoDataStructure
myUndoDataStructure <- readIORef undoDataStructureIORef
modifyIORef undoDataStructure (\x-> myUndoDataStructure)
modifyIORef view (\x-> myView)
modifyIORef dataStructure (\x -> myGraphSet)
return()
unMaybe is an auxilliary function used to get from Maybe type to the regular type.
unMaybe :: Maybe a -> a
unMaybe (Just a) = a
GraphInterface module enables the rest of the program to obtain all the attributes required to display an item
be it a node or an edge. For a node, an element of type Node is retuned which contains all the attributes of a
Node (Label, QuadricStyle, QuadricPrimitive, Color, Layout). As for an edge, the following attributes are returned
(Label,QuadricStyle, Color, Layout of nodes that the edge is incident on...). In addition, this module provides
functions so that the list of nodes and the list of edges can be obtained. Finally we also include functions to transform
vectors and vertices from one space to another. The secrets that it hides are how those attributes are extracted from
the GraphSet and their representation, and the way the list of items is compiled. In addition the default return values
assigned to attributes not specified in the GraphSet are also hidden in this module.
module GraphInterface (getItemStacks,getItemSlices,getItemRadius,bendEdgeMidPoint, defaultNoMidPoint,getNode,
getEdgeQuadricStyle,getItemLabel,getListOfNodes,getListOfEdges,getItemColor4,getEdgeMidPoint,
getToNode,getFromNode,getDirectedOrNot)
where
import Text.XML.HaXml.Xml2Haskell
import Gxl_1_0_1_DTD
import GXL_DTD
import INIT
import Utils
import Interface
import Data.Set
import Data.FiniteMap
import Additional
import Data.IORef
import Graphics.Rendering.OpenGL.GL
import Graphics.Rendering.OpenGL.GLU
import Graphics.Rendering.OpenGL.GLU.Quadrics
import Graphics.UI.GLUT
import Graphics.UI.WX hiding (WxcTypes.Id,KeyUp,KeyDown,color,motion,WXCore.WxcTypes.Size,
Classes.position,Attributes.get)
import Graphics.UI.WXCore.Frame
import Node
61
import
import
import
import
GxlGraphSetManage
GxlGraphSetXml
Text.XML.HaXml.OneOfN
SettingsDataStructure
Here we define default attributes that nodes/edges will take in case these attributes are not found in the GXL file.
These attributes are defined a constant so that they may easily be changed if the need may arise.
The default quadric normal is flat.
defaultNormal::Prelude.String
defaultNormal = "Flat"
The default quadric texture is no texture coordinates.
defaultTexture::Prelude.String
defaultTexture = "NoTextureCoordinates"
The default quadric orientation is outside.
defaultOrientation::Prelude.String
defaultOrientation = "Outside"
The default quadric draw style is fill style.
defaultDrawStyle::Prelude.String
defaultDrawStyle = "FillStyle"
If no midpoint is found we set it to a default value so that we can tell later that in this case this is a straight edge.
defaultNoMidPoint::Vertex3 GLfloat
defaultNoMidPoint = Vertex3 (-100) (-100) ((-100)::GLfloat)
The default shape is a sphere.
defaultShapeName::Prelude.String
defaultShapeName = "Sphere"
The default label is the empty string.
defaultLabel::Prelude.String
defaultLabel = ""
The default radius is equal to 0.3.
defaultRadius::GLdouble
defaultRadius = 0.3
The default number of slices is equal to 20.
defaultSlices::GLint
defaultSlices = 20
The default number of stacks is equal to 20.
defaultStacks::GLint
defaultStacks = 20
62
The default color is that with RGC 0.5 0.3 0.2.
defaultColor::Color4 Prelude.Float
defaultColor = Color4 0.5 0.3 0.2 1.0
getNode is a function which given a node’s ID and the GraphSet it belongs to will return to us a variable of type
Node which englobes the following attributes of the node: the label, the quadric style, the quadric primitice, the color
and finally the layout.
getNode:: Id -> IORef GxlGraphSet -> IO Node.Node
getNode nodeId currentGraphSet = do
--let myLabel = getItemLabel nodeId currentGraphSet
myLabel <- getItemLabel nodeId currentGraphSet
tempColor <- getItemColor4 nodeId currentGraphSet
let myColor = tempColor
myQuadricNormal <- getItemQuadricNormal nodeId currentGraphSet
myTexture <- getItemQuadricTexture nodeId currentGraphSet
myQuadricOrientation <- getItemQuadricOrientation nodeId currentGraphSet
myQuadricDrawStyle <- getItemQuadricDrawStyle nodeId currentGraphSet
let myQuadricStyle = QuadricStyle myQuadricNormal myTexture myQuadricOrientation myQuadricDrawStyle
myQuadricPrimitive <- compareShapeNode nodeId currentGraphSet
myCurrentGraphSet <- readIORef currentGraphSet
myLayout <- getNodeLayout nodeId myCurrentGraphSet
return ( Node.Node myLabel myQuadricStyle myQuadricPrimitive myColor myLayout)
getEdgeQuadricStyle is a function which given an edge’s ID and the GraphSet it belongs to will return to us a the
edge’s quadric style. I.e information about the normal, the texture, the orientation and the draw style.
getEdgeQuadricStyle :: Id -> IORef GxlGraphSet -> IO QuadricStyle
getEdgeQuadricStyle edgeId dataStructure = do
mydataStructure <- readIORef dataStructure
myQuadricNormal <- getItemQuadricNormal edgeId dataStructure
myTexture <- getItemQuadricTexture edgeId dataStructure
myQuadricOrientation <- getItemQuadricOrientation edgeId dataStructure
myQuadricDrawStyle <- getItemQuadricDrawStyle edgeId dataStructure
let myQuadricStyle = QuadricStyle myQuadricNormal myTexture myQuadricOrientation myQuadricDrawStyle
return (myQuadricStyle)
The following functions comparOrientation, compareTexture, compareStyle, compareNormal and compareShapeNode
are playing the role of read instances for the QuadricOrientation, QuadricTexture, QuadricNormal, QuadricPrimitive
respectively. These functions take in a string and return the variable of the appropriate type. This had to be done
since OpenGL does not derive read instances for those types.
compareOrientation :: Prelude.String -> IO QuadricOrientation
compareOrientation input = do
result <- newIORef Inside
if ("Outside"==input)
then do
modifyIORef result (\x -> Outside )
else do
dummy
tempResult <- readIORef result
return tempResult
63
compareTexture :: Prelude.String -> IO QuadricTexture
compareTexture input = do
result <- newIORef GenerateTextureCoordinates
if ("NoTextureCoordinates"==input)
then do
modifyIORef result (\x -> NoTextureCoordinates )
else do
dummy
tempResult <- readIORef result
return tempResult
compareStyle :: Prelude.String -> IO QuadricDrawStyle
compareStyle input = do
result <- newIORef PointStyle
if ("LineStyle"==input)
then do
modifyIORef result (\x -> LineStyle)
else if ("FillStyle"==input)
then do
modifyIORef result (\x -> FillStyle)
else if ("SilhouetteStyle"==input)
then do
modifyIORef result (\x -> SilhouetteStyle)
else dummy
tempResult <- readIORef result
return tempResult
compareNormal :: Prelude.String -> IO QuadricNormal
compareNormal input = do
result <- newIORef Flat
if ("Smooth"==input)
then do
modifyIORef result (\x -> Smooth)
else do
dummy
tempResult <- readIORef result
return (Just tempResult)
compareShapeNode :: Id -> IORef GxlGraphSet -> IO QuadricPrimitive
compareShapeNode nodeId dataStructure = do
myShapeName <- getNodeShapeName nodeId dataStructure
myShapeRadius <- getItemRadius nodeId dataStructure
myShapeSlices <- getItemSlices nodeId dataStructure
myShapeStacks <- getItemStacks nodeId dataStructure
let myPrimitive = Sphere myShapeRadius myShapeSlices myShapeStacks
return myPrimitive
dummy :: IO ()
dummy = return ()
getListOfNodes is a function which given a GraphSet returns a list of the nodes that form it. This list is used to go
over the nodes to draw them when this is needed and used in many other places as well.
64
getListOfNodes :: GxlGraphSet -> IO ([Id])
getListOfNodes currentGraphSet = do
let listOfGraphId = getGxlGraphs currentGraphSet
if (listOfGraphId/=[]) then do let setOfNodes = nodes currentGraphSet (head (listOfGraphId))
let listOfNodes = setToList setOfNode
return (listOfNodes)
else do return ([])
The functions that extract certain attributes all share the same concept. First we obtain the finite map of the graphs
that for the graph set and then transform this finite map into a list and take the head of that list since we are
not considering sub-graphs. Then we construct the finite map consisting of all the attributes associated with that
particular graph and proceed to querying it for specific attributes. In case the attribute is not there, then a default
attribute defined in the top section of the code will be added to the item and then returned. This way devellopers can
easily change the default attributes easily by replacing the values of the constants rather then modifying it everywhere
in the code.
getItemLabel is a function which given the ID of an item and the graph it belongs to it returns the label attribute
associated with it. If no label is found the default string defined above is returned.
getItemLabel :: Id -> IORef GxlGraphSet -> IO Prelude.String
getItemLabel itemId dataStructure = do
mydataStructure <- readIORef dataStructure
let listOfGraphID = getGxlGraphs mydataStructure
-- Create Map of Graph to Attributes
let mapOfGraphAttrs = graphAttrs mydataStructure (head(listOfGraphID))
-- Create Finite Map of Graph to Attributes from the map
let graphFiniteMap = itemAttrs mydataStructure mapOfGraphAttrs itemId
--lookup the attribute
let myLabel = lookupFM graphFiniteMap (itemId,"Label")
--if the attribute is missing
if (myLabel==Nothing)
then do
--get the current item info
let (ItemInfo a b c d e) = queryItemInfo mydataStructure itemId
--construct the attribute
let (z,y) = addAttrGetId (myInfoLabel) mydataStructure
--update the graph set
modifyIORef dataStructure (\x -> y)
mydataStructure <- readIORef dataStructure
--add the current attribute to the list of attribute
let newList = z:b
let newItemInfo = ItemInfo a newList c d e
let newGraphSet = updateItemInfo mydataStructure itemId newItemInfo
--update the graph set
modifyIORef dataStructure (\x -> newGraphSet)
--return the added attribute
return (defaultLabel)
--if the attribute is there
else do
--fetch the value of the label
let label = getAttrValStr(unMaybe (myLabel) )
--return the value fetched
return (label)
65
myInfoLabel = AttrInfo Nothing [] (FiveOf10 (GxlString defaultLabel)) labelAttr
labelAttr = AttrAttr Nothing "Label"
Nothing
getNodeLayout is a function which given the ID of a node and the graph it belongs to it returns the layout attribute
associated with it.
getNodeLayout :: Id -> GxlGraphSet -> IO (Vector3 GLfloat)
getNodeLayout nodeId currentGraphSet = do
let listOfGraphID = getGxlGraphs currentGraphSet
-- Create Map of Graph to Attributes
let mapOfGraphAttrs = graphAttrs currentGraphSet (head(listOfGraphID))
-- Create Finite Map of Graph to Attributes from the map
let graphFiniteMap = itemAttrs currentGraphSet mapOfGraphAttrs nodeId
let myLayout = lookupFM graphFiniteMap (nodeId,"Layout")
let layout = getAttrValVector3 (unMaybe (myLayout))
return layout
layoutAttr = AttrAttr Nothing "Layout" Nothing
processLayout (Vector3 first second third) = (TenOf10 (Tup [Tup_Float (Gxl_1_0_1_DTD.Float (show first)),
Tup_Float (Gxl_1_0_1_DTD.Float (show second)),Tup_Float (Gxl_1_0_1_DTD.Float (show third))]))
getItemQuadricNormal is a function which given the ID of an item and the graph it belongs to it returns the quadric
normal attribute associated with it. If no normal is found the default normal defined above is inserted then returned.
getItemQuadricNormal :: Id -> IORef GxlGraphSet -> IO QuadricNormal
getItemQuadricNormal itemId dataStructure = do
mydataStructure <- readIORef dataStructure
let listOfGraphID = getGxlGraphs mydataStructure
-- Create Map of Graph to Attributes
let mapOfGraphAttrs = graphAttrs mydataStructure (head(listOfGraphID))
-- Create Finite Map of Graph to Attributes from the map
let graphFiniteMap = itemAttrs mydataStructure mapOfGraphAttrs itemId
let myQuadricNormal = lookupFM graphFiniteMap (itemId,"QuadricNormal")
if (myQuadricNormal==Nothing)
then do let (ItemInfo a b c d e) = queryItemInfo mydataStructure itemId
let (z,y) = addAttrGetId (myInfoQuadricNormal) mydataStructure
modifyIORef dataStructure (\x -> y)
mydataStructure <- readIORef dataStructure
let newList = z:b
let newItemInfo = ItemInfo a newList c d e
let newGraphSet = updateItemInfo mydataStructure itemId newItemInfo
modifyIORef dataStructure (\x -> newGraphSet)
result <- compareNormal defaultNormal
return (result)
else do let normal = getAttrValStr(unMaybe (myQuadricNormal) )
result <- compareNormal normal
return (result)
myInfoQuadricNormal = AttrInfo Nothing [] (FiveOf10 (GxlString defaultNormal)) quadricNormalAttr
quadricNormalAttr = AttrAttr Nothing "QuadricNormal"
Nothing
66
getItemQuadricTexture is a function which given the ID of an item and the graph it belongs to it returns the quadric
texture attribute associated with it. If no texture is found the default texture defined above is inserted then returned.
getItemQuadricTexture :: Id -> IORef GxlGraphSet -> IO QuadricTexture
getItemQuadricTexture itemId dataStructure = do
mydataStructure <- readIORef dataStructure
let listOfGraphID = getGxlGraphs mydataStructure
-- Create Map of Graph to Attributes
let mapOfGraphAttrs = graphAttrs mydataStructure (head(listOfGraphID))
-- Create Finite Map of Graph to Attributes from the map
let graphFiniteMap = itemAttrs mydataStructure mapOfGraphAttrs itemId
let myQuadricTexture = lookupFM graphFiniteMap (itemId,"QuadricTexture")
if (myQuadricTexture==Nothing)
then do let (ItemInfo a b c d e) = queryItemInfo mydataStructure itemId
let (z,y) = addAttrGetId (myInfoQuadricTexture) mydataStructure
modifyIORef dataStructure (\x -> y)
mydataStructure <- readIORef dataStructure
let newList = z:b
let newItemInfo = ItemInfo a newList c d e
let newGraphSet = updateItemInfo mydataStructure itemId newItemInfo
modifyIORef dataStructure (\x -> newGraphSet)
result <- compareTexture defaultTexture
return (result)
else do let texture = getAttrValStr(unMaybe (myQuadricTexture) )
result <- compareTexture texture
return (result)
myInfoQuadricTexture = AttrInfo Nothing [] (FiveOf10 (GxlString defaultTexture)) quadricTextureAttr
quadricTextureAttr = AttrAttr Nothing "QuadricTexture"
Nothing
getItemQuadricOrientation is a function which given the ID of an item and the graph it belongs to it returns the
quadric orientation attribute associated with it. If no orientation is found the default orientation defined above is
inserted then returned.
getItemQuadricOrientation :: Id -> IORef GxlGraphSet -> IO QuadricOrientation
getItemQuadricOrientation itemId dataStructure = do
mydataStructure <- readIORef dataStructure
--let graphFiniteMap = getGraphFiniteMap currentGraphSet
let listOfGraphID = getGxlGraphs mydataStructure
-- Create Map of Graph to Attributes
let mapOfGraphAttrs = graphAttrs mydataStructure (head(listOfGraphID))
-- Create Finite Map of Graph to Attributes from the map
let graphFiniteMap = itemAttrs mydataStructure mapOfGraphAttrs itemId
let myQuadricOrientation = lookupFM graphFiniteMap (itemId,"QuadricOrientation")
if (myQuadricOrientation==Nothing)
then do let (ItemInfo a b c d e) = queryItemInfo mydataStructure itemId
let (z,y) = addAttrGetId (myInfoQuadricOrientation) mydataStructure
modifyIORef dataStructure (\x -> y)
mydataStructure <- readIORef dataStructure
let newList = z:b
let newItemInfo = ItemInfo a newList c d e
let newGraphSet = updateItemInfo mydataStructure itemId newItemInfo
67
modifyIORef dataStructure (\x -> newGraphSet)
result <- compareOrientation defaultOrientation
return (result)
else do let orientation = getAttrValStr(unMaybe (myQuadricOrientation) )
result <- compareOrientation orientation
return (result)
myInfoQuadricOrientation = AttrInfo Nothing [] (FiveOf10 (GxlString defaultOrientation)) quadricOrientationAttr
quadricOrientationAttr = AttrAttr Nothing "QuadricOrientation"
Nothing
getItemQuadricDrawStyle is a function which given the ID of an item and the graph it belongs to it returns the
quadric draw style attribute associated with it. If no draw style is found the default drawing style defined above is
inserted then returned.
getItemQuadricDrawStyle :: Id -> IORef GxlGraphSet -> IO QuadricDrawStyle
getItemQuadricDrawStyle itemId dataStructure = do
mydataStructure <- readIORef dataStructure
--let graphFiniteMap = getGraphFiniteMap currentGraphSet
let listOfGraphID = getGxlGraphs mydataStructure
-- Create Map of Graph to Attributes
let mapOfGraphAttrs = graphAttrs mydataStructure (head(listOfGraphID))
-- Create Finite Map of Graph to Attributes from the map
let graphFiniteMap = itemAttrs mydataStructure mapOfGraphAttrs itemId
let myQuadricDrawStyle = lookupFM graphFiniteMap (itemId,"QuadricDrawStyle")
if (myQuadricDrawStyle==Nothing)
then do let (ItemInfo a b c d e) = queryItemInfo mydataStructure itemId
let (z,y) = addAttrGetId (myInfoQuadricDrawStyle) mydataStructure
modifyIORef dataStructure (\x -> y)
mydataStructure <- readIORef dataStructure
let newList = z:b
let newItemInfo = ItemInfo a newList c d e
let newGraphSet = updateItemInfo mydataStructure itemId newItemInfo
modifyIORef dataStructure (\x -> newGraphSet)
result <- compareStyle defaultDrawStyle
return (result)
else do let drawStyle = getAttrValStr(unMaybe (myQuadricDrawStyle) )
result <- compareStyle drawStyle
return (result)
myInfoQuadricDrawStyle = AttrInfo Nothing [] (FiveOf10 (GxlString defaultDrawStyle)) quadricDrawStyleAttr
quadricDrawStyleAttr = AttrAttr Nothing "QuadricDrawStyle"
Nothing
getNodeShapeName is a function which given the ID of a node and the graph it belongs to it returns the shape name
attribute associated with it. If no shape is found the default shape defined above is is inserted then returned.
getNodeShapeName :: Id -> IORef GxlGraphSet -> IO Prelude.String
getNodeShapeName nodeId dataStructure = do
mydataStructure <- readIORef dataStructure
let listOfGraphID = getGxlGraphs mydataStructure
68
-- Create Map of Graph to Attributes
let mapOfGraphAttrs = graphAttrs mydataStructure (head(listOfGraphID))
-- Create Finite Map of Graph to Attributes from the map
let graphFiniteMap = itemAttrs mydataStructure mapOfGraphAttrs nodeId
let myShapeName = lookupFM graphFiniteMap (nodeId,"ShapeName")
if (myShapeName == Nothing)
then do let (ItemInfo a b c d e) = queryItemInfo mydataStructure nodeId
let (z,y) = addAttrGetId (myInfoShapeName) mydataStructure
modifyIORef dataStructure (\x -> y)
mydataStructure <- readIORef dataStructure
let newList = z:b
let newItemInfo = ItemInfo a newList c d e
let newGraphSet = updateItemInfo mydataStructure nodeId newItemInfo
modifyIORef dataStructure (\x -> newGraphSet)
return defaultShapeName
else do let shapeName = (getAttrValStr (unMaybe (myShapeName) ))
return shapeName
myInfoShapeName = AttrInfo Nothing [] (FiveOf10 (GxlString defaultShapeName)) shapeNameAttr
shapeNameAttr = AttrAttr Nothing "ShapeName"
Nothing
getItemRadius is a function which given the ID of an item and the graph it belongs to it returns the radius attribute
associated with it. If no radius is found the default radius defined above is inserted then returned.
getItemRadius :: Id -> IORef GxlGraphSet -> IO GLdouble
getItemRadius itemId dataStructure = do
mydataStructure <- readIORef dataStructure
let listOfGraphID = getGxlGraphs mydataStructure
-- Create Map of Graph to Attributes
let mapOfGraphAttrs = graphAttrs mydataStructure (head(listOfGraphID))
-- Create Finite Map of Graph to Attributes from the map
let graphFiniteMap = itemAttrs mydataStructure mapOfGraphAttrs itemId
let myRadius = lookupFM graphFiniteMap (itemId,"Radius")
if (myRadius==Nothing)
then do let (ItemInfo a b c d e) = queryItemInfo mydataStructure itemId
let (z,y) = addAttrGetId (myInfoRadius) mydataStructure
modifyIORef dataStructure (\x -> y)
mydataStructure <- readIORef dataStructure
let newList = z:b
let newItemInfo = ItemInfo a newList c d e
let newGraphSet = updateItemInfo mydataStructure itemId newItemInfo
modifyIORef dataStructure (\x -> newGraphSet)
return (defaultRadius::GLdouble)
else do let radius = getAttrValGLfloat (unMaybe (myRadius) )
return (radius)
myInfoRadius = AttrInfo Nothing [] (FourOf10 (Gxl_1_0_1_DTD.Float (show defaultRadius))) radiusAttr
radiusAttr = AttrAttr Nothing "Radius"
Nothing
69
getItemSlices is a function which given the ID of an item and the graph it belongs to it returns the slices attribute
associated with it. If no number of slices is found the default number of slices defined above is inserted then returned.
getItemSlices :: Id -> IORef GxlGraphSet -> IO GLint
getItemSlices itemId dataStructure = do
mydataStructure <- readIORef dataStructure
let listOfGraphID = getGxlGraphs mydataStructure
-- Create Map of Graph to Attributes
let mapOfGraphAttrs = graphAttrs mydataStructure (head(listOfGraphID))
-- Create Finite Map of Graph to Attributes from the map
let graphFiniteMap = itemAttrs mydataStructure mapOfGraphAttrs itemId
let mySlices = lookupFM graphFiniteMap (itemId,"Slices")
if (mySlices==Nothing)
then do let (ItemInfo a b c d e) = queryItemInfo mydataStructure itemId
let (z,y) = addAttrGetId (myInfoSlices) mydataStructure
modifyIORef dataStructure (\x -> y)
mydataStructure <- readIORef dataStructure
let newList = z:b
let newItemInfo = ItemInfo a newList c d e
let newGraphSet = updateItemInfo mydataStructure itemId newItemInfo
modifyIORef dataStructure (\x -> newGraphSet)
return (defaultSlices)
else do return (getAttrValGLint (unMaybe (mySlices) ))
myInfoSlices = AttrInfo Nothing [] (ThreeOf10 (Gxl_1_0_1_DTD.Int (show defaultSlices))) slicesAttr
slicesAttr = AttrAttr Nothing "Slices"
Nothing
getItemStacks is a function which given the ID of an item and the graph it belongs to it returns the stacks attribute
associated with it. If no number of stacks is found the default number of stacks defined above is inserted then returned.
getItemStacks :: Id -> IORef GxlGraphSet -> IO GLint
getItemStacks itemId dataStructure = do
mydataStructure <- readIORef dataStructure
let listOfGraphID = getGxlGraphs mydataStructure
-- Create Map of Graph to Attributes
let mapOfGraphAttrs = graphAttrs mydataStructure (head(listOfGraphID))
-- Create Finite Map of Graph to Attributes from the map
let graphFiniteMap = itemAttrs mydataStructure mapOfGraphAttrs itemId
let myStacks = lookupFM graphFiniteMap (itemId,"Stacks")
if (myStacks==Nothing)
then do let (ItemInfo a b c d e) = queryItemInfo mydataStructure itemId
let (z,y) = addAttrGetId (myInfoStacks) mydataStructure
modifyIORef dataStructure (\x -> y)
mydataStructure <- readIORef dataStructure
let newList = z:b
let newItemInfo = ItemInfo a newList c d e
let newGraphSet = updateItemInfo mydataStructure itemId newItemInfo
modifyIORef dataStructure (\x -> newGraphSet)
return (defaultSlices)
else do return (getAttrValGLint (unMaybe (myStacks) ))
myInfoStacks = AttrInfo Nothing [] (ThreeOf10 (Gxl_1_0_1_DTD.Int (show defaultSlices))) stacksAttr
70
stacksAttr = AttrAttr Nothing "Stacks"
Nothing
getItemColor4 is a function which given the ID of an item and the graph it belongs to it returns the color attribute
associated with it. If no color is found the default color defined above is inserted then returned.
getItemColor4 :: Id -> IORef GxlGraphSet -> IO (Color4 GLfloat)
getItemColor4 nodeId dataStructure = do
mydataStructure <- readIORef dataStructure
--let graphFiniteMap = getGraphFiniteMap currentGraphSet
let listOfGraphID = getGxlGraphs mydataStructure
-- Create Map of Graph to Attributes
let mapOfGraphAttrs = graphAttrs mydataStructure (head(listOfGraphID))
-- Create Finite Map of Graph to Attributes from the map
let graphFiniteMap = itemAttrs mydataStructure mapOfGraphAttrs nodeId
let myColor4 = lookupFM graphFiniteMap (nodeId,"Color4")
if (myColor4 == Nothing)
then do let (ItemInfo a b c d e) = queryItemInfo mydataStructure nodeId
myColorAttrInfo <- myInfoColor
let (z,y) = addAttrGetId (myColorAttrInfo) mydataStructure
modifyIORef dataStructure (\x -> y)
mydataStructure <- readIORef dataStructure
let newList = z:b
let newItemInfo = ItemInfo a newList c d e
let newGraphSet = updateItemInfo mydataStructure nodeId newItemInfo
modifyIORef dataStructure (\x -> newGraphSet)
return (defaultColor)
else return (getAttrValColor4 (unMaybe (myColor4) ))
colorAttr = AttrAttr Nothing "Color4"
myInfoColor
Nothing
= do let Color4 a b c d = defaultColor
return (AttrInfo Nothing [] (TenOf10 (Tup [Tup_Float (Gxl_1_0_1_DTD.Float (show a)),
Tup_Float (Gxl_1_0_1_DTD.Float (show b)),Tup_Float (Gxl_1_0_1_DTD.Float (show c)),
Tup_Float (Gxl_1_0_1_DTD.Float (show d))])) colorAttr)
getDirectedOrNot is a function which given the ID of an edge and the graph it belongs to it returns whether the edge
is directed or not.
getDirectedOrNot :: Id -> GxlGraphSet -> IO (Prelude.Bool)
getDirectedOrNot edgeId currentGraphSet = do
let listOfGraphID = getGxlGraphs currentGraphSet
let directedBool = directed currentGraphSet edgeId
return directedBool
getListOfEdges is a function which given a GraphSet returns a list of the edges that form it. This list is used to go
over the edges to draw them when this is needed and in many other places as well.
getListOfEdges :: GxlGraphSet -> IO ([Id])
getListOfEdges currentGraphSet = do
let listOfGraphId = getGxlGraphs currentGraphSet
71
if (listOfGraphId/=[]) then do let setOfEdges = edges currentGraphSet (head (listOfGraphId))
let listOfEdges = setToList setOfEdges
return (listOfEdges)
else do return ([])
getFromNode is a function which given the ID of an edge and the graph it belongs to it returns the layout of the node
that the edge is leaving from.
getFromNode :: Id -> GxlGraphSet -> IO (Vertex3 GLfloat)
getFromNode edgeId currentGraphSet = do
let listOfGraphID = getGxlGraphs currentGraphSet
let fromNode = from currentGraphSet (head(listOfGraphID)) edgeId
myLayout <- getNodeLayout (fromNode::Id) currentGraphSet
let fromNodeVertex = vectorToVertex myLayout
return fromNodeVertex
getFromNode is a function which given the ID of an edge and the graph it belongs to it returns the layout of the node
that the edge is incident upon.
getToNode :: Id -> GxlGraphSet -> IO (Vertex3 GLfloat)
getToNode edgeId currentGraphSet = do
let listOfGraphID = getGxlGraphs currentGraphSet
let toNode = to currentGraphSet (head(listOfGraphID)) edgeId
myLayout <- getNodeLayout (toNode::Id) currentGraphSet
let toNodeVertex = vectorToVertex myLayout
return toNodeVertex
vectortoVertex is a function that changes a variable of type Vector 3 into a Vertex 3
vectorToVertex :: (Vector3 GLfloat) -> (Vertex3 GLfloat)
vectorToVertex (Vector3 a b c) = Vertex3 a b c
getEdgeMidPoint is a function which given the ID of an edge and the graph it belongs to it returns the midPoint
attribute associated with it. If no such point is found the default mid point defined above is returned.
getEdgeMidPoint :: Id -> GxlGraphSet -> IO (Vertex3 GLfloat)
getEdgeMidPoint edgeId currentGraphSet = do
--let graphFiniteMap = getGraphFiniteMap currentGraphSet
let listOfGraphID = getGxlGraphs currentGraphSet
-- Create Map of Graph to Attributes
let mapOfGraphAttrs = graphAttrs currentGraphSet (head(listOfGraphID))
-- Create Finite Map of Graph to Attributes from the map
let graphFiniteMap = itemAttrs currentGraphSet mapOfGraphAttrs edgeId
let myMidPoint = lookupFM graphFiniteMap (edgeId,"midPoint")
if (myMidPoint==Nothing)
then do return (defaultNoMidPoint)
else do let midPointVector = getAttrValVector3 (unMaybe (myMidPoint))
let midPointVertex = vectorToVertex midPointVector
return midPointVertex
72
bendEdgeMidPoint is a function which given the ID of an edge and the graph it belongs to it returns the midPoint
attribute associated with it. This function is called when we would like to bend the edge. If no such point is found
then we insert a midPoint which is the midpoint of the segment joining the two nodes which the edge connects. This
will allow us to bend edges that are initially straight.
bendEdgeMidPoint :: Id -> IORef GxlGraphSet -> IO (Vertex3 GLfloat)
bendEdgeMidPoint edgeId dataStructure = do
currentGraphSet <- readIORef dataStructure
--let graphFiniteMap = getGraphFiniteMap currentGraphSet
let listOfGraphID = getGxlGraphs currentGraphSet
-- Create Map of Graph to Attributes
let mapOfGraphAttrs = graphAttrs currentGraphSet (head(listOfGraphID))
-- Create Finite Map of Graph to Attributes from the map
let graphFiniteMap = itemAttrs currentGraphSet mapOfGraphAttrs edgeId
let myMidPoint = lookupFM graphFiniteMap (edgeId,"midPoint")
if (myMidPoint==Nothing)
then do let startNode = from currentGraphSet (head(listOfGraphID)) edgeId
let endNode = to currentGraphSet (head(listOfGraphID)) edgeId
startLayout <- getNodeLayout startNode currentGraphSet
endLayout <- getNodeLayout endNode currentGraphSet
let midPointLayout = midPointVector startLayout endLayout
let (ItemInfo a b c d e) = queryItemInfo currentGraphSet edgeId
let (z,y) = addAttrGetId (myInfov midPointLayout) currentGraphSet
modifyIORef dataStructure (\x -> y)
mydataStructure <- readIORef dataStructure
let newList = z:b
let newItemInfo = ItemInfo a newList c d e
let newGraphSet = updateItemInfo mydataStructure edgeId newItemInfo
modifyIORef dataStructure (\x -> newGraphSet)
let midPointVertex = vectorToVertex midPointLayout
return midPointVertex
else do let midPointVector = getAttrValVector3 (unMaybe (myMidPoint))
let midPointVertex = vectorToVertex midPointVector
return midPointVertex
midPointVector (Vector3 a b c) (Vector3 x y z) = Vector3 ((a+x)/2) ((b+y)/2) ((c+z)/2)
myAttr1 = AttrAttr Nothing "midPoint" Nothing
myInfov (Vector3 x y z) = AttrInfo Nothing [] (TenOf10 (Tup [Tup_Float (Gxl_1_0_1_DTD.Float (show x)),
Tup_Float (Gxl_1_0_1_DTD.Float (show y)),Tup_Float (Gxl_1_0_1_DTD.Float (show z))])) myAttr1
The following functions extract the components of a Vector.
xcoord :: Vector3 a -> a
xcoord (Vector3 a b c) = a
ycoord :: Vector3 a -> a
ycoord (Vector3 a b c) = b
zcoord :: Vector3 a -> a
zcoord (Vector3 a b c) = c
73
unMaybe is a function which is used to transform variables from type Maybe a to a.
unMaybe :: Maybe a -> a
unMaybe (Just a) = a
GraphManipulation is a module which gives us functionality to scale a graph and rotate it. The main idea used is we
split the graph into nodes and edges and then scale and rotate each item individually. The secret it hides is how the
graph is rotated and scaled and the mathematics and algorithms behind it.
module GraphManipulation (scaleGraph,graphRotationButtonDown)
import
import
import
import
import
import
import
import
import
import
import
import
import
import
import
where
Gxl_1_0_1_DTD
GXL_DTD
INIT
Data.IORef
Graphics.Rendering.OpenGL.GL
Graphics.Rendering.OpenGL.GLU
Graphics.UI.GLUT
ViewDataStructure
GraphInterface
Node
Utils
GxlGraphSetManage
Text.XML.HaXml.OneOfN
SettingsDataStructure
Additional
scaleGraph is the function which scales a given graph. the basic idea is that we get the list of nodes and edges and
scale each seperately.
scaleGraph::IORef GxlGraphSet -> GLfloat->IORef SettingsDataStructure -> IO()
scaleGraph dataStructure factor settings = do
myGraphSet <- readIORef dataStructure
myNodeList <- getListOfNodes myGraphSet
nodeScaleLoop dataStructure factor myNodeList settings
myEdgeList <- getListOfEdges myGraphSet
edgeScaleLoop dataStructure factor myEdgeList settings
return()
nodeScaleLoop is the function which loops through the list of nodes and multiplies the layout of each node by the
factor we wish to scale the graph by.
nodeScaleLoop :: IORef GxlGraphSet -> GLfloat -> [GXL_DTD.Id] -> IORef SettingsDataStructure -> IO()
nodeScaleLoop dataStructure factor (x:xs) settings = do
mydataStructure <- readIORef dataStructure
myNode <- getNode x dataStructure
--get current layout
let nodeLayout = extractLayout myNode
let xcoordinate = xcoordVector nodeLayout
74
let ycoordinate = ycoordVector nodeLayout
let zcoordinate = zcoordVector nodeLayout
--multiply by factor
let newxcoordinate = xcoordinate * factor
let newycoordinate = ycoordinate * factor
let newzcoordinate = zcoordinate * factor
let newNodeLayout = Vector3 newxcoordinate newycoordinate (newzcoordinate::GLfloat)
--change the layout
let newLayoutAttribute = processLayout newNodeLayout
changeAttr dataStructure "Layout" x newLayoutAttribute
nodeScaleLoop dataStructure factor xs settings
nodeScaleLoop dataStructure _ _ _ = do return ()
edgeScaleLoop is the function which loops through the list of edges and multiplies the control’s point layout of each
edge by the factor we wish to scale the graph by. If the edge is straight then no work needs to be done as if the node
gets scaled then since the edges attach the nodes they will get scaled.
edgeScaleLoop :: IORef GxlGraphSet -> GLfloat -> [GXL_DTD.Id] -> IORef SettingsDataStructure -> IO()
edgeScaleLoop dataStructure factor (x:xs) settings = do
mydataStructure <- readIORef dataStructure
myEdgeMidPoint <- getEdgeMidPoint x mydataStructure
if (myEdgeMidPoint /= defaultNoMidPoint)
--bent edge
then do
--get current layout
let xcoordinate = xcoordVertex myEdgeMidPoint
let ycoordinate = ycoordVertex myEdgeMidPoint
let zcoordinate = zcoordVertex myEdgeMidPoint
--multiply by factor
let newxcoordinate = xcoordinate * factor
let newycoordinate = ycoordinate * factor
let newzcoordinate = zcoordinate * factor
let newEdgeLayout = Vertex3 newxcoordinate newycoordinate (newzcoordinate::GLfloat)
let newLayoutAttribute = processLayoutVertex newEdgeLayout
--change the layout
changeAttr dataStructure "midPoint" x newLayoutAttribute
edgeScaleLoop dataStructure factor xs settings
else edgeScaleLoop dataStructure factor xs settings
edgeScaleLoop dataStructure _ _ _ = do return ()
Here are a few auxillary functions used to extract the x, y and z components from vectors and vertices.
xcoordVector::Vector3 a -> a
xcoordVector (Vector3 a b c) = a
xcoordVertex::Vertex3 a -> a
xcoordVertex (Vertex3 a b c) = a
ycoordVector::Vector3 a -> a
ycoordVector (Vector3 a b c) = b
ycoordVertex::Vertex3 a -> a
ycoordVertex (Vertex3 a b c) = b
75
zcoordVector::Vector3 a -> a
zcoordVector (Vector3 a b c) = c
zcoordVertex::Vertex3 a -> a
zcoordVertex (Vertex3 a b c) = c
processLayoutVertex and processLayoutVector are functions that give us the attribute value corresponding to the
vertex/vector passed so that we can insert them into the attributes finite map in the goal of updateing the layout.
processLayoutVertex :: Vertex3 GLfloat -> AttrValue
processLayoutVertex (Vertex3 first second third) = (TenOf10 (Tup [Tup_Float (Gxl_1_0_1_DTD.Float (show first)),
Tup_Float (Gxl_1_0_1_DTD.Float (show second)),Tup_Float (Gxl_1_0_1_DTD.Float (show third))]))
processLayout :: Vector3 GLfloat -> AttrValue
processLayout (Vector3 first second third) = (TenOf10 (Tup [Tup_Float (Gxl_1_0_1_DTD.Float (show first)),
Tup_Float (Gxl_1_0_1_DTD.Float (show second)),Tup_Float (Gxl_1_0_1_DTD.Float (show third))]))
graphRotationButtonDown is the motion callback for rotation. As long as the mouse button is down and we are
moving the mouse. The graph will be rotated in the direction specified by the mouse movement. Of course the
movement will be divided into small units so that the movement is progressive with the movement. The actual
calculation that determines the angle based on the mouse movement is donw in calculateGraphRotation. Once the
angle is computed then we call the rotateGraph function to rotate the Graph by the resulting computed angles. We
will use the View Data Structure here to put the horizontal and vertical angles in it.
graphRotationButtonDown :: IORef View -> IORef Prelude.Float -> IORef Prelude.Float -> IORef Prelude.Float
-> IORef Prelude.Float -> IORef GxlGraphSet -> IORef [GLdouble] -> GLsizei -> GLsizei -> IO()
graphRotationButtonDown graphView oldx oldy newx newy dataStructure matrixStore x y = do
--get the old position
oy <- readIORef oldy
ox <- readIORef oldx
--get the new position
modifyIORef newy (\d ->(fromIntegral y))
modifyIORef newx (\d ->(fromIntegral x))
ny <- readIORef newy
nx <- readIORef newx
--get the difference in the horizontal and vertical components
let diffy = ny - oy
let diffx = nx - ox
--calculate the angles
calculateGraphRotation oldx oldy newx newy graphView
--update the old coordinates to the new ones
modifyIORef oldx (\d ->nx)
modifyIORef oldy (\d ->ny)
myGraph <- readIORef graphView
--rotate the graph
rotateGraph dataStructure (read (show (getHorizontal myGraph))::GLfloat)
(read (show (getVertical myGraph))::GLfloat)
return()
76
calculateGraphRotation is a function as mentionned above that given a certain mouse movement will calculate the
corresponding angle. Mouse sensitivity is controlled here and the division of the movement is also.
calculateGraphRotation :: IORef Prelude.Float->IORef Prelude.Float->IORef Prelude.Float
->IORef Prelude.Float->IORef View->IO ()
calculateGraphRotation oldx oldy newx newy graph = do
--division of movement
let moveDiff = 0.05
--get old and new position
ny <- readIORef newy
oy <- readIORef oldy
nx <- readIORef newx
ox <- readIORef oldx
--get the difference
let diffy = ny-oy
let diffx = nx-ox
--get the vertical angle
if (diffy <=(-1))
then do
myGraph <- readIORef graph
let newVertical = (-moveDiff)
newGraph <- changeVertical myGraph newVertical
modifyIORef graph (\x -> newGraph)
postRedisplay Nothing
else if (diffy >= 1)
then do
myGraph <- readIORef graph
let newVertical = (moveDiff)
newGraph <- changeVertical myGraph newVertical
modifyIORef graph (\x -> newGraph)
postRedisplay Nothing
else return()
--get the horizontal angle
if (diffx <=(-1))
then do
myGraph <- readIORef graph
let newHorizontal = (-moveDiff)
newGraph <- changeHorizontal myGraph newHorizontal
modifyIORef graph (\x -> newGraph)
postRedisplay Nothing
else if (diffx >= 1)
then do
myGraph <- readIORef graph
let newHorizontal = (moveDiff)
newGraph <- changeHorizontal myGraph newHorizontal
modifyIORef graph (\x -> newGraph)
postRedisplay Nothing
else
return()
rotateGraph is the function which rotates a given graph by an angle alpha horizontally and by angle beta vertically.
the basic idea is that we get the list of nodes and edges and we rotate each seperately.
77
rotateGraph :: IORef GxlGraphSet -> GLfloat -> GLfloat ->IO()
rotateGraph dataStructure alpha beta = do
myGraphSet <- readIORef dataStructure
myNodeList <- getListOfNodes myGraphSet
nodeRotateLoop dataStructure alpha beta myNodeList
myEdgeList <- getListOfEdges myGraphSet
edgeRotateLoop dataStructure alpha beta myEdgeList
return()
nodeRotateLoop is the function which loops through the list of nodes and rotates the layout of each node by angle
alpha horizontally and by angle beta vertically.
nodeRotateLoop :: IORef GxlGraphSet -> GLfloat -> GLfloat -> [GXL_DTD.Id] -> IO()
nodeRotateLoop dataStructure alpha beta (x:xs) = do
mydataStructure <- readIORef dataStructure
--get current layout
myNode <- getNode x dataStructure
let nodeLayout = extractLayout myNode
--rotate horizontally
newNodeLayout <- rotateVectorX nodeLayout alpha
--rotate the result vertically
newNodeLayout1 <- rotateVectorY newNodeLayout beta
--update the layout
let newLayoutAttribute = processLayout newNodeLayout1
changeAttr dataStructure "Layout" x newLayoutAttribute
nodeRotateLoop dataStructure alpha beta xs
nodeRotateLoop dataStructure _ _ _ = do return ()
edgeScaleLoop is the function which loops through the list of edges and rotates the control’s point layout of each edge
by angle alpha horizontally and by angle beta vertically. If the edge is straight then no work needs to be done as if
the node gets rotated then since the edges attach the nodes they will get rotated.
edgeRotateLoop :: IORef GxlGraphSet -> GLfloat -> GLfloat -> [GXL_DTD.Id] -> IO()
edgeRotateLoop dataStructure alpha beta (x:xs) = do
mydataStructure <- readIORef dataStructure
myEdgeMidPoint <- getEdgeMidPoint x mydataStructure
if (myEdgeMidPoint /= defaultNoMidPoint)
then do
--edge is bent
--rotate horizontally
newEdgeLayout <- rotateVertexX myEdgeMidPoint alpha
--rotate the result vertically
newEdgeLayout1 <- rotateVertexY newEdgeLayout beta
--update the layout
let newLayoutAttribute = processLayoutVertex newEdgeLayout1
changeAttr dataStructure "midPoint" x newLayoutAttribute
edgeRotateLoop dataStructure alpha beta xs
else edgeRotateLoop dataStructure alpha beta xs
edgeRotateLoop dataStructure _ _ _ = do return ()
78
The following functions offer us interface to get a new vector/vertex resulting from the rotation a given vector by a
given angle around a given axis. I.e rotateVectorX vector angle will for example rotate the vector vector by an angle
angle around the X-Axis.
rotateVectorX:: Vector3 GLfloat -> GLfloat -> IO(Vector3 GLfloat)
rotateVectorX vector angle = do
let Vector3 x y z = vector
let newX = x
let newY = y*cos(angle)-z*sin(angle)
let newZ = y*sin(angle)+z*cos(angle)
let newVector = Vector3 newX newY newZ
return newVector
rotateVectorY:: Vector3 GLfloat -> GLfloat -> IO(Vector3 GLfloat)
rotateVectorY vector angle = do
let Vector3 x y z = vector
let newX = x*cos(angle)+z*sin(angle)
let newY = y
let newZ = ((-1)*x*sin(angle))+(z*cos(angle))
let newVector = Vector3 newX newY newZ
return newVector
rotateVectorZ:: Vector3 GLfloat -> GLfloat -> IO(Vector3 GLfloat)
rotateVectorZ vector angle = do
let Vector3 x y z = vector
let newX = (x*cos(angle))-(y*sin(angle))
let newY = (x*sin(angle))+(y*cos(angle))
let newZ = z
let newVector = Vector3 newX newY newZ
return newVector
rotateVertexX:: Vertex3 GLfloat -> GLfloat -> IO(Vertex3 GLfloat)
rotateVertexX vertex angle = do
let Vertex3 x y z = vertex
let newX = x
let newY = y*cos(angle)-z*sin(angle)
let newZ = y*sin(angle)+z*cos(angle)
let newvertex = Vertex3 newX newY newZ
return newvertex
rotateVertexY:: Vertex3 GLfloat -> GLfloat -> IO(Vertex3 GLfloat)
rotateVertexY vertex angle = do
let Vertex3 x y z = vertex
let newX = x*cos(angle)+z*sin(angle)
let newY = y
let newZ = ((-1)*x*sin(angle))+(z*cos(angle))
let newvertex = Vertex3 newX newY newZ
return newvertex
rotateVertexZ:: Vertex3 GLfloat -> GLfloat -> IO(Vertex3 GLfloat)
rotateVertexZ vertex angle = do
let Vertex3 x y z = vertex
let newX = (x*cos(angle))-(y*sin(angle))
79
let newY = (x*sin(angle))+(y*cos(angle))
let newZ = z
let newvertex = Vertex3 newX newY newZ
return newvertex
ItemManipulation is the module which offers us functions to remove Items ( edges or nodes) as well as functions to
change their attributes (color, radius , number of stacks, number of slices and label). These functions operate on
Items not discriminating between nodes and edges. The secret it hides is the way these items are manipulated and
how the user is prompted for input and the way the input is processed.
module ItemManipulation (removeItem,colorChange,radiusChange,stacksChange,slicesChange,labelChange)
import
import
import
import
import
import
import
import
import
import
import
import
import
import
import
import
import
import
import
import
import
import
import
where
Gxl_1_0_1_DTD
GXL_DTD
INIT
Data.IORef
Graphics.Rendering.OpenGL.GL hiding (VertexSpec.Color)
Graphics.Rendering.OpenGL.GLU
Graphics.UI.GLUT hiding (Graphics.Rendering.OpenGL.GL.VertexSpec.Color)
UndoDataStructure
ViewDataStructure
GraphInterface
Node
Utils
Interface
GxlGraphSetManage
Text.XML.HaXml.OneOfN
PickObject
Graphics.UI.WX hiding (KeyUp,KeyDown,motion,WXCore.WxcTypes.Size,Classes.position,Attributes.get)
Graphics.UI.WXCore.WxcTypes
Graphics.UI.WXCore hiding (WxcClasses.View)
GHC.Float
Data.Char
SettingsDataStructure
Additional
Here we define a few constants that we will use as default return values in case the dialog boxes are cancelled so that
we still return a value.
minimumValueFloat::Prelude.Float
minimumValueFloat = 0.3
minimumValueInt::Prelude.Int
minimumValueInt = 2
removeItem is a function which removes an item that the user selects. We do this as follows: first we call the picking
function which returns to us an ID of the obeject selected. If no object is picked corresponding to ID = 0 then we
have nothing to do and we return. Otherwise if an edge is selected, then we proceed to delete the edge and we use
the update function so that we can do. If a node is slected, we delete all the edges from and to that node first and
then remove the node. The same procedure as for edge is done so that we can undo.
80
removeItem :: GLsizei -> GLsizei -> IORef View -> IORef GxlGraphSet -> IORef UndoDataStructure -> IORef [GLdouble]
-> IORef SettingsDataStructure -> IO ()
removeItem x y view currentGraphSet undoDataStructure matrixStore settings= do
myGraphSet <- readIORef currentGraphSet
myEdgeList <- getListOfEdges myGraphSet
myId <- selectObject view x y currentGraphSet matrixStore settings
if (myId/=0)
then do
updateGraphDataStructure myGraphSet currentGraphSet undoDataStructure
let myInnerId = (read (show (myId)))::GXL_DTD.Id
if (isNode myGraphSet myInnerId ==True)
then do
getEdgesConnected currentGraphSet myInnerId undoDataStructure myEdgeList
let newGraphSet = delItem myGraphSet myInnerId
modifyIORef currentGraphSet (\x->newGraphSet)
else do let newGraphSet = delItem myGraphSet myInnerId
modifyIORef currentGraphSet (\x->newGraphSet)
else return()
return()
getEdgesConnected is a function which given the Id of a node and the list of edges will remove all the edges that are
connected to that node so that we can remove the node at a later stage.
getEdgesConnected :: IORef GxlGraphSet -> GXL_DTD.Id -> IORef UndoDataStructure -> [ItemId] -> IO()
getEdgesConnected currentGraphSet id undoDataStructure (edge:edges) = do
myGraphSet <- readIORef currentGraphSet
let listOfGraphId = getGxlGraphs myGraphSet
if ( (to myGraphSet (head (listOfGraphId)) edge==id) || (from myGraphSet (head (listOfGraphId)) edge==id) ) then do
let newGraphSet = delItem myGraphSet id
updateGraphDataStructure newGraphSet currentGraphSet undoDataStructure
getEdgesConnected currentGraphSet id undoDataStructure edges
else getEdgesConnected currentGraphSet id undoDataStructure edges
getEdgesConnected currentGraphSet id _ []
= return ()
colorChange is a function which changes the color of the item the user selects. First we call the picking function so
that the user may select the item he whiches the color of to be changed. If the Id is 0. I.e no item was selected then
we have nothing to do. If the user selects an item (edge or node) then we pass the call to openColorDialog which will
in turn prompt the user for a color. Once we have the color we update the attribute.
colorChange:: GLsizei -> GLsizei -> IORef GxlGraphSet -> IORef View -> IORef UndoDataStructure ->IORef [GLdouble]
-> IORef SettingsDataStructure -> IO ()
colorChange x y currentGraphSet view undoDataStructure matrixStore settings= do
myGraphSet <- readIORef currentGraphSet
myId <- selectObject view x y currentGraphSet matrixStore settings
if (myId/=0)
then do updateGraphDataStructure myGraphSet currentGraphSet undoDataStructure
let myInnerId = (read (show (myId)))::GXL_DTD.Id
myColor <- openColorDialog
if (myColor==Nothing)
then do return ()
81
else do
myAttrVal <- processColor (unMaybe(myColor))
changeAttr currentGraphSet "Color4" myInnerId myAttrVal
return ()
else return()
processColor is a function which converts the color representation used in wxHaskell where the RGB index goes from
0..255 to the one used in OpenGL 0..1 and return an AttrValue that we can use to change the attribute.
processColor:: Color -> IO(AttrValue)
processColor myColor = do
let a = read(show(colorRed myColor))::Prelude.Float
let b = read(show(colorBlue myColor))::Prelude.Float
let c = read(show(colorGreen myColor))::Prelude.Float
let red = show (a/255)
let blue = show (b/255)
let green = show (c/255)
let newColor = TenOf10 (Tup [Tup_Float (Gxl_1_0_1_DTD.Float red), Tup_Float (Gxl_1_0_1_DTD.Float green),
Tup_Float (Gxl_1_0_1_DTD.Float blue), Tup_Float (Gxl_1_0_1_DTD.Float "1") ])
return (newColor)
openColor dialog uses wxHaskell facility to display a color dialog where the user may pick the color he whiches. We
prompt the user and get the color and return it.
openColorDialog::IO(Maybe (Color))
openColorDialog = do
f <- frameCreateDefault ("Color Dialog")
y<-colorDialog f red
if (y==Nothing)
then do return(Nothing)
else do return (Just (unMaybe(y)))
openFloatDialog is a function which prompts the user with a wxHaskell text dialog and asks for a Float. If nothing
is returned we return the current value. Also we have a restriction that the number entered must be bigger then
minimumValueFolat otherwise that minimum is returned. We use reads to parse the text into a number. If garbage
is entered then we return the current value. The current value is shown by default when the dialog is first rendered.
openFloatDialog::Prelude.String -> Prelude.Float -> IO(Prelude.Float)
openFloatDialog myString currentValue = do
f <- frameCreateDefault (myString++" Dialog")
y<-textDialog f ("Please Enter "++myString) myString (show(currentValue))
if (null y)
then do return(currentValue)
else do let list=(reads y)::[(Prelude.Float, String)]
if (list ==[] || (snd(head(list))/=""))
then do return(currentValue)
else do let x=(read (y))::Prelude.Float
return (max minimumValueFloat x)
openIntDialog is a function which prompts the user with a wxHaskell text dialog and asks for an Int. If nothing
is returned we return the current value. Also we have a restriction that the number entered must be bigger then
82
minimumValueInt otherwise that minimum is returned. We use reads to parse the text into a number. If garbage is
entered then we return the current value. The current value is shown by default when the dialog is first rendered.
openIntDialog::Prelude.String -> Prelude.Int -> IO(Prelude.Int)
openIntDialog myString currentValue = do
f <- frameCreateDefault (myString++" Dialog")
y<-textDialog f ("Please Enter "++myString) myString (show(currentValue))
if (null y)
then do return(currentValue)
else do let list=(reads y)::[(Prelude.Float, String)]
if (list ==[] || (snd(head(list))/=""))
then do return(currentValue)
else do let x=(read (y))::Prelude.Float
let z = float2Int x
return (max minimumValueInt z)
The following functions radiusChange, slicesChange, stacksChange and labelChange all work in a similar fashion. An
item is selected, if its not a node nor an edge then we have nothing to do. Otherwise we prompt the user for new
values using WxHaskell facilities and update the attrbute value accordingly.
radiusChange is a function which changes the radius of an item in a similar fashion as the functions described above.
radiusChange::GLsizei -> GLsizei -> IORef GxlGraphSet ->IORef View -> IORef UndoDataStructure ->IORef [GLdouble]
-> IORef SettingsDataStructure -> IO ()
radiusChange x y currentGraphSet view undoDataStructure matrixStore settings = do
myGraphSet <- readIORef currentGraphSet
myId <- selectObject view x y currentGraphSet matrixStore settings
if (myId/=0)
then do updateGraphDataStructure myGraphSet currentGraphSet undoDataStructure
let myInnerId = (read (show (myId)))::GXL_DTD.Id
currentRadius <- getItemRadius myInnerId currentGraphSet
myRadius <- openFloatDialog "Radius" (read(show (currentRadius))::Prelude.Float)
myAttrVal <- processFloat myRadius
changeAttr currentGraphSet "Radius" myInnerId myAttrVal
return ()
else return()
slicesChange is a function which changes the number of slices of an item in a similar fashion as the functions described
above.
slicesChange::GLsizei -> GLsizei -> IORef GxlGraphSet ->IORef View -> IORef UndoDataStructure -> IORef [GLdouble]
-> IORef SettingsDataStructure -> IO ()
slicesChange x y currentGraphSet view undoDataStructure matrixStore settings = do
myGraphSet <- readIORef currentGraphSet
myId <- selectObject view x y currentGraphSet matrixStore settings
if (myId/=0)
then do updateGraphDataStructure myGraphSet currentGraphSet undoDataStructure
let myInnerId = (read (show (myId)))::GXL_DTD.Id
currentSlices <- getItemSlices myInnerId currentGraphSet
mySlices <- openIntDialog "Slices" (read(show (currentSlices))::Prelude.Int)
myAttrVal <- processInt mySlices
83
changeAttr currentGraphSet "Slices" myInnerId myAttrVal
return ()
else return()
stacksChange is a function which changes the number of stacks of an item in a similar fashion as the functions
described above.
stacksChange::GLsizei -> GLsizei -> IORef GxlGraphSet ->IORef View -> IORef UndoDataStructure -> IORef [GLdouble]
-> IORef SettingsDataStructure -> IO ()
stacksChange x y currentGraphSet view undoDataStructure matrixStore settings = do
myGraphSet <- readIORef currentGraphSet
myId <- selectObject view x y currentGraphSet matrixStore settings
if (myId/=0)
then do updateGraphDataStructure myGraphSet currentGraphSet undoDataStructure
let myInnerId = (read (show (myId)))::GXL_DTD.Id
currentStacks <- getItemStacks myInnerId currentGraphSet
myStacks <- openIntDialog "Stacks" (read(show (currentStacks))::Prelude.Int)
myAttrVal <- processInt myStacks
changeAttr currentGraphSet "Stacks" myInnerId myAttrVal
return ()
else return()
labelChange is a function which changes the label of an item in a similar fashion as the functions described above.
labelChange::GLsizei -> GLsizei -> IORef GxlGraphSet ->IORef View -> IORef UndoDataStructure -> IORef [GLdouble]
-> IORef SettingsDataStructure -> IO ()
labelChange x y currentGraphSet view undoDataStructure matrixStore settings = do
myGraphSet <- readIORef currentGraphSet
myId <- selectObject view x y currentGraphSet matrixStore settings
if (myId/=0)
then do updateGraphDataStructure myGraphSet currentGraphSet undoDataStructure
let myInnerId = (read (show (myId)))::GXL_DTD.Id
currentLabel <- getItemLabel myInnerId currentGraphSet
myLabel <- openTextDialog currentLabel
myAttrVal <- processString myLabel
changeAttr currentGraphSet "Label" myInnerId myAttrVal
return ()
else return()
processFloat is a function which takes in a float and converts it to a float attribute value so it may be inserted into
the attribute finite map.
processFloat::Prelude.Float -> IO(AttrValue)
processFloat number = do
let newNumber = FourOf10 (Gxl_1_0_1_DTD.Float (show(number)))
return(newNumber)
processInt is a function which takes in an integer and converts it to an int attribute value so it may be inserted into
the attribute finite map.
84
processInt::Prelude.Int -> IO(AttrValue)
processInt number = do
let newNumber = ThreeOf10 (Gxl_1_0_1_DTD.Int (show(number)))
return(newNumber)
processString is a function which takes in a string and converts it to a string attribute value so it may be inserted
into the attribute finite map.
processString::Prelude.String -> IO(AttrValue)
processString myString = do
let newString = FiveOf10 (Gxl_1_0_1_DTD.GxlString (show(myString)))
return(newString)
openTextDialog is a function which uses wxHaskell facilities to prompt the user for a string, it takes the string and
converts the character to capital letters as this is what we have in the label display list. The current label is shown
as default when the dialog is first rendered.
openTextDialog::Prelude.String -> IO(Prelude.String)
openTextDialog currentValue = do
f <- frameCreateDefault ("Label Dialog")
y<-textDialog f ("Please Enter Label") "Label" (currentValue)
return (map toUpper y)
unMaybe is a function which is used to transform variables from type Maybe a to a.
unMaybe :: Maybe a -> a
unMaybe (Just a) = a
LabelDisplay is the module which gives us facilities to display the labels (text) on the screen. The secret it hides is
how strings are outputed on the screen. The code that forms this module is very closely based on font.hs which is
one of the Redbook examples that installs with OpengGL. Therefore we took the freedom to reuse this code without
having to write our own subroutines to display text. This copyright of this code is owned by Copyright (c) 1993-1997,
Silicon Graphics, Inc..
module LabelDisplay (glRasterPos2s,makeRasterFont,printString)
import
import
import
import
import
import
import
import
where
Data.Char
Data.IORef ( IORef, newIORef, readIORef, modifyIORef, writeIORef)
Data.FiniteMap
IO
Graphics.Rendering.OpenGL.GL
Graphics.Rendering.OpenGL.GLU
Graphics.UI.GLUT.Callbacks.Window ( MouseButton )
Graphics.UI.GLUT.Window
85
import Graphics.UI.GLUT hiding (MenuItem)
import Graphics.UI.WX hiding (KeyUp,KeyDown,color,motion,WXCore.WxcTypes.Size,Classes.position,Attributes.get)
import Graphics.UI.WXCore.Frame
import System.Exit(exitWith, ExitCode(ExitSuccess), exitFailure)
import Control.Monad ( liftM, zipWithM_ )
import Data.Char
( ord )
import Data.List
( genericLength )
import Foreign hiding (rotate)
foreign import "glBitmap" unsafe glBitmap :: GLsizei -> GLsizei
-> GLfloat -> GLfloat
-> GLfloat -> GLfloat
-> Ptr GLubyte -> IO ()
foreign import "glRasterPos2s" unsafe glRasterPos2s :: GLshort -> GLshort -> IO ()
spaceBytes :: [GLubyte]
spaceBytes = [
0x00, 0x00, 0x00, 0x00, 0x00, 0x00, 0x00, 0x00, 0x00, 0x00, 0x00, 0x00, 0x00 ]
lettersBytes :: [[GLubyte]]
lettersBytes = [
[0x00, 0x00, 0xc3, 0xc3,
[0x00, 0x00, 0xfe, 0xc7,
[0x00, 0x00, 0x7e, 0xe7,
[0x00, 0x00, 0xfc, 0xce,
[0x00, 0x00, 0xff, 0xc0,
[0x00, 0x00, 0xc0, 0xc0,
[0x00, 0x00, 0x7e, 0xe7,
[0x00, 0x00, 0xc3, 0xc3,
[0x00, 0x00, 0x7e, 0x18,
[0x00, 0x00, 0x7c, 0xee,
[0x00, 0x00, 0xc3, 0xc6,
[0x00, 0x00, 0xff, 0xc0,
[0x00, 0x00, 0xc3, 0xc3,
[0x00, 0x00, 0xc7, 0xc7,
[0x00, 0x00, 0x7e, 0xe7,
[0x00, 0x00, 0xc0, 0xc0,
[0x00, 0x00, 0x3f, 0x6e,
[0x00, 0x00, 0xc3, 0xc6,
[0x00, 0x00, 0x7e, 0xe7,
[0x00, 0x00, 0x18, 0x18,
[0x00, 0x00, 0x7e, 0xe7,
[0x00, 0x00, 0x18, 0x3c,
[0x00, 0x00, 0xc3, 0xe7,
[0x00, 0x00, 0xc3, 0x66,
[0x00, 0x00, 0x18, 0x18,
[0x00, 0x00, 0xff, 0xc0,
0xc3,
0xc3,
0xc0,
0xc7,
0xc0,
0xc0,
0xc3,
0xc3,
0x18,
0xc6,
0xcc,
0xc0,
0xc3,
0xcf,
0xc3,
0xc0,
0xdf,
0xcc,
0x03,
0x18,
0xc3,
0x3c,
0xff,
0x66,
0x18,
0xc0,
0xc3,
0xc3,
0xc0,
0xc3,
0xc0,
0xc0,
0xc3,
0xc3,
0x18,
0x06,
0xd8,
0xc0,
0xc3,
0xcf,
0xc3,
0xc0,
0xdb,
0xd8,
0x03,
0x18,
0xc3,
0x66,
0xff,
0x3c,
0x18,
0x60,
0xff,
0xc7,
0xc0,
0xc3,
0xc0,
0xc0,
0xcf,
0xc3,
0x18,
0x06,
0xf0,
0xc0,
0xc3,
0xdf,
0xc3,
0xc0,
0xc3,
0xf0,
0x07,
0x18,
0xc3,
0x66,
0xdb,
0x3c,
0x18,
0x30,
0xc3,
0xfe,
0xc0,
0xc3,
0xfc,
0xc0,
0xc0,
0xff,
0x18,
0x06,
0xe0,
0xc0,
0xc3,
0xdb,
0xc3,
0xfe,
0xc3,
0xfe,
0x7e,
0x18,
0xc3,
0xc3,
0xdb,
0x18,
0x18,
0x7e,
0xc3,
0xc7,
0xc0,
0xc3,
0xc0,
0xfc,
0xc0,
0xc3,
0x18,
0x06,
0xf0,
0xc0,
0xdb,
0xfb,
0xc3,
0xc7,
0xc3,
0xc7,
0xe0,
0x18,
0xc3,
0xc3,
0xc3,
0x3c,
0x3c,
0x0c,
0xc3,
0xc3,
0xc0,
0xc3,
0xc0,
0xc0,
0xc0,
0xc3,
0x18,
0x06,
0xd8,
0xc0,
0xff,
0xf3,
0xc3,
0xc3,
0xc3,
0xc3,
0xc0,
0x18,
0xc3,
0xc3,
0xc3,
0x3c,
0x3c,
0x06,
makeRasterFont :: IO DisplayList
makeRasterFont = do
rowAlignment Unpack $= 1
fontDisplayLists@(fontOffset:_) <- genLists 128
let listsStartingWith ch = drop (ord ch) fontDisplayLists
makeLetter dl letter =
0x66,
0xc3,
0xc0,
0xc7,
0xc0,
0xc0,
0xc0,
0xc3,
0x18,
0x06,
0xcc,
0xc0,
0xff,
0xf3,
0xc3,
0xc3,
0xc3,
0xc3,
0xc0,
0x18,
0xc3,
0xc3,
0xc3,
0x66,
0x66,
0x03,
0x3c,
0xc7,
0xe7,
0xce,
0xc0,
0xc0,
0xe7,
0xc3,
0x18,
0x06,
0xc6,
0xc0,
0xe7,
0xe3,
0xe7,
0xc7,
0x66,
0xc7,
0xe7,
0x18,
0xc3,
0xc3,
0xc3,
0x66,
0x66,
0x03,
0x18],
0xfe],
0x7e],
0xfc],
0xff],
0xff],
0x7e],
0xc3],
0x7e],
0x06],
0xc3],
0xc0],
0xc3],
0xe3],
0x7e],
0xfe],
0x3c],
0xfe],
0x7e],
0xff],
0xc3],
0xc3],
0xc3],
0xc3],
0xc3],
0xff]]
86
defineList dl Compile $
withArray letter $
glBitmap 8 13 0 2 10 0
zipWithM_ makeLetter (listsStartingWith ’A’) lettersBytes
makeLetter (head (listsStartingWith ’ ’)) spaceBytes
return fontOffset
printString :: DisplayList -> String
printString fontOffset s =
preservingAttrib [ ListAttributes
listBase $= fontOffset
withArray (stringToGLubytes s)
callLists (genericLength s)
-> IO ()
] $ do
$
UnsignedByte
stringToGLubytes :: String -> [GLubyte]
stringToGLubytes = map (fromIntegral . ord)
Module Layout gives us the function which generates the default layout in case this information is missing from the
graph or partial, that is some items have layout and some don’t. In this case the default layout is only applied to the
items with missing layout. For items which already have layout information such information is kept intact. Note also
that we only specify layout for nodes as edges unless bent do not carry any layout information. The layout generation
function here we use is a very simple one which works in the following manner: It first places the first item at (j 0
0) and then the next at (0 j 0) and the next one at (0 0 j) then finally j is incremented by 1 and the rest of the
locations are generated in a similar fashion. We arbitrarily start with j=3. This module has been designed in order
to allow more advanced layout generation algorithms to be easily incorporated. This modules hides the function used
to generate the layout.
module Layout (generateLayout) where
import
import
import
import
import
import
import
import
import
import
import
import
import
import
Text.XML.HaXml.Xml2Haskell
Gxl_1_0_1_DTD
GXL_DTD
INIT
Data.IORef
Graphics.Rendering.OpenGL.GL
Graphics.Rendering.OpenGL.GLU
Graphics.UI.GLUT
GraphInterface
Text.XML.HaXml.OneOfN
Data.FiniteMap
GxlGraphSetXml
Utils
GxlGraphSetManage
generateLayout is the function which gets the list of nodes of the graph and forwards the call to generate a layout to
layoutGeneration.
generateLayout:: IORef GxlGraphSet -> IO ()
generateLayout dataStructure = do
87
myGraphSet <- readIORef dataStructure
myNodeList <- getListOfNodes myGraphSet
layoutGeneration dataStructure 0 3 myNodeList
return()
layoutGeneration is a function that recursively goes through the list of the nodes and checks each node if it has layout
information. If such information is present then the functions just moves on to the next node. If no such information
is found then the node is given a layout as per the scheme described above.
layoutGeneration:: IORef GxlGraphSet -> Prelude.Int -> Prelude.Int -> [GXL_DTD.Id] -> IO()
layoutGeneration dataStructure i j (x:xs) = do
mydataStructure <- readIORef dataStructure
myNode <- getNode x dataStructure
if (i==0 ‘mod‘ 3)
then do
let newNodeLayout = Vector3 j 0 0
let listOfGraphID = getGxlGraphs mydataStructure
let mapOfGraphAttrs = graphAttrs mydataStructure (head(listOfGraphID))
let graphFiniteMap = itemAttrs mydataStructure mapOfGraphAttrs x
let myLayout = lookupFM graphFiniteMap (x,"Layout")
--if the layout is missing
if (myLayout == Nothing)
then do
--generate layout for that item by modifying its attribute list
let (ItemInfo a b c d e) = queryItemInfo mydataStructure x
let (z,y) = addAttrGetId (myInfox j) mydataStructure
modifyIORef dataStructure (\x -> y)
mydataStructure <- readIORef dataStructure
let newList = z:b
let newItemInfo = ItemInfo a newList c d e
let newGraphSet = updateItemInfo mydataStructure x newItemInfo
--update the graph set
modifyIORef dataStructure (\x -> newGraphSet)
layoutGeneration dataStructure (i+1) j xs
else do
--if layout info is there do nothing and go to next item
layoutGeneration dataStructure (i) j xs
else if (i==1 ‘mod‘ 3)
then do
let newNodeLayout = Vector3 0 j 0
let listOfGraphID = getGxlGraphs mydataStructure
let mapOfGraphAttrs = graphAttrs mydataStructure (head(listOfGraphID))
let graphFiniteMap = itemAttrs mydataStructure mapOfGraphAttrs x
let myLayout = lookupFM graphFiniteMap (x,"Layout")
if (myLayout == Nothing)
then do
let (ItemInfo a b c d e) = queryItemInfo mydataStructure x
let (z,y) = addAttrGetId (myInfoy j) mydataStructure
modifyIORef dataStructure (\x -> y)
mydataStructure <- readIORef dataStructure
let newList = z:b
let newItemInfo = ItemInfo a newList c d e
88
let newGraphSet = updateItemInfo mydataStructure x newItemInfo
modifyIORef dataStructure (\x -> newGraphSet)
layoutGeneration dataStructure (i+1) j xs
else do
layoutGeneration dataStructure (i) j xs
else do
let newNodeLayout = Vector3 0 0 j
let listOfGraphID = getGxlGraphs mydataStructure
let mapOfGraphAttrs = graphAttrs mydataStructure (head(listOfGraphID))
let graphFiniteMap = itemAttrs mydataStructure mapOfGraphAttrs x
let myLayout = lookupFM graphFiniteMap (x,"Layout")
if (myLayout == Nothing)
then do
let (ItemInfo a b c d e) = queryItemInfo mydataStructure x
let (z,y) = addAttrGetId (myInfoy j) mydataStructure
modifyIORef dataStructure (\x -> y)
mydataStructure <- readIORef dataStructure
let newList = z:b
let newItemInfo = ItemInfo a newList c d e
let newGraphSet = updateItemInfo mydataStructure x newItemInfo
modifyIORef dataStructure (\x -> newGraphSet)
layoutGeneration dataStructure 0 (j+1) xs
else do
layoutGeneration dataStructure 0 (j) xs
layoutGeneration _ _ _ _ = return()
layoutAttr is a function which is used to create the layout attribut.
layoutAttr::AttrAttr
layoutAttr = AttrAttr Nothing "Layout"
Nothing
myInfox,y and z are functions used to produce the Attribute Info of the layout based on the coordinate. Here we are
only passing one variable since are coordinates are always two zero and one non zero (j) variable.
myInfox::Prelude.Int -> AttrInfo
myInfox j = AttrInfo Nothing [] (TenOf10 (Tup [Tup_Float (Gxl_1_0_1_DTD.Float (show j)),
Tup_Float (Gxl_1_0_1_DTD.Float "0"),Tup_Float (Gxl_1_0_1_DTD.Float "0")]))
layoutAttr
myInfoy::Prelude.Int -> AttrInfo
myInfoy j = AttrInfo Nothing [] (TenOf10 (Tup [Tup_Float (Gxl_1_0_1_DTD.Float "0"),
Tup_Float (Gxl_1_0_1_DTD.Float (show j)),Tup_Float (Gxl_1_0_1_DTD.Float "0")]))
layoutAttr
myInfoz::Prelude.Int -> AttrInfo
myInfoz j = AttrInfo Nothing [] (TenOf10 (Tup [Tup_Float (Gxl_1_0_1_DTD.Float "0"),
Tup_Float (Gxl_1_0_1_DTD.Float "0"),Tup_Float (Gxl_1_0_1_DTD.Float (show j))]))
layoutAttr
processLayout is a function which given a vector in 3D will return the attribute value in the form of OneOfN variable
which is used by XML in the GXL format.
processLayout::Vector3 GLfloat -> AttrValue
processLayout (Vector3 first second third) = (TenOf10 (Tup [Tup_Float (Gxl_1_0_1_DTD.Float (show first)),
Tup_Float (Gxl_1_0_1_DTD.Float (show second)),Tup_Float (Gxl_1_0_1_DTD.Float (show third))]))
89
Main controls the operation of the application. The application is driven by the variable currentMode which indicates
the state we are currently in. Based ont he value of that parameter, the program is able to decide what to do next
with the user’s input.
The following is done here:
1- Keyboard and Mouse callbacks are set so that moving the mouse or clicking the keyboard/mouse buttons triger
some actions depending on the mode the currect program is in.
2- The reshape callback is set here, which is the function called every time the window is reshaped.
3- Lighting is set up and turned on, this is used so that we get a true 3D feel.
4- The display callback is set, which is the function called everytime the graph needs to be rendered.
5- The menu is setup and attached to the mouse to enable the user to toggle between the different modes/options
of the program.
6- The original window is initialised.
7- The variables used throughout the program are initialised.
import Data.IORef ( IORef, newIORef, readIORef, modifyIORef, writeIORef)
import Graphics.Rendering.OpenGL.GL
import Graphics.Rendering.OpenGL.GLU
import Graphics.UI.GLUT.Callbacks.Window ( MouseButton )
import Graphics.UI.GLUT.Window
import Graphics.UI.GLUT hiding (MenuItem)
import Graphics.UI.WX hiding (KeyUp,KeyDown,color,motion,WXCore.WxcTypes.Size,Classes.position,Attributes.get,
Graphics.UI.WXCore.Types.when,Graphics.UI.WXCore.Events.Key,Graphics.UI.WXCore.Events.Modifiers)
import Graphics.UI.WXCore.Frame
import System.Exit(exitWith, ExitCode(ExitSuccess), exitFailure)
import Control.Monad
import ViewFileManager
import PickObject
import DrawGraph
import GraphInterface
import Gxl_1_0_1_DTD hiding (Int)
import GXL_DTD
import ViewDataStructure
import GxlGraphSetManage
import UndoDataStructure
import GraphFileManager
import NodeManipulation
import EdgeManipulation
import GraphManipulation
import ItemManipulation
import ViewManipulation
import SettingsDataStructure
import GxlGraphSetManage
90
import SettingsFileManager
keyboardMouse is the function which processes keyboard and mouse clicks, and depending on the mode the program
is in will call the appropriate function to do the actual work.
keyboardMouse::IORef SettingsDataStructure -> IORef String -> IORef View -> IORef GLfloat -> IORef GLfloat
-> IORef GxlGraphSet -> IORef GXL_DTD.Id -> IORef GXL_DTD.Id -> IORef UndoDataStructure -> IORef [GLdouble]
-> KeyboardMouseCallback
--mouse left button is pressed
keyboardMouse settings mode view oldx oldy dataStructure currentItem1 currentItem2 undoDataStructure matrixStore
(MouseButton LeftButton) Down _ (Position x y) = do
currentMode <- readIORef mode
when (currentMode == "rotateView") $ do updateLatestPosition oldx oldy x y
when (currentMode == "rotateGraph") $ do newGraphSet <- readIORef dataStructure;
updateGraphDataStructure newGraphSet dataStructure undoDataStructure;
updateLatestPosition oldx oldy x y
when (currentMode == "zoomGraph")
$ do newGraphSet <- readIORef dataStructure;
updateGraphDataStructure newGraphSet dataStructure undoDataStructure;
return()
when (currentMode == "zoomView")
$ do return()
when (currentMode == "removeItem") $ do removeItem x y view dataStructure undoDataStructure
matrixStore settings;
postRedisplay Nothing
when (currentMode == "changeColor") $ do colorChange x y dataStructure view undoDataStructure
matrixStore settings;
postRedisplay Nothing
when (currentMode == "changeLabel") $ do labelChange x y dataStructure view undoDataStructure
matrixStore settings;
postRedisplay Nothing
when (currentMode == "changeRadius") $ do radiusChange x y dataStructure view undoDataStructure
matrixStore settings;
postRedisplay Nothing
when (currentMode == "changeSlices") $ do slicesChange x y dataStructure view undoDataStructure
matrixStore settings;
postRedisplay Nothing
when (currentMode == "changeStacks") $ do stacksChange x y dataStructure view undoDataStructure
matrixStore settings;
postRedisplay Nothing
when (currentMode == "moveNode")
$ do selectedNode <- selectObject view x y dataStructure matrixStore settings;
let newNode = (read ( show selectedNode))::GXL_DTD.Id;
modifyIORef currentItem1 (\x->newNode);
postRedisplay Nothing
when (currentMode == "bendEdge")
$ do selectedEdge <- selectObject view x y dataStructure matrixStore settings;
let newEdge = (read ( show selectedEdge))::GXL_DTD.Id;
modifyIORef currentItem1 (\x->newEdge);
postRedisplay Nothing
when (currentMode == "addDirectedEdge") $ do addEdge dataStructure x y view currentItem1 currentItem2
"Item_isdirected_true" undoDataStructure matrixStore settings;
postRedisplay Nothing
when (currentMode == "addUndirectedEdge") $ do addEdge dataStructure x y view currentItem1 currentItem2
"Item_isdirected_false" undoDataStructure matrixStore settings;
91
postRedisplay Nothing
when (currentMode == "addNode")
$ do newGraphSet <- readIORef dataStructure;
addNode dataStructure x y settings matrixStore view undoDataStructure;
postRedisplay Nothing
--Mouse wheel is scrolled up
keyboardMouse settings mode view _ _ dataStructure currentItem1 _ undoDataStructure matrixStore (MouseButton WheelUp)
Down _ _= do
let scaleFactor = 1.1
currentMode <- readIORef mode
myItem <- readIORef currentItem1
when (currentMode == "moveNode") $ do moveNodeWheelUp dataStructure myItem settings matrixStore undoDataStructure;
postRedisplay Nothing
when ((currentMode == "zoomView") || (currentMode == "")) $ do
zoomViewWheelUp view;
postRedisplay Nothing
bendEdgeWheelUp dataStructure myItem settings matrixStore undoDataStructure;
when (currentMode == "bendEdge") $ do
postRedisplay Nothing
when (currentMode == "scaleGraph")$ do myGraphSet <- readIORef dataStructure;
updateGraphDataStructure myGraphSet dataStructure undoDataStructure;
scaleGraph dataStructure scaleFactor settings;
postRedisplay Nothing
--Mouse wheel is scrolled down
keyboardMouse settings mode view _ _ dataStructure currentItem1 _ undoDataStructure matrixStore
(MouseButton WheelDown) Down _ _= do
let scaleFactor = 0.9
currentMode <- readIORef mode
myItem <- readIORef currentItem1
when (currentMode == "moveNode") $ do moveNodeWheelDown dataStructure myItem settings
matrixStore undoDataStructure;
postRedisplay Nothing
when ((currentMode == "zoomView") || (currentMode == "")) $ do zoomViewWheelDown view;
postRedisplay Nothing
when (currentMode == "bendEdge") $ do
bendEdgeWheelDown dataStructure myItem settings
matrixStore undoDataStructure;
postRedisplay Nothing
when (currentMode == "scaleGraph")$ do myGraphSet <- readIORef dataStructure;
updateGraphDataStructure myGraphSet dataStructure undoDataStructure;
scaleGraph dataStructure scaleFactor settings;
postRedisplay Nothing
--Uparrow key of keyboard is presses
keyboardMouse _ _ view _ _ _ _ _ _ _ (SpecialKey KeyUp) Down _ _= do zoomViewWheelUp view;
postRedisplay Nothing
--Lowarrow key of keyboard is presses
keyboardMouse _ _ view _ _ _ _ _ _ _ (SpecialKey KeyDown) Down _ _= do zoomViewWheelDown view;
postRedisplay Nothing
--Keyboard Shortcuts
keyboardMouse _ mode view _ _ dataStructure _ _ undoDataStructure _ (Char character) Down modifier
let Modifiers shiftKey controlKey altKey = modifier;
if (controlKey==Down)
then do
--control-L is open graph
if (character==’\f’)
_ = do
92
then do openGraph dataStructure view undoDataStructure
postRedisplay Nothing
--control-Y is redo
else if (character==’\EM’)
then do redo dataStructure undoDataStructure
postRedisplay Nothing
--control-Z is undo
else if (character==’\SUB’)
then do undo dataStructure undoDataStructure
postRedisplay Nothing
--control-S is save graph
else if (character==’\DC3’)
then do saveGraph dataStructure
postRedisplay Nothing
--control-C is close graph
else if (character==’\ETX’)
then do closeGraph dataStructure view undoDataStructure
postRedisplay Nothing
else do return()
else do return()
--Do nothing when anything other then the above is pressed
keyboardMouse _ _ _ _ _ _ _ _ _ _ _ _ _ _ = return ()
reshape is the function that is associated with the reshape call back. Every time the window is reshaped this function
is called. Here we set the viewing point and the perspective from which we are looking from and where are we looking
to and the upward direction.
reshape :: ReshapeCallback
reshape size@(Size w h) = do
let initialCameraDistance = 14.0::GLdouble
--setup the rectangular region of the window where the image is drawn, here the whole window
viewport $= (Position 0 0, size)
matrixMode $= Projection
loadIdentity
--setup the projection matrix such that further objects apear in perspective to nearer ones
--the field of view is set to 45 degrees and the aspect is the width dvided by the height
--the near plane is how far the nearest object can be its 1 and 500 is the furthest it can be
--at and sitt be visible.
perspective 45.0 (fromIntegral w / fromIntegral h) 1 500.0
matrixMode $= Modelview 0
loadIdentity
{-look at the graph by placing the camera at 0 0 initialCameraDistance
facing the origin and the upward direction is 0 1 0 -}
lookAt (Vertex3 0.0 0.0 initialCameraDistance) (Vertex3 0.0 0.0 0.0) (Vector3 0 1 0)
initWindow initialises the current window by first setting its properties for color and buffering, and then sets the size
to 600*600 pixels. Finally rhe color buffer and the depth buffer are cleared.
initWindow :: IO ()
initWindow = do
initialDisplayMode $= [ DoubleBuffered, RGBMode, WithDepthBuffer ]
93
initialWindowSize $= Size (600) (600)
clear [ColorBuffer,DepthBuffer]
motion is the function which process mouse motion input as the name indicates, and depending on the mode the
program is in will call the appropriate function to do the actual work.
motion ::IORef String -> IORef View -> IORef View -> IORef GLfloat -> IORef GLfloat -> IORef GLfloat
-> IORef GLfloat -> IORef GxlGraphSet -> IORef GXL_DTD.Id -> IORef UndoDataStructure -> IORef SettingsDataStructure
-> IORef [GLdouble] -> MotionCallback
motion selectMode view graph oldx oldy newx newy currentGraphSet currentItem1 undoDataStructure settings
matrixStore (Position x y) = do
myGraphSet <- readIORef currentGraphSet
currentMode <- readIORef selectMode
if (currentMode=="rotateView")
then do
rotateViewButtonDown view oldx oldy newx newy x y
else if (currentMode=="moveNode")
then do
moveNodeButtonDown view oldx oldy newx newy currentGraphSet currentItem1 undoDataStructure settings matrixStore x y
else if (currentMode=="bendEdge")
then do
bendEdgeButtonDown view oldx oldy newx newy currentGraphSet currentItem1 undoDataStructure settings matrixStore x y
else if (currentMode=="rotateGraph")
then do
graphRotationButtonDown view oldx oldy newx newy currentGraphSet matrixStore x y
else postRedisplay Nothing
setupLighting sets up the lighting at specified position and with specified attributes and the light is turned on and
enable. Use of lighting is essential to give us a true 3 dimensional feel.
setupLighting:: IO ()
setupLighting = do
normalize $= Enabled
depthFunc $= Just Less
shadeModel $= Smooth
position (Light 0) $= Vertex4 0 3 (2) 0
ambient (Light 0) $= Color4 0.4 0.4 0.4 1
diffuse (Light 0) $= Color4 1 1 1 1
specular (Light 0) $= Color4 1 1 1 1
light (Light 0) $= Enabled
lighting $= Enabled
userInterface creates and new window and sets up the user interface. First we initialise all the variables and then we
add the menu and attach it to the mouse button so that the user can select different options. Note that GLUT menus
are used here since they have to be rendered withing a GLUT window therefore not enabling us to use wxHaskell
windows. Also the motion, keyboardmouse and display callbacks are set.
userInterface :: IORef Int -> IORef GxlGraphSet -> IORef UndoDataStructure -> IO ()
userInterface view_count dataStructure undoDataStructure = do
initWindow
x <- createWindow "3-D Graph Editor"
myView <- (initView)
94
myGraph <- (initView)
graph <- newIORef myGraph
view <- newIORef myView
oldy <- newIORef 0.0
oldx <- newIORef 0.0
newy <- newIORef 0.0
newx <- newIORef 0.0
matrixStore <- newIORef []
currentItem1 <- newIORef (0::GXL_DTD.Id)
currentItem2 <- newIORef (0::GXL_DTD.Id)
selectMode <- newIORef ""
settings <- newSettingsDataStructure
setupLighting
modifyIORef view_count (\x -> (x+1))
attachMenu RightButton (Menu [
SubMenu "View" (Menu [
MenuEntry "New" (do modifyIORef selectMode (\x ->"")
userInterface view_count dataStructure undoDataStructure),
MenuEntry "Load" (openView view),
MenuEntry "Save" (saveView view),
MenuEntry "Close" (closeView x view_count)]),
MenuEntry "------------------" (return()),
SubMenu "Graph" (Menu [
MenuEntry "Load" (openGraph dataStructure view undoDataStructure),
MenuEntry "Save" (saveGraph dataStructure),
MenuEntry "Close" (closeGraph dataStructure view undoDataStructure)]),
MenuEntry "------------------" (return()),
SubMenu "Add" (Menu [
MenuEntry "Node" (do modifyIORef selectMode (\x ->"addNode")),
MenuEntry "Undirected Edge" (do modifyIORef currentItem1 (\x -> 0);
modifyIORef selectMode (\x ->"addUndirectedEdge")),
MenuEntry "Directed Edge" (do
modifyIORef currentItem1 (\x -> 0);
modifyIORef selectMode (\x ->"addDirectedEdge"))]),
SubMenu "Remove" (Menu [
MenuEntry "Remove Item" (do modifyIORef selectMode (\x ->"removeItem")) ]),
MenuEntry "-------------------" (return()),
SubMenu "Move " (Menu [
MenuEntry "Node" (do modifyIORef selectMode (\x ->"moveNode"))]),
SubMenu "Zoom" (Menu [
MenuEntry "Graph" (do modifyIORef selectMode (\x ->"scaleGraph")),
MenuEntry "View" (do modifyIORef selectMode (\x ->"zoomView"))]),
SubMenu "Rotate" (Menu [
MenuEntry "Graph" (do modifyIORef selectMode (\x ->"rotateGraph")),
MenuEntry "View" (do modifyIORef selectMode (\x ->"rotateView"))]),
SubMenu "Bend" (Menu [
MenuEntry "Edge" (do modifyIORef selectMode (\x ->"bendEdge"))]),
MenuEntry "------------------" (return()),
SubMenu "Change" (Menu [
MenuEntry "Color" (do modifyIORef selectMode (\x ->"changeColor")),
MenuEntry "Label" (do modifyIORef selectMode (\x ->"changeLabel")),
MenuEntry "Radius" (do modifyIORef selectMode (\x ->"changeRadius")),
MenuEntry "Slices" (do modifyIORef selectMode (\x ->"changeSlices")),
MenuEntry "Stacks" (do modifyIORef selectMode (\x ->"changeStacks"))]),
95
MenuEntry "------------------" (return()),
SubMenu "Settings" (Menu [
MenuEntry "Load" (openSettings settings),
MenuEntry "Save" (saveSettings settings),
MenuEntry "Cylinder Number" (changeCylinderNumber settings),
MenuEntry "Collision Detection" (changeCollisionDetection settings),
MenuEntry "Axis Rendering" (changeAxisDisplay settings)]),
MenuEntry "------------------" (return()),
MenuEntry "Undo" (undo dataStructure undoDataStructure),
MenuEntry "Redo" (redo dataStructure undoDataStructure),
MenuEntry "Exit" (exitWith ExitSuccess)])
displayCallback $= (displayGraph view dataStructure matrixStore settings)
reshapeCallback $= (Just reshape)
keyboardMouseCallback $= (Just (keyboardMouse settings selectMode view oldx oldy dataStructure currentItem1
currentItem2 undoDataStructure matrixStore))
motionCallback $= (Just (motion selectMode view graph oldx oldy newx newy dataStructure currentItem1
undoDataStructure settings matrixStore))
mainLoop
main is the function which originally starts the whole process first we initialise the number of open views to 0, then
we load the empty graph and we initialise the undo data structure, then the application is started.
main :: IO ()
main = do
view_count <- newIORef 0
let newGraphSet = addEmptyGraph newEmptyGraphSet "Graph"
dataStructure <- newIORef newGraphSet
undoDataStructure <- newUndoDataStructure
getArgsAndInitialize
start (userInterface view_count dataStructure undoDataStructure)
updateLatestPosition updates the IORefs which represent the old coordinate of x and old coordinate of y to the new
coordinates which the user clicked on. This is used in conjunction with rotation while holding the left mouse button
down. The position where the user clicked is the position where the rotations will be calculated from. This is not
only used for views however, for graph rotation, there is a view data structure which stores the amount it is rotated
by also, so the old x coordinate and old y coordinates for that function is updated here too.
updateLatestPosition::IORef GLfloat -> IORef GLfloat -> GLsizei -> GLsizei ->IO()
updateLatestPosition oldx oldy x y = do
modifyIORef oldy (\d -> (fromIntegral y))
modifyIORef oldx (\d -> (fromIntegral x))
return()
Module Node provides us with the data structure Node which consists of the following attributes: Label, QuadricStyle,
QuadricPrimitive, Color and Layout. It also provides a set of functions to extract information about each particular
field. The secret it hides is how the Node data structure is represented and how the attributes are individually
extracted.
module Node (extractLabel, extractColor, extractQuadricStyle, extractQuadricPrimitive , extractLayout,
Node(..)) where
import Graphics.Rendering.OpenGL.GL
96
import Graphics.Rendering.OpenGL.GLU
import Graphics.UI.GLUT
We define a type synonym Label for String.
type Label
= String
We define the Node data structure as being formed by the following primitive types: Label QuadricStyle QuadricPrimitive (Color4 GLfloat) (Vector3 GLfloat) and the constructor Node.
data Node
= Node Label QuadricStyle QuadricPrimitive (Color4 GLfloat) (Vector3 GLfloat)
The following functions are self explanatory and are there to extract individual attributes from the Node data structure.
extractLabel :: Node -> Label
extractLabel (Node a b c d e) = a
extractColor :: Node -> Color4 GLfloat
extractColor (Node a b c d e) = d
extractQuadricStyle :: Node -> QuadricStyle
extractQuadricStyle (Node a b c d e) = b
extractQuadricPrimitive :: Node -> QuadricPrimitive
extractQuadricPrimitive (Node a b c d e) = c
extractLayout :: Node -> (Vector3 GLfloat)
extractLayout (Node a b c d e) = e
Module NodeManipulation is responsible for the manipulation of the nodes in the program. Any change to the nodes
in the graph corresponds to changes in the graph data structure. The information in the graph data structure is
updated according to how the nodes are manipulated. The only possible changes that can be done to a graph that
associates strictly to nodes are addition and movement of nodes. Changes such as removal of nodes and attribute
changes(color,size,etc.) are generalized in the ItemManipulation module for both nodes and edges. The functions
that are of concern here are addition and movement of nodes, the functions which manipulate movement of nodes are
represented by how the user moves the node. Dragging the mouse after clicking on a node corresponds to ’moveNodeButtonDown’ while moving the node in the Z-plane using the wheel corresponds to ’moveNodeWheelUp’ and
’moveNodeWheelDown’.
The service of this module is that it provides a set of functions to add and move nodes in the graph data structure.
The secret of this module is the way the nodes are added and the methods that are used to move a node.
module NodeManipulation (addNode,moveNodeButtonDown,moveNodeWheelUp,moveNodeWheelDown)
import
import
import
import
import
import
Text.XML.HaXml.Xml2Haskell
Gxl_1_0_1_DTD
GXL_DTD
INIT
Data.IORef
Graphics.Rendering.OpenGL.GL
where
97
import
import
import
import
import
import
import
import
import
import
import
import
Graphics.Rendering.OpenGL.GLU
Graphics.UI.GLUT
ViewDataStructure
UndoDataStructure
GraphInterface
Text.XML.HaXml.OneOfN
Node
Utils
GxlGraphSetManage
SettingsDataStructure
Collision
Additional
Function addNode is the main function which is called by the keyboard mouse callback in the main program for
adding a node on a particular point on the screen. It takes in as parameters: a) the Graph data structure to be
modified
b) the coordinates where the user clicked the mouse on
c) the Settings data structure to determine if collision is toggled on or off
d) the current transformation matrix to determine where to place the node according to the graph’s axis
e) the View data structure to determine the current distance of the camera from the objects
f) the Undo data structure to save a copy of the data structure before the node is added
addNode :: IORef GxlGraphSet -> GLsizei -> GLsizei -> IORef SettingsDataStructure -> IORef [GLdouble]
-> IORef View -> IORef UndoDataStructure -> IO()
addNode dataStructure x y settings matrixStore view undoDataStructure = do
Here we read the data that is needed before addition of a new node can be done
let initialCameraDistance = 14.0::GLdouble
mydataStructure <- readIORef dataStructure
let listOfGraphID = getGxlGraphs mydataStructure
myList <- getListOfNodes mydataStructure
let numberOfNodes =length (myList)
vp@((Position lowerx lowery), (Size width height)) <- get viewport
mvMatrix stores the current ModelView matrix which is the current transformation matrix.
component <- readIORef matrixStore
(mvMatrix::(GLmatrix GLdouble)) <- newMatrix ColumnMajor component
The pixel coordinates of the mouse where it was clicked is transformed into the coordinates of the object space by
’unProject’. The new vertex which it returns specifies the coordinates in the object space.
matrixMode $= Projection
m2@(projMatrix::(GLmatrix GLdouble)) <- get currentMatrix
projectionMatrix <- getMatrixComponents ColumnMajor m2
matrixMode $= Modelview 0
m1@(mvMatrix2::(GLmatrix GLdouble)) <- get currentMatrix
newcomponent <- getMatrixComponents ColumnMajor m1
let realX = fromIntegral x
let realY = fromIntegral (height - y - 1)
Just (Vertex3 wx2 wy2 wz2) <- unProject (Vertex3 realX realY 0) mvMatrix2 projMatrix vp
98
Assign the new node with the default attributes, which is stored in myInfoLayoutNode and myItemInfo. It is inserted
into the data structure by calling addItem together with the constructed node.
let (z,newStructure) = addAttrGetId myInfoLayoutNode mydataStructure
modifyIORef dataStructure (\x -> newStructure)
mydataStructure2 <- readIORef dataStructure
let listOfGraphID = getGxlGraphs mydataStructure2
let graphGXLid = unMaybe (getGXLId mydataStructure2 (head listOfGraphID))
let newdataStructure = addItem (myItemInfo numberOfNodes z) graphGXLid mydataStructure2
modifyIORef dataStructure (\x -> newdataStructure)
Here, the new node is moved to the position that it is supposed to be. Since the axis on the screen can be
rotated and the movement of the node across the screen is kept the ’intuitive’ way (moving the node according to
the mouse rather than according to the axis in the window), directly changing the position of the node in the graph
data structure using the coordinates from the mouse is not correct. Rather, we used calculateMovementNodeStatic
which moves a node to a specified point which is multiplied by the camera’s distance from the object space. This then
correctly displays the node according to where the node was moved by the mouse. Collision detection is also done
here before adding the node, if collision is not detected, then the node is added, otherwise the node is not added.
readedDataStructure <- readIORef dataStructure
let myInnerId = getInnerId readedDataStructure ("Node " ++ show (numberOfNodes))
myView <- readIORef view
let currentCameraDistance = read (show (getCameraDistance myView))::GLdouble
let cameraDistance = read (show (initialCameraDistance - currentCameraDistance))::GLdouble
let defaultRadius = 0.5
mySettings <- readIORef settings
collisionOnIORef <- getCollisionOn mySettings
collisionOn<-readIORef (collisionOnIORef)
modifyIORef dataStructure (\x->mydataStructure)
myListOfEdges <- getListOfEdges mydataStructure
myListOfNodes <- getListOfNodes mydataStructure
collisionDetected <- collisionDetectionNewNode collisionOn dataStructure myListOfNodes
myListOfEdges (Vector3 (read(show ((wx2*cameraDistance)))::GLfloat)
(read(show ((wy2*cameraDistance)))::GLfloat) (0) ) defaultRadius settings
if (collisionDetected==False)
then do updateGraphDataStructure newdataStructure dataStructure undoDataStructure
calculateNodeMovementStatic 0 0 (read(show ((wx2*cameraDistance)))::GLfloat)
(read(show ((wy2*cameraDistance)))::GLfloat)
dataStructure myInnerId settings matrixStore
return()
else do return()
collisionDetectionNewNode returns true if a collision is added in the addition of the new node, otherwise it returns
false.
collisionDetectionNewNode::Prelude.Bool-> IORef GxlGraphSet -> [GXL_DTD.Id] -> [GXL_DTD.Id] -> Vector3 GLfloat
-> GLdouble ->IORef SettingsDataStructure -> IO(Prelude.Bool)
collisionDetectionNewNode collisionOn dataStructure myListOfNodes myListOfEdges newNodeLayout defaultRadius
settings = if (collisionOn==True)
then do collisionDetected <- addNodeCollision dataStructure myListOfNodes myListOfEdges newNodeLayout
defaultRadius settings
return(collisionDetected)
else do return(False)
99
moveNodeWheelUp is called when the user uses the mouse wheel to move the node along the z axis. In this case the
node is moved into the screen, therefore away from the user. The position of the node that was selected is extracted
(layout) and a new layout for the node is constructed by applying the transformation matrix and the translation in
the z axis to the old layout of the node. If collision is detected, then the change to the layout is not applied, if it
passes collision detection, the layout is updated with the new layout. The undo data structure is updated because of
this change in the graph data structure. Similarly for moveNodeWheelDown the same process is used, except instead
of moving into the screen we move out of the screen now.
moveNodeWheelUp :: IORef GxlGraphSet -> GXL_DTD.Id -> IORef SettingsDataStructure -> IORef [GLdouble]
-> IORef UndoDataStructure -> IO()
moveNodeWheelUp dataStructure myItem settings matrixStore undoDataStructure = do
let moveDiff = 0.1
if (myItem/=0)
then do myGraphSet <- readIORef dataStructure
node <- getNode myItem dataStructure
let nodeLayout = extractLayout node
let xcoordinate = xcoord nodeLayout
let ycoordinate = ycoord nodeLayout
let zcoordinate = zcoord nodeLayout
transformationMatrix <- readIORef matrixStore
(Vector3 a b c) <- transformVector (Vector3 0 0 (-moveDiff)) transformationMatrix
let newxcoordinate = xcoordinate + a
let newycoordinate = ycoordinate + b
let newzcoordinate = zcoordinate + c
let newNodeLayout = Vector3 newxcoordinate newycoordinate (newzcoordinate::GLfloat)
let newLayoutAttribute = processLayout newNodeLayout
myListOfEdges <- getListOfEdges myGraphSet
myListOfNodes <- getListOfNodes myGraphSet
mySettings <- readIORef settings
collisionOnIORef <- getCollisionOn mySettings
collisionOn<-readIORef (collisionOnIORef)
collisionDetected <- collisionDetectionMoveNode collisionOn dataStructure
myListOfNodes myListOfEdges myItem newNodeLayout settings
if (collisionDetected==False)
then do mydataStructure <- readIORef dataStructure
changeAttr dataStructure "Layout" myItem newLayoutAttribute
myseconddatastructure <-readIORef dataStructure
modifyIORef dataStructure (\x -> mydataStructure)
updateGraphDataStructure myseconddatastructure dataStructure undoDataStructure
else do return ()
else return()
moveNodeWheelDown :: IORef GxlGraphSet -> GXL_DTD.Id -> IORef SettingsDataStructure ->IORef [GLdouble]
-> IORef UndoDataStructure -> IO()
moveNodeWheelDown dataStructure myItem settings matrixStore undoDataStructure = do
let moveDiff = 0.1
if (myItem/=0)
then do myGraphSet <- readIORef dataStructure
node <- getNode myItem dataStructure
let nodeLayout = extractLayout node
let xcoordinate = xcoord nodeLayout
let ycoordinate = ycoord nodeLayout
let zcoordinate = zcoord nodeLayout
transformationMatrix <- readIORef matrixStore
100
(Vector3 a b c) <- transformVector (Vector3 0 0 (moveDiff)) transformationMatrix
let newxcoordinate = xcoordinate + a
let newycoordinate = ycoordinate + b
let newzcoordinate = zcoordinate + c
let newNodeLayout = Vector3 newxcoordinate newycoordinate (newzcoordinate::GLfloat)
let newLayoutAttribute = processLayout newNodeLayout
myListOfEdges <- getListOfEdges myGraphSet
myListOfNodes <- getListOfNodes myGraphSet
mySettings <- readIORef settings
collisionOnIORef <- getCollisionOn mySettings
collisionOn<-readIORef (collisionOnIORef)
collisionDetected <- collisionDetectionMoveNode collisionOn dataStructure
myListOfNodes myListOfEdges myItem newNodeLayout settings
if (collisionDetected==False)
then do mydataStructure <- readIORef dataStructure
changeAttr dataStructure "Layout" myItem newLayoutAttribute
myseconddatastructure <-readIORef dataStructure
modifyIORef dataStructure (\x -> mydataStructure)
updateGraphDataStructure myseconddatastructure dataStructure undoDataStructure
else do return ()
else return()
moveNodeButtonDown is called when the user clicks on a node and moves it by dragging the mouse. Basically
the difference between the new mouse position and initial mouse position where the user clicked on is the amount
which the node will move by. The function calculateNodeMovementDynamic applies the layout changes of the node
according to the new coordinates of the mouse. These two functions together with the mouse motion callback forms
the movement of node while being ’dragged’ on the screen.
moveNodeButtonDown :: IORef View -> IORef GLfloat -> IORef GLfloat -> IORef GLfloat -> IORef GLfloat
-> IORef GxlGraphSet -> IORef GXL_DTD.Id -> IORef UndoDataStructure -> IORef SettingsDataStructure
-> IORef [GLdouble] -> GLsizei -> GLsizei -> IO()
moveNodeButtonDown view oldx oldy newx newy dataStructure currentItem1 undoDataStructure
settings matrixStore x y = do
myItem <- readIORef currentItem1
if (myItem/=0)
then do oy <- readIORef oldy
ox <- readIORef oldx
modifyIORef newy (\d ->(fromIntegral y))
modifyIORef newx (\d ->(fromIntegral x))
ny <- readIORef newy
nx <- readIORef newx
let diffy = ny - oy
let diffx = nx - ox
calculateNodeMovementDynamic oldx oldy newx newy view dataStructure currentItem1 settings
matrixStore undoDataStructure
modifyIORef oldx (\d ->nx)
modifyIORef oldy (\d ->ny)
return()
else return()
– Calculate actual screen coordinates instead of mouse coordinates to make it follow the mouse The calculateNodeMovementDynamic function takes the new mouse coordinates and the previous mouse coordinates when the mouse
was moved with the left mouse button being held, and uses it to calculate the new layout of the currently selected
node. Majority of the code is repeated for all 4 cases, difference in y coordinates less than 1/more than 1 and difference
101
in x coordinates less than 1/more than 1. Collision detection is checked in each of the cases, only if no collision is
detected, then the changes to that node will be applied to the graph data structure.
calculateNodeMovementDynamic :: IORef GLfloat -> IORef GLfloat -> IORef GLfloat -> IORef GLfloat -> IORef View
-> IORef GxlGraphSet -> IORef GXL_DTD.Id -> IORef SettingsDataStructure
-> IORef [GLdouble] -> IORef UndoDataStructure -> IO()
calculateNodeMovementDynamic oldx oldy newx newy view currentGraphSet currentItem1 settings
matrixStore undoDataStructure = do
let moveDiff = 0.025
ny <- readIORef newy
oy <- readIORef oldy
nx <- readIORef newx
ox <- readIORef oldx
myNode <- readIORef currentItem1
let diffy = ny-oy
let diffx = nx-ox
if (diffy <=(-1))
then do myGraphSet <- readIORef currentGraphSet
node <- getNode myNode currentGraphSet
let nodeLayout = extractLayout node
let xcoordinate = xcoord nodeLayout
let ycoordinate = ycoord nodeLayout
let zcoordinate = zcoord nodeLayout
transformationMatrix <- readIORef matrixStore
Multiplying the translation vector with the transformation matrix, so that the node moves intuitively.
(Vector3 a b c) <- transformVector (Vector3 0 moveDiff 0) transformationMatrix
let newxcoordinate = xcoordinate + a
let newycoordinate = ycoordinate + b
let newzcoordinate = zcoordinate + c
let newNodeLayout = Vector3 newxcoordinate newycoordinate (newzcoordinate::GLfloat)
let newLayoutAttribute = processLayout newNodeLayout
myListOfEdges <- getListOfEdges myGraphSet
myListOfNodes <- getListOfNodes myGraphSet
mySettings <- readIORef settings
collisionOnIORef <- getCollisionOn mySettings
collisionOn<-readIORef (collisionOnIORef)
collisionDetected <- collisionDetectionMoveNode collisionOn currentGraphSet
myListOfNodes myListOfEdges myNode
newNodeLayout settings
if (collisionDetected==False)
then do mydataStructure <- readIORef currentGraphSet
changeAttr currentGraphSet "Layout" myNode newLayoutAttribute
myseconddatastructure <-readIORef currentGraphSet
modifyIORef currentGraphSet (\x -> mydataStructure)
updateGraphDataStructure myseconddatastructure currentGraphSet undoDataStructure
postRedisplay Nothing
else do postRedisplay Nothing
else if (diffy >= 1)
then do myGraphSet <- readIORef currentGraphSet
node <- getNode myNode currentGraphSet
let nodeLayout = extractLayout node
let xcoordinate = xcoord nodeLayout
let ycoordinate = ycoord nodeLayout
102
let zcoordinate = zcoord nodeLayout
transformationMatrix <- readIORef matrixStore
(Vector3 a b c) <- transformVector (Vector3 0 (-moveDiff) 0) transformationMatrix
let newxcoordinate = xcoordinate + a
let newycoordinate = ycoordinate + b
let newzcoordinate = zcoordinate + c
let newNodeLayout = Vector3 newxcoordinate newycoordinate (newzcoordinate::GLfloat)
let newLayoutAttribute = processLayout newNodeLayout
myListOfEdges <- getListOfEdges myGraphSet
myListOfNodes <- getListOfNodes myGraphSet
mySettings <- readIORef settings
collisionOnIORef <- getCollisionOn mySettings
collisionOn<-readIORef (collisionOnIORef)
collisionDetected <- collisionDetectionMoveNode collisionOn currentGraphSet
myListOfNodes myListOfEdges myNode
newNodeLayout settings
if (collisionDetected==False)
then do mydataStructure <- readIORef currentGraphSet
changeAttr currentGraphSet "Layout" myNode newLayoutAttribute
myseconddatastructure <-readIORef currentGraphSet
modifyIORef currentGraphSet (\x -> mydataStructure)
updateGraphDataStructure myseconddatastructure currentGraphSet undoDataStructure
postRedisplay Nothing
else do postRedisplay Nothing
else return()
if (diffx <=(-1))
then do myGraphSet <- readIORef currentGraphSet
node <- getNode myNode currentGraphSet
let nodeLayout = extractLayout node
let xcoordinate = xcoord nodeLayout
let ycoordinate = ycoord nodeLayout
let zcoordinate = zcoord nodeLayout
transformationMatrix <- readIORef matrixStore
(Vector3 a b c) <- transformVector (Vector3 (-moveDiff) 0 0) transformationMatrix
let newxcoordinate = xcoordinate + a
let newycoordinate = ycoordinate + b
let newzcoordinate = zcoordinate + c
let newNodeLayout = Vector3 newxcoordinate newycoordinate (newzcoordinate::GLfloat)
let newLayoutAttribute = processLayout newNodeLayout
myListOfEdges <- getListOfEdges myGraphSet
myListOfNodes <- getListOfNodes myGraphSet
mySettings <- readIORef settings
collisionOnIORef <- getCollisionOn mySettings
collisionOn<-readIORef (collisionOnIORef)
collisionDetected <- collisionDetectionMoveNode collisionOn currentGraphSet
myListOfNodes myListOfEdges myNode
newNodeLayout settings
if (collisionDetected==False)
then do mydataStructure <- readIORef currentGraphSet
changeAttr currentGraphSet "Layout" myNode newLayoutAttribute
myseconddatastructure <-readIORef currentGraphSet
modifyIORef currentGraphSet (\x -> mydataStructure)
updateGraphDataStructure myseconddatastructure currentGraphSet undoDataStructure
postRedisplay Nothing
103
else do postRedisplay Nothing
else if (diffx >= 1)
then do myGraphSet <- readIORef currentGraphSet
node <- getNode myNode currentGraphSet
let nodeLayout = extractLayout node
let xcoordinate = xcoord nodeLayout
let ycoordinate = ycoord nodeLayout
let zcoordinate = zcoord nodeLayout
transformationMatrix <- readIORef matrixStore
(Vector3 a b c) <- transformVector (Vector3 (moveDiff) 0 0) transformationMatrix
let newxcoordinate = xcoordinate + a
let newycoordinate = ycoordinate + b
let newzcoordinate = zcoordinate + c
let newNodeLayout = Vector3 newxcoordinate newycoordinate (newzcoordinate::GLfloat)
let newLayoutAttribute = processLayout newNodeLayout
myListOfEdges <- getListOfEdges myGraphSet
myListOfNodes <- getListOfNodes myGraphSet
mySettings <- readIORef settings
collisionOnIORef <- getCollisionOn mySettings
collisionOn<-readIORef (collisionOnIORef)
collisionDetected <- collisionDetectionMoveNode collisionOn currentGraphSet
myListOfNodes myListOfEdges myNode
newNodeLayout settings
if (collisionDetected==False)
then do mydataStructure <- readIORef currentGraphSet
changeAttr currentGraphSet "Layout" myNode newLayoutAttribute
myseconddatastructure <-readIORef currentGraphSet
modifyIORef currentGraphSet (\x -> mydataStructure)
updateGraphDataStructure myseconddatastructure currentGraphSet undoDataStructure
postRedisplay Nothing
else do postRedisplay Nothing
collisionDetectionMoveNode returns true when collision is detected when a particular node is to be moved to a
specified point in the graph.
collisionDetectionMoveNode::Prelude.Bool-> IORef GxlGraphSet -> [GXL_DTD.Id] -> [GXL_DTD.Id] -> GXL_DTD.Id ->
Vector3 GLfloat -> IORef SettingsDataStructure-> IO(Prelude.Bool)
collisionDetectionMoveNode collisionOn dataStructure myListOfNodes myListOfEdges myNode
newNodeLayout settings = if (collisionOn==True)
then do collisionDetected <- moveNodeCollision dataStructure myListOfNodes myListOfEdges myNode
newNodeLayout settings
return(collisionDetected)
else do return(False)
calculateNodeMovementStatic is used by node addition for moving the node to where it is to be added. The old
x and old y coordinates are going to be (0,0) in this case, because addition of nodes adds the node at the origin,
then moves it to the desired position from there. This function is only to be used by addNode. Again, the code is
seperated into four cases, whether the node is to be moved up/down the y-axis or the x-axis. The translation vector
is again multiplied by the transformation matrix so that the node moves in the correct way on the screen(following
the mouse), rather than according to the graph’s axis on the screen.
calculateNodeMovementStatic :: GLfloat -> GLfloat -> GLfloat -> GLfloat -> IORef GxlGraphSet -> GXL_DTD.Id
-> IORef SettingsDataStructure ->IORef [GLdouble] -> IO()
calculateNodeMovementStatic ox oy nx ny currentGraphSet myNode settings matrixStore = do
104
let moveDiff = 0.025
let diffy = ny-oy
let diffx = nx-ox
if (diffy <=(0))
then do myGraphSet <- readIORef currentGraphSet
node <- getNode myNode currentGraphSet
let nodeLayout = extractLayout node
let xcoordinate = xcoord nodeLayout
let ycoordinate = ycoord nodeLayout
let zcoordinate = zcoord nodeLayout
transformationMatrix <- readIORef matrixStore
(Vector3 a b c) <- transformVector (Vector3 0 diffy 0) transformationMatrix
let newxcoordinate = xcoordinate + a
let newycoordinate = ycoordinate + b
let newzcoordinate = zcoordinate + c
let newNodeLayout = Vector3 newxcoordinate newycoordinate (newzcoordinate::GLfloat)
let newLayoutAttribute = processLayout newNodeLayout
changeAttr currentGraphSet "Layout" myNode newLayoutAttribute
postRedisplay Nothing
else if (diffy >= 0)
then do myGraphSet <- readIORef currentGraphSet
node <- getNode myNode currentGraphSet
let nodeLayout = extractLayout node
let xcoordinate = xcoord nodeLayout
let ycoordinate = ycoord nodeLayout
let zcoordinate = zcoord nodeLayout
transformationMatrix <- readIORef matrixStore
(Vector3 a b c) <- transformVector (Vector3 0 diffy 0) transformationMatrix
let newxcoordinate = xcoordinate + a
let newycoordinate = ycoordinate + b
let newzcoordinate = zcoordinate + c
let newNodeLayout = Vector3 newxcoordinate newycoordinate (newzcoordinate::GLfloat)
let newLayoutAttribute = processLayout newNodeLayout
changeAttr currentGraphSet "Layout" myNode newLayoutAttribute
postRedisplay Nothing
else return()
if (diffx <=(0))
then do myGraphSet <- readIORef currentGraphSet
node <- getNode myNode currentGraphSet
let nodeLayout = extractLayout node
let xcoordinate = xcoord nodeLayout
let ycoordinate = ycoord nodeLayout
let zcoordinate = zcoord nodeLayout
transformationMatrix <- readIORef matrixStore
(Vector3 a b c) <- transformVector (Vector3 diffx 0 0) transformationMatrix
let newxcoordinate = xcoordinate + a
let newycoordinate = ycoordinate + b
let newzcoordinate = zcoordinate + c
let newNodeLayout = Vector3 newxcoordinate newycoordinate (newzcoordinate::GLfloat)
let newLayoutAttribute = processLayout newNodeLayout
changeAttr currentGraphSet "Layout" myNode newLayoutAttribute
postRedisplay Nothing
else if (diffx >=0)
then do myGraphSet <- readIORef currentGraphSet
105
node <- getNode myNode currentGraphSet
let nodeLayout = extractLayout node
let xcoordinate = xcoord nodeLayout
let ycoordinate = ycoord nodeLayout
let zcoordinate = zcoord nodeLayout
transformationMatrix <- readIORef matrixStore
(Vector3 a b c) <- transformVector (Vector3 diffx 0 0) transformationMatrix
let newxcoordinate = xcoordinate + a
let newycoordinate = ycoordinate + b
let newzcoordinate = zcoordinate + c
let newNodeLayout = Vector3 newxcoordinate newycoordinate (newzcoordinate::GLfloat)
let newLayoutAttribute = processLayout newNodeLayout
changeAttr currentGraphSet "Layout" myNode newLayoutAttribute
postRedisplay Nothing
else
return()
These are utility functions and default values/attributes for the new nodes that are to be added.
xcoord :: Vector3 a -> a
xcoord (Vector3 a b c) = a
ycoord :: Vector3 a -> a
ycoord (Vector3 a b c) = b
zcoord :: Vector3 a -> a
zcoord (Vector3 a b c) = c
processLayout converts the Vector3 type into the AttrValue type so that Vector3 types can be inserted into the
graph data structure.
processLayout :: Vector3 GLfloat -> AttrValue
processLayout (Vector3 first second third) = (TenOf10 (Tup [Tup_Float (Gxl_1_0_1_DTD.Float (show first)),
Tup_Float (Gxl_1_0_1_DTD.Float (show second)),Tup_Float (Gxl_1_0_1_DTD.Float (show third))]))
myItemAttr returns a default ItemAttr for a newly constructed node. ItemAttr contains the Gxl Id of the graph
and FNode states that the current item is a node. Our node’s Gxl Id’s are generated by naming them ”Node 1”,”Node
2” ... ”Node x” where x is the number of nodes in the graph. If the new node is the 5th node in the graph, the node’s
Gxl Id would be ”Node 5”.
myItemAttr :: Prelude.Int -> ItemAttr
myItemAttr numberOfNodes = ItemAttr FNode (Just ("Node"++" "++(show(numberOfNodes)))) Nothing
myItemInfo returns a default ItemInfo for a newly constructed node.
myItemInfo :: Prelude.Int -> GXL_DTD.Id -> ItemInfo
myItemInfo numberOfNodes z = ItemInfo Nothing [z] [] [] (myItemAttr numberOfNodes)
myInfoLayoutNode returns a default AttrInfo for the construction of a new node. In this case, the new node’s
layout or position in the graph would be set to (0,0,0) which is the origin.
myInfoLayoutNode :: AttrInfo
myInfoLayoutNode = AttrInfo Nothing [] (TenOf10 (Tup [Tup_Float (Gxl_1_0_1_DTD.Float (show 0)),
Tup_Float (Gxl_1_0_1_DTD.Float (show 0)),Tup_Float (Gxl_1_0_1_DTD.Float (show 0))]))
layoutAttr
layoutAttr represents the ”Layout” field of a node in the graph data structure.
106
layoutAttr :: AttrAttr
layoutAttr = AttrAttr Nothing "Layout"
Nothing
unMaybe ignores the Maybe type and just returns what it contains.
unMaybe :: Maybe a -> a
unMaybe (Just a) = a
transformVector and transformVertex are functions which given a Vector or a Vertex respectively and a list representing
the matrix that the sapce has been multiplied by, will give us the new transformed Vector/Vertex according to
the new set of axis in the current space. This is important so that when we rotate the space we conserve the
horizontal/vertical/depth movement irregardless of the direction of the axis.
transformVector :: Vector3 GLfloat -> [GLdouble] -> IO (Vector3 GLfloat)
transformVector (Vector3 a b c) xs = do
let newa = ((read(show(xs !! 0))::GLfloat) * a) + ((read(show(xs !! 1))::GLfloat) * b) +
( (read(show(xs !! 2))::GLfloat) * c)
let newb = ((read(show(xs !! 4))::GLfloat) * a) + ((read(show(xs !! 5))::GLfloat) * b) +
( (read(show(xs !! 6))::GLfloat) * c)
let newc = ((read(show(xs !! 8))::GLfloat) * a) + ((read(show(xs !! 9))::GLfloat) * b) +
( (read(show(xs !! 10))::GLfloat) * c)
return (Vector3 newa newb newc)
transformVertex :: Vertex3 GLdouble -> [GLdouble] -> IO (Vertex3 GLdouble)
transformVertex (Vertex3 a b c) xs = do
let newa = ((read(show(xs !! 0))::GLdouble) * a) + ((read(show(xs !! 1))::GLdouble) * b) +
( (read(show(xs !! 2))::GLdouble) * c)
let newb = ((read(show(xs !! 4))::GLdouble) * a) + ((read(show(xs !! 5))::GLdouble) * b) +
( (read(show(xs !! 6))::GLdouble) * c)
let newc = ((read(show(xs !! 8))::GLdouble) * a) + ((read(show(xs !! 9))::GLdouble) * b) +
( (read(show(xs !! 10))::GLdouble) * c)
return (Vertex3 newa newb newc)
module PickObject provides a function to select an object that the user clicks on using his mouse. This example is
closely based on that in the RedBook called PickDepth.hs that comes with GLUT. The secret this module hides is
the way this is achieved. The basic concept is that we create a region which the user clicked nearby. In this region a
hit buffer is set up, then we render the graph. Any object that is rendered in that region is recorded in the hit record.
After that is acomplished we then process the hit record in a seperate function and get the object that is nearest on
the screen to the user and return that object’s ID.//
module PickObject (selectObject)
import
import
import
import
import
import
import
import
import
import
import
import
import
where
Data.IORef ( IORef, newIORef, readIORef, modifyIORef, writeIORef)
Graphics.Rendering.OpenGL.GL
Graphics.Rendering.OpenGL.GLU
Graphics.UI.GLUT.Callbacks.Window ( MouseButton )
Graphics.UI.GLUT.Window
Graphics.UI.GLUT hiding (MenuItem)
DrawGraph
ViewDataStructure
GxlGraphSetManage
Gxl_1_0_1_DTD
GXL_DTD
Utils
SettingsDataStructure
107
Here we set the buffer size connstant to 512, this can be easily changed here without affecting the rest of the code.//
bufSize :: GLsizei
bufSize = 512
selectObject is the function which does the majority of the work. It returns the hit object. This is accomplished in
the following fashion: we create the picking region, render the graph and then call the process hit function to process
the records of the hit objects.
selectObject :: IORef View -> GLsizei -> GLsizei -> IORef GxlGraphSet -> IORef [GLdouble]
-> IORef SettingsDataStructure -> IO(GLuint)
selectObject view x y dataStructure matrixStore settings= do
vp@(_, (Size width height)) <- get viewport
(_, maybeHitRecords) <- getHitRecords bufSize $
withName (Name 0) $ do
matrixMode $= Projection
preservingMatrix $ do
loadIdentity
-- create 1x1 pixel picking region near cursor location
pickMatrix (fromIntegral x, fromIntegral height - fromIntegral y) (0.1,0.1) vp
perspective 45.0 (fromIntegral width / fromIntegral height) 1 200.0
matrixMode $= Modelview 0
loadIdentity
lookAt (Vertex3 0.0 0.0 14.0) (Vertex3 0.0 0.0 0.0) (Vector3 0 1 0)
displayGraph view dataStructure matrixStore settings
matrixMode $= Projection
matrixMode $= Modelview 0
flush
hit <- processHits maybeHitRecords
postRedisplay Nothing
return(hit)
processHits is the function which takes in the record of hits and then returns the nearest object on the screen. The
objects are processed one by one, and each time we check the distance and save it together with its corresponding
object if it is the smallest one we have so far. Finally the nearest object is returned. If no object is hit we return 0
as the Id.
processHits :: Maybe[HitRecord] -> IO GLuint
processHits (Just hitRecords) = do
min <- newIORef 2.0
num <- newIORef 0
flip mapM_ hitRecords $ \(HitRecord z1 z2 names) -> do
m <- readIORef min
--z1 is the minimum depth of that hit
if (m>z1) then do
(modifyIORef min (\x ->(z1)))
sequence_ [ modifyIORef num (\x -> n) | Name n <- names ]
else (modifyIORef min (\x ->m))
n <- readIORef num
return n
processHits Nothing = return (0)
Module SettingsFileManager, as the name indicates, gives us functions and facilities to open and save Settings Files.
The secret it hides is how the settings files are manipulated to get this result. A decision was made here to use our
108
own format for a setting file, which will consist of three lines the first having the number of cylinders used to render
a bent edge, the second whether collision is on or off and whether axis rendering is on or off to match the created
Settings Data Structure.
module SettingsFileManager (openSettings,saveSettings)
import
import
import
import
import
import
import
import
import
import
import
import
import
import
import
import
where
Data.Char
Data.IORef ( IORef, newIORef, readIORef, modifyIORef, writeIORef)
Data.FiniteMap
IO
Graphics.Rendering.OpenGL.GL
Graphics.Rendering.OpenGL.GLU
Graphics.UI.GLUT.Callbacks.Window ( MouseButton )
Graphics.UI.GLUT.Window
Graphics.UI.GLUT hiding (MenuItem)
Graphics.UI.WX hiding (KeyUp,KeyDown,color,motion,WXCore.WxcTypes.Size,Classes.position,Attributes.get)
Graphics.UI.WXCore.Frame
System.Exit(exitWith, ExitCode(ExitSuccess), exitFailure)
Control.Monad ( liftM, zipWithM_ )
Data.Char
( ord )
Data.List
( genericLength )
SettingsDataStructure
settingsFiles is used to filter the settings files, here we allow the settings file to be of any type.
settingsFiles:: [(String, [String])]
settingsFiles = [("Settings files",["*"])]
loadSettingsFile is used to load a settings file. We prompt the user for a file and once that is returned we read it in
and return the corresponding settings. If an error is encountered we just return.
loadSettingsFile :: FilePath -> IORef SettingsDataStructure -> IO ()
loadSettingsFile path settings = catch(do
handle <- openFile path ReadWriteMode
first <- hGetLine handle
second <- hGetLine handle
third <- hGetLine handle
updateNumOfCylinders ((read first)::Prelude.Int) settings
updateCollisionOn ((read second)::Prelude.Bool) settings
updateAxisOn ((read third)::Prelude.Bool) settings
hClose handle)
(\err -> return() )
openSettings is a function which uses wxHaskell facilities by opening a file dialog for the user and prompting him for
the settings file he whishes to open.
openSettings ::IORef SettingsDataStructure -> IO ()
openSettings settings
= do f <- frameCreateDefault ("File Dialog")
mbfname <- fileOpenDialog f False True "Open Settings" settingsFiles "" ""
case mbfname of
Nothing
-> return ()
Just fname -> loadSettingsFile fname settings
109
saveSettingsFile is used to save a settings file. We prompt the user for a file and once that is returned we save the
settings in it. If an error is encountered we just return.
saveSettingsFile :: FilePath -> IORef SettingsDataStructure -> IO ()
saveSettingsFile path settings = catch (do
handle <- openFile path ReadWriteMode
mySettings <- readIORef settings
myNumOfCylindersIORef <- getNumOfCylinders mySettings
myNumOfCylinders <- readIORef myNumOfCylindersIORef
myCollisionOnIORef <- getCollisionOn mySettings
myCollisionOn <- readIORef myCollisionOnIORef
myAxisOnIORef <- getCollisionOn mySettings
myAxisOn <- readIORef myAxisOnIORef
hPutStrLn handle (show myNumOfCylinders)
hPutStrLn handle (show myCollisionOn)
hPutStrLn handle (show myAxisOn)
hClose handle)
(\err -> return() )
saveSettings is a function which uses wxHaskell facilities by opening a file dialog for the user and prompting him for
a file that he wishes to save the settings into.
saveSettings ::IORef SettingsDataStructure -> IO ()
saveSettings settings
= do f <- frameCreateDefault ("File Dialog")
mbfname <- fileSaveDialog f False True "Save Settings" "" ""
case mbfname of
Nothing
-> return ()
Just fname -> saveSettingsFile fname settings
Module SettingsDataStructure provides us with the data structure SettingsDataStructure which consists of the following: an IORef of type integer and two IORef of type boolean. The integer IORef refers to the number of cylinders
that is used to draw bended edges. The first boolean IORef refers to whether collision detection is turned on or off
and finally the last boolean IORef refers to whether or not axis is to be rendered. This module presents an input text
dialog box for modifying the number of cylinders and a dialog box which toggles collision detection / axis rendering
to on or off.
The service of this module is that it provides a set of functions to determine the values of the IORefs in the data
structure and to modify each of them. The way the settings are modified is by presenting a dialog box stating what
the current setting is and what it would be changed to. Since we using wxHaskell in our implementation of dialog
boxes and user interface items, there will be wxHaskell functions in the implementation. Once the values are changed,
it will modify the IORefs appropriately. Initially collision detection is set to false (off), axis rendering is set to false
(off) and the initial number of cylinders is set to 30. We have set that the minimum value of cylinders to be 2 as we
have one control point for the interpolation of the bended edge. Any less than 2 will not be valid. If the user enters
a number less than 2, the minimum value will be used instead. The secret of this module is that it hides how the
SettingsDataStructure is represented and how the fields are individually extracted and changed.
module SettingsDataStructure (SettingsDataStructure,initSettingsDataStructure,newSettingsDataStructure,
getNumOfCylinders,getCollisionOn,getAxisOn,changeCylinderNumber,changeCollisionDetection,changeAxisDisplay,
updateNumOfCylinders,updateCollisionOn,updateAxisOn) where
110
import
import
import
import
import
import
Data.IORef ( IORef, newIORef, readIORef, modifyIORef, writeIORef)
Graphics.UI.WX hiding (KeyUp,KeyDown,motion,WXCore.WxcTypes.Size,Classes.position,Attributes.get)
Graphics.UI.WXCore.WxcTypes
Graphics.UI.WXCore hiding (WxcClasses.View)
GHC.Float
IO
The settings data structure is defined here as consisting of an IORef to an integer and two IORefs to a boolean value.
data SettingsDataStructure = SettingsDataStructure (IORef Prelude.Int ) (IORef Prelude.Bool) (IORef Prelude.Bool)
The constants which define the initial number of cylinders, initial value for collision detection, initial value for collision
detection, and the minimum value of cylinders are written as below.
intialNumOfCylinders::Prelude.Int
intialNumOfCylinders=30
initialCollisionOn::Prelude.Bool
initialCollisionOn=False
initialAxisOn::Prelude.Bool
initialAxisOn=False
minimumValueInt::Prelude.Int
minimumValueInt = 2
initSettingsDataStructure is used to initialize the IORefs in the SettingsDataStructure it takes as its parameter. This
is used when reinitializing the SettingsDataStructure to the default values is needed.
initSettingsDataStructure:: SettingsDataStructure -> IO()
initSettingsDataStructure (SettingsDataStructure numOfCylinders collisionOn axisOn) = do
modifyIORef numOfCylinders (\x -> intialNumOfCylinders)
modifyIORef collisionOn (\x -> initialCollisionOn)
modifyIORef axisOn (\x -> initialAxisOn)
return()
newSettingsDataStructure returns an IORef to a new settings data structure where its values are initialized to its
default values. This function is needed to be called at least once to create a newSettingsDataStructure.
newSettingsDataStructure::IO(IORef SettingsDataStructure)
newSettingsDataStructure = do
numOfCylinders <- newIORef intialNumOfCylinders
collisionOn <- newIORef initialCollisionOn
axisOn <- newIORef initialAxisOn
settingsDataStructure <- newIORef (SettingsDataStructure numOfCylinders collisionOn axisOn)
return (settingsDataStructure)
getNumOfCylinders returns the number of cylinders currently set in the particular SettingsDataStructure which
it takes in as a paremeter. Similarly getCollisionOn determines if collision is turned on or off in the particular
SettingsDataStructure which it takes in as a parameter and getAxisOn determines if axis displaying is turbed on or
off.
111
getNumOfCylinders:: SettingsDataStructure -> IO (IORef Prelude.Int)
getNumOfCylinders (SettingsDataStructure numOfCylinders collisionOn axisOn) = return (numOfCylinders)
getCollisionOn:: SettingsDataStructure -> IO (IORef Prelude.Bool)
getCollisionOn (SettingsDataStructure numOfCylinders collisionOn axisOn) = return (collisionOn)
getAxisOn:: SettingsDataStructure -> IO (IORef Prelude.Bool)
getAxisOn (SettingsDataStructure numOfCylinders collisionOn axisOn) = return (axisOn)
updateNumOfCylinders is used to modify the number of cylinders in a SettingsDataStructure. The function takes in
the new value desired and modifies the IORef to the SettingsDataStructure to the new value. Similarly with updateCollisionOn, the function takes in a new boolean value and modifies the IORef of the SettingsDataStructure. Finally
in a similar fashion updateAxisOn takes in a new boolean value and modifies the IORef of the SettingsDataStructure.
All three of these functions are called after retrieving the new desired value from the user via the dialog boxes.
updateNumOfCylinders:: Prelude.Int -> IORef SettingsDataStructure -> IO ()
updateNumOfCylinders newNumber settingsDataStructure = do
mySettingsDataStructure <- readIORef settingsDataStructure
myNumOfCylinders <- newIORef newNumber
myCollisionOn <- getCollisionOn mySettingsDataStructure
myAxisOn <- getAxisOn mySettingsDataStructure
modifyIORef settingsDataStructure (\x -> (SettingsDataStructure myNumOfCylinders myCollisionOn myAxisOn))
return()
updateCollisionOn:: Prelude.Bool -> IORef SettingsDataStructure -> IO ()
updateCollisionOn newBoolean settingsDataStructure = do
mySettingsDataStructure <- readIORef settingsDataStructure
myCollisionOn <- newIORef newBoolean
myNumOfCylinders <- getNumOfCylinders mySettingsDataStructure
myAxisOn <- getAxisOn mySettingsDataStructure
modifyIORef settingsDataStructure (\x -> (SettingsDataStructure myNumOfCylinders myCollisionOn myAxisOn))
return()
updateAxisOn:: Prelude.Bool -> IORef SettingsDataStructure -> IO ()
updateAxisOn newBoolean settingsDataStructure = do
mySettingsDataStructure <- readIORef settingsDataStructure
myAxisOn <- newIORef newBoolean
myCollisionOn <- getCollisionOn mySettingsDataStructure
myNumOfCylinders <- getNumOfCylinders mySettingsDataStructure
modifyIORef settingsDataStructure (\x -> (SettingsDataStructure myNumOfCylinders myCollisionOn myAxisOn))
return()
changeCylinderNumber opens a dialog box which asks the user for an integer, which is then used with the functions
above to update the SettingsDataStructure to the new values. The dialog boxes are implemented using wxHaskell
therefore wxHaskell functions are used. But for changeCollisionDetection and changeAxisDisplay it opens a different
dialog box which instead of asking for the desired value for the collision detection setting, it asks if the user wants to
toggle the setting by presenting a simple confirmation dialog. This is more convenient for the user, as entering ”Off”
or ”On” in a text input box would be rather tedious.
changeCylinderNumber:: IORef SettingsDataStructure -> IO ()
changeCylinderNumber settings = do
newNumber <- openIntDialog settings
updateNumOfCylinders newNumber settings
112
return()
changeCollisionDetection:: IORef SettingsDataStructure -> IO ()
changeCollisionDetection settings = do
newBool <- openBoolConfirmationDialogCollision settings
updateCollisionOn newBool settings
return()
changeAxisDisplay:: IORef SettingsDataStructure -> IO ()
changeAxisDisplay settings = do
newBool <- openBoolConfirmationDialogAxis settings
updateAxisOn newBool settings
return()
openIntDialog is responsible for creating the text dialog box in which the user will enter the new desired value for the
number of cylinders. If the value entered is not an integer (i.e. decimal numbers), then the integer part of that value
is returned. If the value is smaller than the minimum value set, it will return the minimum value instead of the invalid
value. openBoolConfirmationDialogCollision/openBoolConfirmationDialogAxis opens a confirmation dialog asking
the user if he wants the value for collision/axis rendering detection to be toggled. There is no error detection there as
there is no other choice to change boolean values. Basically these three functions just retrive the desired values from
the user via dialog boxes and returns it to the calling function which will update the settingsDataStructure.
openIntDialog::IORef SettingsDataStructure -> IO(Prelude.Int)
openIntDialog settings = do
mySettings <- readIORef settings
myNum <- getNumOfCylinders mySettings
defaultValueInt <- readIORef (myNum)
f <- frameCreateDefault ("Number of Cylinders Dialog")
y<-textDialog f ("Please Enter Number of Cylinders") "Number Of Cylinders" (show(defaultValueInt))
if (null y)
then do return(defaultValueInt)
else do let list=(reads y)::[(Prelude.Float, String)]
if (list==[])
then do return(minimumValueInt)
else do let x=(read (y))::Prelude.Float
let z = float2Int x
return (max minimumValueInt z)
openBoolConfirmationDialogCollision::IORef SettingsDataStructure -> IO(Prelude.Bool)
openBoolConfirmationDialogCollision settings = do
mySettings <- readIORef settings
myDetection <- getCollisionOn mySettings
booleanValue <- readIORef (myDetection)
let complementValue = complement (booleanValue)
f <- frameCreateDefault ("Collision Detection Dialog")
y <- confirmDialog f "Confirm" ("Would you like to turn collision detection "++complementValue) True
if (y==True)
then if (complementValue=="On")
then return(True)
else return(False)
else if (complementValue=="On")
then return(False)
113
else return(True)
openBoolConfirmationDialogAxis::IORef SettingsDataStructure -> IO(Prelude.Bool)
openBoolConfirmationDialogAxis settings = do
mySettings <- readIORef settings
myDetection <- getAxisOn mySettings
booleanValue <- readIORef (myDetection)
let complementValue = complement (booleanValue)
f <- frameCreateDefault ("Axis Rendering Dialog")
y <- confirmDialog f "Confirm" ("Would you like to turn axis rendering "++complementValue) True
if (y==True)
then if (complementValue=="On")
then return(True)
else return(False)
else if (complementValue=="On")
then return(False)
else return(True)
complement returns ”Off” if its parameter is true and ”On” if its parameter is false.
complement::Prelude.Bool -> Prelude.String
complement True = "Off"
complement False = "On"
Module UndoDataStructure provides us with the data structure UndoDataStructure which consists of the following:
two IORefs each referring to a list of GxlGraphSets. This data structure supports both undo and redo, where one list
of GxlGraphSets are for undo’s, hence the undoList and the other IORef is for redo’s, hence the redoList. The way
this undo and redo is implemented is that, when anything in the graph is changed, that particular instance of the
graph data structure is added to the undoList. When the user requests for an undo, the latest graph data structure
stored in the undoList is retrived and then it is transferred to the redoList. When the user requests for a redo, the
latest graph data structure stored in the redoList is retrived and then it is transferred to the undoList. This process
ensures that undo’s and redo’s are processed correctly. The length of the lists are limited to maxList, which is 10. So
only 10 levels undos or redos are possible at one time.
The service of this module is that it provides a set of functions to extract the latest graph data structure from the
undoList or the redoList, to save graph data structures into the undoList, to undo or redo which follows the procedure described above and it also provides a function to initialize an UndoDataStructure where it sets both the
IORefs to refer to the empty list. view to a default value who’s fields are set by constants defined below. The secret
of the module is that it hides how the undo data structure is represented and how the fields are individually extracted.
module UndoDataStructure (UndoDataStructure,initUndoDataStructure,newUndoDataStructure,
updateGraphDataStructure,undo,redo) where
import Data.IORef ( IORef, newIORef, readIORef, modifyIORef, writeIORef)
import IO
import Gxl_1_0_1_DTD hiding (Int)
import GXL_DTD
data UndoDataStructure = UndoDataStructure (IORef [GxlGraphSet]) (IORef [GxlGraphSet])
114
maxList defines the maximum length of the undo list and redo list
maxList::Prelude.Int
maxList = 10
initUndoDataStructure initializes the undo and redo lists of an UndoDataStructure to the empty list.
initUndoDataStructure:: UndoDataStructure -> IO()
initUndoDataStructure (UndoDataStructure undoList redoList) = do
modifyIORef undoList (\x -> [])
modifyIORef redoList (\x -> [])
return()
newUndoDataStructure returns a new UndoDataStructure. This data structure would have the undo and redo lists
being empty. This function is required to be called once for there to be an undoDataStructure to work with.
newUndoDataStructure::IO(IORef UndoDataStructure)
newUndoDataStructure = do
undoList <- newIORef []
redoList <- newIORef []
undoDataStructure <- newIORef (UndoDataStructure undoList redoList)
return (undoDataStructure)
getUndoList and getRedoList are local functions which retrieves the undo list for the purpose of the other functions
in the module.
getUndoList:: UndoDataStructure -> IO (IORef [GxlGraphSet])
getUndoList (UndoDataStructure undoList redoList) = return (undoList)
getRedoList:: UndoDataStructure -> IO (IORef [GxlGraphSet])
getRedoList (UndoDataStructure undoList redoList) = return (redoList)
updateGraphDataStructure updates the UndoDataStructure with a new graph data structure. Whenever a changed
that can be undoed is done, this function is called to save the previous state of the graph data structure before the
change into the undo data structure. When the length of the undo list is full, it drops the earliest item in the list to
make space for the newer one.
updateGraphDataStructure:: GxlGraphSet -> IORef GxlGraphSet -> IORef UndoDataStructure -> IO ()
updateGraphDataStructure graphSet dataStructure undoDataStructure = do
myUndoDataStructure <- readIORef undoDataStructure
myUndoList <- getUndoList myUndoDataStructure
myRedoList <- getRedoList myUndoDataStructure
myDataStructure <- readIORef dataStructure
undoList <- readIORef myUndoList
let lengthOfUndoList = length(undoList)
if (lengthOfUndoList>=maxList)
then do
let shortenedUndoList = take (lengthOfUndoList-1) undoList
let newUndoList = myDataStructure:shortenedUndoList
modifyIORef myUndoList (\x -> newUndoList)
modifyIORef undoDataStructure (\x -> (UndoDataStructure myUndoList myRedoList))
modifyIORef dataStructure (\x -> graphSet)
return()
else do
let newUndoList = myDataStructure:undoList
115
modifyIORef myUndoList (\x -> newUndoList)
modifyIORef undoDataStructure (\x -> (UndoDataStructure myUndoList myRedoList))
modifyIORef dataStructure (\x -> graphSet)
return()
return()
undo and redo is as its name says, it undoes and redoes. Undo takes in the IORef to the current graph data structure
and overwrites it with the latest copy of the graph data structure in the undo list, therefore ’undoing’ all changes that
was done. The graph data structure in the undo list is then dropped from the list and added to the redo list instead.
Similarly redo takes in the IORef to the current graph data structure and overwrites it with the latest copy of the
graph data structure in the redo list, therefore ’redoing’ all the changes that was undoed. The graph data structure
in the redo list is then dropped from the list and added to the undo list instead.
undo::IORef GxlGraphSet -> IORef UndoDataStructure -> IO()
undo dataStructure undoDataStructure = do
myUndoDataStructure <- readIORef undoDataStructure
myUndoList <- getUndoList myUndoDataStructure
myRedoList <- getRedoList myUndoDataStructure
myDataStructure <- readIORef dataStructure
undoList <- readIORef myUndoList
redoList <- readIORef myRedoList
if ((length undoList)>=1)
then do
let newGraphSet = undoList !! 0
let newUndoList = drop 1 undoList
let newRedoList = myDataStructure:redoList
modifyIORef myUndoList (\x -> newUndoList)
modifyIORef myRedoList (\x -> newRedoList)
modifyIORef undoDataStructure (\x -> (UndoDataStructure myUndoList myRedoList))
modifyIORef dataStructure (\x -> newGraphSet)
else return()
return()
redo::IORef GxlGraphSet -> IORef UndoDataStructure -> IO()
redo dataStructure undoDataStructure = do
myUndoDataStructure <- readIORef undoDataStructure
myUndoList <- getUndoList myUndoDataStructure
myRedoList <- getRedoList myUndoDataStructure
myDataStructure <- readIORef dataStructure
undoList <- readIORef myUndoList
redoList <- readIORef myRedoList
if ((length redoList)>=1)
then do
let newGraphSet = redoList !! 0
let newRedoList = drop 1 redoList
let newUndoList = myDataStructure:undoList
modifyIORef myUndoList (\x -> newUndoList)
modifyIORef myRedoList (\x -> newRedoList)
modifyIORef undoDataStructure (\x -> (UndoDataStructure myUndoList myRedoList))
modifyIORef dataStructure (\x -> newGraphSet)
else return()
return()
116
Module ViewDataStructure provides us with the data structure View which consists of the following: a horizontal
component of type GLfloat, a vertical component of type GLfloat and finally the camera distance of type GLfloat.
The horizontal and vertical components of the data structure will basically store the amount the user has rotated
along the x-axis or y-axis. This module is responsible for keeping track of graph rotation, view rotation and zooming.
The service of this module is that it provides are a set of functions to extract information and to save values of GLfloat
to any particular field, and it also provides a function to initialize a view to a default value who’s fields are set by
constants defined below. The secret of the module is that it hides how the View data structure is represented and
how the fields are individually extracted.
module ViewDataStructure (View,getHorizontal,getVertical,getCameraDistance,
changeHorizontal,changeVertical,changeCameraDistance,initView) where
import Data.IORef ( IORef, newIORef, readIORef, modifyIORef, writeIORef)
import Graphics.Rendering.OpenGL.GL
Below, the View data type is defined as described above where its constructor is View.
data View = View GLfloat GLfloat GLfloat
The default view fields are defined using constants to support modifiability.
defaultHorizontal::GLfloat
defaultHorizontal = 0
defaultVertical::GLfloat
defaultVertical = 0
defaultCameraDistance::GLfloat
defaultCameraDistance = (0.0::GLfloat)
The following functions are used to extract individual fields from the View data structure.
getHorizontal :: View -> GLfloat
getHorizontal (View a b c) = a
getVertical :: View -> GLfloat
getVertical (View a b c) = b
getCameraDistance :: View -> GLfloat
getCameraDistance (View a b c) = c
The following functions are used to change individual fields in the View data structure. It takes in as input the View
data structure and the new value and returns the modified View data structure.
changeHorizontal :: View -> GLfloat -> IO View
changeHorizontal (View a b c) d = return (View d b c)
changeVertical :: View -> GLfloat -> IO View
changeVertical (View a b c) d = return (View a d c)
changeCameraDistance :: View -> GLfloat -> IO View
changeCameraDistance (View a b c) d = return (View a b d)
117
initView returns the View data structure with the default values using the constants defined above.
initView :: IO (View)
initView = do
return (View defaultHorizontal defaultVertical defaultCameraDistance)
Module ViewFileManager, as the name indicates, gives us functions and facilities to open, save and close View Files.
The secret it hides is how the view files are manipulated to get this result. A decision was made here to use our own
format for a view file, which will consist of three lines the first having the horizontal angle, the second the vertical
and the third the camera distance to match the created View Data Structure.
module ViewFileManager (openView,saveView,closeView)
import
import
import
import
import
import
import
import
import
import
import
import
import
import
import
import
where
Data.Char
Data.IORef ( IORef, newIORef, readIORef, modifyIORef, writeIORef)
Data.FiniteMap
IO
Graphics.Rendering.OpenGL.GL
Graphics.Rendering.OpenGL.GLU
Graphics.UI.GLUT.Callbacks.Window ( MouseButton )
Graphics.UI.GLUT.Window
Graphics.UI.GLUT hiding (MenuItem)
Graphics.UI.WX hiding (KeyUp,KeyDown,color,motion,WXCore.WxcTypes.Size,Classes.position,Attributes.get)
Graphics.UI.WXCore.Frame
System.Exit(exitWith, ExitCode(ExitSuccess), exitFailure)
Control.Monad ( liftM, zipWithM_ )
Data.Char
( ord )
Data.List
( genericLength )
ViewDataStructure
viewFiles is used to filter the view files, here we allow the view file to be of any type.
viewFiles:: [(String, [String])]
viewFiles = [("View files",["*"])]
loadViewFile is used to load a view file. We prompt the user for a file and once that is returned we read it in and
return the corresponding view. If an error is encountered we just return.
loadViewFile :: FilePath -> IORef View -> IO ()
loadViewFile path view = catch(do
myView <- initView
handle <- openFile path ReadWriteMode
first <- hGetLine handle
second <- hGetLine handle
third <- hGetLine handle
myView1 <- changeHorizontal myView ((read first)::GLfloat)
myView2 <- changeVertical myView1 ((read second)::GLfloat)
myView3 <- changeCameraDistance myView2 ((read third)::GLfloat)
modifyIORef view (\x -> myView3)
hClose handle)
(\err -> return() )
118
openView is a function which uses wxHaskell facilities by opening a file dialog for the user and prompting him for the
view file he whishes to open.
openView ::IORef View -> IO ()
openView view = do
f <- frameCreateDefault ("File Dialog")
mbfname <- fileOpenDialog f False True "Open View" viewFiles "" ""
case mbfname of
Nothing
-> return ()
Just fname -> loadViewFile fname view
saveViewFile is used to save a view file. We prompt the user for a file and once that is returned we save the view in
it. If an error is encountered we just return.
saveViewFile :: FilePath -> IORef View -> IO ()
saveViewFile path view = catch (do
handle <- openFile path ReadWriteMode
myView <- readIORef view
hPutStrLn handle (show (getHorizontal myView))
hPutStrLn handle (show (getVertical myView))
hPutStrLn handle (show (getCameraDistance myView))
hClose handle)
(\err -> return() )
saveView is a function which uses wxHaskell facilities by opening a file dialog for the user and prompting him for a
file that he wishes to save the view into.
saveView ::IORef View -> IO ()
saveView view = do
f <- frameCreateDefault ("File Dialog")
mbfname <- fileSaveDialog f False True "Save View" "" ""
case mbfname of
Nothing
-> return ()
Just fname -> saveViewFile fname view
closeView is a function which closes the window associated with the current view and decrements the number of
windows current open viewc ount. If this is the last window that was open then the whole application is closed.
closeView:: Graphics.UI.GLUT.Window.Window -> IORef Int -> IO ()
closeView x view_count=do
modifyIORef view_count (\x -> x-1)
p <- readIORef view_count
if p==0 then (exitWith ExitSuccess)
else (destroyWindow x)
Module ViewManipulation is responsible for the manipulation of the views in the program. The data structure View
from the module ViewDataStructure is changed, modified and updated using the functions from this module. There
is two things that can modify the view, that is when the user zooms in the view or rotates the view. The view data
structure stores values that state how much did the view get rotated or zoomed. It is this module together with the
motion callback which updates these values according to how much the user moves the mouse. This module’s functions
are seperated according to how the user changes the values. For instance, holding the left mouse button while moving
119
the mouse would be using the rotateViewButtonDown function, while zooming using the wheel would be calling the
zoomViewWheelUp and zoomViewWheelDown. All that is needed to rotate a particular graph view is by modifying the values stored in its View data structure. The graph drawing module takes these values and draws appropriately.
The service of this module is that it provides a set of functions to update the View data structure and the IORefs
which store the amount of rotation according to what how the user rotates or zooms. The secret of thie module is
the way the view data structure is updated and how the IORefs containing the amount of rotation is calculated to
the new amount.
module ViewManipulation (rotateViewButtonDown,zoomViewWheelUp,zoomViewWheelDown)
import
import
import
import
import
import
import
import
import
import
import
import
import
where
Gxl_1_0_1_DTD
GXL_DTD
INIT
Data.IORef
Graphics.Rendering.OpenGL.GL
Graphics.Rendering.OpenGL.GLU
Graphics.UI.GLUT
ViewDataStructure
GraphInterface
Node
Utils
GxlGraphSetManage
Text.XML.HaXml.OneOfN
rotateViewButtonDown is responsible for modifying the new mouse coordinates and old mouse coordinates according
to the current mouse coordinates. The real functionality of rotation is in the function calculateViewRotation.
rotateViewButtonDown :: IORef View -> IORef GLfloat -> IORef GLfloat -> IORef GLfloat -> IORef GLfloat
-> GLsizei -> GLsizei -> IO()
rotateViewButtonDown view oldx oldy newx newy x y = do
oy <- readIORef oldy
ox <- readIORef oldx
modifyIORef newy (\d ->(fromIntegral y))
modifyIORef newx (\d ->(fromIntegral x))
ny <- readIORef newy
nx <- readIORef newx
calculateViewRotation oldx oldy newx newy view
modifyIORef oldx (\d ->nx)
modifyIORef oldy (\d ->ny)
return()
calculateViewRotation takes in as parameters the IORefs which represents the old mouse coordinates, the new mouse
coordinates and the current mouse coordinates. This function calculates the difference between the old mouse coordinates and new coordinates. From the difference, we can infer which way the mouse is moved, therefore modify the
values in the view data structure accordingly. After modifying the view data structure, postRedisplay is called to
redraw the graph using the new rotation.
calculateViewRotation :: IORef Prelude.Float->IORef Prelude.Float->IORef Prelude.Float
->IORef Prelude.Float->IORef View->IO ()
calculateViewRotation oldx oldy newx newy view = do
ny <- readIORef newy
oy <- readIORef oldy
nx <- readIORef newx
120
ox <- readIORef oldx
let diffy = ny-oy
let diffx = nx-ox
if (diffy <=(-1))
then do
myView <- readIORef view
let newVertical = ((getVertical myView)+1)
newView <- changeVertical myView newVertical
modifyIORef view (\x -> newView)
postRedisplay Nothing
else if (diffy >= 1)
then do
myView <- readIORef view
let newVertical = ((getVertical myView)-1)
newView <- changeVertical myView newVertical
modifyIORef view (\x -> newView)
postRedisplay Nothing
else return()
if (diffx <=(-1))
then do
myView <- readIORef view
let newHorizontal = ((getHorizontal myView)+1)
newView <- changeHorizontal myView newHorizontal
modifyIORef view (\x -> newView)
postRedisplay Nothing
else if (diffx >= 1)
then do
myView <- readIORef view
let newHorizontal = ((getHorizontal myView)-1)
newView <- changeHorizontal myView newHorizontal
modifyIORef view (\x -> newView)
postRedisplay Nothing
else
return()
zoomViewWheelUp modifies the component in the view data structure which corresponds to the distance of the
camera from the objects. The wheel up of the mouse is for zooming in and wheel down is for zooming out.
zoomViewWheelUp::IORef View -> IO()
zoomViewWheelUp view = do
let moveDiff = 0.5
myView <- readIORef view
let newCameraDistance = ((getCameraDistance myView)+moveDiff)
newView <- changeCameraDistance myView newCameraDistance;
modifyIORef view (\x -> newView)
return()
zoomViewWheelDown::IORef View -> IO()
zoomViewWheelDown view = do
let moveDiff = 0.5
myView <- readIORef view
let newCameraDistance = ((getCameraDistance myView)-moveDiff)
newView <- changeCameraDistance myView newCameraDistance;
modifyIORef view (\x -> newView)
return()
4
VERIFICATION
4.1
High Level Test Plan
The team tested the application using several approaches to ensure the most confidence in the
final product’s functionality.
It was be very difficult to perform automated testing on 3-dimensional graphs due to its visual
nature, so most of the testing was be done manually.
White box testing was conducted on each module by testing its interface functions. The focus of
this round of tests was to ensure that the functions tested perform at least their basic functions
with some degree of reliability. The test cases and their results are discussed in detail in table
(1). Documenting this testing phase was very important as anytime a particular function was
modified to fix a bug discovered in the black box testing phase, we had a set of pre-compiled tests
which would tell us, rather quickly, whether the bug fix introduced further bugs or not . The test
cases were generated in a rather systematic way by considering the possible flows that could occur
within the function and making sure that in each of those cases the desired result is delivered.
Special attention was given to functions which retrieve input from the user as to make sure that
whatever the user enters, the system handles gracefully.
In addition, black box testing was conducted on the completed system. The focus, in this testing
phase, was to ensure that each of the components of the system perform together as expected,
after we have ensured that in isolation they perform as expected (white box testing). In addition,
we wanted to ensure that to the best of our understanding, the end users will be satisfied with the
end result, as the product meets the requirements as outlined in the requirements section (section
1). The test cases and their results are discussed in detail in table (2). The test cases here were
generated more or less randomly by considering as many different combinations of probable user
actions as we can to increase the confidence in the application. In this phase, we tried to be as
objective as possible when producing the test cases so that we dont let our knowledge of the code
blindfold us when trying to unveil bugs.
4.2
White Box Testing
As mentioned in the high level test plans, white box testing was conducted on each module
through testing its interface functions. The focus of this round of tests was to ensure that the
functions tested perform at least their basic functions with some degree of reliability. Table (1)
summarizes the results of this phase. The first column contains the description of the test case,
the second column contains the input data used, the third column indicates the expected result,
the fourth indicates the actual result in case the test case failed (otherwise it is left blank) and
finally the last column indicates the status of the test case as a Pass/Fail value. Documenting
this testing phase was very important as anytime a particular function was modified to fix a bug
discovered in the black box testing phase, we had a set of pre-compiled tests which would tell
us, rather quickly, whether the bug fix introduced actually fixes a bug and introduces another.
The test cases were generated in a rather systematic way by considering the possible flows that
could occur within the function and making sure that in each of those cases the desired result is
delivered. Special attention was given to functions which retrieve input from the user as to make
sure that whatever the user enters is processed properly.
121
122
The bugs encountered during this phase were:
-Trying
-Trying
-Trying
-Trying
to
to
to
to
add an edge between two nodes that already have an edge connecting them
add an edge between a node and an edge or between two edges
load a non existing graph file or a graph file that does not have correct syntax
load a view file with invalid syntax
These bugs were reported using the issue tracking system and can be tracked via issues CZJ23-27
in figure (2).
Due to lack of time and since the bugs affect scenarios that rarely occur, we decided to document
them and leave their resolution to future work. These bugs’ scope are localized so they can easily
be fixed without disturbing the rest of the system.
4.3
Black Box Testing
As mentioned is the high level test plans (section 1.3), black box testing was conducted on the
completed system. The focus, in this testing phase, was to ensure that each of the components
of the system perform together as expected, after we have ensured that in isolation they perform
as expected (white box testing). In addition, we wanted to ensure that to the best of our
understanding, the end users will be satisfied with the end result, as the product meets the
requirements as outlined in the requirements section (section 1). Table (2) summarizes the results
of this phase. Again, the same format was used to document the test cases here. The test cases
here were generated more or less randomly by considering as many different combinations of user
actions as we can to increase the confidence in the application, the test cases were considered with
collision on and off and with several views open simultaneously. In this phase, we tried to be as
objective as possible when producing the test cases so that we dont let our knowledge of the code
blindfold us when trying to unveil bugs.
The bugs encountered during this phase were:
-Collision detection between bent edge and bent edge is not very accurate
-When switching from collision off to collision on and the graph contains a collision already, the
collision can’t be removed
These bugs were reported using the issue tracking system and can be tracked via issues CZJ31-32
in figure (2).
Due to lack of time, we decided to document them and leave their resolution to future work.
These bugs’ scope are localized so they can easily be fixed without disturbing the rest of the system.
4.4
Issue Tracking
As mentioned in the implementation section 1.3, the issue tracking system, Scarab, was extensively used to keep track of any issues encountered or modifications made to the requirements,
design and implementation and to report/document any bugs during the testing phase. Figure
(2) summarizes the issues that were documented. For more details please refer to the online system.
123
Figure 2: Issue Tracking
Issue type Issue ID
Summary
Feature
CZJ1
Color Selection
Feature
CZJ2
Label Entering
Task
CZJ3
Node Data Structure
Task
CZJ4
Edge Data Structure
Task
CZJ5
Add Node Function
Task
CZJ6
Add Edge function
Task
CZJ7
Layout File Structure
Task
CZJ8
Layout Data Structure
Task
CZJ9
Modifications towards new
HOpenGL API on GHC 6.2
Task
CZJ10
Reading GXL files in Haskell
Description
This function should prompt the user with a color dialog through wxHaskell, read it and return a Color4
GLUT color vector.
This function should prompt the user for a label through a wxHaskell dialog, read it and return a string
containing the label entered.
A node will be represented as a finite map. The key will consist of an integer which represents the
Object ID to be pushed into the name stack. The element will consist of a data structure containing:
a) a Label of type string
b) a Color4 RGB vector specifying the color of the node
c) the Shape of type enumerate string and the necessary parameters (i.e. radius...)
d) the texture of the node enumerated type : Flat, Smooth, None
An Edge will be represented as a finite map. The key will consist of an integer which represents the
Object ID to be pushed into the name stack. The element will consist of a data structure containing:
a) a Label of type string
b) a Color4 RGB vector specifying the color of the edge
c) a set of vertices around which the edge is to be rendered
d) the texture of the edge enumerated type : Flat, Smooth, None
e) a pair of integers representing the nodes that this edge connects.
Need to implement a function add node which take the element data structure as prescribed in the
node data structure and draws the node with those attributes.
Need to implement a function add edge which take the element data structure as prescribed in the
edge data structure and draws the edge with those attributes.
The layout filed will be structured in lines of the following form:
ObjectID X(GLFloat) Y(GLFloat) Z(GLFloat)
The Layout will be stored in a finitemap where the key will be the ObjectID and the element will be the
coordinates (x,y,z).
From now onwards versions of the software have to be written to conform with the new API of ghc 6.2.
We need to read, understand and be able to work with the interface at www.cas.mcmaster.ca/~wuj
that reads GXL files into Haskell.
Need to obtain a copy of the source code and be able to compile it.
Task
CZJ11
Writting to GXL files from Haskell
Feature
CZJ12
Adding a Node
Feature
CZJ13
Keyboard Shortcuts
Feature
CZJ14
Moving a Node
Task
Task
CZJ15
CZJ16
Encapsulation of View
Directed Graphs required
Task
CZJ17
Scale Graph redefinition
Task
CZJ18
Undo and Redo Functionality
Task
CZJ19
Bending an edge
Task
CZJ20
Collision Detection and Handling
Task
CZJ21
Error Handling
Task
CZJ22
Layout Generation
Defect
CZJ23
View File with invalid syntax
Defect
CZJ24
Graph File with invalid syntax
Defect
CZJ25
Loading a non existing graph file
Defect
CZJ26
Adding an already existing edge
again
Defect
CZJ27
Adding an edge between a node
and an edge
Task
CZJ28
Changes to the High Level Design
Task
CZJ29
Changes to the Requirements
Task
CZJ30
Capacity Requirement
Defect
CZJ31
Collision Detection
Defect
CZJ32
Collision Detection with prior
collision
Obtain code from the Graduate student to enable us to write into GXL file so we can save such files
when the user wishes to do so.
After choosing the right menu. The user will be able to click the mouse at a certain position and a
node with some default attributes should be dropped there.
Menu features should be accessible through keyboard shortcuts.
The user can select and node and with the appropriate menu can choose to move it. The node is to be
moved by the user input be it mouse or keyboard
The view data structure should be encapsulated to allow modification of format or data structure.
Graphs can be directed or undirected.
Scaling a graph just means stretching or squeezing it, only layout attributes will thus be changed and
the actual node attributes will not.
Undo and Redo functionality can be easily added (and should be) as IORefs will be used to represent
the GraphSet.
The user should be able to bend an edge after selcting it. The mouse button will be used to bend in
the x and y direction and the mouse wheel in the z direction.
Collisions between items should be detected and handled. However collision comes in only after the
user releases any current movement. So that only in the final state is the graph to be collision free.
During movement we don't need to worry about collision.
Errors should be shown to the user in the form of popup windows but in such a way that that the enter
key is autofocused on the new window. So that by pressing enter the window goes away with no
movement of the mouse required.
If the layout information is not found in the loaded GXL file we are to use an algorithm to generate the
layout.
Restart the application, load graph graph1.gxl and load the view file view3 using the menu.
The program crashes.
Restart the application, load graph graph2.gxl from the menu. The application crashes.
The current graph is kept and no graph is loaded as we don't have read access to the file. Th
application crashes.
Restart the application, load graph graph5.gxl select add directed edge from the menu, and select
NodeA and NodeB from the graph. The edge is added on top of the already existing edge. This is the
same for directed and undirected edge.
Restart the application, load graph graph5.gxl select add directed edge from the menu, and select
NodeC then EdgeA then NodeD from the graph. We get: Error: Non-exhaustive patterns in function
unMaybe. This is the same for directed and undirected edge.
At the time where the high level design was written, we didn't have had enough time to think about it,
nor enough knowledge about the problem and this was clearly mentionned in the EPP. Therefore we
went back and re-edited this section to reflect the high level design adopted after we had more time to
think about it.
The major difference is in the module division. We prefered to put all the operations which manipulate
the graph into one module rather then splitting rotating and scaling. Same thing for the view. In
addition Settings module were introduced to enable the user to toggle certain features on and off
depending on the visualization they want. The error handling module has been removed as we have
decided to not do anything when an invalid action was performed. In addition we created 3 additional
modules one for layout (to generate layout), one for collision (to detect collision) and one for undo (to
undo changes done to graph).
The requirements section of the EPP, mostly stayed as it is in the final report. The changes that were
done include rephrasing some of the requirements (linguistic changes) as per the coordinator's
request, in addition we added a new requirement to allow undo/redo.
The capacity not functional requirement has been waived off and will be the object of future work,
mainly optimising the GXL Graph Set datatstructure.
Bent Edge to Bent Edge collision is not functionning well. This problem appears when we are bending
an edge and the edge collides with another bent edge or when we are moving a node that has a bent
edge and that edge collides with another bent edge.
When a graph is loaded and originaly has a collision or a graph has a collision when the mode is
toggled on then the user can't resolve the collision, unless he switches to detection off and resolves
the collision.
124
4.5
Evaluation of Work
During development, we followed an iterative approach when it came to implementing functionality. So what we did was first implemented all the functionalities at a more or less basic level, then
as time permitted iterated through them again and enhanced them.
The source code was very well documented to allow future developers to easily access, understand
and modify the existing source code to enhance certain functionalities, where we felt more efficient
algorithms or methods could be used. In other words, the framework has been laid out for future
work.
Of course there are numerous areas in which this tool can be improved, including but not limited
to the following:
- Implementing a more efficient layout generation / collision detection method such as using the
particle and spring model or using BSP trees.
- Optimizing the GXL Graph Set data structure, to allow faster access to read and write to the
data structure hence making the tool faster.
Future work may also include allowing hyper-edges in the graph (i.e having hyper-graphs), and
possibly allowing nested graphs .
The only requirement we failed to meet was regarding capacity (Issue CZJ30 in figure (2)) . We
tried to do profiling on the application to see where the slow down is occurring, however some of
the packages being used, namely WxHaskelll and HaXml do not support profiling by default. We
strongly suspect that the slow down is caused by the numerous interactions with the graph data
structure (read and update), as this data structure was not implemented with performance in mind.
Finally to accurately evaluate the work several factors have to be taken into account:
- This was our first experience developing an application in a functional programming language
in general and Haskell in particular.
- HOpenGL is a fairly recent standard and lacks documentation and tutorials, this made the task
of learning it harder as we had to interpret OpenGL programs written in C.
- Mid-way through implementation GHC released a new version of its Haskell compiler in which
the API of OpenGL was completely changed, this forced us to stop implementation and update
all the existing files to conform to the new API.
- The installation of the software/packages/drivers needed to develop this tool is a very meticulous
process that took a lot of our time.
With that being said, we think that we exceeded our own expectations and have accomplished a
considerable piece of work.
References
[Dav92]
Antony J. T. Davie. Introduction to Functional Programming Systems Using Haskell. Cambridge University Press, New York, NY, 1992.
[Hil00]
Francis S. Hill. Computer Graphics Using OpenGL. Prentice Hall, New Jersey, NJ, 2000.
[Hud00]
Paul Hudak. The Haskell School of Expression: Learning Functional Programming through Multimedia.
Cambridge University Press, New York, NY, 2000.
[Khe03]
Ridha Khedri. Software Requirements Activities. McMaster University Custom Courseware Production
Services, Hamilton, ON, 2003.
[Len03]
Eric Lengyel. The OpenGL Extensions Guide. Charles River Media, Boston, MA, 2003.
[SWND03] Dave Shreiner, Mason Woo, Jackie Neider, and Tom Davis. OpenGL Programming Guide: The Official
Guide to Learning OpenGL. Addison-Wesley Publications Co., Boston, MA, 2003.
[Wu03]
Jun Wu. Formalization of GXL in Z. Master’s thesis, McMaster University, Hamilton, ON, 2003.
125
A
USER MANUAL
126
127
A.1
OVERVIEW
About the Graph Editor
The 3-Dimensional Graph Editor In Haskell features the ability to view/edit/create 3-Dimensional
graphs. This application was developed in Haskell using HOpenGL as the underlying graphics
package at McMaster University during the 2003/2004 academic year.
This application uses the emerging standard Graph eXchange Language (GXL) format as
input/output graph format.
The key features of this software are:
- Create and save GXL Graphs
- Load and modify existing GXL graphs obtained from other applications
- Visualize the graph from different views simultaneously with the ability to load/save individual
views
- Customize visualization options
System Requirements
The Graph Editor has been installed and tested on the following machines with reasonable
performance:
CPU: Intel Pentium 4 Processor or AMD Athlon 1.4 Ghz
Operating System: Linux Redhat 8-9
Software Requirements:
a) A Haskell Compiler (Preferably GHC 6.2 with OpenGL enabled)
b) WxHaskell package
c) HaXml package
Memory: 512 MB RAM
Video: A 3D accelerator video card with support for OpenGL and at least 64 MB of video memory
is required.
The application can be easily ported to other operating systems such as Unix and Windows as it
only uses the standard OpenGL interface.
128
Installation Guide
The first step is to install GHC 6.2 from source, which is a Haskell compiler. This compiler can
be downloaded from http://www.haskell.org/ghc/download.html . When configuring be sure to
configure as follos: configure –enable-hopengl, so that the hopengl library gets installed with the
compiler. After that is done, WxHaskell 0.2 needs to be installed, again from source. This can be
obtained from http://wxhaskell.sourceforge.net/download.html. When installing, you might be
required to download some additional library files in some cases. If so, you can easily find the files
on the internet and install them. Finally HaXml 1.09 needs to be installed, again from source.
This can be obtained from http://www.cs.york.ac.uk/fp/HaXml.
Once everything mentioned above is configured and running, you need to checkout the source
files from the CVS Repository. The CVS repository is located on the Ritchie server at McMaster
University. SSH into the server ritchie.cas.mcmaster.ca then point your cvs root environment
variable to /u1/cs4zp6/cs4zp6gj/cvs repository after that checkout the folder 3dGraphEditor.
Finally, run the makefile which will generate the executable, which you can then use.
N.B: The installation of the compiler and the necessary packages can be quite tedious and time
consuming
129
A.2
GRAPHS
In this section, it would be useful to define the following terms which will be used:
a) Items - An item refers either to an edge or a node in the graph.
b) Stacks and slices - Stacks and slices defines how detailed the items are drawn. The higher the
number of stacks and slices, the smoother the object.
Loading a Graph
To load a saved graph: press the right mouse button to invoke the popup menu then go to Graph
then select Load or alternatively using the keyboard shortcut Control-L. A file dialog will appear,
enter the file name you wish to load to or select it from the list. If the file exists, you have read
permision and the file is a valid view file (i.e Has the right information and syntax) the graph
file will be loaded and the corresponding graph will be displayed, otherwise the current graph is
kept. The graph file should have extension *.gxl . Of course, the loaded graph will appear on all
currently opened views and not only to the view where you invoked the menu from. Undoing or
Redoing this operation is not supported.
Saving a Graph
To save the current graph: press the right mouse button to invoke the popup menu then go to
Graph then select Save or alternatively using the keyboard shortcut Control-S. A file dialog will
appear, enter the file name you wish to save to or select it from the list. If the file already exists
then you will be asked if you whish to overwrite it, of course you need in any case to have write
permision for that file/disk. If you succesfully chosen a file which is either new or you confirmed
to overwrite an existing file and you have write permision then the graph is saved, otherwise
the current graph is not saved. The graph file should have extension *.gxl . Saving the graph
from any of the views open will have the same effect as they all display the same graph but from
different views. Undoing or Redoing this operation is not supported.
Rotating a Graph
To rotate the current graph: press the right mouse button to invoke the popup menu then go
to Rotate then select Graph. After that hold down the mouse left button and move the mouse
according to the desired effect. Moving the mouse horizontaly will rotate the graph aroung the
horizontal axis and moving the mouse verticaly will rotate the graph around the vertical axis,
of course moving the mouse diagonally will rotate around both the horizontal and vertical axis.
Undoing or Redoing this operation is supported.
Scaling a Graph
To scale the graph: press the right mouse button to invoke the popup menu then go to Zoom then
select Graph. After that use the wheel to scale the graph. Of course when collision is turned on
the graph will only be scaled if the graph after its scaled is collision free. Undoing or Redoing this
operation is supported.
130
Adding Nodes to a Graph
To add a node: press the right mouse button to invoke the popup menu then go to Add then
select Node. After that you must select the location on the screen where the node is to be
added: if collision detection is off then the node is added, otherwise if collision detection is on and
the location clicked on causes a collision then the node is not added. Undoing or Redoing this
operation is not supported.
Adding Edges to a Graph
a) Adding a Directed Edge:
To add a directed edge: press the right mouse button to invoke the popup menu then go to
Add then select Directed Edge. After that you must select the from and then the to nodes that
this edge will connect. Clicking on an edge meanwhile or nothing at all will not have any effect
and you still have to pick the 2 nodes. Once that has been done and the two nodes are neither
the same nor already connected by an edge, the edge mode is not undirected and the resulting
edge does not cause a collision in case collision detection is on, a directed edge is added between the two nodes. Otherwise no edge is added. Undoing or Redoing this operation is supported.
b) Adding an Undirected Edge:
To add an undirected edge: press the right mouse button to invoke the popup menu then go
to Add then select Undirected Edge. After that you must select the two nodes that this edge
will connect. Clicking on an edge meanwhile or nothing at all will not have any effect and
you still have to pick the 2 nodes. Once that has been done, the two nodes are neither the
same nor already connected by an edge, the edge mode is not undirected and the resulting
edge does not cause a collision in case collision detection is on, an undirected edge is added between the two nodes. Otherwise no edge is added. Undoing or Redoing this operation is supported.
Moving Nodes in a Graph
To move a node: press the right mouse button to invoke the popup menu then go to Move then
select Node. After that you must select the node that you want to move, once that is done
while holding the left mouse button down move your mouse to move the selected node in the
horizontal-vertical plane and/or use the wheel to move it in depth. Of course when collision is
turned on then a node may not collide with another object while on its way to its destination.
Undoing or Redoing this operation is supported.
Bending Edges in a Graph
To bend an edge: press the right mouse button to invoke the popup menu then go to Bend
then select Edge. After that you must select the edge that you want to bend, once that is done
while holding the left mouse button down move your mouse to bend the selected edge in the
horizontal-vertical plane and/or use the wheel to bend it in depth. Of course when collision is
turned on then a bent edge may not collide with another object while being bent. Undoing or
Redoing this operation is supported.
131
Changing the Label of an Item
To change an Item’s Label: press the right mouse button to invoke the popup menu then go to
Change then select Label. After that you must select the item that you want its label changed,
once that is done a dialog box will prompt you for a new label, by default the label shown is the
current one. Any Label is accepted but digits will not show on the display. Undoing or Redoing
this operation is supported.
Changing the Radius of an Item
To change an Item’s Radius: press the right mouse button to invoke the popup menu then go to
Change then select Radius. After that you must select the item that you want its radius changed,
once that is done a dialog box will prompt you for a new radius, by default the radius shown is
the current one. The radius is then updated with the following restrictions apply:
a) If a number does not have the right format (having characters..) the current radius is kept
b) If the radius entered is below the minimum value of 0.3 then the value of the radius is changed
to 0.3
Undoing or Redoing this operation is supported.
Changing the Color of an Item
To change an item’s color: press the right mouse button to invoke the popup menu then go to
Change then select Color. After that you must select the item that you want its color changed,
once that is done a color dialog will prompt you for a color pick a pre-defined color or make your
own custom color by adjusting the RGB vector and then adding the customer color. Finally press
OK to accept this color. Undoing or Redoing this operation is supported.
Changing the Number of Stacks of an Item
To change an Item’s Number of stacks: press the right mouse button to invoke the popup menu
then go to Change then select Stacks. After that you must select the item that you want its
number of stacks changed, once that is done a dialog box will prompt you for the new number of
stacks, by default the number of stacks shown is the current one. The number of stacks is then
updated with the following restrictions apply:
a) If a number does not have the right format (having characters..) the current number of stacks
is kept
b) If the number of stacks entered is below the minimum value of 2 then the value of the number
of stacks is changed to 2
Undoing or Redoing this operation is supported.
132
Changing the Number of Slices of an Item
To change an Item’s Number of Slices: press the right mouse button to invoke the popup menu
then go to Change then select Slices. After that you must select the item that you want its
number of slices changed, once that is done a dialog box will prompt you for the new number
of slices, by default the number of slices shown is the current one. The number of slices is then
updated with the following restrictions apply:
a) If a number does not have the right format (having characters..) the current number of slices
is kept
b) If the number of slices entered is below the minimum value of 2 then the value of the number
of slices is changed to 2
Undoing or Redoing this operation is supported.
Removing an Item from the Graph
To remove an item of the graph: press the right mouse button to invoke the popup menu then go
to Remove then select Item. After that you must select the item that you want to remove, once
that is done the item is deleted. If a node is selected all edges incident on it will also be deleted in
the process. If an edge is selected, only that edge is deleted. Undoing or Redoing this operation
is supported.
Undoing/Redoing an Action
To undo a change to the graph: press the right mouse button to invoke the popup menu then
select Undo or alternatively press Control-Z. For the actions which support undo as outlined in the
description of each individual function, the action is undone. You can undo up to 10 consecutive
actions.
To redo a change to the graph: press the right mouse button to invoke the popup menu then
select Redo or alternatively press Control-Y. For the actions which support redo as outlined in the
description of each individual function, the action is undone. You can redo up to 10 consecutive
actions.
Closing a Graph
To close the current graph: press the right mouse button to invoke the popup menu then go
to Graph then select Close or alternatively using the keyboard shortcut Control-C. The current
graph is closed and the empty graph is loaded. Closing the graph from any of the views open will
close it in the other views. Undoing or Redoing this operation is not supported.
133
A.3
VIEWS
In this section, it would be useful to define the following terms which will be used:
a) View - Any window that displays the graph is really displaying it from some particular view
which can be thought of as the position and the orientation of the viewer in the 3-dimensional
space. Of course this means, that for a given graph, we have an infinite number of views. Any
changes done to the view itself does not affect the graph.
Opening a New View
To open a new view of the current graph: press the right mouse button to invoke the popup menu
then go to View then select New. The new view opened will have the default view parameters.
Any changes done to the graph will be applied to all the currently open views, however changes
made to the view or to the settings will be localised to that view only. Undoing or Redoing this
operation is not supported.
Loading a View
To load a saved view and apply that view to the current graph: press the right mouse button to
invoke the popup menu then go to View then select Load. A file dialog will appear, enter the file
name you wish to load to or select it from the list. If the file exists, you have read permision and
the file is a valid view file (i.e Has the right information and syntax), the view file will be loaded
and the corresponding view will be applied to the current graph, otherwise the current view is
kept. The view file can have any extension *.* . Of course, the view is applied to the window
where you invoked the menu from, in case you have several views open at the same time. Undoing
or Redoing this operation is not supported.
Saving a View
To save the current view of the current graph: press the right mouse button to invoke the popup
menu then go to View then select Save. A file dialog will appear, enter the file name you wish
to save to or select it from the list. If the file already exists then you will be asked if you whish
to overwrite it, of course you need in any case to have write permision for that file/disk. If you
succesfully chosen a file which is either new or you confirmed to overwrite an existing file and you
have write permision then the view file is saved, otherwise the current view is not saved. The
view file can have any extension *.* . Of course, the view saved is that of the window where
you invoked the menu from, in case you have several views open at the same time. Undoing or
Redoing this operation is not supported.
Rotating a View
To rotate the current view of the current graph: press the right mouse button to invoke the popup
menu then go to Rotate then select Rotate. After that hold down the mouse left button and
move the mouse according to the desired effect. Moving the mouse horizontaly will rotate the
view aroung the horizontal axis and moving the mouse verticaly will rotate the view around the
vertical axis, of course moving the mouse diagonally will rotate around both the horizontal and
vertical axis. Undoing or Redoing this operation is not supported.
134
Zooming in/out of a View
To zoom into/out of the view: press the right mouse button to invoke the popup menu then go
to Zoom then select View. After that use the wheel to zoom the view or alternatively use the
upward and downward keys. Undoing or Redoing this operation is not supported.
Closing a View
To close an existing view of the current graph: press the right mouse button to invoke the popup
menu then go to View then select Close. If the view you are trying to close is the only view
currently open the application will exit, otherwise only that view will be closed and the rest of
the views will remain there. Undoing or Redoing this operation is not supported.
135
A.4
SETTINGS
In this section, it would be useful to define the following terms which will be used:
a) Number of Cylinders - A bent edge consists of a continous arrangement of cylinders. The
number of cylinders used is what is being refered to. The more cylinders used, the smoother the
bent edge looks, but the slower the rendering is.
Loading Settings
To load a saved settings file and apply those settings to the current graph: press the right mouse
button to invoke the popup menu then go to Settings then select Load. A file dialog will appear,
enter the file name you wish to load to or select it from the list. If the file exists, you have
read permision and the file is a valid settings file (i.e Has the right information and syntax),
the settings file will be loaded and the corresponding settings will be applied to the current
graph, otherwise the current settings are kept. The settings file can have any extension *.* .
Of course, the settings are applied to the window where you invoked the menu from, in case
you have several views open at the same time. Undoing or Redoing this operation is not supported.
Saving the Settings
To save the current settings of the current graph: press the right mouse button to invoke the
popup menu then go to Settings then select Save. A file dialog will appear, enter the file
name you wish to save to or select it from the list. If the file already exists then you will
be asked if you whish to overwrite it, of course you need in any case to have write permision
for that file/disk. If you succesfully chosen a file which is either new or you confirmed to
overwrite an existing file and you have write permision then the settings file is saved, otherwise the current settings are not saved. The settings file can have any extension *.* . Of
course, the settings saved are those of the window where you invoked the menu from, in case
you have several views open at the same time. Undoing or Redoing this operation is not supported.
Toggling Collision Detection
To toggle collision detection: press the right mouse button to invoke the popup menu then go
to Settings then select Collision Detection. A confirmation box will appear, clicking on yes will
toggle collision detection while clicking no will keep this setting the same. By default collision
detection is off. Undoing or Redoing this operation is not supported.
Toggling Axis Rendering
To toggle axis rendering: press the right mouse button to invoke the popup menu then go to
Settings then select Axis rendering. A confirmation box will appear, clicking on yes will toggle
axis rendering while clicking no will keep this setting the same. By default axis rendering is off.
Undoing or Redoing this operation is not supported.
136
Changing the Number of Cylinders
Changing the number of Cylinders: press the right mouse button to invoke the popup menu
then go to Settings then select Cylinder Number. After that a dialog box will prompt you for
the new number of cylinders used in rendering bent edges, by default the number of cylinders
shown is the current one. The number of cylinders is then updated with the following restrictions
apply: a) If a number does not have the right format (having characters..) the current number of
cylinders is kept b) If the number of cylinders entered is below the minimum value of 2 then the
value of the number of cylinders is changed to 2 Undoing or Redoing this operation is not supported.
B
WHITEBOX TESTING RESULTS
137
138
Steps
Data
Expected Results
Actual Results
Status
Toggle Axis:
a) Start the application.
b) Toggle Axis Rendering On
from the settings menu.
c) Toggle Axis Rendering Off
from the settings menu.
a) Axis are
rendered.
b) Axis are
dered and
played.
c) Axis are
rendered.
not
rendis-
a) Pass
b) Pass
c) Pass
not
Toggle Collision Detection:
a) Start the application, load
graph graph1.gxl and move node
to collide with another node in
the graph.
b) Toggle Collision Detection
On from the settings menu and
reproduce the same movement
in a).
c) Toggle Collision Detection
Off from the settings menu and
reproduce the same movement
in a).
graph1.gxl a) Movement is
allowed and the
two nodes overlap.
b) Movement is not
allowed, the node
that is being moved
should stop moving
towards the other
node once they are
about to collide..
c) Movement is
allowed and the
two nodes overlap.
a) Pass
b) Pass
c) Pass
graph1.gxl a) The same graph
that appeared in
the original window
should appear in
the new opened
window.
b) The same graph
that appeared in
the original window
should appear in
the new opened
window.
a) Pass
b) Pass
c) Pass
Open New View:
a) Start the application, load
graph graph1.gxl and open a
new view from the menu.
b) In the new view open a new
view there using the menu.
139
Load View File:
a) Start the application, load
graph graph1.gxl and load the
view file view1 using the menu.
b) Restart the application, load
graph graph1.gxl and load the
view file view2 using the menu.
c) Restart the application, load
graph graph1.gxl and load the
view file view3 using the menu.
d) Restart the application, load
graph graph1.gxl and load the
view file view4 using the menu.
e) Restart the application, load
graph graph1.gxl and load the
view file view5 using the menu.
f) Restart the application, load
graph graph1.gxl and load a
view file that does not exist
using the menu.
graph1.gxl
view1
view2
view3
view4
view5
a)
The
graph
should be displayed
in according to the
view parameters in
the file.
b) The graph’s
current view is
kept as the view
file being loaded is
empty.
c) The graph’s
current view is
kept as the view
file being loaded
does not have the
appropriate syntax.
d)
The
graph
should be displayed
in according to the
view parameters in
the file.
e) The graph’s
current view is kept
as we don’t have
read permission for
the view file being
loaded.
f) The graph’s
current view is
kept.
c) Parse Error
a) Pass
b) Pass
c) Fail
d) Pass
e) Pass
f) Pass
140
Save View:
a) Start the application, load
graph graph1.gxl and save the
current view in a new file.
b) Restart the application,
load graph graph1.gxl and save
the current view in an already
existing file to which you have
write permission and you accept
overwriting.
c) Restart the application, load
graph graph1.gxl and save the
current view in an already
existing file to which you do not
have write permission.
graph1.gxl a) The file we
save the view into
contains the default
view.
b) The view is
saved, and the file
we save the view
into contains the
default view.
c) The view is not
saved to the file,
the
application
should
behave
as if nothing has
happened, the view
that was there
previously should
be kept.
a) Pass
b) Pass
c) Pass
graph1.gxl a) viewA is closed
and viewB and
viewC are intact.
b) viewC is closed
and viewB is intact.
c) The application
is closed.
a) Pass
b) Pass
c) Pass
Close View:
a) Start the application, load
graph graph1.gxl and open 2
new views using the menu, we
will label the original window by
viewA the other two viewB and
viewC respectively. Then Close
viewA..
b) Close ViewC.
c) Close ViewB.
141
Load Graph:
a) Start the application, load
graph graph1.gxl using the
menu.
b) Restart the application, load
graph graph2.gxl from the menu.
c) Restart the application, load
graph graph3.gxl from the menu.
d) Restart the application, load
a graph that does not exist from
the menu.
graph1.gxl a)
Graph1
is
graph2.gxl loaded and disgraph3.gxl played.
b) The current
graph is kept and
no graph is loaded
as the graph file is
invalid.
c) The current
graph is kept and
no graph is loaded
as we don’t have
read access to the
file.
d) The current
graph is kept.
b) Parse Error
on input file
d) openFile: does
not exist (No such
file or directory)
a) Pass
b) Fail
c) Pass
d) Fail
Save Graph:
a) Start the application, save
the graph (empty graph) into a
new file using the menu.
b) Restart the application,
save the graph (empty graph)
into an already existing file to
which you have write permission
using the menu and you accept
overwriting.
c) Restart the application, save
the graph (empty graph) into an
already existing file to which you
do not have write permission
using the menu.
a) The file we
save the graph into
contains the empty
graph.
b) The file we save
the graph into
contains the empty
graph.
c) The graph is
not saved,
the
application should
behave as if nothing has happened,
the graph that was
there
previously
should be kept.
a) Pass
b) Pass
c) Pass
142
Load Settings File:
a) Start the application, load
graph graph1.gxl and load the
settings file settings1 using the
menu.
b) Restart the application, load
graph graph1.gxl and load the
settings file settings2 using the
menu.
c) Restart the application, load
graph graph1.gxl and load the
settings file settings3 using the
menu.
d) Restart the application, load
graph graph1.gxl and load the
settings file settings4 using the
menu.
e) Restart the application, load
graph graph1.gxl and load the
settings file settings5 using the
menu.
f) Restart the application, load
graph graph1.gxl and load a
settings file that does not exist
using the menu.
graph1.gxl
settings1
settings2
settings3
settings4
settings5
a)
The
graph
should be displayed
in according to the
settings parameters
in the file.
b) The graph’s
current settings are
kept as the settings
file being loaded is
empty.
c) The graph’s
current settings are
kept as the settings
file being loaded
does not have the
appropriate syntax.
d) The graph’s
settings should be
according to the
settings parameters
in the file.
e) The graph’s
current
settings
are kept as we
don’t have read
permission for the
settings file being
loaded.
f) The graph’s
current settings are
kept.
a) Pass
b) Pass
c) Pass
d) Pass
e) Pass
f) Pass
143
Save Settings File:
a) Start the application, load
graph graph1.gxl and save the
current settings in a new file
using the menu.
b) Restart the application, load
graph graph1.gxl and save the
current settings in an already
existing file, using the menu, to
which you have write permission
and you accept overwriting.
c) Restart the application, load
graph graph1.gxl and save the
current settings in an already
existing file, using the menu,
to which you do not have write
permission.
graph1.gxl a) The file we
save the settings
into contains the
default settings.
b) The settings are
saved, and the file
we save the settings
into contains the
default settings.
c) The settings
are not saved, the
application should
behave as if nothing
has happened, the
settings that were
there
previously
should be kept.
a) Pass
b) Pass
c) Pass
144
View Rotation:
a) Start the application, load
graph graph1.gxl select the view
rotation from the menu, press
the left button and move the
mouse horizontally to the right.
b) With the mouse left button
down, start moving horizontally
to the left.
c) With the mouse left button
still down, start moving the
mouse vertically in the upward
direction.
d) With the mouse left button
still down, start moving the
mouse vertically in the downward direction.
graph1.gxl a) The view is
rotated
around
the
horizontal
axis in an anticlockwise motion
with
reasonable
speed relative to
the mouse motion.
b) The view rotates
in the clockwise
direction
around
the
horizontal
axis to reverse the
motion done in a)
with
reasonable
speed relative to
the mouse motion.
c) The view is
rotated
around
the vertical axis in
an anti-clockwise
motion with reasonable
speed
relative
to
the
mouse motion.
d) The view rotates
in the clockwise
direction
around
the vertical axis to
reverse the motion
done in a) with
reasonable
speed
relative
to
the
mouse motion.
a) Pass
b) Pass
c) Pass
d) Pass
145
Graph Rotation:
a) Start the application, load
graph graph1.gxl select the
graph rotation from the menu,
press the left button and move
the mouse horizontally to the
right.
b) With the mouse left button
down, start moving horizontally
to the left.
c) With the mouse left button
still down, start moving the
mouse vertically in the upward
direction.
d) With the mouse left button
still down, start moving the
mouse vertically in the downward direction.
graph1.gxl a)
The
graph
is rotated around
the
horizontal
axis in an anticlockwise motion
with
reasonable
speed relative to
the mouse motion.
b)
The
graph
rotates
in
the
clockwise direction
around the horizontal axis to reverse
the motion done in
a) with reasonable
speed relative to
the mouse motion.
c) The graph is
rotated
around
the vertical axis in
an anti-clockwise
motion with reasonable
speed
relative
to
the
mouse motion.
d)
The
graph
rotates
in
the
clockwise direction
around the vertical
axis to reverse the
motion done in a)
with
reasonable
speed relative to
the mouse motion.
a) Pass
b) Pass
c) Pass
d) Pass
146
Add Directed Edge:
a) Start the application, load
graph graph4.gxl select add
directed edge from the menu,
and select NodeA and NodeB
from the graph.
b) Restart the application, load
graph graph5.gxl select add
directed edge from the menu,
and select NodeA and NodeB
from the graph.
c) Restart the application, load
graph graph6.gxl select add
directed edge from the menu,
and select NodeA and NodeB
from the graph.
d) Restart the application, load
graph graph5.gxl select add
directed edge from the menu,
and select NodeC then EdgeA
then NodeD from the graph.
e) Restart the application, load
graph graph4.gxl select add
directed edge from the menu,
and select NodeA then select
empty then NodeB from the
graph.
f) Restart the application, load
graph graph4.gxl select add
directed edge from the menu,
and select empty then select
NodeA then select empty then
NodeB from the graph.
g) Restart the application, load
graph graph4.gxl select add
directed edge from the menu,
and select NodeA twice from the
graph .
h) Restart the application,
load graph graph4.gxl, switch
collision detection on, select add
directed edge from the menu,
and select NodeC and NodeD
from the graph.
graph4.gxl a)
A
directed
graph5.gxl edge is added going
graph6.gxl from NodeA to
NodeB.
b) A directed edge
already exists from
NodeA to NodeB,
no edge is added.
c) A directed edge
is not added since
edge mode is undirected.
d) A directed edge
is added going from
NodeA to NodeB.
e) A directed edge
is added going from
NodeA to NodeB.
f) A directed edge
is added going from
NodeA to NodeB.
g) A directed edge
is not added.
h) A directed edge
is not added since
a collision is detected.
b)
Two
Edges
added on top of
each other
d) Error:
Nonexhaustive patterns
in function unMaybe
a) Pass
b) Fail
c) Pass
d) Fail
e) Pass
f) Pass
g) Pass
h) Pass
147
Add Undirected Edge:
a) Start the application, load
graph graph4.gxl select add
undirected edge from the menu,
and select NodeA and NodeB
from the graph.
b) Restart the application, load
graph graph5.gxl select add
undirected edge from the menu,
and select NodeA and NodeB
from the graph.
c) Restart the application, load
graph graph7.gxl select add
undirected edge from the menu,
and select NodeA and NodeB
from the graph.
d) Restart the application, load
graph graph5.gxl select add
undirected edge from the menu,
and select NodeA then EdgeA
then NodeB from the graph.
e) Restart the application, load
graph graph4.gxl select add
undirected edge from the menu,
and select NodeA then select
empty then NodeB from the
graph.
f) Restart the application, load
graph graph4.gxl select add
undirected edge from the menu,
and select empty then select
NodeA then select empty then
NodeB from the graph.
g) Restart the application, load
graph graph4.gxl select add
undirected edge from the menu,
and select NodeA twice from the
graph .
h) Restart the application,
load graph graph4.gxl, switch
collision detection on, select add
undirected edge from the menu,
and select NodeC and NodeD
from the graph.
graph4.gxl a) An undirected
graph5.gxl edge is added going
graph7.gxl from NodeA to
NodeB.
b) An undirected
edge already exists
from NodeA to
NodeB, no edge is
added.
c) An undirected
edge is not added
since edge mode is
directed.
d) An undirected
edge is added going
from NodeA to
NodeB.
e) An undirected
edge is added going
from NodeA to
NodeB.
f) An undirected
edge is added going
from NodeA to
NodeB.
g) An undirected
edge is not added.
h) An undirected
edge is not added
since a collision is
detected.
b)
Two
Edges
added on top of
each other
d) Error:
Nonexhaustive patterns
in function unMaybe
a) Pass
b) Fail
c) Pass
d) Fail
e) Pass
f) Pass
g) Pass
h) Pass
148
Change Color:
a) Start the application, load
graph graph1.gxl, Select change
color from menu, select NodeA
and change its color through
ready made colors.
b) Select change color from
menu, select NodeA and change
its colors through custom made
colors.
c) Select change color from
menu, select EdgeA and change
its color through ready made
colors.
d) Repeat above and change
its colors through custom made
colors.
e) Select change color from
menu, select NodeA and press
cancel at the color dialog box.
f) Select change color from
menu, select EdgeA and press
cancel at the color dialog box.
graph1.gxl a) Color of NodeA
is changed appropriately to what is
selected.
b) Color of NodeA
is changed appropriately to what
is selected as a
custom color.
c) Color of EdgeA
is changed appropriately to what is
selected.
d) Color of EdgeA
is changed appropriately to what
is selected as a
custom color.
e) Color of NodeA
is left unchanged.
f) Color of EdgeA
is left unchanged.
a) Pass
b) Pass
c) Pass
d) Pass
e) Pass
f) Pass
149
Change Label:
a) Start the application, load
graph graph1.gxl, Select change
label from menu, select NodeA
and input a non-empty string.
b) Select change label from
menu, select NodeA and input
an empty string.
c) Select change label from
menu, select EdgeA and input a
non-empty string.
d) Select change label from
menu, select EdgeA and input
an empty string.
e) Select change label from
menu, select NodeA and press
cancel at the text input box.
f) Select change label from
menu, select EdgeA and press
cancel at the text input box.
graph1.gxl a) Label of NodeA
is changed appropriately to what
was entered as
input in the text
box.
b) Label of NodeA
is
changed
to
the empty string,
therefore showing
no label.
c) Label of EdgeA
is changed appropriately to what
was entered as
input in the text
box.
d) Label of EdgeA
is
changed
to
the empty string,
therefore showing
no label.
e) Label of NodeA
is set to default
label.
(Empty
string)
f) Label of EdgeA
is set to default
label.
(Empty
string)
a) Pass
b) Pass
c) Pass
d) Pass
e) Pass
f) Pass
150
Change Radius:
a) Start the application, load
graph graph1.gxl, select change
radius from menu, select NodeA
and input an integer > 0.
b) Select change radius from the
menu, select NodeA and input
an integer < 0.
c) Select change radius from the
menu, select NodeA and input
an integer = 0.
d) Select change radius from the
menu, select NodeA and input a
number with decimal.
e) Select change radius from the
menu, select EdgeA and input
an integer > 0.
f) Select change radius from the
menu, select EdgeA and input
an integer < 0.
g) Select change radius from the
menu, select EdgeA and input
an integer = 0.
h) Select change radius from the
menu, select EdgeA and input a
number with decimal.
i) Select change radius from the
menu, select NodeA and press
cancel at the text input box.
j) Select change radius from the
menu, select EdgeA and press
cancel at the text input box.
k) Select change radius from the
menu, select NodeA and input
an invalid value (Not a number)
graph1.gxl a)
Radius
of
the node is changed
appropriately.
b) Radius of the
node is changed to
its default value.
c) Radius of the
node is changed to
its default value.
d) Radius of the
node is changed
appropriately.
e) Radius of the
node is changes
appropriately.
f) Radius of the
edge is changed to
its default value.
g) Radius of the
edge is changed to
its default value.
h) Radius of the
edge is changed
appropriately.
i) Radius of the
node remains unchanged.
j) Radius of the
edge remains unchanged.
k) Radius of the
edge remains unchanged.
a) Pass
b) Pass
c) Pass
d) Pass
e) Pass
f) Pass
g) Pass
h) Pass
i) Pass
j) Pass
k) Pass
151
Change Slices:
a) Start the application, load
graph graph1.gxl select change
slices from menu, select NodeA
and input an integer > 0.
b) Select change slices from the
menu, select NodeA and input
an integer < 0.
c) Select change slices from the
menu, select NodeA and input
an integer = 0.
d) Select change slices from the
menu, select NodeA and input a
number with decimal.
e) Select change slices from the
menu, select EdgeA and input
an integer > 0.
f) Select change slices from the
menu, select EdgeA and input
an integer < 0.
g) Select change slices from the
menu, select EdgeA and input
an integer = 0.
h) Select change slices from the
menu, select EdgeA and input a
number with decimal.
i) Select change slices from the
menu, select NodeA and press
cancel at the text input box.
j) Select change slices from the
menu, select EdgeA and press
cancel at the text input box.
k) Select change slices from the
menu, select NodeA and input
an invalid value (Not a number).
graph1.gxl a) Slices of the
node and its appearance is changed
appropriately.
b) Slices of the
node is changed to
its default value.
c) Slices of the
node is changed to
its default value.
d) Slices of the
node is changed
to the integer part
of
the
decimal
number.
e) Slices of the
node is changed
appropriately.
f) Slices of the edge
is changed to its
default value.
g) Slices of the edge
is changed to its
default value.
h) Slices of the edge
is changed to the
integer part of the
decimal number.
i) Slices of the
node remains unchanged.
j) Slices of the
edge remains unchanged.
k) Slices of the
edge remains unchanged.
a) Pass
b) Pass
c) Pass
d) Pass
e) Pass
f) Pass
g) Pass
h) Pass
i) Pass
j) Pass
k) Pass
152
Change Stacks:
a) Start the application, load
graph graph1.gxl select change
stacks from menu, select NodeA
and input an integer > 0.
b) Select change stacks from the
menu, select NodeA and input
an integer < 0.
c) Select change stacks from the
menu, select NodeA and input
an integer = 0.
d) Select change stacks from the
menu, select NodeA and input a
number with decimal.
e) Select change stacks from the
menu, select EdgeA and input
an integer > 0.
f) Select change stacks from the
menu, select EdgeA and input
an integer < 0.
g) Select change stacks from the
menu, select EdgeA and input
an integer = 0.
h) Select change stacks from the
menu, select EdgeA and input a
number with decimal.
i) Select change stacks from the
menu, select NodeA and press
cancel at the text input box.
j) Select change stacks from the
menu, select EdgeA and press
cancel at the text input box.
k) Select change stacks from the
menu, select NodeA and input
an invalid value (Not a number).
graph1.gxl a) Stacks of the
node and its appearance is changed
appropriately.
b) Stacks of the
node is changed to
its default value.
c) Stacks of the
node is changed to
its default value.
d) Stacks of the
node is changed
to the integer part
of
the
decimal
number.
e) Stacks of the
node is changed
appropriately.
f) Stacks of the
edge is changed to
its default value.
g) Stacks of the
edge is changed to
its default value.
h) Stacks of the
edge is changed to
the integer part
of
the
decimal
number.
i) Stacks of the
node remains unchanged.
j) Stacks of the
edge remains unchanged.
k) Stacks of the
node remains unchanged.
a) Pass
b) Pass
c) Pass
d) Pass
e) Pass
f) Pass
g) Pass
h) Pass
i) Pass
j) Pass
k) Pass
153
Move Node Collision Off:
a) Start the application, load
graph graph1.gxl select move
node from the menu, press the
left button and move the mouse
horizontally to the right
b) With the mouse left button
down, start moving horizontally
to the left
c) With the mouse left button
still down, start moving the
mouse vertically in the upward
direction
d) With the mouse left button
still down, start moving the
mouse vertically in the downward direction
e) Select move node from the
menu, select NodeA and move
the node using the mouse wheel.
f) Select move node from the
menu, select an EdgeA.
g) Select move node from the
menu, select an empty space on
the graph with no objects.
graph1.gxl a)
The
node
moves
appropriately to the right
according to the
mouse movement.
b) The node moves
appropriately
to
the left according
to the mouse movement.
c) The node moves
appropriately upwards according to
the mouse movement.
d) The node moves
appropriately
downwards according to the mouse
movement.
e) The node moves
appropriately
in
and out of the
screen according to
the mouse wheel.
f) Nothing will
happen.
g) Nothing will
happen.
a) Pass
b) Pass
c) Pass
d) Pass
e) Pass
f) Pass
g) Pass
154
Move Node Collision On:
a) Start the application, turn
collision detection on, select
move node from the menu, select
NodeA and move the node by
moving the mouse to the right
with the node colliding into a
node.
b) With the mouse left button
down, start moving horizontally
to the left with the node colliding into a node.
c) With the mouse left button
still down, start moving the
mouse vertically in the upward
direction with the node colliding
into a node.
d) With the mouse left button
still down, start moving the
mouse vertically in the downward direction with the node
colliding into a node.
e) Select move node from the
menu, select NodeA and move
the node by using the mouse
wheel until it collides into a
node.
f) Select move node from the
menu, select EdgeA.
g) Select move node from the
menu, select empty space on the
graph.
graph1.gxl a) On collision
with the other
node, NodeA will
stop its movement
right before it goes
’through’ the other
node.
b) On collision
with the other
node, NodeA will
stop its movement
right before it goes
’through’ the other
node.
c) On collision
with the other
node, NodeA will
stop its movement
right before it goes
’through’ the other
node.
d) On collision
with the other
node, NodeA will
stop its movement
right before it goes
’through’ the other
node.
e) On collision
with the other
node, NodeA will
stop its movement
right before it goes
’through’ the other
node.
f) Nothing will
happen.
g) Nothing will
happen.
a) Pass
b) Pass
c) Pass
d) Pass
e) Pass
f) Pass
g) Pass
155
Zoom Graph:
a) Start the application, load
graph graph1.gxl select zoom
graph from the menu, zoom the
graph in by rolling the mouse
wheel upwards.
b) Zoom the graph out by rolling
mouse wheel downwards.
c) Restart the application, toggle collision detection on, select
zoom graph from the menu,
zoom the graph in by rolling the
mouse wheel upwards, without
the items colliding into each
other.
d) Select zoom graph from the
menu, zoom the graph in by
rolling the mouse wheel upwards
until the items collide into each
other.
e) With collision detection on,
select zoom graph from the
menu, zoom the graph out by
rolling the mouse wheel downwards.
graph1.gxl a)
The
graph
will be zoomed
appropriately,
in
this case, it will be
larger.
b) The graph will
be zoomed appropriately, in this
case, it will be
smaller.
c) The graph will
be zoomed appropriately, in this
case it will be
larger.
d) The graph will
be zoomed appropriately but stops
when objects are
about to collide
with each other.
e) The graph will
be zoomed appropriately, in this
case, it will be
smaller.
a) Pass
b) Pass
c) Pass
d) Pass
e) Pass
graph1.gxl a) The view will
be zoomed appropriately, in this
case, the camera
will move into the
object space.
b) The view will be
zoomed appropriately, in this case,
the camera will
move away from
the object space.
a) Pass
b) Pass
Zoom View:
a) Start the application, load
graph graph1.gxl select zoom
view from the menu, zoom the
view by rolling the mouse wheel
upwards.
b) Zoom the view out by rolling
mouse wheel downwards.
156
Add Node:
a) Start the application, load
graph graph1.gxl select add
node from the menu, add a node
on an empty space in the screen.
b) Select add node from the
menu, add a node at a position
where a node exists.
c) Select add node from the
menu, add a node at a position
where an edge exists.
d) Restart the application, turn
collision detection on, load graph
graph1.gxl select add node from
the menu, add a node on an
empty space in the screen.
e) Select add node from the
menu, add a node at a position
where a node exists.
f) Select add node from the
menu, add a node at a position
where an edge exists.
g) Select add node from the
menu, add a node on an empty
space.
graph1.gxl a) A new node
will be added at
the position the
mouse clicked.
b) A new node will
be added overlapping the node at
that position.
c) A new node will
be added overlapping the edge at
that position.
d) A new node will
be added at the
position the mouse
clicked.
e) A new node will
not be added and
the graph remains
unchanged.
f) A new node will
not be added and
the graph remains
unchanged.
g) A new node will
be added at the
position the mouse
clicked.
a) Pass
b) Pass
c) Pass
d) Pass
e) Pass
f) Pass
g) Pass
157
Bend Edge Collision Off:
a) Start the application, load
graph graph1.gxl select bend
edge from the menu, select a
directed straight edge and hold
the left mouse button while
moving the mouse vertically
upwards.
b) Select bend edge from the
menu, select a directed straight
edge and hold the left mouse
button while moving the mouse
vertically downwards.
c) Select bend edge from the
menu, select a directed straight
edge and hold the left mouse
button while moving the mouse
to the right.
d) Select bend edge from the
menu, select a directed straight
edge and hold the left mouse
button while moving the mouse
to the left.
e) Select bend edge from the
menu, select a directed straight
edge and hold the left mouse
button while rolling the mouse
wheel downwards.
f) Select bend edge from the
menu, select a directed straight
edge and hold the left mouse
button while rolling the mouse
wheel upwards.
g) Select bend edge from the
menu, select a node.
h) Select bend edge from the
menu, select an empty space in
the screen.
graph1.gxl a)
The
edge
will bend upwards
appropriately.
b) The edge will
bend
downwards
appropriately.
c) The edge will
bend to the right
appropriately.
d) The edge will
bend to the left
appropriately.
e) The edge will
bend towards the
user appropriately.
f) The edge will
bend away from the
user appropriately.
g) Nothing will
happen.
h) Nothing will
happen.
a) Pass
b) Pass
c) Pass
d) Pass
e) Pass
f) Pass
g) Pass
h) Pass
158
Bend Edge Collision On:
a) Restart the application,
turn collision detection on,
select bend edge from the menu,
select a directed straight edge
and hold the left mouse button
while moving the mouse vertically upwards onto a node.
b) Select bend edge from the
menu, select a directed straight
edge and hold the left mouse
button while moving the mouse
vertically downwards onto a
node.
c) Select bend edge from the
menu, select a directed straight
edge and hold the left mouse
button while moving the mouse
to the right onto a node.
d) Select bend edge from the
menu, select a directed straight
edge and hold the left mouse
button while moving the mouse
to the left onto a node .
e) Select bend edge from the
menu, select a directed straight
edge and hold the left mouse
button while rolling the mouse
wheel downwards onto a node.
f) Select bend edge from the
menu, select a directed straight
edge and hold the left mouse
button while rolling the mouse
wheel upwards onto a node.
g) Select bend edge from the
menu, select a node.
h) Select bend edge from the
menu, select an empty space in
the screen.
graph1.gxl a) The edge will
bend away from the
user appropriately.
b) The edge will
bend upwards and
stop bending once
it is almost colliding with another
object.
c) The edge will
bend
downwards
and stop bending
once it is almost
colliding with another object.
d) The edge will
bend to the left
and stop bending
once it is almost
colliding with another object.
e) The edge will
bend to the right
and stop bending
once it is almost
colliding with another object.
f) The edge will
bend towards the
user
and
stop
bending once it is
almost
colliding
with another object.
g) The edge will
bend away from
the user and stop
bending once it is
almost
colliding
with another object.
h) Nothing will
happen.
i) Nothing will
happen.
a) Pass
b) Pass
c) Pass
d) Pass
e) Pass
f) Pass
g) Pass
h) Pass
i) Pass
159
Change Cylinder Number:
a) Start the application, load
graph graph1.gxl select the
cylinder number from the settings menu. Enter an integer >
0.
b) Select the cylinder number
from the settings menu. Enter
an integer < 0.
c) Select the cylinder number
from the settings menu. Enter 0
as the cylinder number.
d) Select the cylinder number
from the settings menu. Enter a
decimal number.
graph1.gxl a) The number
of
cylinders
is
changed to what
was entered.
b) The number of
cylinders remains
unchanged.
c) The number of
cylinders remains
unchanged.
d) The number
of
cylinders
is
changed to the
integer part of the
decimal
number
that was entered.
a) Pass
b) Pass
c) Pass
d) Pass
graph1.gxl a)
The
node
that was added will
be removed.
b) The node that
was removed will
be added.
c) The first two
nodes that were
added will remain
while the rest will
be removed.
d) The 10 removed
nodes
will
be
readded.
e) All the nodes
that were added
are removed.
f) All the nodes are
readded.
a) Pass
b) Pass
c) Pass
d) Pass
e) Pass
f) Pass
Undo And Redo:
a) Start the application, load
graph graph1.gxl, add a node
into the graph and select undo
from the menu.
b) Select redo from the menu.
c) Add 12 nodes into the graph
and select undo from the menu
12 times.
d) Select redo 12 times.
e) Restart the application, load
graph graph1.gxl add 10 nodes
into the graph, and select undo
from the menu 10 times.
f) Select redo 10 times.
160
Remove Item:
a) Start the application, load
graph graph1.gxl, select remove
item from the menu and select
a node that has no edges connected to it.
b) Select remove item from the
menu and select a node with an
edge connected to it.
c) Select remove item from the
menu and select an edge in the
graph.
d) Select remove item from the
menu and click on an empty
space in the graph.
graph1.gxl a) The node selected is removed.
b) The node selected with all its
edges are removed
altogether.
c) The edge selected
will
be
removed.
d) Nothing happens.
Table 1: White Box Testing Results
a) Pass
b) Pass
c) Pass
d) Pass
C
BLACKBOX TESTING RESULTS
161
162
Steps
Data
Expected Results
Actual
Results
Status
Test Case 1:
a) Start the application.
Load
graph graph1.gxl. Select add node
from the menu. Add a node on
an empty space in the screen.
Save graph into result.gxl. Load
result.gxl .
b) Restart the application. Select
add node from the menu. Add
a node on an empty space in the
screen. Select remove item from the
menu and remove the added node.
Save graph into result.gxl. Load
result.gxl to check saved file.
c) Restart the application. Select
add node from the menu. Add
a node on an empty space in the
screen.
Select move node from
the menu and move the node to
an empty space on the screen.
Save graph into result.gxl. Load
result.gxl to check.
d) Restart the application. Select
add node from the menu. Add
a node on an empty space in the
screen. Select move node from the
menu and move that node. After
the node is moved, select remove
item and remove the node that
was moved. Save the graph into
result.gxl. Load result.gxl to check.
e) Restart the application. Select
add node from the menu. Add
a node on an empty space of the
screen. Select move node from the
menu and move the node to an
empty space on the screen. Remove
that node. Add a new node. Move
the new node. Save the graph into
result.gxl. Load result.gxl to check.
graph1.gxl, a) The graph is loaded properly
result.gxl and the node is seen added to the
screen at the correct position. When
the graph is saved. When result.gxl is
loaded, it displays the correct graph
that was saved before.
b) The graph is loaded properly and
the removed node is removed from
both the file and the screen. result.gxl
displays the correct graph with the
node removed.
c) The node moves properly and when
result.gxl is loaded, the latest position
of the node is displayed.
d) The node moves properly and when
result.gxl is loaded, the removed node
should not appear.
e) The node moves properly and when
result.gxl is loaded, the latest position
of the added node is displayed.
a) Pass
b) Pass
c) Pass
d) Pass
e) Pass
163
Test Case 2:
a) Start application and turn
on collision detection in the settings
menu. Repeat test case 1.
graph1.gxl, a) The graph is loaded properly
result.gxl and the node is seen added to the
screen at the correct position. When
the graph is saved. When result.gxl is
loaded, it displays the correct graph
that was saved before.
b) The graph is loaded properly and
the removed node is removed from
both the file and the screen. result.gxl
displays the correct graph with the
node removed.
c) The node moves properly and when
it collides with another item, it will
stop and not go ’through’ the item.
When result.gxl is loaded, the latest
position of the node is displayed.
d) The node moves properly and when
it collides with another item, it will
stop and not go ’through’ the item.
When result.gxl is loaded the removed
node should not appear.
e) The node moves properly and when
it collides with another item, it will
stop and not go ’through’ the item.
When result.gxl is loaded the latest
position of the added node is displayed.
a) Pass
b) Pass
c) Pass
d) Pass
e) Pass
164
Test Case 3:
a) Start the application.
Load
graph graph1.gxl.
Open a new
view. Select add node from the
menu. Add a node on an empty
space in view 1. Add a node on an
empty space in view 2. Save graph
into result.gxl. Load result.gxl .
b) Restart the application. Load
graph graph1.gxl. Open a new view.
Select add node from the menu.
Add a node on an empty space in
view 1. Add a node on an empty
space in view 2. Remove the added
node from view 1. Save graph into
result.gxl. Load result.gxl .
c) Restart the application. Load
graph graph1.gxl.
Open a new
view. Select add node from the
menu. Add a node on an empty
space in view 1. Add a node on an
empty space in view 2. Select move
node from the menu and move the
node in view 2. Save graph into
result.gxl. Load result.gxl to check.
d) Restart the application. Load
graph graph1.gxl.
Open a new
view. Select add node from the
menu. Add a node on an empty
space in view 1. Add a node on an
empty space in view 2. Select move
node from the menu and move the
node in view 2. After that node is
moved, remove that node from view
1. Save graph into result.gxl. Load
result.gxl to check.
e) Restart the application. Load
graph graph1.gxl.
Open a new
view. Select add node from the
menu. Add a node on an empty
space in view 1. Add a node on an
empty space in view 2. Select move
node from the menu and move the
node in view 2. After that node
is moved, remove that node from
view 1. Add a new node in view
2. Move the new node in view 1.
Save the graph into result.gxl. Load
result.gxl to check.
graph1.gxl, a) The graph is loaded properly
result.gxl and the node is seen added to the
screen at the correct position. When
the node is added in one of the views, it
should appear in both of them. When
the graph is saved. When result.gxl is
loaded, it displays the correct graph
that was saved before.
b) The graph is loaded properly and
the removed node is removed from
both the file and the screen. result.gxl
displays the correct graph with the
node removed.
c) The node moves properly in both
views and when result.gxl is loaded, the
latest position of the node is displayed.
d) The node moves properly and when
the node is removed, it is removed from
both views automatically result.gxl is
loaded, the removed node should not
appear.
e) The node moves properly in both
views, when the node is removed, it
is removed from both views, the new
node that is added should appear in
both the views. When the new node is
moved, the node should move in both
the views. When result.gxl is loaded,
the latest position of the added node is
displayed.
a) Pass
b) Pass
c) Pass
d) Pass
e) Pass
165
Test case 4:
a) Start the application.
Turn
collision detection on in the settings
menu.
Load graph graph1.gxl.
Open a new view. Select add node
from the menu. Add a node on
an empty space in view 1. Add a
node on an empty space in view 2.
Save graph into result.gxl. Load
result.gxl .
b) Restart the application. Turn
collision detection on in the settings
menu.
Load graph graph1.gxl.
Open a new view. Select add node
from the menu. Add a node on
an empty space in view 1. Add a
node on an empty space in view 2.
Remove the added node from view
1. Save graph into result.gxl. Load
result.gxl .
c) Restart the application. Turn
collision detection on in the settings
menu.
Load graph graph1.gxl.
Open a new view. Select add node
from the menu. Add a node on an
empty space in view 1. Add a node
on an empty space in view 2. Select
move node from the menu and move
the node in view 2. Save graph into
result.gxl. Load result.gxl to check.
d) Restart the application. Turn
collision detection on in the settings
menu.
Load graph graph1.gxl.
Open a new view. Select add node
from the menu. Add a node on an
empty space in view 1. Add a node
on an empty space in view 2. Select
move node from the menu and move
the node in view 2. Remove that
node in view 1. Save graph into
result.gxl. Load result.gxl to check.
e) Restart the application. Turn
collision detection on in the settings
menu.
Load graph graph1.gxl.
Open a new view. Select add node
from the menu. Add a node on an
empty space in view 1. Add a node
on an empty space in view 2. Select
move node from the menu and move
the node in view 2. After that node
is moved, remove that node from
view 1. Add a new node and move
it in view 1. Save the graph into
result.gxl. Load result.gxl to check.
graph1.gxl, a) The graph is loaded properly
result.gxl and the node is seen added to the
screen at the correct position. When
the node is added in one of the views, it
should appear in both of them. When
the graph is saved. When result.gxl is
loaded, it displays the correct graph
that was saved before.
b) The graph is loaded properly and
the removed node is removed from
both the file and the screen. result.gxl
displays the correct graph with the
node removed.
c) The node moves properly in both
views. When the node is about to
collide into another object, it will stop
moving right before it does and when
result.gxl is loaded, the latest position
of the node is displayed.
d) The node moves properly and when
the node is removed, it is removed from
both views automatically result.gxl is
loaded, the removed node should not
appear. When the node is about to
collide into another object, it will stop
moving right before it does.
e) The node moves properly in both
views, when the node is removed, it
is removed from both views, the new
node that is added should appear in
both the views. When the new node is
moved, the node should move in both
the views. When result.gxl is loaded,
the latest position of the added node is
displayed. When the node is about to
collide into another object, it will stop
moving right before it does.
a) Pass
b) Pass
c) Pass
d) Pass
e) Pass
166
Test case 5:
a) Start application and load
graph1.gxl. Select add edge from
the menu.
Add an edge from
NODEA to NODEB. Save the
graph into result.gxl.
Load result.gxl
b) Restart the application and
load graph1.gxl. Select add edge
from the menu. Add an edge from
NODEA to NODEB. Select bend
edge from the menu and bend the
added edge. Save the graph as
result.gxl. Load result.gxl.
c) Restart the application and
load graph1.gxl. Select add edge
from the menu. Add an edge from
NODEA to NODEB. Select bend
edge from the menu and bend the
added edge. Remove that edge.
Save the graph as result.gxl. Load
result.gxl.
d) Restart the application. Add
three nodes and add one edge
between NODEA and NODEB,
and one edge between NODEB and
NODEC. Bend the added edges.
Save the graph as result.gxl. Load
the graph.
e) Restart the application. Add
three nodes and add one edge
between NODEA and NODEB,
and one edge between NODEB
and NODEC. Bend the added
edges. Save the graph as result.gxl.
Remove the edge from NODEB to
NODEC. Save graph as result.gxl.
Load result.gxl.
graph1.gxl, a) A directed edge would appear
result.gxl from NODEA to NODEB. When
result.gxl is loaded, the edge should
appear exactly the same as it was
added.
b) A directed edge would appear
from NODEA to NODEB. When the
edge is bended, the edge would bend
appropriately in the correct direction.
When result.gxl is loaded, the edge
should appear already bended.
c) A directed edge would appear from
NODEA to NODEB. When the edge
is bended, the edge would bend appropriately in the correct direction. When
the edge is removed, it should disappear from the view. When result.gxl is
loaded, the edge should not appear.
d) A directed edge would appear
from NODEA to NODEB and from
NODEB to NODEC. When the edges
are bended, the edges would bend
appropriately in the correct direction.
When result.gxl is loaded, the edge
should appear already bended.
e) A directed edge would appear
from NODEA to NODEB and from
NODEB to NODEC. When the edges
are bended, the edges would bend
appropriately in the correct direction.
When the edges are removed, it should
disappear from the view. When result.gxl is loaded, the edges should not
appear.
a) Pass
b) Pass
c) Pass
d) Pass
e) Pass
167
Test case 6:
a) Start application and turn
on collision detection in the settings
menu. Load graph1.gxl. Select add
edge from the menu. Add an edge
from NODEA to NODEB. Save
the graph into result.gxl.
Load
result.gxl
b) Restart the application and turn
on collision detection in the settings
menu. Load graph1.gxl. Select add
edge from the menu. Add an edge
from NODEA to NODEB. Select
bend edge from the menu and bend
the added edge towards other items
in the graph. Save the graph as
result.gxl. Load result.gxl.
c) Restart the application and turn
on collision detection in the settings
menu. Load graph1.gxl. Select add
edge from the menu. Add an edge
from NODEA to NODEB. Select
bend edge from the menu and bend
the added edge towards other items
in the graph. Remove that edge.
Save the graph as result.gxl. Load
result.gxl.
d) Restart the application and turn
on collision detection in the settings
menu. Add three nodes, NODEA,
NODEB, NODEC and add one edge
between NODEA and NODEB, and
one edge between NODEB and
NODEC. Bend the added edges
towards other items in the graph.
Save the graph as result.gxl. Load
the graph.
e) Restart the application and turn
on collision detection in the settings
menu. Add three nodes, NODEA,
NODEB, NODEC and add one edge
between NODEA and NODEB, and
one edge between NODEB and
NODEC. Bend the added edges
towards other items in the graph.
Remove the edge from NODEB to
NODEC. Save graph as result.gxl.
Load result.gxl.
graph1.gxl, a) A directed edge would appear
result.gxl from NODEA to NODEB. When
result.gxl is loaded, the edge should
appear exactly the same as it was
added.
b) A directed edge would appear
from NODEA to NODEB. When the
edge is bended, the edge would bend
appropriately in the correct direction.
If the edge collides with another item,
it should not go ’through’ it but stop
right before it collides. When result.gxl
is loaded, the edge should appear
already bended.
c) A directed edge would appear
from NODEA to NODEB. When the
edge is bended, the edge would bend
appropriately in the correct direction.
If the edge collides with another item,
it should not go ’through’ it but stop
right before it collides. When the edge
is removed, it should disappear from
the screen. When result.gxl is loaded,
the edge should not appear.
d) A directed edge would appear
from NODEA to NODEB and from
NODEB to NODEC. When the edges
are bended, the edges would bend
appropriately in the correct direction.
If the edge collides with another item,
it should not go ’through’ it but stop
right before it collides. When result.gxl
is loaded, the edge should appear
already bended.
e) A directed edge would appear
from NODEA to NODEB and from
NODEB to NODEC. When the edges
are bended, the edges would bend
appropriately in the correct direction
If the edge collides with another item,
it should not go ’through’ it but stop
right before it collides. When the edges
are removed, it should disappear from
the screen. When result.gxl is loaded,
the edges should not appear.
a) Pass
b) Pass
c) Pass
d) Pass
e) Pass
168
Test Case 7:
a) Start application and load
graph1.gxl.
Open a new view.
Select add edge from the menu.
Add an edge from NODEA to
NODEB in view 2. Save the graph
into result.gxl. Load result.gxl
b) Restart the application and load
graph1.gxl. Open a new view. Select add edge from the menu. Add
an edge from NODEA to NODEB
in view 2. Select bend edge from
the menu and bend the added edge
view 1. Save the graph as result.gxl.
Load result.gxl.
c) Restart the application and load
graph1.gxl.
Open a new view.
Select add edge from the menu.
Add an edge from NODEA to
NODEB in view 2. Select bend
edge from the menu and bend the
added edge in view 2. Remove that
edge in view 1. Save the graph as
result.gxl. Load result.gxl.
d) Restart the application. Open
a new view. Add three nodes and
add one edge between NODEA and
NODEB in view 2, and one edge
between NODEB and NODEC in
view 1. Bend the added edges in
view 2. Save the graph as result.gxl.
Load the graph.
e) Restart the application. Open
a new view. Add three nodes and
add one edge between NODEA and
NODEB in view 2, and one edge
between NODEB and NODEC in
view 1. Bend the added edges in
view 2. Save the graph as result.gxl.
Remove the edge from NODEB to
NODEC in view 1. Save graph as
result.gxl. Load result.gxl.
graph1.gxl, a) A directed edge would appear
result.gxl from NODEA to NODEB in both
views. When result.gxl is loaded, the
edge should appear exactly the same
as it was added.
b) A directed edge would appear
from NODEA to NODEB in both
views. When the edge is bended, the
edge would bend appropriately in the
correct direction in both views. When
result.gxl is loaded, the edge should
appear already bended.
c) A directed edge would appear from
NODEA to NODEB in both views.
When the edge is bended, the edge
would bend appropriately in the correct direction in both views. When the
edge is removed, it should disappear
from both views. When result.gxl is
loaded, the edge should not appear.
d) A directed edge would appear from
NODEA to NODEB and from NODEB
to NODEC in both views. When the
edges are bended, the edges would bend
appropriately in the correct direction
in both views.
When result.gxl is
loaded, the edge should appear already
bended.
e) A directed edge would appear from
NODEA to NODEB and from NODEB
to NODEC in both views. When the
edges are bended, the edges would
bend appropriately in the correct
direction in both views. When the
edges are removed, it should disappear
from both views. When result.gxl is
loaded, the edges should not appear.
a) Pass
b) Pass
c) Pass
d) Pass
e) Pass
169
Test Case 8:
a) Start application and load
graph1.gxl.
Turn on collision
detection in the settings menu.
Open a new view. Select add edge
from the menu. Add an edge from
NODEA to NODEB in view 2.
Save the graph into result.gxl. Load
result.gxl
b) Restart the application and load
graph1.gxl. Turn on collision detection in the settings menu. Open a
new view. Select add edge from the
menu. Add an edge from NODEA
to NODEB in view 2. Select bend
edge from the menu and bend the
added edge view 1. Save the graph
as result.gxl. Load result.gxl.
c) Restart the application and load
graph1.gxl. Turn on collision detection in the settings menu. Open a
new view. Select add edge from the
menu. Add an edge from NODEA
to NODEB in view 2. Select bend
edge from the menu and bend the
added edge in view 2. Remove that
edge in view 1. Save the graph as
result.gxl. Load result.gxl.
d) Restart the application. Turn on
collision detection in the settings
menu. Open a new view. Add three
nodes and add one edge between
NODEA and NODEB in view 2,
and one edge between NODEB and
NODEC in view 1. Bend the added
edges in view 2. Save the graph as
result.gxl. Load the graph.
e) Restart the application. Open
a new view. Add three nodes and
add one edge between NODEA and
NODEB in view 2, and one edge
between NODEB and NODEC in
view 1. Bend the added edges in
view 2. Save the graph as result.gxl.
Remove the edge from NODEB to
NODEC in view 1. Save graph as
result.gxl. Load result.gxl.
graph1.gxl, a) A directed edge would appear
result.gxl from NODEA to NODEB in both
views. When result.gxl is loaded, the
edge should appear exactly the same
as it was added.
b) A directed edge would appear from
NODEA to NODEB in both views.
When the edge is bended, the edge
would bend appropriately in the correct
direction in both views. If the edge
collides with another item, it should
not go ’through’ it but stop right
before it collides. When result.gxl is
loaded, the edge should appear already
bended.
c) A directed edge would appear
from NODEA to NODEB in both
views. When the edge is bended, the
edge would bend appropriately in the
correct direction in both views. If
the edge collides with another item,
it should not go ’through’ it but stop
right before it collides. When the edge
is removed, it should disappear from
both views. When result.gxl is loaded,
the edge should not appear.
d) A directed edge would appear from
NODEA to NODEB and from NODEB
to NODEC in both views. When the
edges are bended, the edges would bend
appropriately in the correct direction
in both views. If the edge collides
with another item, it should not go
’through’ it but stop right before it
collides. When result.gxl is loaded, the
edge should appear already bended.
e) A directed edge would appear from
NODEA to NODEB and from NODEB
to NODEC in both views. When the
edges are bended, the edges would bend
appropriately in the correct direction
in both views. If the edge collides
with another item, it should not go
’through’ it but stop right before it
collides. When the edges are removed,
it should disappear from both views.
When result.gxl is loaded, the edges
should not appear.
a) Pass
b) Pass
c) Pass
d) Pass
e) Pass
170
Test Case 9:
a) Start the application.
Add
4 nodes,
NODEA, NODEB,
NODEC and NODED. Add
an
edge(EDGEA)
between
NODEA and NODEB. Add an
edge(EDGEB) betwen NODEC and
NODED such that it is parallel to
EDGEA. Move NODEA across the
other side of EDGEA. Save graph
as result.gxl. Load result.gxl.
b) Remove NODEA. Save graph as
result.gxl. Load result.gxl.
c) Restart the application. Add
4 nodes,
NODEA, NODEB,
NODEC and NODED. Add
an
edge(EDGEA)
between
NODEA and NODEB. Add an
edge(EDGEB) betwen NODEC and
NODED such that it is parallel
to EDGEA. Move NODEA across
the other side of EDGEA. Remove
EDGEB and remove NODEA. d)
Save graph as result.gxl.
Load
result.gxl.
result.gxl
a) The 4 nodes and edges should
display correctly when added. When
the NODEA is moved across the other
side of EDGEA, NODEA should pass
’through’ all the items in its way safely
and EDGEA would follow NODEA
wherever it goes. When result.gxl is
loaded, the graph should appear as it
was last seen after the movement.
b) When NODEA is removed, EDEGA
should also be automatically removed.
When result.gxl is loaded, the graph
should only contain NODEB, NODEC,
NODED and EDGEB.
c) The 4 nodes and edges should
display correctly when added. When
the NODEA is moved across the other
side of EDGEA, NODEA should pass
’through’ all the items in its way safely
and EDGEA would follow NODEA
wherever it goes. When EDGEB and
NODEA is removed, the graph would
be only displaying NODEB,NODEC
and NODED.
d) When result.gxl is loaded, the graph
should be displaying only NODEB,
NODEC and NODED.
a) Pass
b) Pass
c) Pass
d) Pass
171
Test Case 10:
a) Start the application.
Start
application and turn on collision detection in the settings
menu.
Add 4 nodes, NODEA,
NODEB, NODEC and NODED.
Add an edge(EDGEA) between
NODEA and NODEB. Add an
edge(EDGEB) betwen NODEC and
NODED such that it is parallel to
EDGEA. Move NODEA across the
other side of EDGEA. Save graph
as result.gxl. Load result.gxl.
b) Remove NODEA. Save graph as
result.gxl. Load result.gxl.
c) Restart the application. Turn on
collision detection in the settings
menu.
Add 4 nodes, NODEA,
NODEB, NODEC and NODED.
Add an edge(EDGEA) between
NODEA and NODEB. Add an
edge(EDGEB) betwen NODEC and
NODED such that it is parallel
to EDGEA. Move NODEA across
the other side of EDGEA. Remove
EDGEB and remove NODEA. d)
Save graph as result.gxl.
Load
result.gxl.
result.gxl
a) The 4 nodes and edges should
display correctly when added. When
the NODEA is moved across the other
side of EDGEA, NODEA should not
pass ’through’ all the items in its way
but EDGEA would follow NODEA
wherever it goes. When result.gxl is
loaded, the graph should appear as it
was last seen after the movement.
b) When NODEA is removed, EDEGA
should also be automatically removed.
When result.gxl is loaded, the graph
should only contain NODEB, NODEC,
NODED and EDGEB.
c) The 4 nodes and edges should
display correctly when added. When
the NODEA is moved across the other
side of EDGEA, NODEA should not
pass ’through’ all the items in its way
but EDGEA would follow NODEA
wherever it goes. When EDGEB and
NODEA is removed, the graph would
be only displaying NODEB,NODEC
and NODED.
d) When result.gxl is loaded, the graph
should be displaying only NODEB,
NODEC and NODED.
c) Collision
detection
fails
on
detecting
the case of
EDGEA colliding with
EDGEB.
a) Pass
b) Pass
c) Fail
d) Pass
172
Test Case 11:
a) Start the application.
Open
a new view. Add 4 nodes, NODEA
in view 1, NODEB in view 2,
NODEC and NODED in view 1.
Add an edge(EDGEA) between
NODEA and NODEB in view 1.
Add an edge(EDGEB) betwen
NODEC and NODED such that
it is parallel to EDGEA in view
2. Move NODEA across the other
side of EDGEA. Save graph as
result.gxl. Load result.gxl.
b) Remove NODEA. Save graph as
result.gxl. Load result.gxl.
c) Restart the application. Open a
new view. Add 4 nodes, NODEA in
view 1, NODEB in view 2, NODEC
and NODED in view 1. Add an
edge(EDGEA) between NODEA
and NODEB in view 1. Add an
edge(EDGEB) betwen NODEC and
NODED such that it is parallel to
EDGEA in view 2. Move NODEA
across the other side of EDGEA
in view 2. Remove EDGEB and
remove NODEA in view 1.
d) Save graph as result.gxl. Load
result.gxl.
result.gxl
a) The 4 nodes and edges should
display correctly in all the views when
added. When the NODEA is moved
across the other side of EDGEA,
NODEA should pass ’through’ all the
items in its way safely and EDGEA
would follow NODEA wherever it goes.
When result.gxl is loaded, the graph
should appear as it was last seen after
the movement.
b) When NODEA is removed, EDEGA
should also be automatically removed
from all views. When result.gxl is
loaded, the graph should only contain NODEB, NODEC, NODED and
EDGEB.
c) The 4 nodes and edges should
display correctly in all the views when
added. When the NODEA is moved
across the other side of EDGEA,
NODEA should pass ’through’ all the
items in its way safely and EDGEA
would follow NODEA wherever it
goes. When EDGEB and NODEA is
removed, the graph would be only displaying NODEB,NODEC and NODED
in all the views.
d) When result.gxl is loaded, the graph
should be displaying only NODEB,
NODEC and NODED.
a) Pass
b) Pass
c) Pass
d) Pass
173
Test Case 12:
a) Start the application.
Turn
on collision detection in the settings
menu. Open a new view. Add 4
nodes, NODEA in view 1, NODEB
in view 2, NODEC and NODED
in view 1. Add an edge(EDGEA)
between NODEA and NODEB in
view 1.
Add an edge(EDGEB)
betwen NODEC and NODED such
that it is parallel to EDGEA in
view 2. Move NODEA across the
other side of EDGEA. Save graph
as result.gxl. Load result.gxl.
b) Remove NODEA. Save graph as
result.gxl. Load result.gxl.
c) Restart the application. Turn on
collision detection in the settings
menu. Open a new view. Add 4
nodes, NODEA in view 1, NODEB
in view 2, NODEC and NODED
in view 1. Add an edge(EDGEA)
between NODEA and NODEB in
view 1.
Add an edge(EDGEB)
betwen NODEC and NODED such
that it is parallel to EDGEA in view
2. Move NODEA across the other
side of EDGEA in view 2. Remove
EDGEB and remove NODEA in
view 1.
d) Save graph as result.gxl. Load
result.gxl.
result.gxl
a) The 4 nodes and edges should
display correctly in all the views when
added. When the NODEA is moved
across the other side of EDGEA,
NODEA should not pass ’through’
all the items in its way but EDGEA
would follow NODEA wherever it goes.
When result.gxl is loaded, the graph
should appear as it was last seen after
the movement.
b) When NODEA is removed, EDEGA
should also be automatically removed
from all views. When result.gxl is
loaded, the graph should only contain NODEB, NODEC, NODED and
EDGEB.
c) The 4 nodes and edges should display
correctly in all the views when added.
When the NODEA is moved across the
other side of EDGEA, NODEA should
not pass ’through’ all the items in its
way but EDGEA would follow NODEA
wherever it goes. When EDGEB and
NODEA is removed, the graph would
be only displaying NODEB,NODEC
and NODED in all the views.
d) When result.gxl is loaded, the graph
should be displaying only NODEB,
NODEC and NODED.
c) Collision
detection
fails
on
detecting
the case of
EDGEA colliding with
EDGEB.
a) Pass
b) Pass
c) Fail
d) Pass
174
Test Case 13:
a) Start the application.
Add
4 nodes,
NODEA, NODEB,
NODEC and NODED. Add
an
edge(EDGEA)
between
NODEA and NODEB. Add an
edge(EDGEB) betwen NODEC and
NODED such that it is parallel
to EDGEA. Move NODEA across
the other side of EDGEA. Bend
EDGEB. Save graph as result.gxl.
Load result.gxl.
b) Remove NODEA. Save graph as
result.gxl. Load result.gxl.
c) Restart the application. Add
4 nodes,
NODEA, NODEB,
NODEC and NODED. Add
an
edge(EDGEA)
between
NODEA and NODEB. Add an
edge(EDGEB) betwen NODEC and
NODED such that it is parallel
to EDGEA. Move NODEA across
the other side of EDGEA. Bend
EDGEB. Remove EDGEB and
remove NODEA.
d) Save graph as result.gxl. Load
result.gxl.
result.gxl
a) The 4 nodes and edges should
display correctly when added. When
the NODEA is moved across the other
side of EDGEA, NODEA should pass
’through’ all the items in its way safely
and EDGEA would follow NODEA
wherever it goes. When EDGEB is
bent, the edge should bend appropriately. When result.gxl is loaded, the
graph should appear as it was last seen
after the movement and bending.
b) When NODEA is removed, EDEGA
should also be automatically removed.
When result.gxl is loaded, the graph
should only contain NODEB, NODEC,
NODED and EDGEB.
c) The 4 nodes and edges should
display correctly when added. When
the NODEA is moved across the
other side of EDGEA, NODEA should
pass ’through’ all the items in its
way safely and EDGEA would follow
NODEA wherever it goes.
When
EDGEB is bent, the edge should bend
appropriately.
When EDGEB and
NODEA is removed, the graph would
be only displaying NODEB,NODEC
and NODED.
d) When result.gxl is loaded, the graph
should be displaying only NODEB,
NODEC and NODED.
a) Pass
b) Pass
c) Pass
d) Pass
175
Test Case 14:
a) Start the application.
Open
a new view. Add 4 nodes, NODEA
and NODEB in view 1, NODEC
and NODED in view 2. Add an
edge(EDGEA) between NODEA
and NODEB in view 1. Add an
edge(EDGEB) betwen NODEC and
NODED such that it is parallel to
EDGEA in view 2. Move NODEA
across the other side of EDGEA
in view 1. Bend EDGEB in view
2. Save graph as result.gxl. Load
result.gxl.
b) Remove NODEA from view 2.
Save graph as result.gxl.
Load
result.gxl.
c) Restart the application. Open a
new view. Add 4 nodes, NODEA
and NODEB in view 1, NODEC
and NODED in view 2. Add an
edge(EDGEA) between NODEA
and NODEB in view 1. Add an
edge(EDGEB) betwen NODEC and
NODED such that it is parallel to
EDGEA in view 2. Move NODEA
across the other side of EDGEA
in view 1. Bend EDGEB in view
2. Remove EDGEB and remove
NODEA in view 1.
d) Save graph as result.gxl. Load
result.gxl.
result.gxl
a) The 4 nodes and edges should
display correctly in all 2 views when
added. When the NODEA is moved
across the other side of EDGEA,
NODEA should pass ’through’ all the
items in its way safely and EDGEA
would follow NODEA wherever it goes.
When EDGEB is bent, the edge should
bend appropriately. All changes in
one view should always show in all the
views too. When result.gxl is loaded,
the graph should appear as it was last
seen after the movement and bending.
b) When NODEA is removed, EDEGA
should also be automatically removed.
When result.gxl is loaded, the graph
should only contain NODEB, NODEC,
NODED and EDGEB. All changes in
one view should always show in all the
other views.
c) The 4 nodes and edges should
display correctly when added. When
the NODEA is moved across the
other side of EDGEA, NODEA should
pass ’through’ all the items in its
way safely and EDGEA would follow
NODEA wherever it goes.
When
EDGEB is bent, the edge should bend
appropriately.
When EDGEB and
NODEA is removed, the graph would
be only displaying NODEB,NODEC
and NODED. All changes in one view
should always show in all the views
too.
d) When result.gxl is loaded, the graph
should be displaying only NODEB,
NODEC and NODED.
a) Pass
b) Pass
c) Pass
d) Pass
176
Test Case 15:
a) Start the application.
Add
4 nodes,
NODEA, NODEB,
NODEC and NODED. Add
an
edge(EDGEA)
between
NODEA and NODEB. Add an
edge(EDGEB) betwen NODEC and
NODED such that it is parallel
to EDGEA. Move NODEA across
the other side of EDGEA. Bend
EDGEB. Save graph as result.gxl.
Load result.gxl.
b) Remove NODEA. Save graph as
result.gxl. Load result.gxl.
c) Restart the application. Add
4 nodes,
NODEA, NODEB,
NODEC and NODED. Add
an
edge(EDGEA)
between
NODEA and NODEB. Add an
edge(EDGEB) betwen NODEC and
NODED such that it is parallel
to EDGEA. Move NODEA across
the other side of EDGEA. Bend
EDGEB. Remove EDGEB and
remove NODEA.
d) Save graph as result.gxl. Load
result.gxl.
result.gxl
a) The 4 nodes and edges should
display correctly when added. When
the NODEA is moved across the other
side of EDGEA, NODEA should not
pass ’through’ all the items in its way
and EDGEA would follow NODEA
wherever it goes. When EDGEB is
bent, the edge should bend appropriately and not pass ’through’ any items
in its way. When result.gxl is loaded,
the graph should appear as it was last
seen after the movement and bending.
b) When NODEA is removed, EDEGA
should also be automatically removed.
When result.gxl is loaded, the graph
should only contain NODEB, NODEC,
NODED and EDGEB.
c) The 4 nodes and edges should
display correctly when added. When
the NODEA is moved across the other
side of EDGEA, NODEA should not
pass ’through’ all the items in its way
and EDGEA would follow NODEA
wherever it goes. When EDGEB is
bent, the edge should bend appropriately and not pass ’through’ any
items in its way. When EDGEB and
NODEA is removed, the graph would
be only displaying NODEB,NODEC
and NODED.
d) When result.gxl is loaded, the graph
should be displaying only NODEB,
NODEC and NODED.
a) Collision
detection
fails
on
detecting
the case of
EDGEA colliding with
EDGEB.
c) Collision
detection
fails
on
detecting
the case of
EDGEA colliding with
EDGEB.
a) Fail
b) Pass
c) Fail
d) Pass
177
Test Case 16:
a) Start the application.
Open
a new view. Add 4 nodes, NODEA
and NODEB in view 1, NODEC
and NODED in view 2. Add an
edge(EDGEA) between NODEA
and NODEB in view 1. Add an
edge(EDGEB) betwen NODEC and
NODED such that it is parallel to
EDGEA in view 2. Move NODEA
across the other side of EDGEA
in view 1. Bend EDGEB in view
2. Save graph as result.gxl. Load
result.gxl.
b) Remove NODEA in view 1. Save
graph as result.gxl. Load result.gxl.
c) Restart the application. Add
4 nodes, NODEA and NODEB
in view 1, NODEC and NODED
in view2. Add an edge(EDGEA)
between NODEA and NODEB in
view 1.
Add an edge(EDGEB)
betwen NODEC and NODED such
that it is parallel to EDGEA in
view 2. Move NODEA across the
other side of EDGEA in view 1.
Bend EDGEB in view 2. Remove
EDGEB and remove NODEA in
view1.
d) Save graph as result.gxl. Load
result.gxl.
result.gxl
a) The 4 nodes and edges should
display correctly when added. When
the NODEA is moved across the other
side of EDGEA, NODEA should not
pass ’through’ all the items in its way
and EDGEA would follow NODEA
wherever it goes. When EDGEB is
bent, the edge should bend appropriately and not pass ’through’ any items
in its way. All changes in one view
should always show in all the views
too. When result.gxl is loaded, the
graph should appear as it was last seen
after the movement and bending.
b) When NODEA is removed, EDEGA
should also be automatically removed.
When result.gxl is loaded, the graph
should only contain NODEB, NODEC,
NODED and EDGEB. All changes in
one view should always show in all the
views too.
c) The 4 nodes and edges should
display correctly when added. When
the NODEA is moved across the other
side of EDGEA, NODEA should not
pass ’through’ all the items in its way
and EDGEA would follow NODEA
wherever it goes. When EDGEB is
bent, the edge should bend appropriately and not pass ’through’ any
items in its way. When EDGEB and
NODEA is removed, the graph would
be only displaying NODEB,NODEC
and NODED. All changes in one view
should always show in all the views
too.
d) When result.gxl is loaded, the graph
should be displaying only NODEB,
NODEC and NODED.
a) Collision
detection
fails
on
detecting
the case of
EDGEA colliding with
EDGEB.
c) Collision
detection
fails
on
detecting
the case of
EDGEA colliding with
EDGEB.
a) Fail
b) Pass
c) Fail
d) Pass
178
Test Case 17:
a) Start the application and
load graph1.gxl. Select rotate view
from the menu and rotate the view.
Select rotate graph from the menu
and rotate the graph. Save graph
as result.gxl. Load result.gxl
b) Restart the application and load
graph1.gxl. Select rotate view from
the menu and rotate the view.
Select rotate graph from the menu
and rotate the graph. Undo all
the operations.
Save graph as
result.gxl. Load result.gxl
c) Restart the application. Toggle
axis on in the settings menu. Add
two nodes (NODEA,NODEB).
Rotate the view. Save graph as
result.gxl. Load result.gxl.
d) Restart the application. Toggle
axis on in the settings menu. Add
two nodes (NODEA,NODEB).
Rotate the graph. Save graph as
result.gxl. Load result.gxl.
e) Restart the application. Add
two nodes (NODEA,NODEB), and
an edge (EDGEA) for the nodes.
Rotate the graph. Rotate the view.
Save graph as result.gxl.
Load
result.gxl.
f) Bend EDGEA from above. Rotate the view. Rotate the graph.
graph1.gxl, a) Rotation of the view and rotaresult.gxl tion of the graph should behave
appropriately.
When result.gxl is
loaded, the rotated graph is shown
without the rotation of the view.
b) All the operations only in the graph
rotation should be undone.
When
result.gxl is loaded, the graph with no
graph rotations would be displayed.
c) The view should rotate appropriately together with the axis and when
result.gxl is loaded, the rotation from
previously should not be displayed.
d) The graph should rotate appropriately but not with the axis and when
result.gxl is loaded, the rotation done
to the graph should be displayed.
e) Rotation of the view and rotation of
the graph should behave appropriately.
When result.gxl is loaded, the rotated
graph without the view rotation is
displayed.
f) Rotation of the view and rotation of
the graph should behave appropriately
and not affect the bending of the edges
in an unnatural way.
a) Pass
b) Pass
c) Pass
d) Pass
e) Pass
f) Pass
179
Test Case 18:
a) Start the application and
load graph1.gxl. Open a new view.
Select rotate view from the menu
and rotate the view in view 1.
Select rotate graph from the menu
and rotate the graph in view 2.
Save graph as result.gxl.
Load
result.gxl
b) Restart the application and
load graph1.gxl. Open a new view.
Select rotate view from the menu
and rotate the view in view 1.
Select rotate graph from the menu
and rotate the graph in view 2.
Undo all the operations. Save graph
as result.gxl. Load result.gxl
c) Restart the application. Open
a new view. Toggle axis on in the
settings menu.
Add two nodes
(NODEA,NODEB) in view 1. Rotate the view in view 2. Save graph
as result.gxl. Load result.gxl.
d) Restart the application. Open
a new view. Toggle axis on in the
settings menu.
Add two nodes
(NODEA,NODEB) in view 1.
Rotate the graph in view 2. Save
graph as result.gxl. Load result.gxl.
e) Restart the application. Open
a new view.
Add two nodes
(NODEA,NODEB) in view 1, and
an edge (EDGEA) for the nodes in
view 2. Rotate the graph in view
1. Rotate the view in view 2. Save
graph as result.gxl. Load result.gxl.
f) Bend EDGEA from above in
view 1. Rotate the view in view 2.
Rotate the graph.
graph1.gxl, a) Rotation of the view and rotaresult.gxl tion of the graph should behave
appropriately.
When result.gxl is
loaded, the rotated graph is shown
without the rotation of the view. The
rotated graph is updated in both views.
View rotation should only affect its
own view.
b) All the operations only in the graph
rotation should be undone.
When
result.gxl is loaded, the graph with no
graph rotations would be displayed.
The rotated graph is updated in both
views. View rotation should only affect
its own view.
c) The view should rotate appropriately together with the axis and when
result.gxl is loaded, the rotation from
previously should not be displayed.
The rotated graph is updated in both
views. View rotation should only affect
its own view.
d) The graph should rotate appropriately but not with the axis and when
result.gxl is loaded, the rotation done
to the graph should be displayed. The
rotated graph is updated in both views.
View rotation should only affect its
own view.
e) Rotation of the view and rotation of
the graph should behave appropriately.
When result.gxl is loaded, the rotated
graph without the view rotation is displayed. The rotated graph is updated
in both views. View rotation should
only affect its own view.
f) Rotation of the view and rotation of
the graph should behave appropriately
and not affect the bending of the edges
in an unnatural way. When rotation is
done on view 2, view 1’s graph should
not rotate, only view 2’s. The rotated
graph is updated in both views. View
rotation should only affect its own
view.
a) Pass
b) Pass
c) Pass
d) Pass
e) Pass
f) Pass
180
Test Case 19:
a) Start the application and
load graph1.gxl. Select rotate view
from the menu and rotate the
view. Select rotate graph from the
menu and rotate the graph. Move
NODEA. Save graph as result.gxl.
Load result.gxl
b) Restart the application and
load graph1.gxl. Select rotate view
from the menu and rotate the
view. Select rotate graph from the
menu and rotate the graph. Move
NODEA. Undo all the operations.
Save graph as result.gxl.
Load
result.gxl
c) Restart the application. Toggle
axis on in the settings menu. Add
two nodes (NODEA,NODEB).
Rotate the view. Move NODEA.
Save graph as result.gxl.
Load
result.gxl.
d) Restart the application. Toggle
axis on in the settings menu. Add
two nodes (NODEA,NODEB).
Rotate the graph. Move NODEA.
Save graph as result.gxl.
Load
result.gxl.
e) Restart the application. Add
two nodes (NODEA,NODEB), and
an edge (EDGEA) for the nodes.
Rotate the graph.
Rotate the
view. Move NODEA. Save graph as
result.gxl. Load result.gxl.
f) Bend EDGEA from above. Rotate the view. Rotate the graph.
graph1.gxl, a) Rotation of the view and rotaresult.gxl tion of the graph should behave
appropriately. NODEA moves properly acoording to the mouse when
moved. When result.gxl is loaded, the
rotated graph is shown without the
rotation of the view.
b) All the operations only in the graph
rotation should be undone. NODEA
moves properly acoording to the
mouse when moved. When result.gxl
is loaded, the graph with no graph
rotations would be displayed.
c) The view should rotate appropriately
together with the axis. NODEA moves
properly acoording to the mouse when
moved. When result.gxl is loaded, the
rotation from previously should not be
displayed.
d) The graph should rotate appropriately but not with the axis. NODEA
moves properly acoording to the mouse
when moved.
When result.gxl is
loaded, the rotation done to the graph
should be displayed.
e) Rotation of the view and rotation of
the graph should behave appropriately.
NODEA moves properly acoording
to the mouse when moved. When
result.gxl is loaded, the rotated graph
without the view rotation is displayed.
f) NODEA moves properly acoording
to the mouse when moved. Rotation
of the view and rotation of the graph
should behave appropriately and not
affect the bending of the edges in an
unnatural way.
a) Pass
b) Pass
c) Pass
d) Pass
e) Pass
f) Pass
181
Test Case 20:
a) Start the application and
load graph1.gxl. Open a new view.
Select rotate view from the menu
and rotate the view in view 1.
Select rotate graph from the menu
and rotate the graph in view 2.
Move NODEA in view 1. Save
graph as result.gxl. Load result.gxl
b) Restart the application and
load graph1.gxl. Open a new view.
Select rotate view from the menu
and rotate the view in view 1.
Select rotate graph from the menu
and rotate the graph in view 2.
Move NODEA in view 1. Undo
all the operations. Save graph as
result.gxl. Load result.gxl
c) Restart the application. Open
a new view. Toggle axis on in the
settings menu.
Add two nodes
(NODEA,NODEB) in view 1.
Rotate the view in view 2. Move
NODEA in view 1. Save graph as
result.gxl. Load result.gxl.
d) Restart the application. Open
a new view. Toggle axis on in the
settings menu.
Add two nodes
(NODEA,NODEB) in view 1.
Rotate the graph in view 2. Move
NODEA in view 1. Save graph as
result.gxl. Load result.gxl.
e) Restart the application. Open
a new view.
Add two nodes
(NODEA,NODEB) in view 1, and
an edge (EDGEA) for the nodes in
view 2. Rotate the graph in view
1. Rotate the view in view 2. Move
NODEA in view 1. Save graph as
result.gxl. Load result.gxl.
f) Bend EDGEA from above in
view 1. Rotate the view in view 2.
Rotate the graph in view 1.
graph1.gxl, a) Rotation of the view and rotaresult.gxl tion of the graph should behave
appropriately. NODEA moves properly acoording to the mouse when
moved. When result.gxl is loaded, the
rotated graph is shown without the
rotation of the view. All changes done
to a graph in one view should always
be shown in other views.
b) All the operations only in the
graph rotation should be undone.
NODEA moves properly acoording
to the mouse when moved. When
result.gxl is loaded, the graph with no
graph rotations would be displayed.
All changes done to a graph in one
view should always be shown in other
views.
c) The view should rotate appropriately
together with the axis. NODEA moves
properly acoording to the mouse when
moved. When result.gxl is loaded, the
rotation from previously should not be
displayed. All changes done to a graph
in one view should always be shown in
other views. Changes to a view do not
get updated in all other views.
d) The graph should rotate appropriately but not with the axis. NODEA
moves properly acoording to the mouse
when moved.
When result.gxl is
loaded, the rotation done to the graph
should be displayed. All changes done
to a graph in one view should always
be shown in other views. Changes to
a view do not get updated in all other
views.
e) Rotation of the view and rotation of
the graph should behave appropriately.
NODEA moves properly acoording
to the mouse when moved. When
result.gxl is loaded, the rotated graph
without the view rotation is displayed.
All changes done to a graph in one
view should always be shown in other
views.
f) NODEA moves properly acoording
to the mouse when moved. Rotation
of the view and rotation of the graph
should behave appropriately and not
affect the bending of the edges in an
unnatural way. All changes done to
a graph in one view should always be
shown in other views.
a) Pass
b) Pass
c) Pass
d) Pass
e) Pass
f) Pass
182
Test Case 21:
a-f) From test case x of rotation and zooming, perform zoom
graph on the graph right before
saving it into result.gxl for each
case.
graph1.gxl, a) Rotation and zooming of the
result.gxl graph should behave appropriately.
When result.gxl is loaded, the zoomed
graph is shown without the rotation of
the view.
b) All the operations only in the graph
rotation should be undone.
When
result.gxl is loaded, the graph with no
graph rotations would be displayed.
c) The graph should zoom appropriately together with the axis and when
result.gxl is loaded, the rotation from
previously should not be displayed.
d) The graph should zoom appropriately but not with the axis and when
result.gxl is loaded, the scaling done to
the graph should be displayed.
e) Zooming of the graph should behave
appropriately.
When result.gxl is
loaded, the scaled graph without the
view rotation is displayed.
f) Rotation of the view and rotation/zooming of the graph should
behave appropriately and not affect the
bending of the edges in an unnatural
way.
a) Pass
b) Pass
c) Pass
d) Pass
e) Pass
f) Pass
183
Test Case 22:
a-f) From test case x of rotation and zooming with multiple
views, perform zoom graph on the
graph in view 1 right before saving
it into result.gxl for each case.
graph1.gxl, a) Rotation and zooming of the
result.gxl graph should behave appropriately.
When result.gxl is loaded, the zoomed
graph is shown without the rotation of
the view.
b) All the operations only in the graph
rotation should be undone.
When
result.gxl is loaded, the graph with no
graph rotations would be displayed.
All changes done to a graph in one
view should always be shown in other
views automatically. Changes to a
view do not get updated in all other
views.
c) The graph should zoom appropriately together with the axis and when
result.gxl is loaded, the rotation from
previously should not be displayed. All
changes done to a graph in one view
should always be shown in other views
automatically. Changes to a view do
not get updated in all other views.
d) The graph should zoom appropriately but not with the axis and when
result.gxl is loaded, the scaling done
to the graph should be displayed. All
changes done to a graph in one view
should always be shown in other views
automatically. Changes to a view do
not get updated in all other views.
e) Zooming of the graph should behave appropriately. When result.gxl
is loaded, the scaled graph without
the view rotation is displayed. All
changes done to a graph in one view
should always be shown in other views
automatically. Changes to a view do
not get updated in all other views.
f) Rotation of the view and rotation/zooming of the graph should
behave appropriately and not affect the
bending of the edges in an unnatural
way. All changes done to a graph in
one view should always be shown in
other views automatically. Changes to
a view do not get updated in all other
views.
a) Pass
b) Pass
c) Pass
d) Pass
e) Pass
f) Pass
184
Test Case 23:
a-f) From test case x of zoom(scale)
graph, perform zooming the view
before saving it into result.gxl for
each case.
graph1.gxl, a) Zooming of the view after all
result.gxl the other operations should behave
appropriately.
When result.gxl is
loaded, the zoomed graph is shown
without the zooming of the view.
b) All the operations only in the graph
rotation should be undone.
When
result.gxl is loaded, the graph with no
graph rotations would be displayed.
c) The view should zoom appropriately
together with the axis and when
result.gxl is loaded, the rotation from
previously should not be displayed.
d) The graph should zoom appropriately and when result.gxl is loaded, the
scaling done to the graph should be
displayed but not the zooming of the
view.
e) Zooming of the graph and view
should behave appropriately. When
result.gxl is loaded, the scaled graph
without the view rotation and view
zooming is displayed.
f) Rotation/zooming of the view and
rotation/zooming of the graph should
behave appropriately and not affect the
bending of the edges in an unnatural
way.
a) Pass
b) Pass
c) Pass
d) Pass
e) Pass
f) Pass
185
Test Case 24:
a-f) From test case x of zoom(scale)
graph, open a new view right after
starting the application, perform
zooming the view right before
saving it into result.gxl for each
case.
graph1.gxl, a) Zooming of the view after all
result.gxl the other operations should behave
appropriately.
When result.gxl is
loaded, the zoomed graph is shown
without the zooming of the view. All
changes done to a graph in one view
should always be shown in other views
automatically. Changes to a view do
not get updated in all other views.
b) All the operations only in the graph
rotation should be undone.
When
result.gxl is loaded, the graph with no
graph rotations would be displayed.
All changes done to a graph in one
view should always be shown in other
views automatically. Changes to a
view do not get updated in all other
views.
c) The view should zoom appropriately
together with the axis and when
result.gxl is loaded, the rotation from
previously should not be displayed. All
changes done to a graph in one view
should always be shown in other views
automatically. Changes to a view do
not get updated in all other views.
d) The graph should zoom appropriately and when result.gxl is loaded, the
scaling done to the graph should be
displayed but not the zooming of the
view. All changes done to a graph in
one view should always be shown in
other views automatically. Changes to
a view do not get updated in all other
views.
e) Zooming of the graph and view
should behave appropriately. When
result.gxl is loaded, the scaled graph
without the view rotation and view
zooming is displayed. All changes done
to a graph in one view should always
be shown in other views automatically.
Changes to a view do not get updated
in all other views.
f) Rotation/zooming of the view and
rotation/zooming of the graph should
behave appropriately and not affect the
bending of the edges in an unnatural
way. All changes done to a graph in
one view should always be shown in
other views automatically. Changes to
a view do not get updated in all other
views.
a) Pass
b) Pass
c) Pass
d) Pass
e) Pass
f) Pass
186
Test Case 25:
a) Start the application.
Save
the view file for each of the test
cases in test case x (zoom scale
graph zoom view)
a-f) From test case x of ( zoom scale
graph zoom view ), save the view
as TestView.txt and save the graph
as result.gxl in each case. Load the
view after that.
graph1.gxl,
result.
gxl,
TestView.
txt
a) When TestView.txt is loaded,
the correct view when it was saved is
displayed.
b) All the operations only in the graph
rotation should be undone.
When
result.gxl is loaded, the graph with no
graph rotations would be displayed.
When TestView.txt is loaded, the
correct view when it was saved is
displayed.
c) The graph should zoom appropriately together with the axis and when
result.gxl is loaded, the rotation from
previously should not be displayed.
When TestView.txt is loaded, the
correct view when it was saved is
displayed.
d) The graph should zoom appropriately but not with the axis and when
result.gxl is loaded, the scaling done to
the graph should be displayed. When
TestView.txt is loaded, the correct
view when it was saved is displayed.
e) Zooming of the graph should behave
appropriately.
When result.gxl is
loaded, the scaled graph without the
view rotation is displayed.
When
TestView.txt is loaded, the correct
view when it was saved is displayed.
f) Rotation of the view and rotation/zooming of the graph should
behave appropriately and not affect the
bending of the edges in an unnatural
way. When TestView.txt is loaded,
the correct view when it was saved is
displayed.
a) Pass
b) Pass
c) Pass
d) Pass
e) Pass
f) Pass
187
Test Case 26:
a) Start the application and
open 3 new view. Load graph1.gxl.
b) Close the graph and open
graph1.gxl. c) Close the graph,
close one view and open graph1.gxl
d) Close all views.
graph1.gxl, a) When the views are opened,
result.gxl seperate windows should appear to
display each view. When graph1.gxl
is loaded, each view would display
graph1.
b) When the graph is closed, all the 3
views should display nothing. When
graph1.gxl is loaded again, the graph
is display in all views again.
c) When the graph is closed, all the 3
views should display nothing. When
one view is closed, we would be left
with 2 windows (2 views).
When
graph1.gxl is loaded, the graph should
be display in both the windows remaining.
d) When all views are closed, the
program terminates.
a) Pass
b) Pass
c) Pass
d) Pass
noLayout
.gxl
a) Pass
b) Pass
Test Case 27:
a) Start the application and
load graphNoLayout.gxl.
b) Save graph into result.gxl. Load
result.gxl.
a) When graphNoLayout is loaded, a
layout will be generated for the nodes
automatically therefore arranging the
nodes in a visible pattern.
b) When result.gxl is loaded, the graph
with the generated layout will be
displayed.
Table 2: Black Box Testing Results
D
SCHEDULE LISTING
188
189
Activity
Requirements
Analysis
Start Date
10/27/2003
End Date
11/08/2003
Team Member
O.Halabieh, W.S.Tan
High-Level Design
11/10/2003
11/19/2003
All members
Extended Project Proposal
11/20/2003
12/1/2003
O.Halabieh, W.S.Tan
Proof Of Concept Version 1
11/20/2003
12/07/2003
N.Liu, L.Zhao
Proof Of Concept Version 2
12/15/2003
01/05/2004
O.Halabieh, W.S.Tan
Detailed Design
01/05/2004
01/15/2004
O.Halabieh, W.S.Tan
Implementation: Module Main,
Module DrawGraph, Module
View Manipulation, Module
View Data Structure
01/15/2004
01/21/2004
O.Halabieh, W.S.Tan
Implementation: Module DrawGraph
01/15/2004
01/21/2004
All members
Implementation: Module Graph
Data Structure
01/21/2004
01/28/2004
O.Halabieh, W.S.Tan
Implementation: Module Graph
Manipulation
02/01/2004
02/07/2004
O.Halabieh, W.S.Tan
Implementation: Module Collision
02/01/2004
03/01/2004
All members
Implementation: Module Graph
File Manager, Module Layout
02/07/2003
02/14/2004
O.Halabieh, W.S.Tan
Implementation: Module Undo
Data Structure, Module Settings
Data Structure, Module Settings
File Manager
02/15/2003
02/21/2004
O.Halabieh, W.S.Tan
White Box Testing
03/01/2004
03/07/2004
O.Halabieh, W.S.Tan
Black Box Testing
03/08/2004
03/22/2004
O.Halabieh, W.S.Tan
Final Report
03/23/2004
04/01/2004
O.Halabieh, W.S.Tan
Gathering
and
Table 3: Project Plan