1
Issues and Support for Dynamic Register Allocation
Technical Report
Department of Computer Science
and Engineering
University of Minnesota
4-192 EECS Building
200 Union Street SE
Minneapolis, MN 55455-0159 USA
TR 06-020
Issues and Support for Dynamic Register Allocation
Abhinav Das, Rao Fu, Antonia Zhai, and Wei-chung Hsu
June 21, 2006
Issues and Support for Dynamic Register
Allocation
Abhinav Das, Rao Fu, Antonia Zhai, and Wei-Chung Hsu
Department of Computer Science,
University of Minnesota
{adas, rfu, zhai, hsu}@cs.umn.edu
Abstract. Post-link and dynamic optimizations have become important
to achieve program performance. This is because, it is difficult to produce a single binary that fits all micro-architectures and provides good
performance for all inputs. A major challenge in post-link and dynamic
optimizations is the acquisition of registers for inserting optimization
code with the main program. We show that it is difficult to achieve
both correctness and transparency when only software schemes for acquiring registers are used. We then propose an architecture feature that
builds upon existing hardware for stacked register allocation on the Itanium processor. The hardware impact of this feature is minimal, while
simultaneously allowing post-link and dynamic optimization systems to
obtain registers for optimization in a “safe” manner, thus preserving the
transparency and improving the performance of these systems.
1
Introduction
Many reasons contribute to the need for post-link and dynamic optimizations.
Shared libraries, different behavior of programs on multiple inputs, phase behavior within and across inputs are all factors that reduce the impact of compile-time
optimization systems. Existing optimizations in applications may fail when the
underlying micro-architecture changes, and it is difficult for the software vendor to optimize an application differently for each micro-architecture. To deploy
optimizations at post-link or runtime, optimization systems need registers. Register acquisition, which in the context of post-link and dynamic optimization
broadly includes obtaining extra registers for optimization, is challenging due to
several reasons: (i) compiled binaries have already performed traditional register allocation that tried to maximize register usage; (ii) control and data flow
information that are necessary for performing register allocation, may not be
accurately known from analysis of binary. At runtime when code is seen incrementally, flow analysis is more restricted. Thus, there is no efficient software
solution for acquiring registers for post-link time optimization, and even more
so for dynamic optimization. Software support, such as compiler annotation, and
architecture/hardware support, such as dynamic stack register allocation, can
potentially ease post-link and runtime register acquisition. Register allocation,
traditionally, refers to allocating registers to frequently used variables or temporaries. Dynamic register allocation may be mistakenly regarded as register assignment at runtime. However, in the context of dynamic/post-link optimization,
dynamic register allocation means acquiring registers for generating optimized
code.
The requirements of register allocation for post-link and dynamic binary
optimization systems are different from traditional and dynamic compilation
models. Since register allocation has already been performed, such systems have
to make very conservative assumptions about register usage. Dynamic binary
optimization systems face the additional burden of finding registers with minimal runtime overhead, while post-link time optimization systems do not have a
time constraint since analysis is done offline. Traditionally, these systems rely on
binary analysis to find registers that are infrequently used. These registers are
freed for optimization by spilling them. For architectures that support variablesize register windows, these optimization systems increase the size of register
window to obtain registers. Unfortunately, these software-based schemes make
assumptions about code structure that can be easily broken.
Advances in VLSI technology has made it possible to put an increasing number of registers on a chip. Recent architectures support a large number of architectural registers and register windows that provide a window of accessible
physical registers. For example, SPARC[15] support fixed register windows and
IA64 supports variable register windows. Thus, a larger number of physical registers can be mapped to a smaller set of architectural registers. Such architectures,
stack register windows on top of each other just like a function’s activation stack.
As processors now support such features, the question is how to use these features for efficient and accurate register acquisition?
In this paper, we provide the first thorough treatment on register acquisition
for post-link and dynamic binary optimization systems and make the following
contributions:
– Survey existing register acquisition schemes in post-link time and dynamic
optimizers, such as Ispike[4] and ADORE[1][3] and elaborate on their limitations;
– Present an architecture feature that enables the use of variable-size register
window to dynamically obtain required registers.
We start by explaining the limitations of pre-allocating a fixed number of
registers for optimizations. Then we discuss, in some detail, existing approach
for dynamic register allocation, highlighting limitations and assumptions. We
then evaluate performance of an approach that does not have correctness issues
and show that it is very expensive to use it in a practical system. Finally, we
present the architecture feature for an existing architecture (IA64 [14]) to allow
easy use of variable register windows.
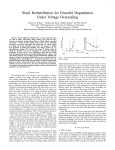
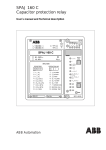
Fig. 1. Design space of register allocation schemes for post-link and dynamic optimization systems. Some schemes lie in the middle of hardware and software, implying that
they use a mix of both.
1.1
Design Space of Dynamic Register Allocation
Register allocation schemes mainly span two dimensions: the first dimension determines whether the register acquisition is done statically or dynamically, and
ranges from not-adaptable (static) to completely adaptable (dynamic). The second dimension describes how much hardware support is required for using the
scheme and varies from no hardware support (software) to only using hardware.
Figure 1 shows the scope of some register allocation schemes discussed in this
work. Register spilling is a completely software-based approach, but action is
taken dynamically. If a fixed number of registers are reserved by the compiler for
optimization, then the scheme is software-based and static. The register acquisition schemes used in ADORE and Ispike are a mix of hardware and software
and almost dynamic, but have limitations that affect its accuracy and efficiency.
Shadow register sets, as described in section 2, requires lesser software support
but it is not dynamic. Our proposed scheme (section 4, eliminates many of the
limitations present in existing acquisition schemes in ADORE. The categorization above, is shown just to give a rough sense of the design space of register
allocation and how the various schemes fit in this space. It is by no means a
complete listing of all possible schemes.
2
Fixed-number Register Allocation
In the context of this paper, static register allocation is defined as fixing the
number and location of registers used for optimization by post-link and dynamic binary optimizers. Registers can be allocated statically with help from
the compiler or from hardware. The compiler can be modified to not use certain general purpose registers, which can be later used by dynamic optimization
systems. Hardware can be implemented to allow use of certain registers only for
specific purposes. If the compiler is used for static register allocation, compiler
support must be available from compilers and some form of annotation must be
provided for the dynamic optimizer to differentiate between supported and unsupported binaries. Hardware can support a fixed number of registers (shadow
registers) for optimization. To prevent binaries from accessing these registers for
some other purpose, software conventions can be defined or these registers could
be made available in a special mode. This special mode can be triggered by executing a special branch, for example, or by going into a privileged mode (e.g.
kernel mode). Software conventions are readily broken and the optimizer must
conservatively assume that such conventions are not adhered to, to ensure correctness. Providing a special mode for register access to the optimizer presents
many challenges. The main question is how to access both the regular register
set and the shadow register set at the same time? If both sets can be accessed
at the same time, it is necessary to specify more bits to access both set of registers. If the selection between the regular set or the shadow set is made by the
mode, then it would be difficult to use this set since optimized code may need to
simultaneously access the regular and shadow register sets. Also, what prevents
regular software from running in this special mode to access more registers?
Another issue related to static register allocation is determining the number
of registers to allocate. This number cannot change dynamically and cannot be
an absurdly large value too. Statically allocating a fixed number of registers is
limited in the fact that once we run out of those registers, further optimization
cannot be done. To prove this point, Lu et al. in [2] showed that 179.art got
57% speed-up from reserving 5 registers. When the register reservation scheme
was changed to using alloc that could dynamically reserve required number of
registers the speed-up went up to 106% as reported in [3].
Modern microarchitectures are designed to have an increased collaboration
between hardware and software. The IA64 architecture is a good example of such
a design where compiler explicitly provides directives for program ILP, branch
prediction, data prefetching and the hardware provides support for runtime systems to further optimize the program by providing speculation, predication and
other features useful for runtime systems. The number of registers needed for
dynamic optimization depends on many factors including:
Architecture: CISC instruction sets, such as IA32, provide complex address
calculation that allows optimizations, such as data prefetching, to be deployed without needing extra registers. Processors with RISC instruction
sets usually require extra registers to calculate the address to be prefetched,
as memory access instruction do not support complex address calculation
Optimization Type: Some optimizations do not require registers. For example, redundant load elimination may not require extra registers. On the other
hand optimizations that perform speculative computation and/or prefetching may require extra registers.
Deployment Strategy: Previous work has identified two commonly used strategies to deploy optimized code. In-thread deployment, deploys optimization
code in the execution thread. This deployment strategy usually requires more
registers to allow optimization code to execute along with main execution
thread. Helper thread deployment, executes optimization code in a separate
thread of execution and thus has a register set independent of the main execution thread. Thus it demands lesser registers from the main execution
thread, although it may require a couple of registers for helper thread synchronization.
Thus, allocating registers statically has a performance impact that can reduce
the potential of binary optimization systems. Next, we present schemes already
employed by these systems for dynamic register allocation.
3
Software-based Dynamic Register Allocation
Post-link optimizers (e.g.Ispike [4]) and dynamic binary optimizers (e.g. ADORE
[1]) use software schemes to find registers for optimizations. In general, these
systems optimize a subset of program code, determined as frequently executing
code using execution profiling. The area of code is often referred to as a trace,
which is a single-entry multiple-exit region. Below we give brief description of
each scheme and follow it up with limitations of that scheme.
3.1
Register Spilling
Registers used for dynamic optimizations can be obtained by first scanning the
optimized trace to find unused registers, then spilling these registers upon entering that trace and restoring these registers upon exiting the trace. If the register
is used in the trace, then spill/restore code can be inserted at every definition/use
of the register. The main challenge in register spilling is where to spill registers.
Stack can be used to spill registers, but the binary may be spilling registers temporarily on the stack without modifying the stack pointer. This value would be
overwritten by the spilled register value. If the original value at that location is
used after trace exits, program may run incorrectly. A chunk of memory can be
reserved for register spilling, but usually a register itself is needed to point to this
memory location making spilling difficult. Multi-threaded applications pose an
additional challenge to spilling. For multi-threaded applications, registers must
be spilled in a thread-private area of memory. Program heap is thread-shared
and spilling on the heap can cause problems with multiple threads spilling registers to the same area of the heap. Thus, spilling on the stack has the advantage
of being multi-thread safe.
Spilling registers does not preserve original architectural state. If an exception
happens during trace execution and the exception handler uses the value of a
register spilled in the trace to trigger recovery or to report results, incorrect
execution may occur or the error output may not make sense. To overcome
this problem, we may treat exceptions as trace exits and catch them. For this
we need to know the exception handlers registered by the program before-hand.
However, the program may register an exception handler at runtime. So, we need
to intercept the function that registers exception handlers. We can see that the
problem cascades, requiring a lot of programming language and operating system
specific handling. The cost of spilling is another factor that must be considered.
If spill/restore code is only at trace entry and exit, then spilling may not be
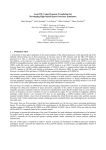
Fig. 2. State of register windows for fixed and variable size windows. The thick-lined
boxes show the window moving over the physical registers. For the variable size windows, the boxes show the changing size after function call and allocation instruction.
too expensive. However, if trace uses all registers then some spill/restore code
would have to be inserted in the trace itself. This can increase the optimization
cost substantially. Spilling cost can be minimized if we find free registers. Free
registers are registers that are either not used during trace execution and after
trace exit, or are defined after trace exit before being used. Post-link optimizers
can look for free registers as they have more information (viz. function boundary
information) than dynamic binary optimizers. At runtime, without some form
of annotation information, function boundaries may not be known, limiting free
register analysis.
3.2
Dynamically Increase Variable Register Window Size
Modern microprocessors have many physical registers and a portion of those registers are accessed via register windows. SPARC provides fixed register windows,
where a fixed-size window moves over the physical registers. IA64 architecture
supports variable size windows, where the program can dynamically increase or
decrease the size of this window to suit the register requirements of code. These
mechanisms are called stacked register windows, as each function usually stacks
its register window on top of its caller’s register window. Fixed-size register windows may be used for allocating more registers dynamically, but the current
register state is lost as allocating a new frame moves the fixed window out of the
current state to allocate more registers. In SPARC, the save instruction can be
used to allocate a new register frame on trace entry, but the trace code would not
be able to access values from the old register state. In this section, we focus on
variable size register windows on the IA64 architecture, as this scheme supports
dynamic register allocation well.
Stacked Register Windows on IA64: Register windows are specified in
IA64 using the alloc instruction. This instruction specifies the number of input,
local and output registers for each function. The Itanium processor (which is
an implementation of the IA64 architecture) automatically moves the register
Fig. 3. Mechanism of dynamic register allocation using alloc instruction on the IA64
architecture
window on a function call. This is done by moving the register window so that
the output registers of the caller become the input register of the callee. The
callee can then specify its own register usage with an alloc instruction. The
hardware does not differentiate between inputs and locals. The alloc instruction
thus needs to specify size of frame (sof) and size of locals (sol). The output size
is calculated as sof-sol. A third field called sor is used for specifying the number
of local registers used as rotating registers. This is useful in software pipelining
and is not important for our discussion. Figure 2 shows mechanism of register
windows for fixed and variable size windows.
Dynamic Register Allocation on Itanium: Dynamic register windows on
the Itanium processor can be used to allocate more registers post-link or at
runtime. This works by increasing the size of the register frame in the function
that is to be optimized. Assuming that we can find this alloc instruction, another
alloc instruction is inserted before entry into optimized code that increases the
size of frame value in the alloc instruction. Figure 3 shows how extra output
registers are dynamically allocated for optimization. By increasing the size of
frame from 20 to 23, 3 more output registers are obtained that can be used for
optimization.
However, there are some limitations to this approach. The first question is
how to find the right alloc instruction? Scanning the binary may lead to detection
of an incorrect alloc instruction due to compiler optimizations, such as function
splitting. Aggressive compilers use multiple allocs to allocate different number
of registers down different paths. The presence of multiple allocs may mislead
code scanning in finding the correct alloc. Leaf routines may not have an alloc
instruction at all (i.e. they use registers from the caller’s output frame and static
registers r0 to r31). The problem of optimizing leaf routines is best explained
Fig. 4. The output context of different callers gets mapped to local context of the
called leaf routine. In this example, optimization code would use registers starting at
r35 or r39 depending on calling context.
using Figure 4. In the example shown in the figure, when procedure A calls leaf
routine L, 3 output registers are mapped to the local context of procedure L.
Optimization code can thus only use registers starting from r35. When procedure
B calls L, 7 output registers get mapped to the local context forcing optimization
code to use registers starting at r39. If the trace was generated at the time when
A called L, it would have to be regenerated when B called L. In general, at
every trace entry we would have to check the state of register stack and possibly
regenerate trace. The above argument assumes that we can find the state of
current register stack using some methodology. This is possible using a software
scheme, which is discussed later.
So, a dynamic mechanism is needed to find the state of the current register
stack. This state information is encoded in an architecturally invisible register
called current frame marker (CFM). On a function call contents of this register are copied to an architecturally visible application register called previous
function state (ar.pfs). To determine the register stack state dynamically, we
can inject a function call just before trace entry. The injected function call then
reads the ar.pfm register and passes this value to the dynamic optimizer. To
inject a function call we need to address the following questions:
How do we inject a function call? We can insert a regular function call but
to do this we need a branch register that stores the return address. This
is infeasible as we do not know which branch registers are available. The
other option is to insert an illegal instruction and catch the signal (SIGILL)
generated. In the signal handler we can read the ar.pfs.
What is the register frame of the injected function? The injected function needs to use registers and must have an alloc instruction. As the output
registers of the caller get mapped to the input registers of the callee, the
injected procedure must be careful not to dirty those registers. But we do
not know at the time of injected function call the state of caller’s register
state. There is a workaround to this problem that uses a convention in the
Itanium ABI to insert an alloc in the injected procedure. The Itanium ABI
injected_procedure:
alloc r40=ar.pfs,12,12,0;;
adds r41=(number of registers needed),r40
// check for overflow of 7 bits
...
// build alloc instruction from r41 fields and put at trace entry
...
br.ret.sptk.many b0;;
Fig. 5. Pseudo-assembly code showing how to read previous frame state and insert
correct alloc at the beginning of trace
Fig. 6. Size of frames for SPEC2000 benchmarks compiled using GCC 3.3 with O2
optimization level and Intel C compiler v9 with FDO and IPO optimizations.
states that a maximum of 8 output registers can be used on the register
stack. The rest have to be passed through memory. So we are assured that
in our injected procedure, registers r40 onwards will be available for use.
This would work only if the binary follows convention which is a reasonable
(although not infallible) assumption.
Pseudo-assembly code sequence for determining and generating a new alloc
is shown in Figure 5. It assumes that software follows convention and uses a
maximum of 8 output registers. Before we analyze the overhead of detecting
register states we need to determine if binaries use up entire stacked registers
(96 in the case of Itanium). Also increasing the register frame comes at the cost
of implicit register spilling that happens in hardware when physical registers are
used up. The next section details these issues.
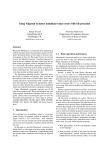
Register Availability: Figure 6 shows the mean and mode of the number
of stacked registers allocated by functions for binaries compiled using GCC 3.3
(O2 optimization) and Intel C Compiler v9 (base optimization), respectively. We
use these binaries to illustrate register usage for different compilers at different
optimization levels. On the Itanium-2 processor, a maximum of 96 stack registers
can be allocated. The mean of stacked registers used for GCC compiled binaries is
less than 30 for all benchmarks shown in the figure. When binaries are compiled
with Intel’s compiler that performs more aggressive optimizations, the mean
of stacked registers went up. Even then, other than a few benchmarks (e.g.
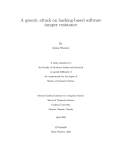
Fig. 7. Back-end stall due to increased register pressure from allocating registers. First
bar is original, second and third bars are for allocating 4 and 8 more registers respectively.
Table 1. Trace entry data for GCC3.3 compiled binaries. Binaries are compiled with O2 optimization level. Benchmark data is shown for select benchmarks for which traces
were output by ADORE.
Benchmark
164.gzip
168.wupwise
171.swim
172.mgrid
173.applu
175.vpr
179.art
181.mcf
188.ammp
200.sixtrack
256.bzip2
Nentries
323,555,567
2,915,585,286
4,266,132
77,876,000
3,757,885,564
539,408,237
210,632
249,333,985
1,161,460,365
1,345,868,139
1,389,313,709
Nents no alloc Nchg reg Tovh
Trun
%Overhead
12,723,812
0
36.76
78.84
46.62%
2,915,585,286
608 8563.06 731.66
1170.36%
4,266,132
0
12.32 1096.43
1.12%
77,876,000
21,049 5080.77 1127.8
450.50%
3,757,885,564
2,105 11341.72 939.36
1207.39%
336,995,314
5
974.7 171.85
567.19%
210,632
0
0.61
322.8
0.19%
249,333,985
0
720.3
696
103.49%
1,161,460,365
8,276 5264.52 702.09
749.84%
1,341,099,446
45,798 14439.43 1253.81
1151.64%
679,834,260
0 1963.97 128.75
1525.38%
175.vpr, 186.crafty, 200.sixtrack, 255.vortex and 300.twolf), functions in most
other benchmarks use an average of less than 30 stack registers. Thus, increasing
the size of frame is not architecturally limited, as most functions do not use up
the set of architecturally available registers.
However, if we want to use these registers there is a second level overhead of
register spills in hardware. We measured the number of stall cycles for allocating
4, 8 and 16 more registers for each procedure. Figure 7 shows that the cost of this
in terms of stall cycles is almost 0% of execution time for most benchmarks and
for those benchmarks that already show some overhead from register spilling, the
overhead of extra spilling is not a significant percentage. Thus, even an extreme
measure such as increasing the register frame of each function by a fixed number,
does not cause significant register spilling overhead.
Overhead of Finding Register State: As described in previous sections,
a trace can be reached from different register frame states. Table 1 shows data
for traces selected by ADORE on the Itanium-2 platform. The data is collected
only for a few hot traces collected by ADORE. Since ADORE builds traces for
Table 2. Trace entry data for Intel C Compiler (ICC) version 9 compiled binaries.
Binaries are compiled with base optimization level.
Benchmark Nentries
Nents no alloc Nchg
164.gzip
298,173,811
298,173,811
168.wupwise
4,864,984
4,864,984
175.vpr
270,314,053
270,314,053
179.art
230,225
230,225
181.mcf
249,025,240
249,025,240
183.equake
117,019,638
117,019,638
188.ammp
971,358,763
971,358,763
256.bzip2
319,228,575
537,892,771
301.apsi
1,056,880,693 1,112,672,373
178.galgel
158,115,642
158,115,642
187.facerec
163,315,160
413,116,597
reg
0
0
0
0
0
0
0
0
0
0
0
Tovh
861.39
14.05
780.91
0.67
719.41
338.06
2806.15
1553.91
3214.39
456.78
1193.45
Trun %Overhead
48.14
1789.36%
74.3
18.92%
142.7
547.24%
18.63
3.57%
494.01
145.63%
61.19
552.50%
303.74
923.87%
239.9
647.73%
415.93
772.82%
112.34
406.62%
173.04
689.71%
a small amount of code, the numbers can be much bigger if more traces are
selected. Nentries counts the total number of trace entries for all traces collected
for the set of benchmarks shown. Sometimes, traces happen to have an alloc
instruction at the beginning of the trace. For such traces, we do not have to
worry about finding the correct alloc as the correct alloc is the first instruction
in the trace. Nents no alloc counts the number of trace entries into traces that
do not start with an alloc instruction. Since the register state can be different
on every trace entry, this count represents the number of times a check must
be done to ensure that the state is the same as previously seen. Nchg reg counts
the number of times a register state is seen for traces that is not the same
as the previous state. Traces with an alloc at the beginning of the trace are
ignored in this count as they will always have a consistent state within the
trace irrespective of the state that reached those traces. The overhead Tovh is
computed as Tovh = Nents no alloc ∗Tf ind state +Nchg reg ∗Ttrace gen . We found by
experimentation that the average time to find current register state by inserting
illegal instruction (Tf ind state ) is 2600 cycles1 and average time to build traces
(Ttrace gen ) is 0.23 seconds.
We can see from the table that only a small number of register state changes
are seen for GCC compiled binaries. State changes usually occur when traces
within a function are called from different functions and the called function does
not have an alloc instruction. However, the cost of checking register state is very
high as the number of trace entries is large. Table 2 shows trace statistics similar
to table 1 but for binaries compiled with ICC version 9 compiler. ICC is a more
aggressive compiler and we used more aggressive optimization level, resulting
in inlining and other optimizations to be applied. We can see from the table
that checking for trace state changes is still very expensive, but the number of
state changes is 0 for all benchmarks shown. Aggressive inlining, causes small
procedures to be inlined and specialized for call site. So, the case of a function
1
If we find the register state by making a direct function call at the start of the trace
the overhead is about 15 cycles, but this method has limitations as was previously
discussed.
Fig. 8. Main idea of dynamic register allocation
without alloc being called is not observed for traces collected by ADORE. We
did not observe the case of multiple allocs within a function reaching the trace
but this may be observed if we relax trace collection heuristics to include more
traces.
4
Architecture Support
In light of the limitations observed in allocating registers using software-only
schemes, we started investigating a hardware enhancement that would allow
easy acquisition of dynamic registers. Since the main limitation of existing support is the absence of fast access to current register state information, an easy
architecture extension is to expose the CFM register and thus providing the current state information. Doing so, reduces the overhead of finding current state,
but does not reduce the overhead of determing if the state is the same as when
the trace is generated. If the state has changed, traces need to be regenerated
that can result in substantial overhead. With this limitation in mind, we seek
architecture features that are free from the above limitations and yet provide
a fast and easy way to obtain additional registers. The main goal is to propose architecture support that leverages existing hardware implementation with
minimum changes to existing ISA and underlying hardware.
4.1
Main Idea
The main requirements of allocating registers dynamically is a scheme that uses
relative addressing to access registers. If we use fixed method to access registers
compilers can use those registers and we will have no guarantee of using those
registers post-compilation. A disadvantage of fixed register schemes is that optimizations cannot be stacked onto one another. For example, if the hardware
provides some number of registers for exclusive use of post-link and runtime optimizations (e.g. shadow registers) and the post-link optimizer uses all shadow
registers, a runtime optimizer may not be able to optimize the program for lack
of registers. A scheme that can allocate registers on top of existing allocation is
better suited to runtime optimization, or in general, incremental post-link optimization. Figure 8 shows the main idea of this approach. In this figure a new
instruction can allocate some number of registers from available architectural
registers by only specifying the number of registers needed rather than specifying complete frame information (as is needed in the current implementation of
alloc instruction). The other aspect shown in the figure is the access mechanism
for these registers. Registers are accessed relative to the Top of Register Stack
(ToRS).
Let us consider some cases and explain how dynamic register allocation will
work with such a mechanism even if the compiler uses this scheme for allocating registers. Suppose that post-link, we want to optimize a loop that already
addresses some registers using the top of register stack. Let us assume that optimization requires 2 dynamic registers. We can use a new instruction to increment
the size of frame by 2 and adjust the relative offset of instructions already using relative addressing by 2. Note that only those instructions that are in the
trace need to be modified, as we would return the state of register frame to its
original state upon trace exit. We need another instruction for that too. A stack
based approach coupled with relative addressing can thus be effectively used for
dynamic register allocation.
4.2
Relative Addressing
In this section, we will discuss implementation details of the relative addressing
scheme proposed. There are 128 registers in the IA64 ISA and a 7-bit field is
used to address these registers. In the simplest form, a bit can be added to each
7-bit register entry that distinguishes regular accesses from relative access. To do
this we would have to add an extra bit for each register field thereby increasing
the instruction width from 41 bits to 44 bits as there can be a maximum of 3
register fields in an instruction. If we followed this approach, the 8th bit when
set would indicate relative addressing and the 7 bit value would be used as an
offset from top of register stack to access registers. Acessing registers beyond the
scope of current register frame would generate the same errors as regular mode
access beyond the frame would have generated. However, we can use a clever
trick to ensure that registers address field is not increased. In this scheme, the
7-bit field is used to access 64 registers and the 7th bit is used to distinguish
between regular access and relative access. Since we are left with only 6 bits for
indexing into registers, let us discuss how 128 registers can be accessed using
this addressing scheme.
Case 1: Number of Registers allocated by compiler ≤ 64: In this case
(Figure 9) all registers can be accessed by both relative and regular access. The
number of registers including both static and on the stack total to less than 64.
Thus they can be accessed by both modes as the size of field is 6 bits. For regular
access the 7th bit is set to zero. If the compiler wants to use relative accessing
it is free to do so. In the example shown, 20 stack registers are allocated along
Fig. 9. Case example showing stack allocation of 20 registers highlighting the case
where total number of registers accessed is less than 64
Fig. 10. Example with 80 registers are allocated on the stack highlighting the case
where total number of registers accessed is greater than 64
with 32 static registers. Register r51 is the last allocated register which can be
accessed as r51 or as ToRS[-1] as the ToRS points to r52. The compiler should
encode this field as 10000002 .
Case 2: Number of Registers allocated by compiler > 64: This case
shown in Figure 10 is slightly more complicated as the total number of allocated
registers exceeds 64. So, in the example shown in the figure the compiler has to
use regular mode for registers r0 to r47. Registers r48 to r63 can be accessed
using regular mode and ToRS mode (ToRS[-64] to ToRS[-49] respectively) and
registers r64 onwards have to be accessed using relative addressing (ToRS[-48]
onwards).
Thus, the addressing mode is implemented such that the width of register
field remains the same. In the extreme case when all 128 registers are allocated,
r0 to r63 are accessed using regular mode and r64 to r127 are accessed using
ToRS[-64] to ToRS[-1], respectively. Since, some registers can be accessed by
both the modes, we must be careful when we increase the size of register frame
as it may so happen that some register that was accessed using ToRS mode, now
has to be accessed via direct mode. As an example, let the initial frame have 64
stack registers and the first register r32 is accessed using ToRS mode. If the size
inc_alloc imm7
imm7 - a 7-bit immediate field used to specify the amount to increment the frame by
Operation:
if(cfm.sof+imm7) > 96 then Illegal_operation_fault() else cfm.sof += imm7
dec_alloc imm7
imm7 - a 7-bit immediate field used to specify the amount to decrement the frame by
Operation:
if(cfm.sof-imm7) < 0 then Illegal_operation_fault() else cfm.sof -= imm7
Fig. 11. Instruction format for inc alloc and dec alloc instructions
of frame is increased by, say, 5 registers, then the access of this register would
have to converted into direct mode. Since this involves knowing the current frame
state, post-link and dynamic optimizers can choose not to optimize code where
such conditions exist.
Since a register access on Itanium already performs an indexing operation
to access the correct physical register, we believe our implementation does not
add to the hardware cost. To reduce the cost of subtracting the offset, the top
of register stack can be maintained as part of the current frame in the CFM
register.
4.3
New Instructions
Some new instructions must be added to manage dynamic register stack in a way
which is slightly different from the alloc instruction. The aim again is to leverage
existing hardware. We add two new instructions for increasing and decreasing
the register stack. The first instruction is inc alloc that increments the current
register frame by a number specified in the instruction and the second instruction
is dec alloc that decrements the sof value in cfm. The format and operation of
these instructions are shown in Figure 11.
4.4
Known Limitations
In this section, we address the limitations of this approach and show how they can
be circumvented. The first limitation stems from the fact that we are increasing
the output frame. At the time of a function call, these output registers get
mapped to inputs and subsequently may be overwritten by local variables within
the called function. On return from the function call, the extra output registers
could be dirty. Thus, these registers cannot be live across function calls. If data
in these registers must be kept live across function calls, then it must be spilled
to some place in the memory. To avoid this, we can increases the size of frame
and the size of locals so that the size of output remains the same. However,
this would involve shifting the references to output registers by the number
of dynamically allocated registers. Also on trace exit, when the register state
returns to its original state shifted register’s values have to be copied to original
registers increasing the overhead of trace entry and exit.
The other limitation is imposed from the convention that a maximum of 8
output registers can be used. We noticed that some system calls failed when the
size of output was greater than 8. However the fix is simple. A system call (i.e.
a break instruction) should be treated as a trace exit and original register state
should be restored before system call. In general, any called function may use
the value of ar.pfs to perform some computation. If we keep the size of frame
different from the original context, the program may execute abnormally. Thus
we should treat function calls as trace exit and return to original register context.
There is a compatibility issue when binaries compiled for the original IA64
architecture execute on the newer architecture. The binary may be accessing
registers beyond 64 and would have a ‘1’ in the most significant bit of the 7-bit
field. The new architecture will consider this access as ToRS access and access
possibly different register. As an example, consider access to register r64 when
the size of frame extends up to r70. The new architecture will interpret this as
access to r70 as the 7th bit of register field would be set.
5
Related Work
Dynamic binary translation poses interesting and similar challenges to register allocation. Register allocation in translation involves mapping source (i.e.
the binary to be translated) registers to the target (i.e. the host) machine’s
registers. Shade[8][9] is a dynamic translation and tracing tool for the SPARC
platform. It translates SPARC (v8 and v9) and MIPS 1 instructions for SPARC
v8 systems. Thus is performs cross-architecture and native translation. For native translation, the virtual and the actual number of registers are the same.
Since some registers are needed by SHADE, registers in the translated program
are remapped to different physical registers and registers are spilled lazily. PIN
[12] is a instrumentation tool for 4 architectures IA32, EM64T, IA64 and ARM.
It performs native translation for each of these architectures and does register
re-allocation and liveness analysis. PIN builds register liveness incrementally as
it sees more code. When traces are linked, PIN tries to keep a virtual register in
the same physical register whenever possible. If this is not possible it reconciles
differences in mapping by copying registers through memory before jumping to
another trace. Probst et al. [7] discuss a technique for building register liveness
information incrementally for dynamic translation systems.
Post-link optimizers such as SPIKE[5] and Ispike[4] optimize binaries by analyzing profile information. SPIKE needs registers for inserting instrumentation
code. It uses register usage information collected by scanning the binary to find
free registers, so that register spills can be minimized. Ispike collects profile from
hardware counters on the Itanium platform and thus it does not require registers
for collecting profile. However, one of the optimization used is data prefetching
is data prefetching that requires registers. Ispike uses either free registers by
liveness analysis, increments register stack (by looking for alloc instruction) or
uses post-increment/decrement in prefetch and load operations.
Dynamic optimizers can be similar to dynamic translators if they use translation to build traces to be optimized. Dynamo [10] is a dynamic optimizer for
PA-RISC binaries. When emitting traces to be optimized, Dynamo tries to create
a 1-1 mapping between virtual and physical registers. For registers that cannot
be mapped, it uses the application context stored in the translator to store the
physical registers. DynamoRIO [11] is a system based on Dynamo for x86 systems. ADORE [1][2][3] as described earlier use alloc instruction or spill registers
to obtain registers for optimization. Saxena in [13] describes various issues of
register allocation for the ADORE systems and presents data for finding dead
registers in trace.
6
Conclusion
Register allocation for post-link and dynamic optimization systems poses interesting challenges as correctness, overhead and transparency are important
concerns. In this paper, we have reviewed register acquisition schemes for these
systems. We have shown that, without proper support, ensuring correctness is
difficult and the only safe way of obtaining registers using existing hardware
and software support incurs heavy overhead, as much as 1789% on an existing
IA64-based system. Existing system use heuristics to avoid correctness issues
but there is no guarantee of correctness.
We have presented a modest hardware support to the IA64 architecture, as an
example, to illustrate how such a feature would simplify dynamic register acquisition. The proposed hardware support ensures correct execution while requiring
no performance overheard and complete transparency. When multiple post-link
and dynamic optimizations are present, the proposed hardware allows optimization systems to stack their optimizations on top of each other. The architecture
feature described leverages existing hardware on the Itanium processor, thus
will likely be feasible. We believe that given the performance delivered by postlink and dynamic optimization, it will be cost-effective to devote more hardware
resources for this purpose.
References
1. Lu, J., Das, A., Hsu, W-C., Nguyen, K., Abraham, S.: Dynamic Helper-threaded
Prefetching for Sun UltraSPARC Processors. MICRO 2005.
2. Jiwei Lu, Howard Chen, Rao Fu, Wei-Chung Hsu, Bobbie Othmer, Pen-Chung Yew:
The Performance of Runtime Data Cache Prefetching in a Dynamic Optimization
System. MICRO 2003.
3. Jiwei Lu, Howard Chen, Pen-Chung Yew, Wei Chung Hsu: Design and Implementation of a Lightweight Dynamic Optimization System. Journal of Instruction-Level
Parallelism, Volume 6, 2004
4. Chi-Keung Luk, Robert Muth, Harish Patil, Robert Cohn, Geoff Lowney: Ispike: A
Post-link Optimizer for the IntelItaniumArchitecture. CGO, 2004.
5. R. Cohn, D. Goodwin, P. G. Lowney and N. Rubin: Spike: An Optimizer for Alpha/NT Executables. Proc. USENIX Windows NT Workshop, Aug. 1997.
6. David W. Goodwin: Interprocedural dataflow analysis in an executable optimizer.
PLDI, 1997
7. M. Probst, A. Krall, B. Scholz: Register Liveness Analysis for Optimizing Dynamic
Binary Translation. Ninth Working Conference on Reverse Engineering (WCRE’02),
2002.
8. Cmelik, B. and Keppel, D. 1994: Shade: a fast instruction-set simulator for execution
profiling. SIGMETRICS Perform. Eval. Rev. 22, 1 (May. 1994), 128-137.
9. Robert F. Cmelik and David Keppel: Shade: A fast instruction-set simulator for
execution profiling. Technical Report 93-06-06, CS&E, University of Washington,
June 1993
10. Bala, V., Duesterwald, E., and Banerjia, S: Dynamo: a transparent dynamic optimization system. PLDI, 2000.
11. Bruening, D., Garnett, T., and Amarasinghe, S: An infrastructure for adaptive
dynamic optimization. CGO, 2003.
12. Luk, C.-K., Cohn, R., Muth, R., Patil, H., Klauser, A., Lowney, G., Wallace, S.,
Reddi, V. J., Hazelwood, K.: Pin: Building Customized Program Analysis Tools
with Dynamic Instrumentation. PLDI, June 2005.
13. Saxena, A., Hsu, W.-C.,: Dynamic Register Allocation for ADORE Runtime Optimization System. Technical Report 04-044, Computer Science, University of Minnesota, 2004
14. Intel®Itanium®Architecture, Software Developer’s Manual, Volume 1, 2 and 3:
http://www.intel.com/design/itanium/manuals/iiasdmanual.htm.
15. UltraSPARCIII Processor User’s Manual: http://www.sun.com/processors/manuals/USIIIv2.pdf