1
Faculty of Engineering of the University of Porto
Integrated Master in Informatics and Computation Engineering
CMMI Metrics Solution at
Qimonda Portugal S.A.
MIEIC 2008 Internship Report
André Filipe Lourenço Lessa
Supervisor at FEUP: Prof. João Pascoal Faria
Supervisor at Qimonda: Eng. Teresa Carreiro
February 2008
Abstract
This report describes the internship project developed by André Filipe Lourenço Lessa on
Qimonda Portugal S.A.
Porto Development Center is the unit responsible for developing software solutions to the
world-wide semiconductor manufacturing facilities of Qimonda. Solutions developed in
Portugal are installed and running productively in non-stop production facilities, covering a
wide range of manufacturing areas in several different technological areas.
The Porto Development Center adopted a Quality Management System aiming the fulfillment
of the Software Engineering Institute CMMI model goals. Every year, more than 40 projects
involving over 100 software engineers, follow the quality management processes defined.
CMMI is on the leading edge of software methodologies, with an extremely fast adoption in
all world-wide software industries. One key process area of CMMI is the Measurement
Analysis. The main goal is to, based on the business objectives, define indicators and metrics
to assess their fulfillment. In CMMI terms, it is also one enabler of higher maturity levels,
particularly the ones requiring quantitative management.
The goal of this internship was then to define, design, build and deploy a software solution,
integrated in the platform that manages the CMMI processes, that stores process metrics and
indicators.
ii
Acknowledgements
I would like to thank Raul Vidal for his determination in arranging the best possible
internship experience for the MIEIC students, and also Francisco Lobo for providing me the
opportunity of performing my internship at Qimonda.
My two supervisors were very important during the project. Teresa Carreiro with the guidance
provided and João Pascoal Faria with the expertise and support given. The success of this
project has to be shared with Hugo Magalhães because of his precious orientation and help.
I would also like to thank everyone at Qimonda who in any way contributed to this project’s
success, either by providing training, clearing some doubts or even giving feedback and
suggestions which allowed me to better adapt it to Qimonda’s and user’s needs. A special part
of it goes to the Quality Management team, who support me throughout the project and
provided a great enviromenment to work in.
At last, I would like to thank to my family and friends for the support in my choices and the
strenght given to pursuit my objectives.
iii
Contents
1 Introduction..........................................................................................................................................1
1.1 Qimonda Presentation.......................................................................................................................... 1
1.2 Porto DC at Qimonda ........................................................................................................................... 2
1.3 CMMI Overview.................................................................................................................................... 3
1.3.1
CMMI Measurement and Analysis Process Area............................................................... 4
1.4 CMMI Metrics Solution at Qimonda...................................................................................................... 4
1.5 Document Structure ............................................................................................................................. 5
2 Objectives............................................................................................................................................6
2.1 Context................................................................................................................................................. 6
2.2 Problem................................................................................................................................................ 7
2.3 Main Goals ........................................................................................................................................... 8
2.4 Planning ............................................................................................................................................... 9
3 Technological Review .......................................................................................................................11
3.1 Existing Systems ................................................................................................................................ 11
3.1.1
TIBCO Rendezvous ......................................................................................................... 11
3.1.2
YODA............................................................................................................................... 11
3.1.3
Microsoft Project .............................................................................................................. 12
3.1.4
Event Viewer.................................................................................................................... 12
3.2 Math Parser Tool................................................................................................................................ 12
3.2.1
Tools Evaluated ............................................................................................................... 13
3.2.2
Conclusions ..................................................................................................................... 14
3.3 Charting Tool...................................................................................................................................... 14
3.3.1
Tools Evaluated ............................................................................................................... 14
3.3.2
Conclusions ..................................................................................................................... 15
3.4 Other Technologies ............................................................................................................................ 15
3.4.1
.NET Framework 2.0........................................................................................................ 15
3.4.2
ASP.NET AJAX ............................................................................................................... 15
3.4.3
Excel Interop Assembly ................................................................................................... 16
3.4.4
Regex .............................................................................................................................. 16
3.4.5
Selenium.......................................................................................................................... 16
3.4.6
Firebug............................................................................................................................. 17
4 Specification ......................................................................................................................................18
4.1 Requirements..................................................................................................................................... 18
4.1.1
Functional Requirements ................................................................................................. 18
4.1.2
Non-functional Requirements .......................................................................................... 26
4.1.3
Technological Requirements ........................................................................................... 27
4.2 Conceptual Model .............................................................................................................................. 27
5 Implementation..................................................................................................................................28
5.1 Architecture ........................................................................................................................................ 28
5.1.1
Logical Architecture ......................................................................................................... 28
5.1.2
Physical Architecture ....................................................................................................... 30
5.2 Data Layer.......................................................................................................................................... 31
iv
5.2.1
Database ......................................................................................................................... 31
5.2.2
Data Access Class and Methods ..................................................................................... 35
5.3 Business Logic Layer ......................................................................................................................... 36
5.3.1
Object Classes................................................................................................................. 36
5.3.2
Excel Import..................................................................................................................... 40
5.3.3
Project Server Import ....................................................................................................... 41
5.3.4
Math Parser ..................................................................................................................... 42
5.3.5
ZedGraph......................................................................................................................... 46
5.3.6
Windows Service ............................................................................................................. 46
5.4 User Interface..................................................................................................................................... 48
5.4.1
Metrics Area..................................................................................................................... 48
5.4.2
Data Lists Area ................................................................................................................ 51
5.4.3
Admin Area ...................................................................................................................... 54
5.4.4
Data Validation ................................................................................................................ 62
6 Results Evaluation.............................................................................................................................63
6.1 Data Access ....................................................................................................................................... 63
6.2 Business Logic ................................................................................................................................... 63
6.3 User Interface..................................................................................................................................... 63
7 Evolution............................................................................................................................................66
7.1 Enhancements ................................................................................................................................... 66
7.2 Extensibility ........................................................................................................................................ 66
7.3 Future Work ....................................................................................................................................... 66
8 Conclusions.......................................................................................................................................68
8.1 Project ................................................................................................................................................ 68
8.2 Internship ........................................................................................................................................... 68
Bibliography............................................................................................................................................70
Glossary .................................................................................................................................................72
Appendix A:
Math Parser Syntax ......................................................................................................74
Appendix B:
Regular Expression Syntax ..........................................................................................76
v
List of Figures
Figure 1-1
Qimonda worldwide ....................................................................................................... 1
Figure 1-2
Qimonda production facilities in Porto ........................................................................... 2
Figure 1-3
Porto DC organization chart .......................................................................................... 3
Figure 2-1
QMS Processes Organization ....................................................................................... 6
Figure 2-2
Measurement and Analysis Process ............................................................................. 7
Figure 2-3
Internship plan Gantt diagram ..................................................................................... 10
Figure 3-1
YODA Architecture ...................................................................................................... 12
Figure 4-1
CMMI Metrics Solution use case diagram ................................................................... 19
Figure 4-2
Metrics Area use case diagram ................................................................................... 20
Figure 4-3
Data Lists Area use case diagram............................................................................... 21
Figure 4-4
Manage Metrics use case diagram.............................................................................. 22
Figure 4-5
Scopes and Entities Organization ............................................................................... 22
Figure 4-6
Manage Scopes use case diagram ............................................................................. 23
Figure 4-7
Manage Scope Entities Area use case diagram ......................................................... 24
Figure 4-8
Manage Lists Area use case diagram ......................................................................... 24
Figure 4-9
Manage Forms Area use case diagram ...................................................................... 25
Figure 4-10
Manage Targets Area use case diagram .................................................................... 26
Figure 4-11
Conceptual model........................................................................................................ 27
Figure 5-1
Logical Architecture ..................................................................................................... 29
Figure 5-2
Physical Architecture ................................................................................................... 30
Figure 5-3
Database model........................................................................................................... 32
Figure 5-4
Methods of the DataBase class................................................................................... 35
Figure 5-5
Scope class Properties ................................................................................................ 36
Figure 5-6
Scope Entity class Properties...................................................................................... 37
Figure 5-7
Metric class Methods and Properties .......................................................................... 37
Figure 5-8
ListData class Properties ............................................................................................. 38
Figure 5-9
Source class Properties.............................................................................................. 38
Figure 5-10
Measure class Properties ............................................................................................ 39
Figure 5-11
Target class Properties................................................................................................ 40
Figure 5-12
Target Entity Pair class Properties .............................................................................. 40
Figure 5-13
Data validation example .............................................................................................. 41
Figure 5-14
Querying the service GetReleases.............................................................................. 42
Figure 5-15
Dataset returned by the service................................................................................... 42
vi
Figure 5-16
Math Parser Classes and Methods ............................................................................. 43
Figure 5-17
Regular expression result ............................................................................................ 45
Figure 5-18
Formula help page....................................................................................................... 45
Figure 5-19
Timer Service Class Methods...................................................................................... 46
Figure 5-20
Service Installer Class ................................................................................................. 47
Figure 5-21
Event Viewer Logs....................................................................................................... 47
Figure 5-22
Targets Page (Application Start Page) ........................................................................ 48
Figure 5-23
Metrics Main Page ....................................................................................................... 49
Figure 5-24
Results viewed by metric ............................................................................................. 50
Figure 5-25
Chart page ................................................................................................................... 51
Figure 5-26
Upload Excel file page ................................................................................................. 52
Figure 5-27
Import from Project Server page ................................................................................. 52
Figure 5-28
Manual insertion page ................................................................................................. 53
Figure 5-29
Data List page.............................................................................................................. 54
Figure 5-30
New Scope page ......................................................................................................... 55
Figure 5-31
List Scopes page ......................................................................................................... 55
Figure 5-32
New Scope Entity page ............................................................................................... 56
Figure 5-33
List Scope Entities page .............................................................................................. 56
Figure 5-34
New Metric page.......................................................................................................... 57
Figure 5-35
Add Formula page ....................................................................................................... 57
Figure 5-36
Metric List page ........................................................................................................... 58
Figure 5-37
New List page .............................................................................................................. 59
Figure 5-38
All Lists page ............................................................................................................... 59
Figure 5-39
New Excel Form page ................................................................................................. 60
Figure 5-40
All Forms page............................................................................................................. 61
Figure 5-41
New Target page ......................................................................................................... 61
Figure 5-42
All Targets page........................................................................................................... 62
Figure 6-1
Selenium test passed .................................................................................................. 64
Figure 6-2
Selenium test failed ..................................................................................................... 65
vii
List of Tables
Table 2-1
Internship phases and its duration............................................................................... 10
Table 3-1
Math parsing tools comparison.................................................................................... 14
Table 3-2
Charting tools comparison........................................................................................... 15
viii
CMMI Metrics Solution
1
Introduction
The CMMI Metrics Solution project was developed at Qimonda as part of a curricular
internship of the Integrated Master in Informatics and Computation Engineering Programme
at the Faculty of Engineering of the University of Porto.
This chapter provides an introduction to this project’s context, namely on the organization
where it took place – Qimonda Portugal S.A. – and how it will contribute to Qimonda’s own
goals. It also provides a brief overview on this document’s structure.
1.1
Qimonda Presentation
The project described in this document was developed at Qimonda Portugal S.A., which is
part of the multinational Qimonda AG, one of the largest memory companies in the world (the
world leading DRAM and 300mm wafer manufacturing company), with about 13,500
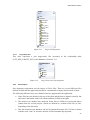
employees worldwide. Figure 1-1 shows Qimonda’s sites worldwide:
Figure 1-1
Qimonda worldwide
Qimonda started as a carve out of Infineon Technologies AG on May 2006, its roots go back
to Siemens AG.
Siemens, a company with over 150 years, first carved out its semiconductor business in April
1999, thus creating Infineon, which has been an independent and successful memory
company ever since.
Infineon Technologies focuses on the three main areas: energy efficiency, communications
and security. Therefore it offers semiconductors and system solutions for automotive,
industrial electronics, chip card and security as well as applications in communications.
Furthermore, the company offered memory products trough its subsidiary Qimonda.
On May 1st, 2006 Qimonda carve out from Infineon and went public at the New York Stock
Exchange on August 9th, 2006.
1
CMMI Metrics Solution
Based in Munich, Germany, Qimonda R&D and production facilities include sites all around
the world, from Asia to Europe and North America. Porto’s facilities (Figure 1-2) were
founded in 1997 (while still part of Siemens Semiconductors AG) and now include a work
force of over 1.600 employees.
Figure 1-2
1.2
Qimonda production facilities in Porto
Porto DC at Qimonda
The Porto Development Center (DC) began its operations, on October 1st of 2005, as an
autonomous organizational unit within IT Porto belonging to the Qimonda IT Manufacturing
line.
IT Manufacturing has a complete software development supply chain, with identified
organizational units owning each block of the chain.
The DCs are responsible for the technical design, implementation, testing and integration of
solutions including the delivery to their direct customers, the Domain Functions (DF).
Internally, the Porto DC’s organization follows a technical orientation and is therefore divided
into the following technology oriented sections:
•
Business Process Automation (BPA): focuses on developing automation of business
processes between different manufacturing functional areas and also to provide
software solutions for line automation, including equipments and materials.
•
Cross-Platform Technologies (CPT): focuses developing applications to run on nonWindows platforms. Within this section development is also done in the middleware
area, with focus on web and TIBCO based solutions.
•
Database Technologies (DBT): focuses its work mainly in Oracle databases and tools.
The activities include database design, modeling, development of database procedures,
data marts and ETL (Extraction Transformation and Loading) procedures.
2
CMMI Metrics Solution
•
Quality Management (QM): focuses on Quality Management processes and
procedures, interacting directly with all other sections, namely ensuring adherence to
defined processes, establishing Quality Assurance plans and acting as final gate before
releases.
•
Windows Technologies (WT): focuses on the development of Windows OS based
Systems, Frameworks and GUIs.
Figure 1-3
Porto DC organization chart
The CMMI Metrics Solution project was developed in the context of the Quality Management
(QM) section.
1.3
CMMI Overview
Capability Maturity Model Integration [Chr07] (CMMI) is a process improvement approach,
defined by the Software Engineering Institute (SEI), which provides organizations with the
essential elements of effective processes. It can be used to guide process improvement across
a project, a division, or an entire organization. CMMI helps integrate traditionally separate
organizational functions, set process improvement goals and priorities, provide guidance for
quality processes, and provide a point of reference for appraising current processes.
The CMMI Product Suite is at the forefront of process improvement because it provides the
latest best practices for product and service development and maintenance. The CMMI
models improve the best practices of previous models in many important ways. CMMI best
practices enable organizations to do the following:
•
more explicitly link management and engineering activities to their business
objectives;
•
expand the scope of and visibility into the product lifecycle and engineering activities
to ensure that the product or service meets customer expectations;
•
incorporate lessons learned from additional areas of best practice (e.g., measurement,
risk management, and supplier management);
•
implement more robust high-maturity practices;
3
CMMI Metrics Solution
•
address additional organizational functions critical to their products and services;
•
more fully comply with relevant ISO standards.
1.3.1
CMMI Measurement and Analysis Process Area
The purpose of the Measurement and Analysis (MA) process area is to develop and sustain a
measurement capability that is used to support management information needs. This process
involves the following:
•
specifying the objectives of measurement and analysis such that they are aligned with
identified information needs and objectives;
•
specifying the measures, data collection and storage mechanisms, analysis techniques,
and reporting and feedback mechanisms;
•
implementing the collection, storage, analysis, and reporting of the data;
•
providing objective results that can be used in making informed decisions, and taking
appropriate corrective actions.
The Measurement and Analysis process area contains the following Specific Goals (SG) and
Practices (SP):
•
SG 1 – Align Measurement and Analysis Activities
o SP 1.1 – Establish Measurement Objectives
o SP 1.2 – Specify Measures
o SP 1.3 – Specify Data Collection and Storage Procedures
o SP 1.4 – Specify Analysis Procedures
•
SG 2 – Provide Measurement Results
o SP 2.1 – Collect Measurement Data
o SP 2.2 – Analyze Measurement Data
o SP 2.3 – Store Data and Results
o SP 2.4 – Communicate Results
1.4
CMMI Metrics Solution at Qimonda
The goal of this internship was to define, design, build and deploy a software solution,
integrated in the platform that manages the CMMI processes, that stores process metrics and
indicators. The solution should be wide and dynamic enough to import and collect data from
various sources (like Excel, Project Server, external databases, etc) and present it to the user
in various formats (data tables, charts, indicators, etc).
The goal of the solution was to build a tool to help management trough the software and
project development lifecycle. This way we can achieve a continuous improvement though
regular reviews of the performance of our solutions and services against measurable targets.
4
CMMI Metrics Solution
1.5
Document Structure
This document is organized in 8 chapters.
Introduction (Chapter 1) gives the reader some background on Qimonda’s history,
organization and business activities, and how this project aligns itself with these activities. A
brief overview on the context in which this project took place and its main goals is provided
in Objectives (Chapter 2).
Technological Review (Chapter 3) provides a review on the most relevant technologies used
during the course of this project, covering both existing technologies used at Qimonda and
technologies specific to this project’s domain (chosen after the appropriate research took
place).
In Specification (Chapter 4) is described the solution designed to achieve the goals proposed
for this project, covering all aspects from its requirements to the solution’s design. Some
detail on its implementation (providing detail on lower level algorithms and data structures
used where appropriate) is provided in Implementation (Chapter 5).
Results Evaluation (Chapter 6) provides some evaluation of the results achieved.
Finally, Evolution (Chapter 7) discusses some possible future enhancements on the solution
developed and Conclusions (Chapter 8) has some final remarks about this internship and this
project’s measurable success.
5
CMMI Metrics Solution
2
Objectives
2.1
Context
Porto DC has a strong commitment regarding software quality. The Software Quality
Improvement (SQI) project was born to provide higher quality and user satisfaction levels on
all of the DC’s projects.
The Quality Management System (QMS) is part of this project and aims to provide products
and services that meet or exceed the customer functional and non-functional requirements:
•
On the agreed timeframes
•
Within the agreed budget
•
With high quality
•
Using the agreed tools and software development processes
while achieving a continuous improvement through regular reviews of the performance of its
solutions and services against measurable targets.
Figure 2-1 presents the QMS processes organization and their sub-processes.
Figure 2-1
QMS Processes Organization
CMMI Metrics Solution project is included in Measurement and Analysis Process and it’s an
important tool to support the management and achievement of the QMS objectives.
The Measurement and Analysis process in Porto DC is used to measure project success
against defined targets, like project progress, product size or quality, or process performance.
A metric is a quantitative value obtained from a measure which supports the calculation of
indicators. An indicator is a calculated value, derived from one, two or more metrics that
measures the extent of achievement of a given objective and allows the evaluation of trends.
6
CMMI Metrics Solution
A target is the value against which the actual value of an indicator will be compared. If the
actual reaches or exceeds the target, this is considered achieved.
Its purpose is to develop and sustain a measurement capability that is used to support
management information needs.
This process involves the following areas:
•
The specification of the measures and analysis guaranteeing that these are aligned with
the overall DC strategic objectives;
•
The identification of the metrics, indicators, data collection, storage and calculation
mechanisms;
•
Identification of analysis and reporting mechanisms;
•
Execution of defined data collection, indicators production, analysis and definition of
improvement actions.
Figure 2-2
2.2
Measurement and Analysis Process
Problem
As showed above (Figure 2-2), the Measurement and Analysis process has a defined number
of activities. Although this process is well defined, data collection is difficult (done manually)
and data visualization isn’t systematic.
In the following paragraphs each activity will be presented and also its problems and
improvements needed.
A1 – Define metrics, indicators and targets
This activity occurs on a yearly basis. Based on the inputs of DC targets, DC management
needs and the past results of the process, a set of metrics and indicators are created, as well as
target values for these indicators. Moreover, a drill-down to the section and individual level of
these targets is also part of this process.
7
CMMI Metrics Solution
Problem
After defining new metrics and indicators new Excel files (where metrics data will be stored)
should be created. These files should be filled several times for each metric defined,
consuming time and reducing productivity.
A2 – Collect metrics
The metrics defined in A1 shall be collected on a monthly basis and stored, making them
available for the A3 activity.
Problem
The process of collecting data for the metrics should be as automated as possible. Today, we
have to go to several data sources and aggregate the results. It’s a hard, manual and complex
process. Considering that this process collects the results of hundreds of projects, we get to
the main problem that CMMI Metrics Solution will solve.
A3 – Produce indicators
The indicators defined in A1 are produced, from the metrics collected in A2 and the results
are stored and communicated, allowing the analysis and the definition of actions to be done
within the scope of the A4 activity.
Problem
This task doesn’t have important issues but can be improved. Microsoft Excel is a powerful
application to implement formulas and data sheets but it’s not the best way to present
interactive results. Sometimes is complex to make the desired chart and present results in a
user-friendly view. Other problem already referred is that data visualization isn’t performed in
a systematic way.
A4 – Analyze results, define actions
This activity occurs every half-year (semester). The purpose of this activity is to analyze the
results and trends of indicators against the target values and derive improvement actions for
the indicators that did not achieve the target value or that are significantly decreasing its
performance.
Problem
For all the reasons and problems described in the previous activities, the analysis is difficult
and the Measurement and Analysis is a long and complex process.
2.3
Main Goals
The following paragraphs will describe the improvements and solutions that this project
implements for each of the problems described above.
A1 – Define metrics, indicators and targets
It will be possible to customize and create metrics and indicators. This application will be
completely dynamic, allowing users to insert and edit metrics, change formula and chart to
8
CMMI Metrics Solution
display the results, select sources to fetch data, manage scopes and default dates, among other
functionalities presented in more detail in Specification (Chapter 4) and Implementation
(Chapter 5).
A2 – Collect metrics
This project will improve this procedure, allowing the collection of the data to be done
automatically (it’s possible to collect data manually also), centralizing the data and
calculating the metric results.
A3 – Produce indicators
CMMI Metrics Solution will present dynamic and fully customizable data tables and charts,
helping reports and analysis of the metric results in a systematic way.
A4 – Analyze results, define actions
For all the improvements presented in the previous activities, analysis will become a lot more
easy, interactive, safe and quick.
2.4
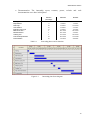
Planning
Due to its dimension, the project was divided in the following phases:
•
Training: Qimonda provided training in various areas like structure and organization
of Qimonda AG, frontend and backend processes, among others. CMMI and
Development Center Quality Management System self-training was also done in this
activity.
•
Requirements: After analyzing the problem and objectives it was developed a
Requirements Specification Document that was discussed several times and approved.
•
Data Layer: In this phase was developed the database structure and its access classes
and methods.
•
User Interface: This phase contains the interface and data forms design. Was used
AJAX to increase usability and interactivity.
•
Business Logic Layer: This layer is the complete core of this application and contains
all data and web page classes and its methods. It connects the Data Access Layer with
the User Interface, providing the correct data fetching, transformation and
visualization.
•
Math Parser Tool: In this phase was investigated and implemented a Math Parser Tool
to calculate metric results.
•
Charting Tool: This activity contains the investigation and integration of a Charting
Tool to present the metric results.
•
Windows Service: This timer based module was created to automatically fetch data
from external sources.
•
Tests and Improvements: The application was fully tested, improving user interface,
database access, and fixing some detected bugs.
9
CMMI Metrics Solution
•
Documentation: The internship report, resumes, poster, website and code
documentation were done in this phase.
Duration
Start date
End Date
14/9/2007
(work days)
Training
5
10/9/2007
Requirements
11
17/9/2007
1/10/2007
Data Layer
22
2/10/2007
31/10/2007
User Interface
27
2/10/2007
7/11/2007
Business Logic Layer
75
3/10/2007
15/1/2008
Math Parser Tool
3
22/11/2007
26/11/2007
Windows Service
3
30/11/2007
4/12/2007
Charting Tool
5
14/12/2007
20/12/2007
Tests and Improvements
29
24/12/2007
31/01/2008
Documentation
28
23/1/2008
29/2/2008
Table 2-1
Figure 2-3
Internship phases and its duration
Internship plan Gantt diagram
10
CMMI Metrics Solution
3
Technological Review
This chapter contains information about all technological issues related to the CMMI Metrics
Solution project. It is explained the most relevant technologies behind the project and the
analysis done to some existing tools used in the development.
This application is completely dynamic, customizable and fully integrated to Qimonda
Quality Management System metrics and data sources. For these reasons it wasn’t compared
with any available products in the market.
3.1
Existing Systems
It’s important to mention some existent technologies and tools that are connected with this
project.
3.1.1
TIBCO Rendezvous
TIBCO Rendezvous [Sof08] is a software product that provides a message bus for enterprise
application integration (EAI). The basic message passing is conceptually simple:
•
A message has a single subject composed of elements separated by periods. A
message is sent to a single daemon (though it may end up being broadcast onto
daemons).
•
A listener announce its subjects of interest to a daemon (with a basic wildcard facility)
and messages with matching subjects are delivered to it if the two daemons are
connected to each other (or indeed the same daemon).
Messaging can be publish/subscribe or request/reply, point-to-point or multicast, synchronous
or asynchronous, and delivered via the local-area network (LAN), wide-area network (WAN),
or the internet. TIBCO Rendezvous messages are self-describing and platform-independent,
with a user-extensible type system that provides support for data formats such as XML.
TIBCO provides messaging APIs in C, C++, Java, VB, Perl and .NET.
3.1.2
YODA
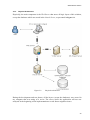
YODA (Your Own Data Adapter) [Gom07] is a technology and platform independent
infrastructure developed at Qimonda, based on TIBCO Rendezvous, which provides a
framework for developers to create their own distributed and load balanced applications,
allowing the development to focus on business logic by providing an abstract communication
layer through the use of its main library – IFXLib.
IFXLib provides encryption, load balancing, fault tolerance, logging and other features, and
makes possible for a workflow to call services available in YODA by creating an IfxDoc
(YODA’s main data structure) and setting its fields accordingly, namely the IFX_SERVICE
which holds the name of the service to be called.
11
CMMI Metrics Solution
Figure 3-1
3.1.3
YODA Architecture
Microsoft Project
Microsoft Project [Cor08] is a project management software program developed and sold by
Microsoft which is designed to assist project managers in developing plans, assigning
resources to tasks, tracking progress, managing budgets and analyzing workloads.
Additionally, Project can recognize different classes of users. These different classes of users
can have differing access levels to projects, views, and other data. Custom objects such as
calendars, views, tables, filters and fields are stored in an enterprise global template which is
shared by all users.
All Qimonda’s project data and user tasks are stored in Project Server.
3.1.4
Event Viewer
Event Viewer [Cor05] is a component of Microsoft's Windows NT line of operating systems
that lets administrators and users view the event logs on a local or remote machine.
Event logs have been a feature of Windows NT since its original release in 1993. Applications
and operating system components can make use of this centralized log service to report events
that have taken place, such as a failure to start a component or complete an action.
CMMI Metrics Solution has a component that consists in a Windows Service and Event Logs
are the better way of debugging this service.
3.2
Math Parser Tool
An important component of this application is a mathematic formula parser and calculator.
This sort of tool is available in all sorts of formats, with several different implementations but
no one was wide enough to fit the problem. The solution was to find a simple extensible
calculator implementation that could be integrated in the code and changed by our needs.
12
CMMI Metrics Solution
As such, it became necessary to analyze the different alternatives to find the one that best
suited the requirements in mind.
3.2.1
Tools Evaluated
The tools presented here were chosen based on criteria such as their simplicity, extensibility,
code integration and free open-source solutions.
Lundin Mathparser Assembly
This math parser developed by Patrik Lundin [Lun04] it’s a simple .NET assembly written in
C# that evaluates a mathematical expression.
The parser supports the most common mathematical operators and functions such as:
•
Operators: +, -, *, /, ^, %
•
Functions: sqrt, sin, cos, tan, atan, acos, asin, acotan, exp, ln, 10log, fac, sinh, cosh,
tanh, abs, ceil, floor, sfac, round, fpart
•
Logical: !, ==, !=, ||, &&, >, < , >=, <=
It provides a class library that can simply be included in the project and, it’s also flexible
enough to allow the development of new functions and operators.
CodeDom Calculator
CodeDom [Gol05] was developed by Mike Gold and gives the ability to dynamically build
C# code into a string, compile it, and run it all inside the program. The calculator evaluates
expressions (and even lines of C# code) inside a Windows Form. It primarily uses the
System.Math class to do the calculations.
CodeDom opens up a world of possible dynamic coding that can be conjured on the fly.
This is a powerful tool but the formula has to be written in a specific syntax (not always userfriendly) and that brings an important issue.
G2DS Calculator
G2DS [Fol07] is an application developed in the Windows Technologies section at Qimonda
with the objective of providing a generic disposition system configurable and extensible in
order to be used for different disposition scenarios (e.g. automated/user triggered).
It has a Calculator module integrated but was too complex and doesn’t have all the operations
needed. This complexity was an important issue blocking the learning process. To insert new
functions I had to change the core of the tool and was like developing a completely different
tool from the start.
Excel Formula Parsing
This tool [Bac07] was developed in C# and parses Excel formulas into tokens and
“constructs” a token tree. It supports all expressions and operations available in Excel but it
doesn’t implement the calculation of those formulas, what makes me abandon this option.
13
CMMI Metrics Solution
3.2.2
Conclusions
After studying the features provided by each of the previous tools and their examples, it was
concluded that the best choice for this project would be Lundin Mathparser. Its flexibility,
simplicity and ease integration and management make it an overall best choice.
G2DS Calculator also seemed like a good choice, however the complexity issue and less
operations supported determined the final choice.
Table 3-1 summarizes the results found (main features) for all tools analyzed.
Simplicity
Operations
Extensibility
and functions
Lundin Mathparser
Level of
Overall
integration
High
Many
High
High
Very Good
Medium
Many
Low
Medium
Medium
G DS Calculator
Low
Basic
Medium
High
Good
Excel Formula Parser
High
Many
Low
Low
Incomplete
CodeDom Calculator
2
Table 3-1
3.3
Math parsing tools comparison
Charting Tool
Another important component of this application is a charting tool. The application business
logic could be perfect but if it doesn’t present the results it will be useless. The solution was
to find a charting tool fully customizable, which presents different kinds of charts to help
understanding the results returned by the Math Parser Tool (Section 3.2).
As such, it became necessary to analyze the different alternatives to find the one that best
suited the requirements in mind.
3.3.1
Tools Evaluated
The tools presented here were chosen based on criteria such as their extensibility,
customization, code integration and free open-source solutions.
ZedGraph
ZedGraph [Wik07] is a set of classes, written in C#, for creating 2D line and bar graphs of
arbitrary datasets. The classes provide a high degree of flexibility – almost every aspect of the
graph can be user-modified. At the same time, usage of the classes is kept simple by
providing default values for all of the graph attributes. The classes include code for choosing
appropriate scale ranges and step sizes based on the range of data values being plotted.
ZedGraph also includes a UserControl interface, allowing drag and drop editing within the
Visual Studio forms editor, plus access from other languages such as C# and VB. ZedGraph is
licensed under the LGPL.
Open Flash Chart
Open Flash Chart [Gla07] is an open-source project. It offers 35 chart variations; among them
a number of bar charts, pie charts and line charts. Provided tutorials explain how the script
can be extended with further functionality such as mouse-over effects and how the database
can be queried for some values and the results then displayed in a graph. Open Flash Chart
14
CMMI Metrics Solution
uses Flash and PHP. Data can also be stored in plain text. Actually there is support for .NET
but it still has some performance and support issues.
3.3.2
Conclusions
Most of the tools found were developed under Windows Forms and don’t support Web Forms
and Controls. I presented the two best tools that could fit the problem.
Open Flash Chart makes more beautiful and interactive charts but the support for .NET is
starting development so it still has some problems.
ZedGraph makes only 2D charts but is completely stable and efficient under the development
environment of this project and it makes it and overall best choice. Additionally, ZedGraph
has tutorials and examples, allowing a fluid and quick integration and learning process.
Table 3-2 summarizes the results found (main features) for all tools analyzed.
Customization
Number
Extensibility
of charts
Integration
Overall
and support
ZedGraph
High
Medium
High
High
Good +
Open Flash Chart
High
High
High
Low
Good -
Table 3-2
3.4
Charting tools comparison
Other Technologies
Besides the technologies previously mentioned, several others were used. I will present a
short description of the most relevant
3.4.1
.NET Framework 2.0
The Microsoft .NET Framework [Cor06] is a software component that is a part of the
Microsoft Windows operating systems. It provides a large body of pre-coded solutions to
common program requirements, and manages the execution of programs written specifically
for the framework. The .NET Framework is a key Microsoft offering, and is intended to be
used by most new applications created for the Windows and Web platforms.
This project was implemented in C# for several reasons, inherent both to the language itself
(rapid application development, for instance) and to this project’s context (better integration
with existing components and also because Qimonda’s web servers work on Windows Server
2003 and Internet Information Services (IIS) platforms).
3.4.2
ASP.NET AJAX
AJAX (Asynchronous JavaScript and XML), or Ajax [Cor07a], is a group of inter-related
Web development techniques used for creating interactive Web applications. A primary
characteristic is the increased responsiveness and interactiveness of Web pages achieved by
exchanging small amounts of data with the server "behind the scenes" so that the entire Web
page does not have to be reloaded each time the user performs an action. This is intended to
increase the Web page's interactivity, speed, functionality, and usability.
15
CMMI Metrics Solution
AJAX is asynchronous in that extra data is requested from the server and loaded in the
background without interfering with the display and behavior of the existing page. JavaScript
is the scripting language in which AJAX function calls are usually made.
AJAX is a cross-platform technique usable on many different operating systems, computer
architectures, and Web browsers as it is based on open standards such as JavaScript and the
DOM. There are free and open source implementations of suitable frameworks and libraries.
This asynchronous data loading solution was the best approach because of the large amounts
of data to be loaded by the application.
3.4.3
Excel Interop Assembly
COM interop assemblies allow unmanaged (COM) code to be called from managed (.NET)
code by using the Microsoft .NET Framework and the common language runtime. COM
interop assemblies allow managed applications to bind to unmanaged types at compile time
and provide information to the common language runtime about how the unmanaged types
should be marshaled at run time.
While any number of COM interop assemblies may exist, only one COM interop assembly is
designated as the primary interop assembly (PIA). The PIA contains the official description of
the unmanaged types as defined by the publisher of those unmanaged types. The PIA usually
also contains certain customizations that make the types easier to use from managed code and
is always digitally signed by the publisher of the original unmanaged type.
Microsoft has created several PIAs that contain the official description of commonly-used
Microsoft Office XP type libraries for products such as Microsoft Access 2002, Microsoft
Excel 2002, Microsoft FrontPage 2002, and so on.
In this project was used the .NET Framework namespace Microsoft.Office.Interop.Excel
[Cor07b] to import and export data from Excel files.
3.4.4
Regex
In computing, regular expressions provide a concise and formal means for specifying text of
interest, such as text that contains particular characters, words, or patterns of characters.
Regular expressions are written in a formal language that can be interpreted by a regular
expression processor, a program that examines text and identifies parts of the text that match
the specification provided by the regular expression.
The System.Text.RegularExpressions namespace [Cor07c] contains classes (for example
Regex and Match) that provide access to the .NET Framework regular expression engine. It
was used with the math parser to extract the new operations implemented.
3.4.5
Selenium
Selenium [Pro07] is a test tool for web applications. Selenium tests run directly in a browser,
just as real users do and run in Internet Explorer, Mozilla and Firefox on Windows, Linux,
and Macintosh. No other test tool covers such a wide array of platforms.
Selenium IDE is an integrated development environment for Selenium tests. It is implemented
as a Firefox extension, and allows recording, edition, and debugging tests. Selenium IDE
16
CMMI Metrics Solution
includes the entire Selenium Core, allowing the easy and quick record and play back tests in
the actual environment that they will run.
Selenium IDE is not only a recording tool, but a complete IDE. Its recording capability can be
used, or the scripts can be edited by hand. With autocomplete support and the ability to move
commands around quickly, Selenium IDE is the ideal environment for creating Selenium tests
no matter what the style of tests preferred.
3.4.6
Firebug
Firebug [Hew07] is one of the most popular Mozilla Firefox’s extensions. Firebug is both an
inspector and an editor, including a lot of features such as debugging JavaScript, HTML
inspecting and edition, logging, tracing, CSS edition, which are very useful for web
development.
All objects in the HTML, CSS and JavaScript files can be edited with a single or double click.
As they are typed, the changes are immediately applied in the browser window providing
instant feedback. The DOM inspector allows full in-place editing of document structure, not
just text nodes.
17
CMMI Metrics Solution
4
Specification
The system requirements specification process started at 17th September and lasted until the
start of October. During this process took place several meetings, in order to obtain a realistic
vision of objectives and needs.
Based on the information and feedback received, was created a Requirements Specification
Document that was subject to several reviews and was finally approved in 1st October. This
document contains a description of all features to be implemented, activity diagrams and an
interface prototype. It provided a solid start of the project, allowing the correct project
planning and effort estimation. This chapter gives a detailed description of the system
requirements.
4.1
Requirements
This project had an exploratory nature so part of the work was finding out if the requirements
defined in the Requirements Specification Document could satisfy the project main goals.
During the development phase some requirements changed and new ones were introduced,
but the project main goals were never modified.
These changes weren’t included in the initial Requirements Specification Document because
of time constraints. The Document dated 1st October [Les07] is referenced to present the
evolution of this project from the initial draft to the solution delivered, which is described in
detail in the following sections.
4.1.1
Functional Requirements
The application should contain four distinct areas:
•
Main: the application main page where we can view the actual target values and
indicators.
•
Metrics: this is the visualization area where metric results and charts are presented by
scope.
•
Data Lists: in this area we can upload and list metric raw data, which is stored in the
database and used to calculate metrics.
•
Admin: where the administrator can manage the entire application properties.
The Main Area contains the application start page and has only one use case identified – view
the actual target values and indicators. The other three areas will be presented in more detail
in the next sub-sections and supported by use case diagrams, providing a wide vision of the
solution and its activities.
Before explaining them, it’s necessary to introduce the roles of different users that will use the
application.
4.1.1.1
Authentication
The application should be layered into access groups. This feature was not implemented
because it will receive the authentication from another application but the following profile
types were identified:
18
CMMI Metrics Solution
•
Administrator: has access to all application areas and features.
•
Manager: has access to all features except the ones in Admin area.
•
User: can only see metric and target results.
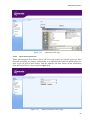
Figure 4-1 presents a high level use case diagram representing the actions allowed to each of
the actors identified.
Figure 4-1
CMMI Metrics Solution use case diagram
19
CMMI Metrics Solution
4.1.1.2
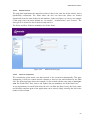
Metrics Area
One of the project’s main goals is to present metrics and indicators in an interactive and userfriendly way. The user can view a table with the current values against the defined targets,
and also a chart with metric values evolution along time.
Figure 4-2
4.1.1.3
Metrics Area use case diagram
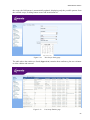
Data Lists Area
This area should permit the upload and list of raw data, which is stored in the database and
used to calculate metrics.
All QMS metric data is stored in three sources: Excel files, Project Server or databases of
different applications. The application should fetch data from this data sources and store it in
the local database. This way we can have a central metric data repository, easily managed and
accessible.
Also manual insertion of data will be possible, in order to correct a wrong value and because,
in the future, Excel files may be discontinued and the user can fill directly the application
forms.
Figure 4-3 presents a use case diagram of this area.
20
CMMI Metrics Solution
Figure 4-3
Data Lists Area use case diagram
With the objective of integrating all this different data sources we need to customize Forms
and Lists, which will be presented below in the Admin Area.
4.1.1.4
Admin Area
In order to avoid recompiling the code when a change or a different configuration needs to be
implemented, the application should have an administration area where its parameters and
configurations could be managed. This customization assures dynamism and the response of
future needs.
Manage Metrics
The application should be extensible to support and manage an initial number of metrics
already defined, and also new ones in the future. For that reason, operations like add, edit,
remove and list the existing metrics are essential.
Metrics have the following attributes:
•
Name: name of the metric.
•
Description: a short text explaining the meaning of the metric.
•
Acronym: short name or acronym of the metric.
•
Scope: represents a group of entities to which the metric is defined and is detailed in
the next topic.
•
Formula: it is introduced by the administrator and it should be intuitive and userfriendly. This means that formulas defined in C#, SQL or Excel have a particular
syntax and are too complex and difficult to understand for a non-developer. It would
be much better if we could write formulas in common and universal math and then the
application would interpret and convert it to the desired format.
21
CMMI Metrics Solution
•
Chart: different kinds of charts can be chosen when creating or editing the metric.
Figure 4-4 shows the actions in metric management.
Figure 4-4
Manage Metrics use case diagram
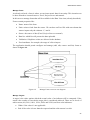
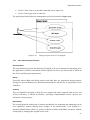
Manage Scopes
The application should allow managing (add, edit, remove and list) scopes for organizing
metrics. A scope is a group of entities as shown in Figure 4-5. It contains attributes like name,
description, and a parent. A parent is another scope that contains this one in its definition. For
example Projects contain Releases, Sections contain Projects and a DC contains Sections.
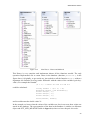
Scopes
DC
Entities
Porto DC
Suzhou DC
Section
QM
BPA
Project
Yoda 5.5.0
ProFAB 4.3
Release
IFXApi 5.5.0
ProFAB 4.3.24
Figure 4-5
Scopes and Entities Organization
22
CMMI Metrics Solution
This approach is necessary because we can add or remove scopes without changing any
aspect of the implementation. For example, if this application is implemented in Suzhou DC
(located in China), its organization doesn’t contain Sections and we can simply remove this
scope by changing the Project parent directly to DC. If we need another scope Sub-Project is
also possible changing the Release parent to this one, and its parent will be Project.
Figure 4-6 represents the use case diagram over the scope management.
Figure 4-6
Manage Scopes use case diagram
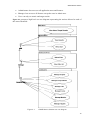
Manage Scope Entities
As shown in Figure 4-5 entities are “specific objects” of a scope. For example Porto DC
contains the section QM, which contains the project ProFAb 4.3. Porto DC is an entity of the
scope DC, QM is an entity of the scope Section and ProFab 4.3 is an entity of the scope
Project.
Entities are important because metric data is always inserted to an entity and defined to a
scope. This means, when we create a metric to the scope Release, the data is always inserted
to one release (which is an entity).
The application should also allow add, edit, remove and list entities. An entity has attributes
like:
•
Name: name of the entity.
•
Description: short text containing what this entity represents.
•
Scope: group where the entity is inserted.
•
Parent: represents another entity that this one belongs.
•
Manager: the person responsible for the entity.
23
CMMI Metrics Solution
Figure 4-7 presents the actions in scope entities management.
Figure 4-7
Manage Scope Entities Area use case diagram
Manage Lists
A data list is where we can see the raw data (like it was inserted and is stored in the database).
Lists are fully customizable because we can choose what we want to list and how.
Imagine that we inserted an Excel file to the Release X and it contains five units inserted in
the database. Then we want to list this data but only the units 1, 2 and 4. This is the objective
of lists. We give a list of units and it should return all data that contains these units.
Management operations over lists are presented in Figure 4-8.
Figure 4-8
Manage Lists Area use case diagram
24
CMMI Metrics Solution
Manage Forms
As already referred, a form is where we can insert metric data for an entity. This insertion can
be done from three external sources: Excel, Project Server and manual.
In this area we manage forms that will be available in the Data Lists Area (already described).
Forms contain properties like:
•
Name: name of the form.
•
Units: units to fetch from the source. We can have an Excel file with ten columns but
want to import only the columns 1, 3 and 4.
•
Source: the source of data (Excel, Project Server or manual).
•
Data list: which list will present the data uploaded.
•
Validation: if duplicate values are allowed in the database.
•
Excel attributes: for example, the range of cells to import.
The application should permit configure and manage (add, edit, remove and list) forms as
shown in Figure 4-9.
Figure 4-9
Manage Forms Area use case diagram
Manage Targets
A target is the value against which the actual value of an indicator will be compared. If the
actual value reaches or exceeds the target, this is considered achieved. There are six levels of
achievement (0%, 50%, 100%, 150%, 200% and 250%) and four color indicators:
•
White: if the value it’s not applicable.
•
Red: if the value is lower than the expected and the achievement is at risk.
25
CMMI Metrics Solution
•
Yellow: if the value is near achievement but can be improved.
•
Green: if the target value is achieved.
The application should allow the management activities presented in Figure 4-10.
Figure 4-10
4.1.2
Manage Targets Area use case diagram
Non-functional Requirements
Documentation
The tool should be properly documented in English, with a user manual, documenting all of
the application’s features (screenshots and descriptions on how to use them), and an API with
the classes and functions implemented.
Safety
Especially when adding and editing metrics and other data, the application should generate
messages to prevent human errors and data inconsistencies, and the user is responsible to deal
with them.
Usability
This tool should be designed to help the user complete the tasks proposed with success and
increase efficiency. It should be intuitive, providing comprehensible menus, options and
informative help messages.
Extensibility
The system should be architected to include mechanisms for expanding and enhancing it with
new capabilities without making major changes in the infrastructure. Code should be a
dynamic linkable library (DLL), so system’s behavior could be modifiable at runtime, without
recompiling or changing the original source code.
26
CMMI Metrics Solution
Interface
The design should be aligned with the colors and layout of the common Qimonda’s web
applications, providing to the users a known work environment.
4.1.3
Technological Requirements
The application should be developed with Microsoft Framework 2.0 in C# language. The web
application should be in Microsoft ASP .NET and the database implemented in Oracle 9i.
The web interface should support the official Qimonda’s web browser, Internet Explorer, but
it will also be tested and debugged in Mozilla Firefox.
4.2
Conceptual Model
The conceptual model (Figure 4-11) presents the system structure by showing the system
classes, their attributes and relationships.
Figure 4-11
Conceptual model
27
CMMI Metrics Solution
5
Implementation
CMMI Metric Solution was developed incrementally in various phases. The first development
done in this internship project was related to the technology analysis and architecture
definition.
This chapter focuses on the development of the requirements defined in the last chapter and it
is divided in four sub-sections. First will be explained the system architecture and then, each
of the layers of the solution (Data Layer, Business Logic Layer and User Interface).
5.1
Architecture
It’s extremely important to define a detailed and correct system architecture.
Logically, the application follows a layered model, in order to increase quality and
extensibility levels. This model organizes the system in different layers, in each layer acts as a
client of the lower layer and provides services to the higher one.
With this approach, the system becomes completely modular and portable (layers can be
changed and replaced as long we respect communication between them).
Physically, these logical layered components are located in different servers and machines,
increasing system performance and maintenance.
In the next sections will be defined these two architecture models.
5.1.1
Logical Architecture
Logically, the system was divided into three different layers. A lower layer to access, manage
and store data, a middle layer with all the application’s business logic and a web interface
layer completely dummy (without business logic) for user interaction.
The next diagram shows this organization.
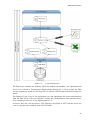
28
CMMI Metrics Solution
Figure 5-1
Logical Architecture
The Data Layer contains two modules. The lower module, the database, was implemented in
Oracle 9i as referred in Technological Requirements (Section 4.1.3). Next we have the Data
Access component, which was developed in C# with the .NET Framework Data Provider for
Oracle.
The Business Logic Layer is the application core and implements all classes and functions
from the data access to the user interface, besides the communication with external sources
(Excel and Project Server). It was implemented in C#.
At last we have the web based layer, User Interface, developed in .NET with the usual web
controls, plus the ones available in the AJAX Toolkit.
29
CMMI Metrics Solution
5.1.2
Physical Architecture
Physically, the main component is the Web Server that stores all logic layers of this solution,
except the databases which are stored in the Oracle Server, as presented in Figure 5-2.
Figure 5-2
Physical Architecture
During the development and test phases, all the layers (except the databases) were stored in
my computer that was acting as a server. The server where the application will run was
analyzed in the beginning of the implementation to avoid future migration issues.
30
CMMI Metrics Solution
5.2
Data Layer
The implementation started by the Data Layer, which contains the database definition and
data access classes and methods. This chapter provides description and diagrams for each one
of these components, starting with the database model and, at last, the classes and methods
that establish the connection between the application and data.
5.2.1
Database
The database model was defined after the approval of the Requirements Specification
Document.
Initially it was defined a model that contained several data tables to store metric and measure
data. During development we realized that it wasn’t as dynamic as we liked it to be because if
we need to insert new metrics with different data (one of the main requirements), a new
database table should be created. After analyzing the problem, was suggested a new model
that contains only one data table (GTF_MTR_MEASURES) to store all metric data, which
fields could be reutilized.
This approach could bring a performance issue because of the large amount of different data
this table would store. After analyzing the problem, we concluded that it was the best choice
and the access time didn’t increase substantially, even with thousands of lines from different
metrics.
This model allows creating and managing new metrics inside the application without needing
to change the database or a single code line.
Figure 5-3 shows the final database model diagram.
31
CMMI Metrics Solution
Figure 5-3
Database model
32
CMMI Metrics Solution
Next, will be explained the tables and fields from the relational model in Figure 5-3. These
tables have a common prefix (GFT_MTR_) in the name and its fields the prefix (MT_). The
prefixes allow the distinction of different application’s tables inside the database.
GTF_MTR_SCOPE: scopes introduced in Admin Area (Section 4.1.1.4).
•
MT_NAME: name of the scope.
•
MT_DESCRIPTION: short description about the scope.
•
MT_LEVEL: scope depth from the root.
•
MT_PARENT: scope parent.
GTF_MTR_SCOPENT: scope entities introduced in Admin Area (Section 4.1.1.4).
•
MT_PARENT: scope entity parent.
•
MT_NAME: name of the entity.
•
MT_DESCRIPTION: short description about the entity.
•
MT_RESPONSIBLE: person responsible or that manages the entity.
•
DEF_DATE_INIT: start of the time span to visualize results.
•
DEF_DATE_FINAL: end of the time span to visualize results.
•
MT_SCOPEID: ID of the scope this entity belongs.
•
MT_LEVEL: scope entity depth from the root.
GTF_MTR_METRIC: metrics introduced in Admin Area (Section 4.1.1.4).
•
MT_NAME: name of the metric.
•
MT_DESCRIPTION: short description about the metric.
•
MT_ACRONYM: acronym or the metric short name.
•
MT_SCOPEID: ID of the scope the metric was defined.
•
MT_FORMULA: formula of the metric.
•
MT_CHART: type of chart to display metric results.
GTF_MTR_SOURCE: sources and lists introduced in Admin Area (Section 4.1.1.4). These
two objects have almost the same properties. It allows grouping them in the same table.
•
MT_START_CELL: start cell when the source is an Excel file.
•
MT_COLUMNS: number of columns to import when the source is an Excel file.
•
MT_SHEET: sheet when the source is an Excel file.
•
MT_TYPE: ID of the type (1 for Excel, 2 for Project Server, 3 for Manual and 4 for
Data List).
•
MT_NAME: name of the source.
•
MT_TYPE_DESC: description of the type of the source.
•
MT_UNIT_(1-6): name of the numeric units of the source.
•
MT_SOURCE: list parent of the source.
33
CMMI Metrics Solution
•
MT_SCOPE: scope the source was defined.
•
MT_VALIDATION: if the source validates data (don’t allow duplicate values).
•
MT_HORIZONTAL: direction to get Excel data.
•
MT_ENT_COL: column that contains the entities (Excel source only).
•
MT_UNIT_(7-10): name of the text units of the source.
GTF_MTR_MEASURES: single table to store all metric raw data, as explained below.
•
MT_ENTID: entity to which this data was inserted.
•
MT_DATE: date of the data.
•
MT_VALUE_(1-6): numeric values of the measure.
•
MT_UNIT_(1-6): name of the numeric values of the measure.
•
MT_SOURCE: source from where the data was inserted.
•
MT_UPDATE_DT: date of the last update of data.
•
MT_VALUE_(7-10): text values of the measure.
•
MT_UNIT_(7-10): name of the text values of the measure.
GTF_MTR_TARGETS: targets introduced in Admin Area (Section 4.1.1.4).
•
MT_NAME: name of the target.
•
MT_DESCRIPTION: short text about the target and its objectives.
•
MT_METRICID: metric to which values will be compared and present indicators.
•
MT_SCOPEID: group of entities to which the target will be compared and present
indicators.
•
MT_START_DT: start date of the target time frame.
•
MT_END_DT: end date of the target time frame.
•
MT_PERCENT0: value that represents 0% of achievement.
•
MT_PERCENT50: value that represents 50% of achievement.
•
MT_PERCENT100: value that represents 100% of achievement.
•
MT_PERCENT150: value that represents 150% of achievement.
•
MT_PERCENT200: value that represents 200% of achievement.
•
MT_PERCENT250: value that represents 250% of achievement.
•
MT_LIGHT_YELLOW: if the metric value is lower that this, a red light is displayed, a
yellow light is displayed otherwise.
•
MT_LIGHT_GREEN: if the metric value is higher or equal to this, a green light is
displayed.
GTF_MTR_TARGET_ENT: this table establishes the connection between targets and entities.
•
MT_TARGETID: ID of the target.
•
MT_ENTID: ID of the entity.
34
CMMI Metrics Solution
5.2.2
Data Access Class and Methods
Only the DataBase class and its methods access directly the database defined in the previous
section. This class contains several methods to retrieve data (getters) but only the method
UpdateData() writes in the database. It’s used to insert, update and remove data, depending
on the query received by argument.
The list of methods in this class is presented in Figure 5-4.
Figure 5-4
Methods of the DataBase class
35
CMMI Metrics Solution
5.3
Business Logic Layer
This layer implements, as the name says, all the business logic of the application. It connects
the database and other external sources, transforms data and presents results to the user
interface. It was developed in .NET Framework 2.0 (C#), following the object-oriented
programming paradigm. The next subsections will describe the critical and important details
of this implementation.
5.3.1
Object Classes
All these names and classes were introduced in Admin Area (Section 4.1.1.4) when
describing the application requirements. They represent the objects that will map data from
the database in order to organize and retrieve the information. Data encapsulation and hiding
are the two fundamental characteristics of any object oriented programming language. Inside
these classes, data fields were declared as private and provided a set of public set/get methods
to access the data fields (Properties). This is a good programming practice, since the data
fields are not directly accessible outside the class.
5.3.1.1
Scope
The object Scope contains the same fields of the database table described in Database
(Section 5.2.1). It maps the scopes, the main organization to structure and view data.
Figure 5-5
5.3.1.2
Scope class Properties
Scope Entity
The object Scope Entity also contains the same database fields described in Database (Section
5.2.1) and represents the entities explained in Admin Area (Section 4.1.1.4).
36
CMMI Metrics Solution
Figure 5-6
5.3.1.3
Scope Entity class Properties
Metric
This is the only object class that contains Methods, besides Properties. They are used to
calculate metric results.
We call CalculateChilds() that calls recursively Calculate() to return the result of each
entity child. If the entity don’t have children it simply returns the result of Calculate().
Figure 5-7
5.3.1.4
Metric class Methods and Properties
Data List and Data Source
These two object classes are stored in the same database table (GTF_MTR_SOURCE),
described in Database (Section 5.2.1), but in the code are separate. The distinction between
them was also explained in Admin Area (Section 4.1.1.4), and it’s done by the database field
(MT_TYPE).
37
CMMI Metrics Solution
Figure 5-8
Figure 5-9
ListData class Properties
Source class Properties
This group was done because physically, they have almost the same properties and fields,
which can be reutilized, avoiding the creation of a new database table. Logically they’re
completely different because Data Sources represent the inputs of the application and Data
Lists one of its outputs.
5.3.1.5
Measure
This is the elementary object class of the application. A Measure object represents the raw
data like it was inserted in the database (table GTF_MTR_MEASURES defined in Database –
Section 5.2.1). The data of this table is used in Data List and Data Sources to display the
existent metric data that will be calculated to present metric results in the visualization area.
38
CMMI Metrics Solution
Figure 5-10
5.3.1.6
Measure class Properties
Target
This object contains the same fields presented in the Database section (table
GTF_MTR_TARGETS) and represents the targets that will be presented in the start page,
which were explained in Admin Area (Section 4.1.1.4).
39
CMMI Metrics Solution
Target
Class
Fields
Properties
Description
End_date
Id
Light_green
Light_yellow
Metric
Name
Percent_0
Percent_100
Percent_150
Percent_200
Percent_250
Percent_50
Scope
Start_date
Methods
Figure 5-11
5.3.1.7
Target class Properties
Target Entity Pair
This class represents a pair target-entity like presented in the relationship table
(GTF_MTR_TARGET_ENT) in the Database (Section 5.2.1).
TargetEntityPair
Class
Fields
Properties
Entity
Target
Methods
Figure 5-12
5.3.2
Target Entity Pair class Properties
Excel Import
One important requirement was the import of Excel files. There are several different files
defined in QMS and the application should be customizable to import data from all of them.
The following different cases were identified and are supported by the application:
•
Some files have the header in the top of the sheet and the data is aligned vertically, but
others have the header in the left column and data is filled to the right.
•
The entities were another issue analyzed. Some files are filled for a project but others
contain data for several projects, which are defined in a column of the file (or line,
depending of the direction).
•
The date inserted in the database can also be imported from the file. If it has a column
with the word “date” in its name, the date will be automatically imported.
40
CMMI Metrics Solution
•
In some cases it’s also necessary to validate the data uploaded, namely, do not allow
duplicate results for the same entity. If the file was already uploaded, even if with
different data, the application alerts and asks the user if he wants to override the data,
as shown in Figure 5-13.
Figure 5-13
Data validation example
For those reasons, the parameters needed are the range of data (start cell, number of columns
and the sheet), the data direction (horizontal or vertical), the entity column (or none if it will
be selected in the upload), if it should validate and the units to import. When analyzing the
file, only the known columns are imported. If the application detect an unknown unit it alerts
the user that the column was not imported.
The implementation of this feature was done with the Excel Interop Assembly, developed by
the Microsoft, which is very poor in documentation. The examples and documentation
gathered came from discussion forums about ASP .NET and other people with the same
problems and doubts on how to use the library. The learning process was a little hard but at
the end it became easy to implement and integrate with the existing project. The performance
was also a great surprise because the application can import and parse thousands of Excel
lines in less that one second, which was better than we expected.
5.3.3
Project Server Import
Microsoft Project is the official tool to manage projects and individual tasks, reports and work
progress in Qimonda. Project Server contains, this way, a central repository of data this
application needs to present results. If we could fetch it, we would avoid the need of manually
filling more forms or Excel sheets.
The Windows Technologies section has already implemented a service that could fetch this
project information. In this area we had the collaboration of Antero Ferreira to understand
how this could be integrated in the application and if it returns the needed results.
41
CMMI Metrics Solution
This service implements several YODA Services which get information from Project Server,
and return it viaYODA, using a compressed dataset based interface, which can be reused by
other applications. In the next figure we can see an example of querying the service database
trough a console.
Figure 5-14
Querying the service GetReleases
The next figure shows the dataset returned by the service trough the console.
Figure 5-15
Dataset returned by the service
There exists also a C# library to call the services from the code. The dataset returned by the
service was converted to a XML document and then parsed to the desired structure and
inserted in the database.
5.3.4
Math Parser
In Math Parser Tool (Section 3.2) it was described the tools evaluated and the reasons why the
Lundin Mathparser Assembly was chosen to be integrated in the application. The next figure
shows its methods and classes.
42
CMMI Metrics Solution
Figure 5-16
Math Parser Classes and Methods
This library is very complete and implements almost all the functions needed. The only
operation implemented was to count values in the database (function parseCount() in the
figure above). Originally, to get results we just needed to call the function Parse() with two
arguments: the formula (in string) and a Hashtable with the values of the variables (pair keyvalue). For example the formula:
(X + Y) * Z where X=2 and Y=5 and Z=3
could be calculated:
string formula = “(X + Y) * Z”;
Hashtable htable = new Hashtable();
htable.add(“X”, 2);
htable.add(“Y”, 5);
htable.add(“Z”, 3);
Parse(formula, htable);
and it would return the double value 21.
In the example we know what the values of the variables are, but in our case these values are
stored in the database. The representation of the data in the database is similar (see Measure
object and GTF_MTR_MEASURES table in Figure 5-3) where we have the pair unit-value.
43
CMMI Metrics Solution
The solution was then to match this pair unit-value with the pair key-value in the Hashtable.
This way the formula is able to find the values of the variables and calculate the results.
The main difficulty was to include two new operations (count() and countdist()), that
should count the values of a unit in the database. For example the formula count(X > 2)
should get the number of values greater than two from the units X.
The solution was found with regular expressions (regex for short), presented next.
5.3.4.1
Regex
Regular expressions are a compact way of describing complex patterns in texts. They can be
used to search for patterns and, once found, to modify the patterns in complex ways.
Regex offers an extremely powerful way to search, replace, format and extract text data inside
a string using sophisticated search criteria. For example, we can search for whole words, or
find a match with some pattern (e-mails, phone numbers, postal codes, HTML or XML tags,
etc.), and can quickly locate, count, and extract all the occurrences from the searched string.
As we saw the formula is a string and we need to search all occurrences of count() and
countdist() in order to deal with them before sending the formula to the parser. The
expression countdist() should return the number of distinct values from a unit and count()
only the number of values. They could have conditionals inside the brackets and a value to
compare with, which could be numeric or text, depending on the unit. Examples of these
operations could be as follow:
1. count(X)
2. count(days != 8)
3. countdist(X > 3 & Y = ‘fail’ & Z)
The first example should return the number of values from the unit “X”. The second
expression should return the number of values different of eight from the unit “days”. At last
we have the more complex expression, which should return the distinct values of units “X”,
“Y” and “Z”, where the value of “X” is greater than three and the value of “Y” is equal to
“fail”. The regular expression that can extract the desired patterns is presented next, as also,
the result for this example.
((?<prefix>count)?|(?<prefix>countdist)?)\s*\
(\s*(\s*(?<unit>([A-Z]+\s*[A-Z]*\s*))
((?<symbol>\>|\<|\>=|\<=|=|\!=)\s*
((?<number>\d+)|(?<word>[a-zA-Z]+)))?\s*\&?\s*)+\)
44
CMMI Metrics Solution
Figure 5-17
Regular expression result
With this approach we were able to extract the patterns, get these values from the database
and then replace them in the formula. All the expressions needed are now calculated and
interpreted by the math parser.
To support the user, was created a help page with syntax and operation information
[Appendix A: Math Parser Syntax], as showed in Figure 5-18.
Figure 5-18
Formula help page
45
CMMI Metrics Solution
5.3.5
ZedGraph
The reasons behind the use of this charting library were already explained in Charting Tool
(Section 3.3). It is available in a DLL that can be simply included in the project and
implements all methods and controls to develop and manage the chart.
To use the component, we just need to initialize it by the function InitializeComponent()
and then implement the methods to render the graph.
The X axis contains the time span and the Y axis the metric values. The method to calculate
the metric results receives as a parameter the start date and the end date. This way we can
parse the time span and present the evolution chart. When the time span is defined to a year, it
was parsed by months, when defined to a month was parsed by weeks and when defined to
weeks was parsed by days. These parsed values are the intervals in the X axis. The Y axis was
divided in ten intervals, based on the maximum value of the chart.
Five types of chart were implemented (bar vertical, bar horizontal, line, high-low bar and
stick) that can be chosen when creating the metric. When navigating to the visualization area
the user sees the desired chart with the default time span.
In the chart page (Figure 5-25) the time span can be changed as referred, and also there’s an
option to show vertical and/or horizontal grid lines.
5.3.6
Windows Service
The application has to fetch data from databases of other applications and insert in its
database to calculate and present the results. To do this work, it was implemented a timer
based Windows Service that runs once a week and synchronizes this data. This service class is
presented in Figure 5-19.
Figure 5-19
Timer Service Class Methods
The timer approach is the most common method and is probably the simplest to write and
understand. The timer is created in the OnStart() event and the worker function attached to
the timer. DoWork() is the method that contains the code to do the synchronization of data
periodically, when the timer fires.
To install/uninstall the service was necessary the creation of an installer class (Figure 5-20).
When launched, this class installs the service and calls the Timer Service class that fires the
timer.
46
CMMI Metrics Solution
Figure 5-20
Service Installer Class
An important factor to have in mind is the error handling around the "work". If exceptions are
not handled, we'll never know that an error happened, the worker thread will simply die and
the service will keep running normally, unaware that the worker thread has terminated.
The service is working in background and we can’t launch a message to the user if anything
goes wrong. The only way to give some feedback about the work status is logging in the
Event Viewer. There are three types of Event Log messages (Information, Warning and
Error), as we can see in Figure 5-21.
When completed the work successfully, the service writes an information log with the actions
done and the time the work finished. Otherwise, it writes an error message with the time
occurred and the actions not completed.
Figure 5-21
Event Viewer Logs
47
CMMI Metrics Solution
5.4
User Interface
Remembering Functional Requirements (Section 4.1.1), the application contains four distinct
areas as we can see in the start page (Figure 5-22) left menu:
•
Main: the application main page where we can view the actual target values and
indicators.
•
Metrics: this is the visualization area where metric results and charts are presented by
scope.
•
Data Lists: in this area we can upload and list metric raw data, which is stored in the
database and used to calculate metrics.
•
Admin: where the administrator can manage the entire application properties.
Figure 5-22
Targets Page (Application Start Page)
The application main page shows the defined targets, the current metric value for each one of
these targets, the color semaphore indicating the level of achievement and the target
description.
The other three main areas will be presented in more detail in the following subsections.
5.4.1
Metrics Area
This is the main visualization area, where we can see metric results and time evolution charts.
These two cases will now be described with more detail.
48
CMMI Metrics Solution
5.4.1.1
View Results
Results can be viewed by scope or by metric. When viewed by scope, each scope entity
contains the list of metrics defined and its values. The metrics main page screenshot (Figure
5-23) shows this example, where we can see all the metric values for the entity Porto DC.
Figure 5-23
Metrics Main Page
This page shows all metrics for the selected scope (tab menu in the top) and its current value.
The design is aligned with the colors and layout of the common Qimonda’s web applications.
Was also implemented a search field where the user can filter the results by the Entity name.
The top tab menu and the left menu are constructed dynamically and automatically from the
data in the database. The tab menu gets the list of scopes from the database and sorts them by
level. In the left menu we get the list of existing metrics, lists and forms, also dynamically and
always updated. If we remove a metric, for example, it automatically leaves the list in the
menu. These menus were implemented with TabContainer and Accordion Ajax controls,
respectively.
Figure 5-24 shows the other example (by metric) where we can see only the value of one
metric (in this case the metric First Time Right) for all the entities Release.
49
CMMI Metrics Solution
Figure 5-24
5.4.1.2
Results viewed by metric
View Chart
The application support five different types of chart: horizontal bars, vertical bars, line, highlow bars and stick lines.
As described above, results can be seen by scope or by metric. This is also true for the time
evolution chart. In the example of the Figure 5-24 we only need to follow the link in the
release name and we navigate to the chart page (Figure 5-25).
50
CMMI Metrics Solution
Figure 5-25
Chart page
In this page we can change the data range of the chart and select to show grid lines horizontal
or/and vertical. The chart is assigned to a metric and its properties can be changed in the
Admin Area (Section 5.4.3).
5.4.2
Data Lists Area
In this area we can upload and list metric raw data, which is stored in the database and used to
calculate metrics. This menu is constructed automatically from the Lists and Forms in the
database. Because of the feature to upload from different sources, it became necessary to
create different pages to perform these actions, which will be presented next as well as the
data list visualization pages.
5.4.2.1
Import from Excel
As described in Excel Import (Section 5.3.2), when importing data from an Excel file we
should provide the entity to which data will be uploaded (optional if the entity is defined in
the file), the date of the data (also optional if the file has a column namely “date”) and then
browse and select the file to upload as shown in Figure 5-26.
51
CMMI Metrics Solution
Figure 5-26
5.4.2.2
Upload Excel file page
Import from Project Server
When importing data from Project Server, the user only needs to provide the project to fetch
data and, optionally, its releases. Additionally, was implemented a button to update all project
data. It gets all projects and releases from the database and then fetches all the information
from the Project Server, as presented in Figure 5-27.
Figure 5-27
Import from Project Server page
52
CMMI Metrics Solution
5.4.2.3
Manual Insertion
The page that implements the manual insertion of data is the same for all the metrics and is
dynamically constructed. The fields where the user can insert the values are fetched
dynamically from the units defined in the database. In the next figure, we can see an example
of this page where the units defined are “N reworks”, “Artifact name” and “Version”. The
data type to be inserted is also in front of each text box.
The Entity and Date fields are mandatory for all the forms.
Figure 5-28
5.4.2.4
Manual insertion page
Data List Visualization
The visualization of the metric raw data inserted is also constructed dynamically. This page
implements a GridView control and the columns to show are the units defined for the Data
List. The following figure shows an example of a list created with the same units of the Figure
5-28. The fields Entity, Date, Source and Update date are mandatory for all the Data Lists.
It was implemented a search field where the user can filter the Data List by the Entity name
and all tables and data grids of the application can be sorted, simply selecting the link in the
header of each column.
53
CMMI Metrics Solution
Figure 5-29
5.4.3
Data List page
Admin Area
In this area, the administrator can customize the application, creating, editing and removing
all the objects referred in Object Classes (Section 5.3.1). All parameters can be edited inside
the application, avoiding the need to rewrite code if some parameter or configuration has to
change. In the next subsections are presented in more detail these application management
operations.
5.4.3.1
Scope Management
Starting with the insertion of a new scope, the user should introduce the Name, Parent and
Description in the text boxes like in Figure 5-30.
When listing all the scopes, the user can view a table with all the scopes, sorted by its level.
An example of this table is provided in Figure 5-31. The last two columns contain link buttons
to edit and remove the scopes.
54
CMMI Metrics Solution
5.4.3.2
Figure 5-30
New Scope page
Figure 5-31
List Scopes page
Scope Entity Management
The scope entity management operations are similar to scope management. Adding a new
scope entity, the user provides the Name, Responsible, Description, Scope, Parent and
Default View Date. This last input is the default date span to visualize data. When choosing
55
CMMI Metrics Solution
the scope, the field parent is automatically updated, displaying only the possible parents from
the selected scope, avoiding human errors and inconsistencies.
Figure 5-32
New Scope Entity page
The table where the entities are listed (Figure 5-33) contains these attributes, plus two columns
to allow edition and removal.
Figure 5-33
List Scope Entities page
56
CMMI Metrics Solution
5.4.3.3
Metric Management
Adding new metrics has two steps. In the first page the user inserts the Name, Acronym,
Description and Scope, as presented in Figure 5-34.
Figure 5-34
New Metric page
After these actions, another page where the user can insert other type of metric attributes
(Formula and Chart) is displayed. In the right side of the formula text box, the user can view
the formula help page presented in Figure 5-18.
Figure 5-35
Add Formula page
57
CMMI Metrics Solution
The table to list metrics (Figure 5-36) has three additional columns (Edit Formula, Edit and
Remove). When selecting Edit Formula, the user is redirected to the Add Formula page with
the previous values to edit. This way he doesn’t have to fill all the values again.
Figure 5-36
5.4.3.4
Metric List page
Lists Management
When adding a new list, the user should insert the Name, Scope, and the name of all Units, as
presented in Figure 5-37. Units 1 to 6 are numeric and Units 7 to 10 are textual. In these text
boxes were implemented, as we can see, the Ajax AutoCompleteExtender for the user to
know if a unit exists or to help inserting an existing unit.
58
CMMI Metrics Solution
Figure 5-37
New List page
The table to list all the Lists follows the usual layout and presents its attributes, plus the field
Edit and Remove.
Figure 5-38
All Lists page
59
CMMI Metrics Solution
5.4.3.5
Forms Management
When adding a new Form, the user has to provide the Name, Source (Excel, Project Server or
Manual), List, Units and check if we want data validation when inserting data using this
Form. The insertion of Units in Forms is done like in Lists, presented before.
When selecting the Excel value to the Source, additional fields appear (Figure 5-39). These
are the attributes of the Excel import, defined in Excel Import (Section 5.3.2).
Figure 5-39
New Excel Form page
Figure 5-40 presents the Form listing and shows all these attributes in a table.
60
CMMI Metrics Solution
Figure 5-40
5.4.3.6
All Forms page
Targets Management
When inserting a new Target, the user has to provide the Name, Description, Time frame,
Percent values (0%, 50%, 100%, 150%, 200% and 250%) and Light values (Yellow and
Green) and also associate the Target with a Metric and a Scope. The Red Light value is not
needed because it is inferred if the actual value is lower than the Yellow Light value.
Figure 5-41
New Target page
61
CMMI Metrics Solution
When listing all Targets, is presented a table with all the Target attributes, plus the field to
Edit and Remove (Figure 5-42).
Figure 5-42
5.4.4
All Targets page
Data Validation
In order to avoid unnecessary server requests and human errors, the application validates data
in the interface side.
Besides the validation implemented in Forms to insert data (Figure 5-13) the application have
other validations like:
•
All text boxes to insert date have the CalendarExtender Ajax control, inserting the date
in the correct format (Figure 5-32).
•
All required text boxes have the web control RequiredFieldValidator, alerting the user
when some mandatory information needs to be supplied.
•
All the text boxes to insert numeric values have the FilteredTextBoxExtender Ajax
control that only allow the insertion of numbers.
•
All the dropdown lists filter only the possible values, avoiding inconsistencies.
62
CMMI Metrics Solution
6
Results Evaluation
In this section, are analyzed the main results for each of the application layers.
The final results are evaluated in performance, flexibility and user interactivity.
6.1
Data Access
When analyzing the requirements, we realize that if the database model wasn’t completely
dynamic, the success of the application could be compromised. Creating a table, whose fields
could be reused, allowed the complete control of data inside the application, without the need
to create new tables when new metrics are defined.
This approach made the business logic layer development a little more complex but was an
important step to complete all the requirements and to assure that it will respond to the future
needs.
6.2
Business Logic
The main critical points of this layer are the calculation of metric results and the import of
Excel files.
Initially, the calculation of the results was made entirely in the application code. When the
volume of data in the database started to grow, the application became slower and heavy,
processing all the information. One important approach to avoid this was the creation of
dynamic database queries which would perform the bigger calculations and aggregate the
results. When comparing performances of these two approaches, we verified that the
calculation of the results inside the code took several seconds to complete, but a query to the
database was returned in a few milliseconds, even with tables with thousands of lines.
Importing and parsing an Excel file was thought that could have a performance issue but it
was never verified. The application was tested with the biggest file we have, with thousands
of lines, which it has to upload, parse, validate the data and insert in the database. These tasks
were completed in less than a couple of seconds, better than we expected.
6.3
User Interface
The main objective in the development of this layer was the interactivity with the user. For
this reason it was designed to be simple, efficient, intuitive and like the common Qimonda’s
web applications, providing a known work environment. Some of these were only possible
because of the use of Ajax technologies.
The web forms were designed following the best design practices defined by Luke
Wroblewski [Wro08].
The labels are top-aligned, permitting users to capture both labels and inputs with a single eye
movement, resulting in fastest completion times. Only in cases that the vertical screen space is
a constraint, the labels are right-aligned.
The field length provides enough space for the inputs and the content is grouped, using the
minimal visual elements necessary to communicate useful relationships.
63
CMMI Metrics Solution
When an error occurs, it is clearly communicated with a message in top, with visual contrast,
referring which action launched the fault.
The interface was tested with Selenium IDE (Section 3.4.5). This tool records the user actions
and label values displayed. When we run the test, it does the playback (execute all the actions
recorded) and compares the label values with the recorded ones. If these results are the same,
the test passes (Figure 6-1).
Figure 6-1
Selenium test passed
If the results aren’t the expected or it can’t find the control (link, button, text box…), the test
fail (Figure 6-2) and it presents intuitive logs and debug information. HTML, CSS and
JavaScript (including Ajax) were also tested and debugged with Firebug (Section 3.4.6).
64
CMMI Metrics Solution
Figure 6-2
Selenium test failed
65
CMMI Metrics Solution
7
Evolution
Although this project’s scope was limited by the fact that this was an internship project (with
limited time span), it was still possible to achieve an extensible solution, which can easily
cope with future changes and enhancements.
Some features (not included in the initial requirements) were identified but due to the time
constraints not all of them could be implemented.
7.1
Enhancements
Throughout the development, several improvements were identified and implemented. The
first was the possibility of adding a search functionality to the application. We predict that the
amount of data in the database will grow exponentially and the existence of a search field to
improve information access time it’s very useful.
From the database model to the usability of the user interface, all aspects were discussed,
reviewed and tested. The first concern was to deliver a solution with high quality, usability
and performance.
All these factors only were achieved due to enhancements. The database model became
completely dynamic, metric calculations were improved to be performed in less than half of
the time, and the user interface was designed to encourage communication.
7.2
Extensibility
The implementation took in consideration future growth and due to the high modularity
achieved, this project can easily be extended in several of its features.
One such feature, whose extensibility was a requirement for CMMI Metrics Solution, was the
calculation of results. The math library used supports several functions and operations and
other were implemented. For all the existing metrics, it’s possible to define a calculation
formula that presents the correct results. I think it is wide enough to support future
calculations but if other different expressions need to be implemented, it requires a minimal
effort.
All the other aspects of this application are parameterized and can be added and edited inside
the application (Admin Area).
Code is a dynamic linkable library (DLL), which is shared by the User Interface and the
Windows Service.
This modularity permits the modification of system’s behavior at runtime, without needing to
recompile the source code, and also the implementation of new extensions with the minimal
effort required.
7.3
Future Work
There are two identified features that could improve the value and usability of the application.
To avoid the deprecation of performance, the caching of results is an approach that needs to
be carefully analyzed.
66
CMMI Metrics Solution
Another feature, included in the initial project definition was the export of data to Excel. This
feature was out of the project scope due to the time constraints but was identified as a future
improvement.
67
CMMI Metrics Solution
8
Conclusions
After discussing this project’s objectives, its entire development (from specification to
implementation, results and future work perspectives), some conclusions should be drawn, not
only about the project as a software development project but also as part of a curricular
internship program.
8.1
Project
The development of CMMI Metrics Solution was an interesting challenge. It allowed me to
implement the project throughout all phases of the software development process, and verify
the importance of each one of these phases to achieve a solution with the desired quality.
The first phases of this project (Technological Review and Specification, Sections 3 and 4,
respectively) allowed a better understanding on how this project’s main goals could be
achieved and the best planning of activities.
The project’s implementation (Section 5) began shortly after the two previously mentioned
phases, and only a month after this project started there was already a working prototype
(with no calculations and low performance). This prototype was presented to receive some
feedback and discuss if the approach followed was the best way to achieve the main goals.
Some improvements were suggested, which turned out to be very useful to the project’s
success.
The final version of CMMI Metrics Solution fulfilled all the requirements previously defined.
I consider this a successful project that will integrate the new version of QMS (version 2.0),
helping and improving the Measurement & Analysis process.
8.2
Internship
Finishing the undergraduate program at a big international enterprise like Qimonda was a
rewarding experience. It gave me the opportunity to adapt to the enterprise and business
culture as the last step of the Integrated Master in Informatics and Computing Engineering
course at FEUP.
On the first weeks of the internship I had a training program. Qimonda provided an initial
introduction to its organization, factory and manufacturing process. In this period occurred
also a self-training and studying phase about the CMMI model, the QMS and the
development process and tools used at Porto DC. This period allowed me to have a better
understanding of Qimonda’s activities and the DC’s role as part of a larger multinational
organization.
During the requirements definition, several meetings took place to a better understanding on
the project’s scope and specification. Every week during the implementation, I had a meeting
with my supervisor to analyze the status of the project and plan the next steps.
The QM section had several meetings (on a biweekly basis), where I was able to better
understand the nature of its work within the DC’s context. A “team building” activity was
also promoted to help the integration process and allow us to know each other.
68
CMMI Metrics Solution
During the development of the project, the people from different sections at the DC were
always very helpful and open, whenever their help was requested.
As the project came to an end, I presented the solution to Porto DC, discussed some aspects
concerning to its usage and usefulness, and received some very positive feedback.
The internship project was a learning and rewarding experience, and one with which I hope to
have been able to contribute to Qimonda’s Porto DC continued success and development.
69
CMMI Metrics Solution
Bibliography
[Bac07]
Bachtal, E. W. Excel Formula Parsing.
<http://ewbi.blogs.com/develops/2007/03/excel_formula_p.html>, April 2007.
[Cor05]
Corporation, Microsoft. Microsoft TechNet Event Viewer.
<http://technet2.microsoft.com/windowsserver/en/library/ff176dba-52f7-47c2a5dd-97f0d374593a1033.mspx?mfr=true>, January 2005.
[Cor06]
Corporation, Microsoft. .NET Framework Development Center.
<http://msdn2.microsoft.com/en-us/netframework/default.aspx>, January
2006.
[Cor07a]
Corporation, Microsoft. ASP .NET AJAX <http://asp.net/ajax/>, November
2007.
[Cor07b]
Corporation, Microsoft. Excel Primary Interop Assembly Reference.
<http://msdn2.microsoft.com/en-us/library/microsoft.office.interop.excel
(VS.80).aspx>, January 2007.
[Cor07c]
Corporation, Microsoft. .NET Framework Class Library.
<http://msdn2.microsoft.com/en-us/library/system.text.regularexpressions
.aspx>, January 2007.
[Cor07d]
Corporation, Microsoft. Regular Expression Syntax.
<http://msdn2.microsoft.com/en-us/library/1400241x(VS.85).aspx>, January
2007.
[Cor08]
Corporation, Microsoft. Microsoft Office Project 2007.
<http://office.microsoft.com/pt-br/project/FX100487771046.aspx>, January
2008.
[Chr07]
Chrissis, Mary B., Mike Konrad, Sandy Shrum. CMMI – Guidelines for
Process Integration and Product Improvement. 2nd Ed. Addison-Wesley.
January 2007.
[Fol07]
Folha, João. G2DS – Global Generic Disposition System. September 2007
[Gla07]
Glazebrook, John. Open Flash Chart. <http://teethgrinder.co.uk/open-flashchart/>, December 2007.
[Gol05]
Gold, Mike. CodeDom Calculator - Evaluating C# Math Expressions
dynamically. <http://www.c-sharpcorner.com/UploadFile/mgold/
CodeDomCalculator08082005003253AM/CodeDomCalculator.aspx>, August
2005.
[Gom07]
Gomes, Sílvia. Yoda Basics Training Course. December 2007.
[Hew07]
Hewitt, Joe. Firebug – Web Development Evolved.
<http://www.getfirebug.com/>, April 2007.
[Les07]
Lessa, André. CMMI Metrics Solution – Requirements Specification. October
2007.
70
CMMI Metrics Solution
[Lun04]
Lundin, Patrik. Mathparser. <http://www.lundin.info/mathparser.aspx>,
December 2004.
[Pro07]
Projects, OpenQA. Selenium. <http://selenium.openqa.org/>, March 2007.
[Sof08]
Software, TIBCO. TIBCO Rendezvous.
<http://www.tibco.com/software/messaging/rendezvous/default.jsp>, February
2008.
[Wik07]
Wiki, ZedGraph. ZedGraph.
<http://zedgraph.org/wiki/index.php?title=Main_Page>, November 2007.
[Wro08]
Wroblewski, Luke. Web Form Design Best Practices. Rosenfeld Media, March
2008.
71
CMMI Metrics Solution
Glossary
AJAX: Asynchronous JavaScript and XML is a group of inter-related web development
techniques used for creating interactive web applications.
API: Stands for Application Programming Interface. It provides a set of routines that extend
a language’s functionality.
ASP: Acronym for Active Server Pages. It is Microsoft’s web server-side scripting language.
It allows the creation of dynamic web pages.
BPA: Business Process Automation.
CMMI: Capability Maturity Model Integration is a process improvement approach, defined
by the Software Engineering Institute (SEI).
COM: Component Object Model is a platform for developing software in components used to
enable inter-process communication and dynamic object creation in any programming
language that supports the technology.
CPT: Cross Platform Technologies.
CSS: Cascading Style Sheets is a stylesheet language used to describe the presentation of a
document written in a markup language.
DBT: Database Technologies.
DC: Development Center, usually used when referring to Porto DC.
DF: Acronym for Domain Functions (area). The Domain Functions are the main clients of
Porto DC.
DLL: Dynamic Link Library is Microsoft's implementation of the shared library concept in
the Microsoft Windows and OS/2 operating systems.
DOM: Document Object Model, a description on how an HTML or XML document is
represented in a tree structure.
DRAM: Acronym for Dynamic Random Access Memory. It’s a type of random access
memory that stores each bit of data in a separate capacitor. As real-world capacitors are not
ideal and hence leak electrons, the information eventually fades unless the capacitor charge is
refreshed periodically.
EAI: Acronym for Enterprise Application Integration. Is a technology that integrates various
applications that an enterprise has, like Manufacturing execution, Customer Relation Systems,
between others.
ETL: Extraction Transformation and Loading is a process in data warehousing that involves
extracting data from outside sources, transforming it to fit business needs and loading it into
the end target.
GUI: Acronym for Graphical User Interface. It refers to program front-end that allows the
users to manipulate it using different graphical components like buttons and menus.
72
CMMI Metrics Solution
HTML: HyperText Markup Language is a markup language designed for the creation of web
pages with hypertext and other information to be displayed in a web browser.
IDE: Integrated Development Environment is a software application that provides
comprehensive facilities to computer programmers for software development.
IIS: Internet Information Services, the Microsoft Web Server.
IT: Information Technologies.
LAN: Local Area Network is a computer network covering a small geographic area, like a
home, office, or group of buildings.
LGPL: GNU Library General Public License is a free software license published by the Free
Software Foundation.
MA: Measurement and Analysis.
MS: Acronym for Microsoft.
ODBC: Open Database Connectivity provides a standard software API method for using
database management systems.
OS: Operative System.
PIA: Primary Interop Assembly, a type of .NET assembly dealing with interaction between
managed code and COM objects.
QM: Quality Management.
QMS: Quality Management System.
R&D: Research and Development.
Regex: Shorthand for Regular Expression.
SEI: Software Engineering Institute.
SG: Specific Goal.
SP: Specific Practice.
SQI: Software Quality Improvement.
WAN: Wide Area Network is a computer network that covers a broad area.
WT: Windows Technologies.
XHTML: eXtensible HyperText Markup Language is a markup language that has the same
expressive possibilities as HTML, but a stricter syntax, being an application of XML.
XML: Acronym for eXtensible Markup Language which is used to describe the structure of
data. It is widely used to interchange data between applications.
YODA: Stands for Your Own Data Adapter and is the Manufacturing Integration Baseline
backbone. Is the EAI system of Qimonda.
73
CMMI Metrics Solution
Appendix A: Math Parser Syntax
The following table contains the complete list of operations and constants supported by the
Math Parser:
Syntax
All variables should be between brackets in order to preserve the correct
precedence.
Example: (VALUE1 + VALUE2) * (VALUE3)
Variables
A variable is a sum of all units with that name in the Database.
To count the values we should use the expression count() or countdist().
The expression count() is used to count numeric values and countdist() is
used to count distinct values (text and numeric).
Examples: (ACTUAL > 2) is a sum of all units named "ACTUAL" with a value
bigger than 2.
count(ACTUAL > 2) counts all units named "ACTUAL" with a value bigger
than 2.
countdist(ARTIFACT NAME & VERSION & N REWORKS > 0) counts all
distinct artifacts and version with number of reworks greater than 0;
Operations ^
Supported +
/
*
cos
sin
exp
ln
tan
acos
asin
atan
cosh
sinh
tanh
sqrt
cotan
fpart
acotan
round
ceil
floor
fac
Arguments: 2, Precedence: 3
Arguments: 2, Precedence: 6
Arguments: 2, Precedence: 6
Arguments: 2, Precedence: 4
Arguments: 2, Precedence: 4
Arguments: 2, Precedence: 2
Arguments: 2, Precedence: 2
Arguments: 2, Precedence: 2
Arguments: 2, Precedence: 2
Arguments: 2, Precedence: 2
Arguments: 1, Precedence: 2
Arguments: 1, Precedence: 2
Arguments: 1, Precedence: 2
Arguments: 1, Precedence: 2
Arguments: 1, Precedence: 2
Arguments: 1, Precedence: 2
Arguments: 1, Precedence: 2
Arguments: 1, Precedence: 2
Arguments: 1, Precedence: 2
Arguments: 1, Precedence: 2
Arguments: 1, Precedence: 2
Arguments: 1, Precedence: 2
Arguments: 1, Precedence: 2
Arguments: 1, Precedence: 2
74
CMMI Metrics Solution
sfac
abs
log
%
>
<
&&
==
!=
||
!
>=
<=
count
countdist
Constants
Supported
Arguments: 1, Precedence: 2
Arguments: 1, Precedence: 2
Arguments: 2, Precedence: 5
Arguments: 2, Precedence: 4
Arguments: 2, Precedence: 7
Arguments: 2, Precedence: 7
Arguments: 2, Precedence: 10
Arguments: 2, Precedence: 8
Arguments: 2, Precedence: 8
Arguments: 2, Precedence: 11
Arguments: 1, Precedence: 1
Arguments: 2, Precedence: 7
Arguments: 2, Precedence: 7
Arguments: 1 or 3, Precedence 0
Arguments: N, Precedence 0
euler
pi
nan
infinity
true
false
Table A-1
Math Parser Syntax
75
CMMI Metrics Solution
Appendix B: Regular Expression Syntax
The following table, from the .NET documentation [Cor07d], contains the complete list of
metacharacters and their behavior in the context of regular expressions:
Character
Description
\
Marks the next character as a special character, a literal, a backreference, or an
octal escape. For example, 'n' matches the character "n". '\n' matches a newline
character. The sequence '\\' matches "\" and "\(" matches "(".
^
Matches the position at the beginning of the input string. If the RegExp
object's Multiline property is set, ^ also matches the position following '\n' or
'\r'.
$
Matches the position at the end of the input string. If the RegExp object's
Multiline property is set, $ also matches the position preceding '\n' or '\r'.
*
Matches the preceding character or subexpression zero or more times. For
example, zo* matches "z" and "zoo". * is equivalent to {0,}.
+
Matches the preceding character or subexpression one or more times. For
example, 'zo+' matches "zo" and "zoo", but not "z". + is equivalent to {1,}.
?
Matches the preceding character or subexpression zero or one time. For
example, "do(es)?" matches the "do" in "do" or "does". ? is equivalent to {0,1}
{n}
n is a nonnegative integer. Matches exactly n times. For example, 'o{2}' does
not match the 'o' in "Bob," but matches the two o's in "food".
{n,}
n is a nonnegative integer. Matches at least n times. For example, 'o{2,}' does
not match the "o" in "Bob" and matches all the o's in "foooood". 'o{1,}' is
equivalent to 'o+'. 'o{0,}' is equivalent to 'o*'.
{n,m}
m and n are nonnegative integers, where n <= m. Matches at least n and at
most m times. For example, "o{1,3}" matches the first three o's in "fooooood".
'o{0,1}' is equivalent to 'o?'. Note that you cannot put a space between the
comma and the numbers.
?
When this character immediately follows any of the other quantifiers (*, +, ?,
{n}, {n,}, {n,m}), the matching pattern is non-greedy. A non-greedy pattern
matches as little of the searched string as possible, whereas the default greedy
pattern matches as much of the searched string as possible. For example, in the
string "oooo", 'o+?' matches a single "o", while 'o+' matches all 'o's.
.
Matches any single character except "\n". To match any character including
the '\n', use a pattern such as '[\s\S]'.
(pattern)
A subexpression that matches pattern and captures the match. The captured
match can be retrieved from the resulting Matches collection using the $0…$9
properties. To match parentheses characters ( ), use '\(' or '\)'.
76
CMMI Metrics Solution
(?:pattern)
A subexpression that matches pattern but does not capture the match, that is, it
is a non-capturing match that is not stored for possible later use. This is useful
for combining parts of a pattern with the "or" character (|). For example,
'industr(?:y|ies) is a more economical expression than 'industry|industries'.
(?=pattern)
A subexpression that performs a positive lookahead search, which matches the
string at any point where a string matching pattern begins. This is a noncapturing match, that is, the match is not captured for possible later use. For
example 'Windows (?=95|98|NT|2000)' matches "Windows" in "Windows
2000" but not "Windows" in "Windows 3.1". Lookaheads do not consume
characters, that is, after a match occurs, the search for the next match begins
immediately following the last match, not after the characters that comprised
the lookahead.
(?!pattern)
A subexpression that performs a negative lookahead search, which matches
the search string at any point where a string not matching pattern begins. This
is a non-capturing match, that is, the match is not captured for possible later
use. For example 'Windows (?!95|98|NT|2000)' matches "Windows" in
"Windows 3.1" but does not match "Windows" in "Windows 2000".
Lookaheads do not consume characters, that is, after a match occurs, the
search for the next match begins immediately following the last match, not
after the characters that comprised the lookahead.
x|y
Matches either x or y. For example, 'z|food' matches "z" or "food". '(z|f)ood'
matches "zood" or "food".
[xyz]
A character set. Matches any one of the enclosed characters. For example,
'[abc]' matches the 'a' in "plain".
[^xyz]
A negative character set. Matches any character not enclosed. For example,
'[^abc]' matches the 'p' in "plain".
[a-z]
A range of characters. Matches any character in the specified range. For
example, '[a-z]' matches any lowercase alphabetic character in the range 'a'
through 'z'.
[^a-z]
A negative range characters. Matches any character not in the specified range.
For example, '[^a-z]' matches any character not in the range 'a' through 'z'.
\b
Matches a word boundary, that is, the position between a word and a space.
For example, 'er\b' matches the 'er' in "never" but not the 'er' in "verb".
\B
Matches a nonword boundary. 'er\B' matches the 'er' in "verb" but not the 'er'
in "never".
\cx
Matches the control character indicated by x. For example, \cM matches a
Control-M or carriage return character. The value of x must be in the range of
A-Z or a-z. If not, c is assumed to be a literal 'c' character.
\d
Matches a digit character. Equivalent to [0-9].
\D
Matches a nondigit character. Equivalent to [^0-9].
\f
Matches a form-feed character. Equivalent to \x0c and \cL.
77
CMMI Metrics Solution
\n
Matches a newline character. Equivalent to \x0a and \cJ.
\r
Matches a carriage return character. Equivalent to \x0d and \cM.
\s
Matches any white space character including space, tab, form-feed, and so on.
Equivalent to [ \f\n\r\t\v].
\S
Matches any non-white space character. Equivalent to [^ \f\n\r\t\v].
\t
Matches a tab character. Equivalent to \x09 and \cI.
\v
Matches a vertical tab character. Equivalent to \x0b and \cK.
\w
Matches any word character including underscore. Equivalent to '[A-Za-z09_]'.
\W
Matches any nonword character. Equivalent to '[^A-Za-z0-9_]'.
\xn
Matches n, where n is a hexadecimal escape value. Hexadecimal escape values
must be exactly two digits long. For example, '\x41' matches "A". '\x041' is
equivalent to '\x04' & "1". Allows ASCII codes to be used in regular
expressions.
\num
Matches num, where num is a positive integer. A reference back to captured
matches. For example, '(.)\1' matches two consecutive identical characters.
\n
Identifies either an octal escape value or a backreference. If \n is preceded by
at least n captured subexpressions, n is a backreference. Otherwise, n is an
octal escape value if n is an octal digit (0-7).
\nm
Identifies either an octal escape value or a backreference. If \nm is preceded by
at least nm captured subexpressions, nm is a backreference. If \nm is preceded
by at least n captures, n is a backreference followed by literal m. If neither of
the preceding conditions exists, \nm matches octal escape value nm when n
and m are octal digits (0-7).
\nml
Matches octal escape value nml when n is an octal digit (0-3) and m and l are
octal digits (0-7).
\un
Matches n, where n is a Unicode character expressed as four hexadecimal
digits. For example, \u00A9 matches the copyright symbol (©).
Table B-1
Regular Expression Syntax
78