1
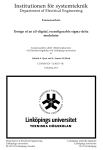
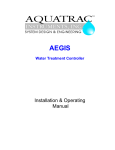
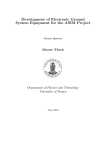
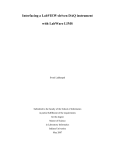
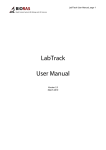
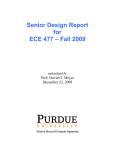
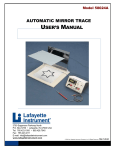
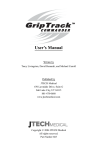
LabMicrobe User Manual, page 1 BioRAS Rapid Analysis Systems for Biology and Life Sciences LabMicrobe Description and User Manual Version 2.0 July 2010 BioRAS LabMicrobe User Manual, page 2 of 23 Rapid Analysis Systems for Biology and Life Sciences LabMicrobe Image analysis environment Table of contents 1. LabMicrobe general information................................................................... 3 2. Installation and startup of LabMicrobe ......................................................... 4 3. On-line help.................................................................................................. 4 4. Tool bar ........................................................................................................ 4 5. Select the sequence execution mode .......................................................... 4 6. Image files and formats ................................................................................ 5 7. Detect edges ................................................................................................ 5 8. Threshold ..................................................................................................... 6 8.1 Threshold for light particles against a dark background ......................... 6 8.2 Threshold for dark particles against a light background ......................... 7 9. Morphology .................................................................................................. 9 10. Dividing – Frequency of dividing cells ...................................................... 11 11. Particle analysis and unit calibration ........................................................ 13 12. Species: The neural network classifier ..................................................... 16 12.1 Training of the neural network classifier ............................................. 16 13. Classify .................................................................................................... 19 14. Results ..................................................................................................... 21 15. The File menu – Saving and loading settings .......................................... 22 16. References............................................................................................... 23 LabMicrobe User Manual, page 3 of 23 BioRAS Rapid Analysis Systems for Biology and Life Sciences 1. LabMicrobe general information LabMicrobe is a specialized image analysis environment designed to fully automate the processing of images of microbes or cells. It is tuned to analyze high quality epi fluorescent images of bacteria, but its open architecture allows easy adaptation to other similar applications. LabMicrobe has interactive facilities for viewing the results of the different stages of image processing, for experimenting with parameters, and for training the internal neural network classifier. Classification of shapes is based on contour. The program works on 8 or 16 bit grey-scale images. LabMicrobe is implemented in LabSequencer; an application platform for sequential execution of program modules. With LabSequencer image analysis can be performed in single steps, as a sequence of steps, or as a loop for automatic analysis of multiple images. LabSequencer allows the user to view every step of the analysis anytime during and after the analysis. Figure 1 shows the main functions of the front panel window. 5. 1. 2. 3. 6. 7. 11. 4. 9. 8. 10. Figure 1. The LabMicrobe front panel, showing an epi-fluorescent test image of beads with known size (Ø = 0.516 µm). 1. File menu: save and load custom settings, print and exit program; 2. Help menu; 3. Sequence of program modules. Modules are disabled until they contain valid data; 4.Execution mode: choose between 3 alternative execution modes: Step (1 task at the time), Run sequence (all program steps in sequence), Loop (automatic analysis of multiple images); 5. Tool bar for the image window for zooming, moving, or simple drawing. In the Classification step, more tools will be available (see below); 6. Image display; 7. Image size information; 8. A path with a source image file or a directory of image files (for batch mode). For BioRAS LabMicrobe User Manual, page 4 of 23 Rapid Analysis Systems for Biology and Life Sciences processing directories, set mode to Loop; 9. Revert button: Revert to the settings in the last saved settings file; 10.Busy light; 11. Run (Execute) button. 2. Installation and startup of LabMicrobe LabMicrobe can be downloaded directly from www.bioras.com. In case of slow internet connections, request a program CD from [email protected]. The downloaded version of LabMicrobe is packaged into a zip file. Installation: 1. Unzip the downloaded LabMicrobe installation file. 2. Double click “Install Lab Microbe” file, and the executable program will be installed in the Programs folder. The “Install LabMicrobe” program is a Windows Installer which installs the program and other components. If you have a previous version of LabMicrobe installed, the installer will actually uninstall the previous version (run the installer again to install the new version). 3. The first time LabMicrobe is run, you will be asked to enter a license key. You can acquire a key from [email protected]. The key will be a permanent license if you have purchased it from Bioras, or you can request a trial key, which will allows you to test LabTrack with its full functionality for a limited period of time. 3. On-line help Most controls have tip strips associated with them. These are pop-up text strips that appear when the cursor is moved over them. Right-clicking on a control also offers a “Description and tip…” dialog, that describes the function of the control. Ctl + h opens a help window which shows the documentation of the control under the cursor. 4. Tool bar To the left of the image window there is a small toolbar, the contents of which depends on the sequence step. The following tools are available: Zoom tab for zooming in, or zooming out (shift, select) Cursor tab Move tab, for moving the image in the image frame Line tab, for measuring distances in pixels, for calibration Particle selection tool, only available in the ”Species” step 5. Select the sequence execution mode Choose the sequence execution mode in the menu to the lower left side: LabMicrobe User Manual, page 5 of 23 BioRAS Rapid Analysis Systems for Biology and Life Sciences After running a sequence, all steps can be viewed and adjusted by simply clicking on the relevant step in the Sequence frame. Choose between three execution modes: 1. Step: goes through the sequence step by step. This mode is useful for adjusting image analysis parameters. Click on the “Go” button for each step. 2. Run Sequence: goes through all steps of the sequence one time. This mode is useful for analysis of single images, after adjustment of the image analysis parameters. Start by clicking on the “Go” button. 3. Loop: a directory of files will be analyzed, and results saved as individual files for each image or in one file, as defined in “Results”. This mode is useful for analysis of multiple images, requiring the same program settings. 4. The settings can be saved (see below) and used for analysis of other similar images. With LabMicrobe any number of settings can be created. 6. Image files and formats The first step in the sequence of program steps is the loading of image files. The program contains a sample image of fluorescent beads against a dark background (Fig.1), that will appear when the program is started for the first time, or if you choose to revert to default settings. Select a file or the directory of files for analysis from you hard drive. The best format for analysis are the non-loss image formats (TIFF; PNG, BMP). LabMicrobe can read and analyze compressed file formats such as JPEG. The result of the analysis will depend on image quality. To load images: 1. Click the folder icon to the right of the file path. 2. A dialog window will appear asking “Choose an image file or directory containing image files” 3. For analysis of a single image, choose the image file on your computer in the dialog window, and click the “Save” button. 4. For loading directories of files choose the file directory on your computer in the dialog window, and click the “Select Cur Dir” button. 5. The image or image directory has been loaded, and is ready for analysis. 7. Detect edges In this step LabMicrobe automatically detects edges by a Marr-Hildreth operation. The Marr-Hildreth algorithm is a method for detecting edges in digital images, where there are strong and rapid variations in image brightness. The Marr-Hildreth edge detection method is simple and operates BioRAS LabMicrobe User Manual, page 6 of 23 Rapid Analysis Systems for Biology and Life Sciences by convolving the image with Laplacian and Gaussian operators, or, as a fast approximation by Difference of Gaussians. Then, zero-crossings are detected in the filtered result to obtain the edges. Figure 2 shows the result of applying the edge detector to bead image. Figure 2. Detect edges sequence step. 8. Threshold In the Threshold step the threshold should be set to isolate particles from the background. In theory, the lower threshold should be Zero after applying the edge detector, but in practice, it can be an advantage to set it slightly higher to remove noise. The setting should be constant for a given camera and light source. Lab Microbe sets the threshold control scale to the smallest and largest grey-scale pixel value in the image. 8.1 Threshold for light particles against a dark background For light particles against a dark background threshold values will be positive numbers. The automatic generated thresholds are positive numbers. BioRAS LabMicrobe User Manual, page 7 of 23 Rapid Analysis Systems for Biology and Life Sciences Figure 3. Threshold sequence step. A lower value of 2 removes large areas of induced noise, leaving the particles o interest isolated. The upper values should be equal or greater to the scale maximum (8805). 8.2 Threshold for dark particles against a light background For analysis of dark particles against a light background, threshold values will be negative (Fig. 6.). Figure 4. Crop of image with dark beads against a light background, analyzed in the example below. BioRAS LabMicrobe User Manual, page 8 of 23 Rapid Analysis Systems for Biology and Life Sciences Change threshold if particles are dark. Particles should be green, with a green halo around. The default values are positive numbers, which should be changed to negative numbers! Invert the default threshold values for dark particles against light background! OBS! The lower number in the lower box! Simply write the new numbers in the number boxes. Figure 5. Changing of threshold values. In this image threshold values should be changed, since particles are dark. With correct threshold setting particles are green, surrounded by a green halo (see Fig. 6). BioRAS LabMicrobe User Manual, page 9 of 23 Rapid Analysis Systems for Biology and Life Sciences Particles should be green, with a green halo around, like shown in this example. Figure 6. Correct threshold setting for dark particles against a light background. In this example the lower number is – 3000 and the higher number –2. 9. Morphology In the Morphology step unwanted small particles in the image are removed by erosion. Each level of erosion removes particles with width in pixels equivalent to twice the erosion level. For example a level of 2 removes particles that are less than or equivalent to 4 pixel widths.The level should be set to remove all but the smallest particles of interest (Fig. 8, 9, 10). Setting the number of erosions to high might result in removal of countable particles, while analysis with a too low number might result in a to high particle count. The number of erosions is by default set to 2. The number should be varied between 1 and 3 in order to find the number of erosions that works best for removing unwanted noise in the image for each type of images. BioRAS LabMicrobe User Manual, page 10 of 23 Rapid Analysis Systems for Biology and Life Sciences Set number of erosions here! Typically between 1 and 3. Figure 7. The Morphology step. The number of Erosions defines the level of removal of small particles in the image. The number of erosions was set to 1, which is too low for this example! Figure 8. The same image with the number of erosions = 1, which is too low for this image. The result shows many extra, unwanted particles. BioRAS LabMicrobe User Manual, page 11 of 23 Rapid Analysis Systems for Biology and Life Sciences The number of erosions was set to 3, which is too high for this example! Figure 9. The number of erosions = 3, which was too high for this image. Countable particles were removed by this operation (compare to Fig. 8 & 9). 10. Dividing – Frequency of dividing cells LabMicrobe can estimate bacterial growth by the frequency of dividing cells (FDC, see Fig. 10, 11)). Lab Microbe defines dividing cells as those containing two intensity maxima (Table 1). Frequency of dividing cells (FDC) can be used as an indication of bacterial growth rate. In order to calculate absolute growth rates from FDC, we recomend calibration of the method with laboratory growth experiments. The FDC method was suggested by Hagström et al. (1979) as an alternative to radioactive tracer methods for estimations of bacterial growth. When the method was developed, dividing cells were counted manually, and good correlation between bacterial growth and FDC was found for natural marine bacteria (Newell & Christian 1981). Good correlations between bacterial growth and FDC were found in samples of marine bacteria counted with LabMicrobe (Blackburn et al. 1998). BioRAS LabMicrobe User Manual, page 12 of 23 Rapid Analysis Systems for Biology and Life Sciences Figure 10. Epifluorescens microscope image of a stained bacterial sample, loaded into Lab Microbe. Figure 11. Dividing cells are marked "1", non-dividing cells are marked "0". LabMicrobe User Manual, page 13 of 23 BioRAS Rapid Analysis Systems for Biology and Life Sciences Table 1. Some examples on non-dividing and dividing cells from a bacterial sample. 0 indicates non-dividing cell, 1 indicates dividing cell. Top row shows crop of original images, bottom row shows images from Dividing sequence. Non-dividing Non-dividing Dividing Dividing 11. Particle analysis and unit calibration In this step each particle is analyzed and given an individual number (Fig. 12). The pixel size is used for calibration, and should be set to the length of a pixel in real world units. If you do not know the pixel size, you can measure the image of a scale bar using the line tool, which tells you the length of the line in pixels (see Fig. 12). For example, if you measure a micrometer scale showing 10 um and the number of pixels is 180, the pixel size is 10 um/180 = 0.055 um/pixel or 55 nm/pixel (since numbers have to be >1). Write this number into the pixel size field (see Fig. 12.B). All results will be given in these untis. The measurement box shows the values of each particle for a given measurement (see Fig 11). A number of factors can be shown, choose between the factors in the measurement: o o o o o o Particle number Area Perimeter Length Elongation Hemsiphererod BioRAS LabMicrobe User Manual, page 14 of 23 Rapid Analysis Systems for Biology and Life Sciences Measurement box, here showing Area. Figure 12. The particle analysis step. BioRAS LabMicrobe User Manual, page 15 of 23 Rapid Analysis Systems for Biology and Life Sciences A. B. Read the line length by clicking on it. Line length in pixels will show up along with the line angle. Set the pixel size here! Figure 13. Calibration of particle analysis can be done by loading an image of a micrometer slidetaken with the same microscope and magnification as the images for analysis (A.). Run Lab Microbe to the Particle analysis step. Measure the pixel size by drawing a line between two bars. Read the length of the line by clicking on it (180 pixels in this example) (B.). Calculate the pixel size: Pixel size = length between bars/number of pixels. LabMicrobe User Manual, page 16 of 23 BioRAS Rapid Analysis Systems for Biology and Life Sciences 12. Species: The neural network classifier LabMicrobe includes a neural network, which enables it to classify organisms based on their contour. In this step, the classification can be trained. A newly trained classification is saved with Settings, just like all other parameter settings. 12.1 Training of the neural network classifier Training of the neural network classifier is done by simply pointing and clicking on a number of organisms from each class. Selection tool Name field, for filling in names. Figure 14. The Species sequence step, with the test image (epi-fluorescent test image of beads with known size). Note the extra tool in the toolbar for selecting particles. Training steps: 1. Fill in the name field (see Fig. 14), with the name for the class or species of particles that will be chosen first. 2. Click on the selection tool (see Fig.14) 3. Drag a square around a particle 4. When moving the cursor over the square, the center will be marked by a cross . The cross marks the particle, make sure that it crosses it. The square can be resized by dragging the corners. 5. Select multiple particles by holding down the control button. BioRAS LabMicrobe User Manual, page 17 of 23 Rapid Analysis Systems for Biology and Life Sciences 6. During particle selection zoom in ( used. ) and out (shift+ ) can be 7. Click on the button. The selected particles will be added to the Example count. After adding one selection, more particles of the same type can be selected and added to the example count. 8. Repeat the procedure for the next class of particles/organisms. This will enable LabMicrobe to recognize more than one type of particles. Examples of classification of marine bacteria according to shape are shown in Figure 15. 9. If the sample contains unwanted particles, that should not be counted, remember to train Lab Microbe with these by creating an “Unknown” or “?” type of particles. 10. When a suitable number of particles have been chosen for each particle type (around 10 – 20 of each type), click the button. Higher number of descriptors renders a better training result (see Fig. 16). 11. A training overview will be shown for a few seconds, showing targets and outputs (Fig. 17). Ideally the output should de aligned with the target. 12. Training can be continued by adding more selections at any time. This can be repeated as many times as necessary. 13. One or several Training sets can be saved (see below). 14. Start a new training set by clicking training sets. , to remove old BioRAS LabMicrobe User Manual, page 18 of 23 Rapid Analysis Systems for Biology and Life Sciences Figure 15. Selection of multiple particles by holding down the control button, for training the neural network classifier. Figure 16. Example of a training set used for the neural network classifier. Images were taken of filtered and stained sea water samples from the Baltic Sea. The objects represent the main classes of bacteria in this sea area (R1 - 3: rods, V: vibrio, X: rejected objects). From Blackburn et at, 1998. BioRAS LabMicrobe User Manual, page 19 of 23 Rapid Analysis Systems for Biology and Life Sciences Figure 17. The contours of objects are defined using Fourier coefficients. The figure shows the levels of details achieved by using different numbers of Fourier coefficients (solid lines). From Blackburn et at, 1998. Figure 18. The training overview window shows up for a few seconds after pressing the “Train” button. Ideally Output should be aligned with Targets. 13. Classify The Classify step shows the classification of particles/organisms according to the neural network classifier. If classifications are not correct, go back to the training step and add more selections. BioRAS LabMicrobe User Manual, page 20 of 23 Rapid Analysis Systems for Biology and Life Sciences Below classification of the bead image and classification of a bacterial sample is shown (Figure 17). A. B. Figure 19. Classification by the neural network classifier for the default bead image (A.) and a bacterial sample (B.). BioRAS LabMicrobe User Manual, page 21 of 23 Rapid Analysis Systems for Biology and Life Sciences 14. Results Results are displayed in table format or as histogram (Fig. 20). Raw data is exported in a format which can be read by Excel or other spreadsheets (Fig. 21). Histograms are only shown internally in LabMicrobe. A. B. Figure 20. Results, displayed as table or histogram showing particle area. LabMicrobe User Manual, page 22 of 23 BioRAS Rapid Analysis Systems for Biology and Life Sciences The data can be exported by clicking the File tab in the Results sequence. Choose a file directory on your hard-disk where results from analysis should be saved. If multiple images will be analysed, choose if the files should be saved individually, or appended to one common file. Individual files will have the same name as the image they are a result of, with the extension .txt. Choose a file directory for saving result from LabMicrobe analysis. Figure 21. Export of data from LabMicrobe. The following data are available: o o o o o Index of cell/particle Cell type (defined by neural network classifier) Area of each cell/particle Indication of whether the cell is dividing or not Volume of cell/particle assuming rod shape, capped by two half spheres1 A number of potentially useful parameters are calculated in addition to these, but they are currently not exported. Contact Bioras to request additional parameters. 15. The File menu – Saving and loading settings For saving settings and Training sets go to the File menu, and click “Save settings” (Table 2). For loading saved settings click “Load settings” in the file menu. For returning to the default settings, click “Default settings”. 1 The cell radius (r) and volume (V) are calculated from Area (A); length, defined as the 2 3 2 longest chord (l): r =[-l + l + A(π – 4)]/(π – 4); V = 4π r /3 + π r (l – 2r) BioRAS LabMicrobe User Manual, page 23 of 23 Rapid Analysis Systems for Biology and Life Sciences LabMicrobe always remembers the last setting, and opens with that. Table 2. The file menu. Saves settings and training sets. Loads the saved settings. Goes back to the default settings Page setup for printing the page Print any sequence Exit LabMicrobe 16. References Blackburn, N., Hagström Å., Wikner J., Hansson R.C., Bjørnsen P.K. (1998) Rapid determination of bacterial abundance, biovolume, morphology, and growth by neural network-based image analysis. Applied and Environmental Microbiology 64(9): 3246-3255 Hagstrom, A., U. Larsson, P. Horstedt, and S. Normark (1979). Frequency of dividing cells, a new approach to the determination of bacterial growth rates in aquatic environments. Appl. Environ. Microbiol. 37: 805-812. Newell SY, Christian RR. (1981) Frequency of Dividing Cells as an Estimator of Bacterial Productivity. Appl Environ Microbiol. 1981 Jul;42(1):23-31.