1
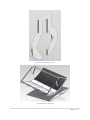
Final Report for Solar Biomass Processing Sponsored by: National Collegiate Inventors and Innovators Alliance (NCIIA) and Boeing In Collaboration with: Kwame Nkrumah University of Science and Technology (KNUST) Version 2.0 May 19, 2012 Prepared by Alexander Nolet (Electrical/ Mechanical Engineering) Henry Wettersten (Nuclear/ Mechanical Engineering) James Davis (Mechanical Engineering/DIS) Peter Carnevale (Mechanical Engineering/DIS) Richard Wolf (Mechanical Engineering) Shuai Yue (Mechanical Engineering) Thomas Schwab (Mechanical Engineering) Project Engineer – Casey Goodwin Chief Engineer – Mark Steiner 0 | P a g e Executive Summary For the biomass project, the team was able to create a working prototype. This prototype consisted of four subsystems: reflector, reactor, frame, and control. The reflector concentrated the sun on the reactor. The reactor then used the heat from the sun to convert biowaste into biochar. The control box was designed to track the sun so that that part of the process would be automated. These four subsystems worked together to create actual biochar. The goal for throughput was 2 lb/hour. This device only made around .5 lb/hr. Though, this device did show that throughput was possible and when this device is used in Ghana, the throughput could increase due to the change in latitude from New York. 1 | P a g e TableofContents
List of Figures ................................................................................................................................................ 5 List of Tables ................................................................................................................................................. 6 Revision History ............................................................................................................................................ 8 Terms and Abbreviations .............................................................................................................................. 9 1. Introduction ............................................................................................................................................ 10 1.1 Report Summary ............................................................................................................................... 12 1.2 User Needs and Problems Addressed ............................................................................................... 12 1.3 Justification for the Project ............................................................................................................... 15 1.4 Project History .................................................................................................................................. 15 1.5 Other Relevant Information .............................................................................................................. 16 2. Project Objectives and Scope .................................................................................................................. 17 3. Assessment of Relevant Technologies .................................................................................................... 18 3.1 Torrefaction ...................................................................................................................................... 18 3.2 Dehydrating Biomass ........................................................................................................................ 18 3.3 Charcoal Stoves ................................................................................................................................. 19 3.4 Solar Concentrator ............................................................................................................................ 20 4. Professional and Societal Concerns ........................................................................................................ 26 4.1 Economic ........................................................................................................................................... 26 4.2 Environmental ................................................................................................................................... 26 4.3 Sustainability ..................................................................................................................................... 26 4.4 Manufacturability ............................................................................................................................. 26 4.5 Health and Safety .............................................................................................................................. 27 5. System Concept Development ................................................................................................................ 28 5.1 Reflector ............................................................................................................................................ 28 5.1.1 Concept Selection ...................................................................................................................... 28 5.1.2 Analysis ...................................................................................................................................... 29 5.1.3 Preliminary Design ..................................................................................................................... 30 5.1.4 Final Design ................................................................................................................................ 32 5.2 Reactor .............................................................................................................................................. 34 5.2.1 Concept selection ....................................................................................................................... 34 2 | P a g e 5.2.2 Background ................................................................................................................................ 34 5.2.3 Analysis ...................................................................................................................................... 37 5.2.4 Preliminary Design ..................................................................................................................... 39 5.2.5 Final Design ................................................................................................................................ 41 5.3 Frame ................................................................................................................................................ 43 5.3.1 Concept selection ....................................................................................................................... 43 5.3.2 Preliminary Design ..................................................................................................................... 43 5.3.3 Final Design ................................................................................................................................ 46 5.4 Control .............................................................................................................................................. 48 5.4.1 Concept selection ....................................................................................................................... 48 5.4.2 Analysis ...................................................................................................................................... 50 5.4.3 Preliminary Design ..................................................................................................................... 52 5.4.4 Final Design ................................................................................................................................ 52 5.5 Process of Use ................................................................................................................................... 57 5.5.1 Design of Use ............................................................................................................................. 57 5.5.2 Initial Use ................................................................................................................................... 58 5.5.3 Daily Setup ................................................................................................................................. 60 5.5.4 Cycle Setup ................................................................................................................................. 60 5.6 Manufacturing and Shipping ............................................................................................................. 61 5.6.1 Manufacturing ........................................................................................................................... 61 5.6.2 Shipping ...................................................................................................................................... 62 6. Final Design Evaluation ........................................................................................................................... 63 6.1 Experimental Design ......................................................................................................................... 63 6.1.1 Testing procedure for temperature measurement in actual system ........................................ 63 6.1.2 Testing procedure for testing spot temperature measure and record ..................................... 63 6.2 Results and Analysis .......................................................................................................................... 64 6.2.1 Throughput ................................................................................................................................ 64 6.2.2 Temperature .............................................................................................................................. 65 6.2.3 Control Power Testing ................................................................................................................ 68 6.2.4 Drivetrain Testing ....................................................................................................................... 69 6.3 Meeting the User Requirements ....................................................................................................... 70 3 | P a g e 7. Conclusions ............................................................................................................................................. 72 8. Future work ............................................................................................................................................. 72 References .................................................................................................................................................. 75 Appendix A: Customer Requirements ........................................................................................................ 76 Appendix B: Test Plans ................................................................................................................................ 80 Appendix C: User Manual ........................................................................................................................... 84 Appendix D: Cost Analysis ........................................................................................................................... 90 Appendix E: Expense Report ....................................................................................................................... 91 Appendix F: Decision Matrices .................................................................................................................... 92 Appendix G: Thermal Analyses ................................................................................................................. 102 Appendix H: Reflector analysis ................................................................................................................. 108 Appendix I: Energy Calculations ................................................................................................................ 120 Appendix J: Torque Calculations ............................................................................................................... 121 Appendix K: CAD Section .......................................................................................................................... 122 4 | P a g e List of Figures Figure 1: A Ghanaian farmer watching dry brush and agricultural waste burn ......................................... 10 Figure 2: Solar Biomass Reactor, Spring 2012 ............................................................................................ 11 Figure 3: Spring 2012 prototype ................................................................................................................. 11 Figure 4: Device Prototype (Summer 2011) ................................................................................................ 16 Figure 5: CAD Model of Proposed Device (Fall 2011) ................................................................................. 16 Figure 6: Possible solar dehydrator design, deemed unnecessary ............................................................. 18 Figure 7: Toyola stove. Image found at: http://www.unep.org/unite/30ways/viewimage.aspx?projectID=40 ....................................................... 19 Figure 8: Previously used solar trough, used for producing electricity. Image found at: http://thefraserdomain.typepad.com/photos/uncategorized/2007/07/28/solar_trough_3.jpg .............. 20 Figure 9: Reflector Surface .......................................................................................................................... 28 Figure 10: Matlab Analysis showing effects of misalignment..................................................................... 29 Figure 11: Analysis for parabola optimization generated by a Matlab Script shown in Appendix H ......... 31 Figure 12: Reflector preliminary design ...................................................................................................... 31 Figure 13: Current reflector design ............................................................................................................. 32 Figure 14: Reactor/Receiver Assembly ....................................................................................................... 36 Figure 15: Decision Matrix (insert/removal methods) ............................................................................... 36 Figure 16: Henry Wettersen shown using the 'hay hooks' to remove the reactor insert .......................... 37 Figure 17: Reactor/Receiver with Insert ..................................................................................................... 37 Figure 18:Thermal FEA Results (sectioned view) ........................................................................................ 38 Figure 19: Thermal FEA Results (full assembly) .......................................................................................... 38 Figure 20: Thermal FEA Results (insert only) .............................................................................................. 39 Figure 21: Reactor (end view) ..................................................................................................................... 40 Figure 22: Reactor (both ends) ................................................................................................................... 40 Figure 23 ‐ Reactor/Receiver Assembly with Insert .................................................................................... 41 Figure 24: Reactor Mounting Bracket ......................................................................................................... 41 Figure 25: Actual reactor showing the mounting bracket .......................................................................... 42 Figure 26: Reflector Sketch (Spring 2012) .................................................................................................. 44 Figure 27: A‐Frame Sketch (Spring 2012) ................................................................................................... 44 Figure 28: Reactor bracket Sketch (Spring 2012) ........................................................................................ 45 Figure 29: Current reflector frame design .................................................................................................. 46 Figure 30: Current frame design (high side) ............................................................................................... 47 Figure 31: Current frame design showing the low side and the support ................................................... 47 Figure 32: Escapement mechanism (Spring 2012) ...................................................................................... 49 Figure 33: PSpice Circuit Schematic ............................................................................................................ 50 Figure 34: Schematic for Torque calculations ............................................................................................. 51 Figure 35: Escapement mechanism (Spring 2012) ...................................................................................... 52 Figure 36: Assembled control box .............................................................................................................. 54 Figure 37: Assembled control box .............................................................................................................. 54 5 | P a g e Figure 38: Circuit logic diagram for control system .................................................................................... 55 Figure 39: Circuit power diagram for control box....................................................................................... 56 Figure 40: The reflector with the top support ............................................................................................ 58 Figure 41: Reactor, top support, brackets, and reflector assembled ......................................................... 58 Figure 42: Entire assembly without the tracking system ............................................................................ 59 Figure 43: The completed device ................................................................................................................ 59 Figure 44: Wooden mold for secure packing and maintaining reflector shape ......................................... 61 Figure 45: Packed Crate in CAD ................................................................................................................... 62 Figure 46: Test A (Temperature) (5/06/2012, 13:30) ................................................................................. 65 Figure 47: Test B (Temperature) (5/06/2012, 15:03) ................................................................................. 65 Figure 48: Test C (Temperature) (5/07/2012, 11:40) ................................................................................. 66 Figure 49: Test D (Temperature) (5/07/2012, 14:53) ................................................................................. 67 Figure 50: Test E (Temperature) (5/12/2012, 9:38) .................................................................................... 68 Figure 51: Pre‐charred processed corn cobs (input to the reactor) ........................................................... 73 Figure 58: Reactor End Cap Results ............................................................................................................ 93 Figure 59: Glass Envelope Results ............................................................................................................... 95 Figure 60: Reactor Insert Removal Method Results ................................................................................... 97 Figure 61: Reactor Insert Results ................................................................................................................ 99 Figure 62: Reflector Material .................................................................................................................... 101 Figure 63: Thermal energy schematic of receiver assembly ..................................................................... 102 Figure 64: Thermal Resistance model (of Receiver Assembly) ................................................................. 103 Figure 65 ‐ Reflector error analysis ........................................................................................................... 108 Figure 66 ‐ Reflector focal length analysis ................................................................................................ 108 Figure 52: Complete CAD Model of the device ......................................................................................... 122 Figure 53: Reactor/Receiver with Insert ................................................................................................... 122 Figure 54: Reactor (end view) ................................................................................................................... 123 Figure 55: Reactor (both ends) ................................................................................................................. 123 Figure 56: Reactor Mounting Bracket ....................................................................................................... 124 Figure 57: Reflector CAD image ................................................................................................................ 124 List of Tables Table 1: User Needs .................................................................................................................................... 13 Table 2: Project history summary table ...................................................................................................... 15 Table 3: Semester Objectives with the matching final outcomes .............................................................. 17 Table 4: Comparison of Reactor Designs .................................................................................................... 35 Table 5: Comparison of Frame Designs ...................................................................................................... 43 Table 6: Test Results ................................................................................................................................... 64 Table 7: Technical Specifications with the wanted value and the actual tested value .............................. 70 Table 8: Full Customer Requirements Table ............................................................................................... 76 Table 9: Cost‐benefit analysis ..................................................................................................................... 90 6 | P a g e Table 10: Overall Expense Report ............................................................................................................... 91 Table 11: Reactor End Cap Matrix .............................................................................................................. 92 Table 12: Glass Envelope Matrix ................................................................................................................. 94 Table 13: Reactor Insert Removal Method Matrix .................................................................................... 96 Table 14: Reactor Insert Matrix ................................................................................................................. 98 Table 15: Reflector Material Matrix ......................................................................................................... 100 Table 16: List of heat fluxes (in Receiver Assembly) ................................................................................. 104 7 | P a g e Revision History Version Date Name Reason for Changes 1.0 5/15/2012 TS Initial document. 1.5 5/16/2012 PC Additions, Revisions, and Review with Casey Goodwin 2.0 5/19/2012 PC Final Report 8 | P a g e Terms and Abbreviations The following terms and abbreviations are used extensively throughout this report and are described here for the reader:
NCIIA – National Collegiate Inventors and Innovators Alliance
CAD – Computer Aided Design
CSP – Concentrated Solar Power
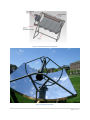
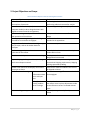
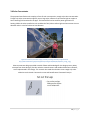
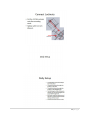
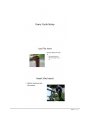
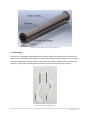
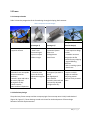
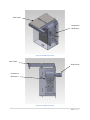
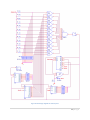
Torrefaction (i.e. torrefy) – Torrefaction (French for roasting) of biomass e.g. wood can be described as a mild form of pyrolysis at temperatures typically ranging between 200 to 320 °C. During torrefaction the biomass properties are changed to obtain a much better fuel quality for combustion and gasification applications (Westenhaus) 9 | P a g e 1. Introduction Fires roar along the side of rural roads in Ghana after harvest, as farmers burn away the useless parts of the crop. For most of these farmers, going to the market to buy charcoal is a painfully expensive ordeal that is forcing Ghana’s continuing deforestation. To support these farmers and Ghana’s economy and ecology, a solar powered charcoal maker is being designed by the biomass group that will take the useless part of crops, and turn them into valuable charcoal. Figure 1: A Ghanaian farmer watching dry brush and agricultural waste burn The system works by using sunlight available during 60% of the year, to heat the biomass in a closed container, at near 300°C for 45 minutes. This turns the biomass into charcoal, which can be used in a number of stoves, particularly the newly popular Toyola stove which reduces charcoal required and smoke released. This project has been developed in the Design Lab since Fall 2010, with more detail on what every team worked on presented in the Project History section. These teams have established the need and viability of this project in Ghana. They have also provided proof of concept in the form of working prototypes. This semester, Spring 2012, finished the project by creating a reproducible prototype and for shipment to Ghana. The design has been divided into four major subsystems: Reflector, Reactor, Tracking System (Control), and the Frame. These four subsystems work in conjunction to convert the agricultural waste into char for cooking or fertilizer use. The char can be pressed into briquettes for stove applications, as needed. Alternatively, the farmer has the option of selling his briquettes for profit for a source of income. After the payback period, the farmer will start to make a profit from selling these briquettes. 10 | P a g e Figure 2: Solar Biomass Reactor, Spring 2012 Figure 3: Spring 2012 prototype 11 | P a g e 1.1 Report Summary This report begins with a discussion of the needs of Ghanaian farmers and a brief project history. Then, the report covers the project objectives expressed at the beginning of the semester and the final outcomes in relation to those objectives. Then, any existing technology that is similar to this new device. This is followed by any political and societal concerns that may arise from the introduction of this product to Ghana. Next, the design process, system evaluation, and specifications will be covered to describe this device. These sections will include: a more detailed account of the history of development of each subsystem, the final design of each subsystem, the intended use of this device, and any testing that was performed to ensure the performance of the device. Engineering specifications will be discussed to prove the repeatability and performance of the device. Finally, recommendations by the design team for the future of this project will be illustrated in the conclusion. 1.2 User Needs and Problems Addressed The end users of this product will be Ghanaian farmers and their families. In particular, the prototype is being created for corn farmers outside of Kumasi, located in southern Ghana. The NCIIA, the primary sponsor, is interested in providing a technology that provides value to these users. While the prototype is designed to use some of the abundance of agricultural waste of southern Ghana, it is anticipated that it could also be implemented in northern Ghana, where deforestation (for charcoal production) and desertification are a large issue. Although the device has been tested with dried corn cobs, any other dry lignocellulose biomass (corn stover, sugarcane bagasse or banana stems) can be used for torrefaction purposes. From this customer review, a number of important customer requirements have been identified, which are summarized in Table 1. A User needs chart containing justification and methodology can be found in Appendix A. Because it is designed to tackle poverty, the most important features of this device are cost, lifetime, and yield. While the specifics of these requirements are elaborated in Error! Reference source not found., the overall goal was to make the device as cheap and long lasting as possible while providing the highest yield, to ensure the greatest value and quickest payback to the customer. It was also important that the device be safe, and, while not essential, strongly preferred that it be simple to use, as ease of use increases the probability that it will be used consistently. Ultimately, ensuring the Ghanaian farmers adopt this device is the final challenge of this project. 12 | P a g e Table 1: User Needs Customer Requirement Technical Requirement Approach Technical Specification Target Value Easy to assemble A Ghanaian farmer can assemble the system All parts needed, included Number of instruments/ parts needed not in crate 0 Parts fit together easily Number of persons required 1 Age of persons required 15‐50 Light weight of heaviest part 40lb Limit actions to use Daily setup steps 3 Number of steps for batch 3 Time to set up for day 15 min time for batch process 15 min limit strength required Lifting weight 20lb weather resistant components are tolerant of wind speeds found in Ghana 20 [mph] Components are tolerant of particles 1000 [ppm] Number of circuits that fail in rain 0 Easy to use A Ghanaian farmer can use the system Limit length of actions Works in Ghana Long lasting Weather resistant Design for operation in Ghana Accurately designed for Ghanaian Latitude Uses correct elevation angle 7.5 degrees north Design to track the sun Tracks continuously Maximum angular error ±1 degree Tracks accurately Maximum difference in angle between reflector and sun 2 degrees Limit areas of wear minimum component life >10 years % of components replaceable in Ghana >90% Lasts long enough to pay for itself Use only long lasting components Prefer repairable/ simple components in design 13 | P a g e Customer Requirement Technical Requirement Approach Technical Specification Target Value Low cost Ghanaian farmers can receive a loan or grant for enough to buy system Reduce number of components Price <$800 Payback Period <10 years Design reactor to hold sufficient biomass Biomass converted per hour 2 [lb/hr] Achieve torrefaction temperature Sustains operational temperature 320 degrees Limit ability to look into reflector Amount of solar intensity that bystanders are exposed to ≤1 [sun] Amount of times you have to look at the reflector to use device 0 [times] Amount of time required to touch a surface capable of burning 0 minutes Use inexpensive components Creates biochar safe creates biochar for use The system does no harm to farmers or their neighbors and families Does not require contact with hot components Many of the requirements of the system are presented in Table 1: User Needs in the customer needs section. The impact of these requirements on the design of the system will be illustrated here. Perhaps the most important component of the design is that the torrefaction unit must produce biochar. In particular, it should produce 2 lb/hr in order to meet NCIIA’s specifications. In order to achieve this, a thermal analysis was performed on the reactor, as described in 5.2.3 Analysis. Further analysis was performed to ensure that sufficient power is provided to the reactor at any given time. It is also important that the design not be prohibitively expensive, and that its payback period not be excessive. Based on payback calculations, for every 100 dollars of the project cost, the payback period can range between .8 – 2.5 years. While this will be difficult to achieve, it can be best achieved by keeping lowest cost solutions in mind, using the cheapest material that will work, and reducing manufacturing costs by using off the shelf components wherever possible. Weather resistance is an important component for functioning in Ghana. In particular the design must be tolerant of dust, wind, and water. This can be achieved by reducing the number of openings in the electro‐mechanical systems, and ensuring all openings are sealed or not exposed. Any components that are exposed must be tolerant of exposure. 14 | P a g e The system should be straight forward to assemble, requiring no more force than a 15‐50 year old can apply. It ought not to take all of someone’s time, and thus, should require no more time operate than 1 hour/day in optimum conditions. It should also not require a complex manual to operate, and thus, the number of steps to use the system should be limited to 5 during use, and 3 to set up. To achieve this, all of the components were chosen to be as light weight as feasible, fit together in a simple way, crate packing was considered extensively, and use was considered at every point in the design process. 1.3 Justification for the Project The goals for the biomass processor are to reduce deforestation in Northern Ghana, to reduce the amount of wasted biomass from agricultural products on Southern Ghanaian farms, and the alleviation of poverty in Ghana. These problems are discussed in more depth in Section 1.1. 1.4 Project History In order to understand where the team is going, it is important to look at the context of previous work. In particular this semester, spring 2012, aims to build on the work of 5 other steams starting in the semester of fall 2010, spanning until fall 2011. The basic objectives, outcomes, and components used this semester are outlined in Table 2. However, of particular note is that much of the information on the user, and feasibility for every component of this project has been shown by past teams. Moreover, past teams have made clear the potential usefulness of this system. Table 2: Project history summary table Team Semester Fall 2010 Goals Review Ghanaian Charcoal Industry Work Done Project purposely Spring 2011 Research Ghana, Analyze Bio oil, purpose business Plan, build Prototype Build a Solar pyrolysis Prototype Test and build tracking system for past prototype Analyze previous designs and work, analyze reactor, and design dehydrating and briquetting processes Business plan, general research, Bio‐oil research Summer 2011 group 1 see Figure 4 Summer 2011 group 2 see Figure 4 Fall 2011 See Figure 5 New Prototype Some testing results showing feasibility, and a tracking system Dehydrating design, briquetting prototype, and new business plan Work Carried Over Initial Problem statement and user groups General Research Troth shape, and basic prototype concepts Concepts for testing, information on tracking accuracy requirements Established feasibility of dehydrating, and light weight frame 15 | P a g e Figure 4: Device Prototype (Summer 2011) Figure 5: CAD Model of Proposed Device (Fall 2011) 1.5 Other Relevant Information The weather patterns in Ghana were considered during the design process. Ghana experiences Sarmahatten, a period of extreme dust and wind, where visibility is greatly reduced and dings, scrapes and dust coating of the reflector may occur. At the same time Ghana is very cloudy, but even with cloudy skies there is still enough solar radiation to operate the solar torrefaction unit. Based on several solar analyses of Ghana, the reactor will not function from October to February, during Sarmahatten, but it will function on most other days when it is merely cloudy. Safety has been considered throughout the design process. Dangers of solar collectors include burning oneself and retinal damage from concentrated sunlight. In particular, use of hay hooks to insert and remove hot inserts, and physically positioning components to make it hard to flash one’s self while operating the system were designed in. These are discussed in more detail in section 4.5, and the process of use is discussed in more detail in section 5.6. 16 | P a g e 2. Project Objectives and Scope Table 3: Semester Objectives with the matching final outcomes Semester Objective Refine Thermal analysis of the reactor and check assumptions of past work Use results of thermal analysis (both manual and computer models) to drive design decisions with regard to reactor materials and geometry Examine and mitigate safety hazards associated with operation of the collector Develop prepossessing, loading and unloading procedures for maximum throughput Design a frame for the collector that is lightweight, easy to repair, and can be broken down for transport Perform energy analysis to determine an accurate cycle time for the reactor Decide on a technique to automate solar tracking Final Outcomes Performing hand calculations and FEA after performing radiative heat transfer analysis System designed using the analysis performed Safety considerations accounted for in final design Device used and user manual created and included in the appendices Frame meets requirements Tested cycle time is consistent with analysis results within 15 min Technique was determined and apparatus was designed and constructed Explore shipping challenges to Ghana, including Proper crate was acquired meeting both cost and export controls international shipping requirements, Shipping is being sponsored by Boeing Create a user manual to accompany the finished Finished user manual included in the crate to prototype to Ghana be shipped to Ghana Conducted tests using different corn cobs sizes Perform real world testing Collect information about for throughput corn cob input size Identify and Developed and constructed a bracket to hold rectify problem the reactor insert in place, adjustments made areas in design to the reflector to ensure it rotated without issue Deliver working prototype to contact in Ghana Finished prototype is ready for shipment to Ghana 17 | P a g e 3. Assessment of Relevant Technologies 3.1 Torrefaction Torrefaction is a process, which involves heating cellulose, commonly wood, to temperatures around 300 °C to produce charcoal. While many other approaches to create charcoal from wood by burning another fuel source to heat the wood into charcoal, this design uses solar energy to process agricultural waste to produce biochar (an effective replacement for charcoal), thus reducing deforestation, lowering energy costs, and allowing for small scale decentralized char production. The process of biochar production requires: Dehydrating biomass and heating it to ~300 °C for ~45min. During torrefaction, a sample of biomass usually loses 25% of its mass, usually through evaporation of water produced during hemicellulose depolymerization (Prins, 2005). 3.2 Dehydrating Biomass Dehydrating agricultural waste is an important first step to torrefaction, because it accelerates the process (by reducing the energy for vaporization of moisture) and reduces the amount of gassing (released gases). Dehydration is a common practice and while there are industrial systems for dehydration, there are some very low tech solutions as well. In particular, the Fall 2011 Design Lab group designed a solar dehydrator; however, simply leaving the biowaste out in the sun on a dry day can have a similar effect and requires no additional hardware. Figure 6: Possible solar dehydrator design, deemed unnecessary 18 | P a g e 3.3 Charcoal Stoves In recent years there have been great improvements to charcoal stoves. The Toyola stove (Wahab, 2011) is a high efficiency, low smoke emitting device. The stove consists of an hourglass design with holes in the middle, which uses convection to reduce smoke and improve charcoal burn. This stove is very appropriate for this design because it accepts relatively loose pieces of charcoal. Figure 7: Toyola stove. Image found at: http://www.unep.org/unite/30ways/viewimage.aspx?projectID=40 19 | P a g e 3.4 Solar Concentrator The purposed torrefaction unit employs a form of solar concentration, trough style solar concentration. Trough style solar concentration typically uses a large solar reflector to concentrate light on a pipe to heat a working fluid contained in the pipe. This heated fluid can be used for power generation or heating. While the solar torrefaction unit excludes the fluid, it does collect light and concentrate it on an absorber tube in a similar fashion to heat biomass. Figure 8: Previously used solar trough, used for producing electricity. Image found at: http://thefraserdomain.typepad.com/photos/uncategorized/2007/07/28/solar_trough_3.jpg Solar concentrator design provided a wealth of data and knowledge for the design process. Many concepts from these designs, like solar selective coated reactors and anodized aluminum reflectors, were implemented in this design. This research also made the decision to use trough style solar collection much simpler, because the costs and benefits were illustrated clearly in 20 | P a g e 21 | P a g e 22 | P a g e 23 | P a g e 24 | P a g e Appendix D: Cost Analysis. 25 | P a g e 4. Professional and Societal Concerns When reviewing the project, the team considered economic, social, political, safety, and environmental issues. 4.1 Economic Based on the personal income statistics of Ghanaian farmers found by the Fall 2011 Biomass team: in order to purchase the designed solar torrefaction unit, Ghanaian farmers would likely have to take out a loan, and pay back the savings from using the unit. This adds an additional level of complexity because of the scarcity of loans in Ghana, the severity with which debtors can be dealt with, and the interest rates charged. Furthermore, it separates Ghanaians from a part of their market place. If this type of solar torrefaction device were widely disseminated, the demand for local charcoal would be reduced. This could cause local charcoal trade within the country to slow. Ideally, it would help Ghanaian farmers, and reduce deforestation. However, this system could hinder traditional charcoal manufacturers and their employees. 4.2 Environmental Because this system allows for alternate, less expensive, streams of biomass to be used, wood from deforestation will be less valuable. It is hoped that this will reduce the amount of deforestation, and slow the increase in dust by maintaining the natural barriers to wind and soil erosion, and reduce potential threats from global climate change by sequestering carbon in trees. If all of the biochar produced replaces the cutting down of trees, by conservative estimates some 80X more carbon will be sequestered than used in manufacturing of the solar torrefaction unit. However, the solar torrefaction unit requires different metals, which could be from questionable sources. The necessary analysis to determine this was of concern to the team, but was beyond the scope of this report. 4.3 Sustainability The system does add a component of sustainability, by reducing the dependence of farmers on distant charcoal supplies. However, it is not clear whether the current manufacturing and shipping processes to create and deploy the unit are sustainable. While the team was largely concerned with sending a working prototype to Ghana, it is hoped that any future teams, and the work of Professor Eglash and his students over the summer of 2012 will take this into account. 4.4 Manufacturability The present system is complex, requiring a large number of components, many of which must be custom made for this design. This means that to deploy the system in mass would require a large and 26 | P a g e complex manufacturing operation for the individual components and that assembly of the system would take a significant amount of time. As a result, much of the work by Professor Eglash’s student workers in the Summer of 2012 will focus on finding a sustainable, and affordable way to replicate the current prototype after testing in Ghana. 4.5 Health and Safety Prolonged viewing of the reflector near the focal length can be hazardous, causing retinal damage. Moreover, the device may reach around 280 [C], which can burn human skin very quickly. As such, safety precautions were taken. Looking into the reactor, while focusing the system for the day occurs at an angle and distance that keeps the user’s eyes safe. Moreover, hay hooks with special coatings are used whenever touching hot components. Also, the team advises the user to use sunglasses or welding goggles and gloves while using the device. Both looking into the reflector near the focus, and touching hot surfaces is immediately painful, and it is hoped that no one will repeatedly make that mistake. However, It is still possible for someone to injure themselves using this system. In particular, the group found that setting up the system and resetting it, particularly for those not doing the resetting are at risk for “Flashing.” It is also possible for people to mistake a cool insert, for a hot one, if not careful. 27 | P a g e 5. System Concept Development The entire system consists of a reflector, reactor, control (tracking), and a frame. This system takes pre‐
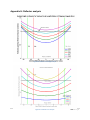
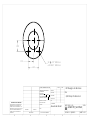
dehydrated corn cobs and converts them into biochar. It does this through a process called torrefaction. The sections below will talk about the Spring 2012 semester’s designs in each of these areas to achieve the goal of creating throughput. 5.1 Reflector The solar reflector is the portion of the unit that collects light from the sun and concentrates it on the reactor. 5.1.1 Concept Selection The reflector’s purpose is to direct solar energy to the biomass being processed to heat it to a temperature range at which torrefaction is accomplished (220 [°C] – 280 [°C]) (Edward S. Lipinsky, 2002). The simplest method to accomplish this heating would be to lay the biomass on a flat plane and allow the sun to heat it until it underwent the chemical conversion. Unfortunately, sunshine is not of sufficient intensity on Earth to accomplish flat‐plane torrefaction as natural convection keeps the temperature too low. In order to reach the desired temperatures, some form of concentration is necessary. Previous groups examined different collection technologies and settled upon a trough design. For the purposes of this discussion, a standard 1 m2 reflector will be used. This means that the projected reflector area normal to the light source (Sun) is 1 m2. Figure 9: Reflector Surface In Ghana, the solar intensity can vary between 550 [w/m2] and 1075 [w/m2] (Asiedu‐Bondzie, 1986), and the analysis presented here will assume an average of 750 [W/m2] in all calculations. 28 | P a g e 5.1.2 Analysis Assuming a reactor load of 1.25 [kg] dehydrated biomass and a reflector area normal to the sun of 2 [m2], and an average solar intensity of 750 [w/m2], the predicted cycle time for each batch of biochar is 48 [minutes]. The cycle time could be as short as 34 [min] or as long as 65 [min], depending on environmental conditions on any given day. The approach used to determine these values is presented in Appendix I. There are two principle modes of error in a parabolic path: offset and angular difference. During day‐to‐
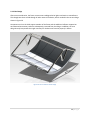
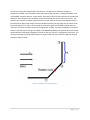
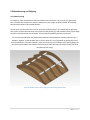
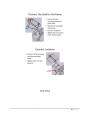
day tracking the collector's difference from the solar azimuth is the principle error. To visualize these errors a Matlab script was written, included in Appendix H, to plot the incident and reflected light, as seen in Figure 10. During the derivation of the governing equations it was found that collector misalignment and angular misalignment at a point on the collector are additive. The first result was that offset error has no impact. The second significant observation was the effect of focal length on the tolerance of angular misalignment. The will be observed in greater detail with a quantitative measure. Figure 10: Matlab Analysis showing effects of misalignment The focal length ratio was minimized to take advantage of the higher tolerance to angular tracking misalignment and collector fluctuations in the collector surface. As the focal length ratio decreases the curvature of the of the parabola increases. As the curvature increases, the stiffness to bending (closing and opening of the parabola) decreases. Bending in the ribs of the collector will result in angular misalignment unless the rigidity of the ribs is increased as well. Decreasing the focal length ratio also increases the surface area of the collector for a given width and length. Both of these factors increase material costs. To compromise on the factors discussed, a focal length ratio of 0.3 was selected. 29 | P a g e The solar angle misalignment is a sum of three parts divided into two categories: offset and speed. Consider the following scenario that illuminates angular offset: The best that the user can set the panel azimuth to is the precision of the discontinuous movement amount of the tracker. During tracking the system waits, then moves the panel a specific amount; this is the maximum variation during tracking. Assuming that the tracker is moving the same average speed as the suns travel through the sky, the maximum error is twice the precision of the tracking system. The precision was selected to be 1 degree. In this case, twice this value results in 25% of the incident light missing the reactor. The remaining requirements are not as exact as those just described. The device should be usable by an individual. This limits the weight and by extension the length of the reactor inserts. Several address the ability of the system to be assembled by two or three people with hand tools. The remaining requirements attempt to address the lifetime of the system. Low cost and lifetime means that the system must be as inexpensive as possible while meeting the previously discussed specifications. Unfortunately the limited time for the testing cycle limits the rigor in showing the lifetime of the system. A consciousness design will have to suffice in this case. The priority for testing is the verification that the system performs its main objective. There are four critical requirements with regard to tracking accuracy and precision: 1) The tracking system shall drive the panel at a nominal speed of 15 degrees/hour. 2) The tracking system speed shall not differ from the nominal speed by more than .1 degrees/hour from the speed at the start of that hour. 3) Maximum periodic variation in Collector and Solar angles during tracking is 1 degree. 4) The collector angle feedback and adjustment shall be designed so that the user can be reasonably expected to set the collector to within 1 degree of accuracy. 5.1.3 Preliminary Design The chosen reflector design is a trough because of the reduced cost and moderate levels of efficiency as appropriate for the customer needs. This decision is a confirmation of the work of previous groups in deciding an appropriate shape through rigorous methods, including decision matrices. However, the exact geometry had yet to be defined. Matlab was used to optimize the reflector shape to reduce cost, while keeping an acceptable level of error, and reasonable height off the ground as shown in Figure 5, the code can be found in Appendix I. These optimizations allowed the group to determine the width, length, and focal length of the reflector. 30 | P a g e Figure 11: Analysis for parabola optimization generated by a Matlab Script shown in Appendix H Based on these results, the geometry was modeled, and then integrated into the rest of the assembly as shown in the figure below: Figure 12: Reflector preliminary design 31 | P a g e 5.1.4 Final Design The “rib sandwich” idea presented in Figure 12 above was attractive because it required no penetrations through the reflective surface, but would have been difficult to assemble in order to assure proper reflector geometry because they upper and lower ribs must be loaded against each other to “pinch” the reflective surface, thereby inducing unwanted strains which will cause error in the parabola’s geometry. In order to overcome this problem, the top set of ribs was done away with and the bottom ribs strengthened. In order to attach the reflective surface to the bottom ribs with a minimum of geometry‐
damaging force, a weather‐resistant adhesive tape was applied to the thin edge of the 0.125 [in] thick ribs and a fillet of silicone lay on either side of the rib‐surface interface. Reflective surface is Alanod Square tube spacers Aluminum ribs Figure 13: Current reflector design Research determined that the preferred reflective material of past semesters, 3M Solar Film, had been discontinued. Besides its unavailability, the solar film has a difficult installation procedure and requires a thick sheet of backing material in order to give the surface structural integrity. In order to address these concerns, Alanod, a high‐polish, anodized aluminum sheet, was used as the reflective surface. The Alanod is 0.5 [mm] thick, making installation easier than the flexible film, and it is available both domestically in the United States as well as through international dealers in Africa. Because the Alanod was only available in 24 [in] x 48 [in] sheets, three pieces would be needed to cover the 48 [in] x 65 [in] 32 | P a g e reflector. In order to abate any misalignment problems where the three sheets meet, a piece of 0.032 [in] thick aluminum sheet the size of the entire reflector was used as a substrate between the ribs and Alanod. The same weather‐resistant tape mentioned above was used to join the Alanod and this aluminum backer. In order to provide structural rigidity of the reflector upon removal from the frame (as is necessitated during shipping), the ribs are spaced apart by pieces of 1 [in] x 0.072 [in] square box tube 11.875 [in] long with 3/8‐16 threaded rod running through the tube segments and across all five ribs. Nuts are threaded on the rod where it protrudes from the outermost rods, allowing the entire structure to be drawn together by tension on the threaded rod. Five of these rod/tube assemblies are used on the reflector. 33 | P a g e 5.2 Reactor The reactor is one of four components, reflector, reactor, tracking system, and frame. In this section the concept selection, analysis, and design of the reactor will be reviewed. The reactor is the portion of the unit that absorbs sunlight and transmits the energy, in the form of heat, to the biomass, thus charring it. 5.2.1 Concept selection The Reactor is the portion of the solar torrefaction unit that stores the biomass, absorbs the concentrated light, and heats the biomass. 5.2.2 Background An effective biomass converter absorbs most incident solar radiation and emits little energy in the form of reflected or re‐radiated light. The reactor is at the center of the device; the primary goal is to produce char from biomass. An efficient reactor continuously maintains good chemical conversion throughout its daily and yearly use. Previous semesters developed a variety of concepts for the reactor (See Table 4). Most of these methods suggested (i.e. ‘Silvering the inside of the glass envelope’) had not undergone full analysis and, upon further review, were determined to be infeasible within the budget constraints. Moreover, all of the proposed designs were focused on achieving reactor temperatures appropriate for flash pyrolysis (Temperatures ≥ 340 [°C]). This has been deemed unnecessary because the team is no longer considering biogas or biooils as end products. For the chemical conversion of biomass to char, a range from 250 [°C] to 300 [°C], the temperature range for torrefaction, is sufficient. This semester’s design—
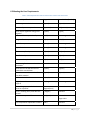
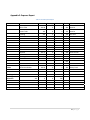
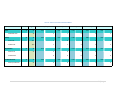
the culmination of two years of work—focuses on maximizing thermal efficiency in order to minimize footprint and shrink the payback period. 34 | P a g e Table 4: Comparison of Reactor Designs Fall 2011 Fall 2011 Team Fall 2011 Team Spring 2012 (Concept I) (Concept 2) (Concept 3) (Current Design) Double glass insulation Silvering Glass Threaded Absorber Pros: Pros: Pros: Pros: ‐ Less radiative and convective losses ‐ Reflects radiative losses back to absorber ‐ Increases radiative absorption area ‐ Least expensive design, to date ‐ Selective Coating maximizes solar absorption (w/ protective clear coat) ‐ High transmission/ durability glass ‐ Glass protection (end caps, bars above receiver) ‐ Insert increases throughput & lifetime (no deposition on inside of absorber) Cons: Cons: Cons: Cons: ‐ Expensive ‐ Purely Conceptual (not implemented or tested) ‐ Double walled insulation unnecessary ‐ Can’t be operated by one person ‐ Costly (≥ $3500) ‐ Purely Conceptual (not implemented or tested) ‐ Not possible for this length of glass tube ‐ Threading is costly ‐ Can’t be operated by one person ‐Expensive ‐Not manufacturable in Ghana ‐Materials not available in Ghana 35 | P a g e Figure 14: Reactor/Receiver Assembly The reactor design is focused on creating the most thermally efficient device possible, in order to achieve a maximum throughput and quality of product (biochar). This requires a solar selective coating on the absorber and glass enclosure to prevent large convection losses. The design is focused on being very user‐friendly. Determining the proper loading/unloading mechanism was not trivial. To assist in the decision, a decision matrix was constructed (Figure 15). The double hay hook was determined to be the most fitting application. Cat Wt. Weight Threaded Pole & Hay Hook Double Hay Hook Umbrella Spear Ball Detent Spear Permanent Handle
25
25
0.02
0.01
0.05
0.04
0.01
25
2
1
5
4
1
0
0
0
0
0
25
25
0.02
0.04
0.05
0.06
0.03
Safety
Direct risk
12.5
1
3
1
1
1
Indirect risk
12.5
1
1
4
5
2
0
0
0
0
0
25
25
0.12
0.14
0.12
0.12
0.07
Ergonomics
Ease of use
25
6
8
6
6
7
Intuitiveness
6
6
6
6
0
Consistency
0
0
0
0
0
25
25
0.06
0.08
0.01
0.01
0.04
Production level
Ease of production
25
6
8
1
1
4
0
0
0
0
0
0
0
0
0
0
0
0
0
0
0
100
Total
0.22
0.27
0.23
0.23
0.15
Cost
Predicted costs
Figure 15: Decision Matrix (insert/removal methods) 36 | P a g e Figure 16: Henry Wettersen shown using the 'hay hooks' to remove the reactor insert The figure below shows the overall assembly of the reactor/receiver including the insert. Figure 17: Reactor/Receiver with Insert 5.2.3 Analysis Figure 16‐18 show the results of the Thermal Finite Element Analysis performed on the reactor (Note that this is a steady state simulation). At Steady State the reactor reaches 280 [°C], which is the ideal temperature for torrefaction (Edward S. Lipinsky, 2002). This calculation however assumes a rather conservative incident solar irradiation (85% of average solar radiation). For an overview of the assumed 37 | P a g e heat fluxes, used in this model, along with a map of the thermal resistances see Appendix C. Moreover, additional thermal analysis was performed using an EES (Engineering Equation Solver) Script (see Appendix C). Both analyses yield very similar results, setting the core temperature at about 280 [°C]. Figure 18:Thermal FEA Results (sectioned view) Figure 19: Thermal FEA Results (full assembly) 38 | P a g e Figure 20: Thermal FEA Results (insert only) 5.2.4 Preliminary Design The new design consists of a thin‐walled (0.060 [in]) copper pipe (Absorber) coated with a high absorbance coating (emissivity=97 [%] (AET Solar, 2011)) for increased solar radiation absorption. This special coating covers two requirements at once: it ensures that a maximum of the incoming solar energy is absorbed – and subsequently only a small amount is lost to the annulus (air). A tubular glass envelope (Figure 14, Figure 17) encases the entire reactor assembly in order to reduce convective losses from the aforementioned copper reactor. It rests on neoprene O‐rings embedded into the steel reactor end caps. The glass chosen for the receiver application is Schott DURAN® 8330 Tubing (Decision Matrix: Appendix F). Besides its excellent physical (optical) characteristics, it has proven its performance in various Concentrated Solar Power applications (CSP) (Nevada Solar One (Acciona, 2007), Solel Mojave Desert Project (NREL, 2011)). A novel proposal in this semester’s design is the addition of a reactor insert; this insert acts as a shuttle for the biomass, allowing easier and safer loading/unloading and thereby increasing the throughput compared to the existing prototype. Multiple (at least two) inserts allow the user to unload and reload a charge of biomass while another batch is running. In addition to the increase in throughput, this new component eliminates the deposition of char on the inside of the reactor tube, which over time substantially decreases the thermal efficiency of the reactor. 39 | P a g e Figure 21: Reactor (end view) Figure 22: Reactor (both ends) 40 | P a g e Figure 23 ‐ Reactor/Receiver Assembly with Insert
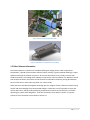
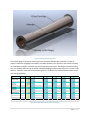
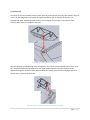
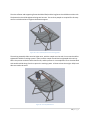
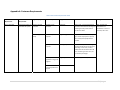
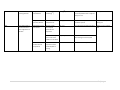
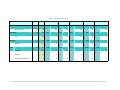
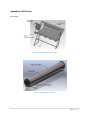
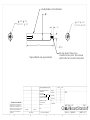
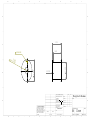
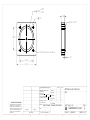
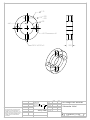
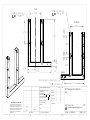
5.2.5 Final Design The reactor is suspended using mounting brackets, which simplify the attachment to the reactor and allow it to slide along the reflector support to account for seasonal elevation changes of the sun. Figure 24 shows a single support bracket. Also, a bracket was constructed to hold the insert in place during processing. This bracket was designed to swivel out of the way of the insert during removal. Figure 24: Reactor Mounting Bracket 41 | P a g e Figure 25: Actual reactor showing the mounting bracket 42 | P a g e 5.3 Frame 5.3.1 Concept selection Table 5 shows the progression of the frame design through the Spring 2012 semester. Table 5: Comparison of Frame Designs Summer 2011 Team Fall 2011 Team (Prototype 1) Fall 2011 Team (Prototype 2) Spring 2012 (Current Design) Pros: ‐ supports reflector Pros: ‐ Steel frame ‐Featured a gear system to adjust reflector angle Pros: ‐ Communal System offsets cost ‐ Sliding Reactor ‐ Steel frame Pros: ‐ Least expensive design, to date ‐ A modular structure designed to be flat packed for easy shipping ‐ Angled & Sliding Reflector ‐ Built in tracking system
‐ Steel frame Cons: ‐ Wooden frame susceptible to extreme weather conditions ‐ Locked in place and had to be actively adjusted throughout the day ‐ Labor intensive ‐ Non‐modular & Expensive Cons: ‐ Locked in place ‐has to be actively adjusted throughout the day Cons: ‐ Conceptual (not built or tested) ‐ No angled panel ‐ Non‐modular ‐ Locked in place and had to be actively adjusted throughout the day Cons: ‐requires multiple people to assemble ‐Adjusting reactor position slowly removes paint 5.3.2 Preliminary Design The preliminary frame concept and the accompanying A‐frame concept were initially hand‐sketched (Figure 26, Figure 27). These drawings served as the basis for the development of future design alterations and CAD implementation. 43 | P a g e Figure 26: Reflector Sketch (Spring 2012) Figure 27: A‐Frame Sketch (Spring 2012) 44 | P a g e To account for seasonal elevation changes of the sun, the reactor must be able to shift its position axially. Without this possibility, a large portion of the light misses the reactor during certain times of the year. A bracket was designed that uses the existing bolt pattern of the receiver end caps to attach itself to the assembly. The bracket rests on square tubing, passing over the receiver. Figure 28: Reactor bracket Sketch (Spring 2012) 45 | P a g e 5.3.3 Final Design After some consideration, the frame structure was redesigned to be lighter and easier to manufacture. This thought was then carried through all other areas of the device, which resulted in the current design shown in Figure 29. Components such as the third support member of the frame and the additional reflector support bar were deemed unnecessary and were subsequently removed from the design. In addition, the new design already incorporates the angle necessary for the device to function properly in Ghana. Figure 29: Current reflector frame design 46 | P a g e Figure 30: Current frame design (high side) Figure 31: Current frame design showing the low side and the support 47 | P a g e 5.4 Control The tracking system is one of four components, reflector, reactor, tracking system, and frame. In this section the concept selection, analysis, and design of the solar reflector will be reviewed. The solar reflector is the portion of the unit that collects light from the sun and concentrates it on the reactor. 5.4.1 Concept selection The initial concept for the tracking system was carried over from the previous design. It utilized a differential voltage from two small solar cells as in the sensory input from the sun. A large solar cell recharged a battery. The battery was used to power a motor which turned the collector. A simple analysis of a crosswind motivated the torque specification for the tracking system. With this essential requirement an estimate of the cost of such a system was performed. The cost for each component was bracketed with a minimum and maximum cost value determined through the research into possible vendors. The final result was that such a system could comprise 1/3 of the budget of the entire system. The large fraction of the total cost just to keep the system pointed at the sun raised doubts as to whether precious groups' choice of a motor‐based drive was an appropriate choice. As the majority of cost came from driving, two alternate techniques were presented: A wound spring or falling mass. These concepts focused on the fact that the user must interact with the system to load and unload the biomass. Therefore, at a minimum of added effort by the user, the tracking system can be reset. The falling mass was preferable across the board. First and foremost the mass does not necessarily have to be shipped with the device, as the weight requirement can be satisfied by a small bucket of sand, a piece of scrap metal, or even a rock. On the other hand, the spring would have to be designed and built to last the life of the system. It would have resistant to the elements or small enough to be enclosed in a container. A constant torque output is preferable to a linear or higher order spring, as the driving torque can sit near the rated output torque of the gearbox. Thus, for the reasons of cost and an unvarying input torque a falling mass was selected as the power source. There is a small weight of 20 [lb] attached to a single pulley. A cable runs down from its attachment point on the base, through the pulley on the weight and back up to a 1.5 inch drum. This drum has a built in handle. This handle allows for the simultaneous resetting of the falling mass and the collector to East. The drum is attached to an axle which passes through a shaft seal, a sleeve bearing and finally, the side wall of a GI .50 Cal Ammo Box. The shaft seal limits contaminants into the sleeve bearing and/or the tracking container. This input shaft continues into the box and through the input side of a 60:1 right angle worm drive gearbox. Attached to the input shaft, inside of the container is an escapement wheel pictured below. The escapement wheel allows the user to crank the panel back to the East each morning during the setup of the system. During this operation, the followers simply spring out of the way. Conversely, the followers hold the wheel in placed against the torque provided by the drum and weight. 48 | P a g e The followers are actuated once every four minutes; the escape wheel moves 60 degrees each actuation. Through the gear reduction, this results in a panel movement of 1 degree. This keeps the panel moving at an average speed matching the sun (15 degrees/hour). While, a fully mechanical clock could easily keep time, this is a challenge to the actuation of the escapement. With the proposed rated torque there is 5 [lb] of friction on the head of the follower. There were two main considerations for the possible selection of a fully mechanical timer and actuation: part replace‐ability and reliability. A mechanical clock would increase the number of mechanical components. These components require precision to maintain the timing necessary to keep the collector pointed at the sun. Clockwork mechanisms have been around for hundreds of years. What is less common is their ability to discontinuously actuate another mechanism with a high force with respect to the clock size. The alternative was to use electrical timing. Electrical timing was chosen because of its robustness. Figure 32: Escapement mechanism (Spring 2012) The first method for actuating the follower was a solenoid. It is one of the simplest electromechanical devices. The sharp actuation was desirable due to the limited travel necessary to completely disengage the follower from the escape wheel and to overcome the static friction. During part selection, this was deemed not a viable option because solenoids are primarily rated for 1/10 or 1/100 of the necessary force. A solenoid that met the force requirement with margin mostly like exists, but the large power requirement makes it uncommon and therefore not cost effective. A motorized actuation was researched next. 49 | P a g e There are several choices of motor in general: servomotor, stepper motor and a plain motor. The choice of actuating the followers with a cam lessens the precision of closed loop control of the motor. A stepper motor or servo could actuate via a coupled link (not traversing a full rotation). However, one full rotation of a cam would actuate the followers as needed. All that is needed is to turn the motor on and off when it completes its rotation. A DC motor was preferable to a stepper or servomotor for cost reasons. A limit switch provides the necessary feedback. From the start of the design of the mechanism, there was only the minimum of one follower. The transition from a quick actuation to a slower one raised the concern of the follower not catching the escape wheel. There is a large degree of uncertainty as to whether or not this is actually an issue. It requires knowledge of the acceleration of the escape wheel. The escape wheel is accelerated by gravity but retarded by friction in countless areas as well as the inertia of the system. In order to add reliability, an additional follower was added. It is actuated out of phase of the first follower. The reliability of the mechanism is just as important as the tracking accuracy. If the tracking misses an actuation the collector the amount of that move (1 degree) will be added to the existing misalignment. Verifying that the mechanism catches reliably is a key testing area for the tracking system. Figure 33: PSpice Circuit Schematic 5.4.2 Analysis The solar day varies from the mean solar day by ~0.035% over the course of a year. If the maximum useable angle of the sun is ±45 degrees from high noon, then this will at most result in an error of .05 degrees at the end of the day. The tolerance for the tracking timing was determined similarly. If a misalignment of .6 degrees is tolerable at the end of the day (6 hours of run‐time), then the speed can vary as much as ±.1 degrees/hour or .67%. This assumes that the user never verifies the tracking accuracy during the day, but sets it accurately in the morning. The timing circuitry will be constructed to be adjustable within these limits. Testing will be performed to ensure that the temperature influenced variation in the timing does not exceed these values. 50 | P a g e The control circuitry was iterated upon several times. The goal was to reduce the number of components needed. The final design, shown below uses a dual 555 timer, a 7400 (dual NAND), 7410 (triple NAND), a power transistor, system switch, limit switch, solar cell and a selection of resistors and capacitors. The controller works as follows. An S‐R flip flop holds the current state of the motor. The output of this controls the power transistor which runs the motor. A brief low pulse (approximately ½ the period of the gear motor output) from the unstable oscillator (the right 555) sets the motor to ON. The motor begins to run. After a short period the limit switch goes from CLOSED to OPEN. After yet more time, the short clock pulse ends and clock goes back to HIGH. The motor completes its revolution and trips the limit switch, setting it to CLOSED. The NANDed combination of the clock HIGH, limit switch HIGH and motor ON enables the trigger of the 555 on the left. This 555 is configured as a one‐shot. The output pulse resets the S‐R flip flop, thereby turning the motor off. The system then waits for another LOW pulse from the clock. Figure 34: Schematic for Torque calculations 51 | P a g e 5.4.3 Preliminary Design As shown by previous groups, researchers the torrefaction unit cannot function without solar tracking. While previous groups used a motor, it was determined, after much discussion, which a longer lasting and cheap solution would be to use a small electrical escapement and weight system. This weight driven system, as seen Figure 35, consists of an escape wheel, release mechanism and a cam control. Figure 35: Escapement mechanism (Spring 2012) 5.4.4 Final Design The desired operation of the system is to drive the solar panel at an average speed of precisely 15 degrees per hour. The panel is driven by a falling weight; the controller allows the input to rotate 60 degrees. This is accomplished by actuating the panel 1 degree every 4 minutes. Crystal oscillator Y1, generates a 4 MHz clock signal. This is connects to a 24 bit clock divider, U2. The divider outputs seven signals, the clock input divided by 218, 219, …, 224. These signals range from 15 Hz to .2 Hz. Each of these signals is connected to a pin on a seven pin DIP switch, SW2. SW2 is used as to select an appropriate usable signal. In typical operation, just one switch is set high. The output side of SW2 is wired together and connects to 12 bit and 7 bit counters, U3 and U4, respectively. U3 is used for the principle timing of the device. U4 is used as an override for the limit switch. Each of the 12 outputs of U3 connects to a pin on dip switch SW3, through a resister to regulated +5 Volts and to an input of an OR gate. Each of the OR gates U5, U6, and U7 allow for the selecting of number of the 52 | P a g e counting. Since the other side of SW3 is connected to ground, when it is ON, that bit is active during counting, otherwise it is masked. With the switch OFF, the input to the OR gate is pulled HIGH; the output of any input OR'ed with HIGH is HIGH. Each output of U5, U6, and U7 connect to 13 input NAND Gate, U8. Because there are 12 outputs from the OR gates and 13 Inputs, one is doubled up. U8 connects to inverter U9. When this signal goes HIGH, many things happen in quick succession. This trigger resets U2, U3, U4, the clock divider and the counters. Since the 12 bit counter is reset, the reset propagates through the OR gates, NAND gate and inverter. This trigger is only HIGH for a few hundred nanoseconds. The trigger also turns R‐S flip flop 2 (FF2) ON, and resets flip flop 0 (FF0) on U10. FF2 is controls the state of the motor. FF0 stores the state of the 7 bit counter. Once 7 bit counter, U4 is reset, it begins to count anew. Each of the seven outputs of U4 is connected to dip switch SW4. This is a selector; it passes through a specific count to the SET of FF0. This is used to ensure that the motor is not prematurely turned off when it is turned on and the limit switch is still depressed. The output of FF2 connects to the gate of MOSFET Q1, which controls the operation of the motor. See the section on the power aspect of the electronics for a description of that portion of the circuit. The motor starts to turn counter clockwise releasing the limit switch. Then the count is reached in U4 and FF0 is set. The cam connected to the motor moves the followers allowing the catch wheel to rotate 60 degrees. The cam completes its revolution and depresses the limit switch. The motor enable, output of FF2, the limit switch and output of FF0 are AND'ed together by 3 input AND gate U11. The output of this resets the motor enable, FF2. Two 6 Volt photovoltaic panels PV1, and PV2 provide to the power to the electronics. Each of the panels has a Shottkey diode across it, D1 and D2 respectively. These are used for balancing of the solar cells and safe discharging of the capacitor bank. PV1 and PV2 are connected in series to provide the 12 Volts needed to run the motor, MG1. Connected in series to +12 Volts and Ground are 5 capacitors C1 – C5 and 5 Zener diodes, D3 – D7. The zen er diodes are each connected across a capacitor. The Zener diode provides over‐voltage protection for the capacitors. The capacitors are setup in series because electrolytic capacitors have a small maximum allowable voltage. The equivalent capacitance of the bank is 1F. Toggle Switch SW1, mounted to the side of the box controls power to the motor as well as to DC‐
DC converter, U1. U1 converts a voltage up to 38 Volts to regulated 5 Volts. No external capacitors are needed for smoothing. A shottkey diode of the same type as mentioned previously is connected across the motor to protect the circuit from back EMF. 53 | P a g e Solar Panels Escapement Mechanism Figure 36: Assembled control box Solar Panels Output Shaft Escapement Mechanism Figure 37: Assembled control box 54 | P a g e Figure 38: Circuit logic diagram for control system 55 | P a g e Figure 39: Circuit power diagram for control box 56 | P a g e 5.5 Process of Use The process of use section roughly details how one uses the solar torrefaction system. Many of these details are included in the User Manual in Appendix F. The method of operating the device breaks roughly into three categories, initial setup, daily setup, and cycle setup. The initial setup involves removing the device from the crate and assembling it to a usable state. Daily set up is what must be done to use the system for a day. Cycle set‐up occurs multiple times each day and involves the loading and unloading of each batch. 5.5.1 Design of Use The goal for usability was that the system be simple and quick to use so as to gain acceptance in Ghanaian society. The most time intensive action is the initial setup. This is outlined in the User Manual in Appendix C. The system set up for the day is simple, requiring that the user simply turn a crank to rotate the reflector back into starting position. It is clear when it is starting position because the shadow of the reactor and its supports fall on a black line. In order for the reactor to be easily rotated, the bucket should be removed, and reattached. This step is not imperative, but it should be easily remembered when it is difficult to turn. The crank was placed on the high side, so that it’s less likely that someone could be “flashed” with sunlight, while correcting position. The process of loading and running a cycle was designed to be simply requiring no more than loading and unloading, returning approximately every 45 min. to repeat the process. The loading occurs on the lower side, and the system is lower to the ground so that you need not lift anything high off the ground. ‘Hay hooks’ were made to resist the heat, and they provide the user a lot of control, while keeping them safe from heat. The system also requires you to stand back while loading because of the angle, which should keep most people out of the sunlight. 57 | P a g e 5.5.2 Initial Use The initial set up is the assembly of the system. After the system arrives, the users will remove it from its crate. This was designed to not require any significant effort or skill on the part of the users. For example, the upper supporting frame connects to the reflector via four bolts in the corners of the reflector and a wrench is included in the crate. Figure 40: The reflector with the top support After the Reflector and supporting frame are together, the reactor can be mounted to the frame. To do this, the two brackets must be slipped over the upper supporting frame and the reactor must be tightened using a hex wrench to these brackets. Based on testing, it seems this can be done with one person, but it’s much easier with two. Figure 41: Reactor, top support, brackets, and reflector assembled 58 | P a g e Then the reflector and supporting frame should be lifted, and the legs/struts should slide on either side. The bottom bar should be tightened using two hex nuts. Two to three people are required for this step: one for each side and one to tighten the bottom support. Figure 42: Entire assembly without the tracking system The tracking assembly slides onto the higher strut, with the couple over the axle. Four screws should be tightened to hold the tracking system in place, and the coupler should also be tightened with two hex bolts. One person can do this with relative ease, and the process is not complicated. Then a bucket filled with sand should be hung from the rope on the tracking system. It’s best to have the weight ~20lb, but it does not need to be exact. Figure 43: The completed device 59 | P a g e 5.5.3 Daily Setup It’s easiest to remove the bucket attached to the tracking frame first, although not required. Then the user needs only to turn the crank until the shadow of the reflector lines up with the line on the reflector. The bucket of sand can be put back on, and the system should run throughout the day. It is preferable to do this 15 minutes before one begins to use the system to allow it to heat up. 5.5.4 Cycle Setup In order to use the system, one must have laid out and dried, corn cobs beforehand. It’s best, although not required, that these cobs be cut into small pieces. These pieces should be dumped into the insert tube. The tube can then be loaded into the reactor. It’s important to wait for some 30 minutes after small amounts of smoke are released, some 45 minutes on average. After waiting 45 minutes, one can use one of the hay hooks to remove the tube, and the other to help hold it. The biochar can be dumped out into a bowl, towel, or onto the ground, with a slight knock. Then, let the tube cool for 2‐4 minutes, and repeat the process. The process is quick and straightforward. 60 | P a g e 5.6 Manufacturing and Shipping 5.6.1 Manufacturing For simplicity, most components of the solar collector were built from 1 [in] x 0.072 [in] square steel tube. The parts that comprise the machine frame were cut to length, properly mitered, all mounting holes drilled, and were then welded together. The ribs were sent out to be laser cut from 0.125 [in] aluminum plate. This ensured that the geometry was correct to within the tolerances of the machine used (±0.005 [in]) and provided a clean, square edge to which the Alanod backer was attached. This ensured the parabolic geometry was correct. To ensure proper adhesion and good contact between the Alanod backer and the aluminum ribs, a wooden “negative” of the parabola was cut from a sheet of 0.75 [in] plywood. By spacing out five of these plywood ribs, a form was created in much the same way as the reflector itself. During gluing, the form was used to support the reflector sheets and resist their desire to peel away from the ribs while the adhesive was curing.
Figure 44: Wooden mold for secure packing and maintaining reflector shape 61 | P a g e 5.6.2 Shipping A crate was designed to fit the system while remaining as compact as possible. The crate needed to be certified to be shipped internationally; this meant that the crate need to be stamped with heat treated wood stamps to easily show that the wood used was heat treated. The crate fits the disassembled device with the parts carefully stacked to minimize the space needed to pack the device. The packing was also planned so that the pieces will be secure during shipping. The wooden mold (shown in Figure 44) used in the construction of the reflector will be placed in the crate to support the reflector. The reactor and the control box will be secured to the mold to keep them from moving due to their fragility. The rest of the pieces will be placed around the wooden mold. Shipping to Ghana is straightforward and the team determined that export controls would not be an impediment. The actual shipping costs are going to be covered by the project sponsors. Figure 45: Packed Crate in CAD
62 | P a g e 6. Final Design Evaluation 6.1 Experimental Design 6.1.1 Testing procedure for temperature measurement in actual system Objectives:
To measure the precise temperature change vs. time during the torrefaction process of the actual built system
To determine the ideal ‘cook’ time of biomass to reach the desired characteristic of torrified char
To compare the throughput produced at different parts of the day
To determine the effectiveness of the glass on the reactor
To determine the role that particle size has on throughput See Appendix B for list of materials and testing procedure. 6.1.2 Testing procedure for testing spot temperature measure and record Objectives:
To measure the local testing spot temperature while the “testing for temperature measurement in actual system” is proceeding. See Appendix B for list of materials and testing procedure 63 | P a g e 6.2 Results and Analysis 6.2.1 Throughput Table 6: Test Results Test
Date
Time In Time Out
Glass (Y/N)
Particle Size
Weight In
Weight Out
Weight Difference
Percent Reduction
A
6‐May‐12
1330
1430
N
Whole
1lb 1oz
15.8oz
1.2 oz
7.06%
B
6‐May‐12
1503
1603
N
Whole
14.6oz
13.6oz
1oz
6.85%
C
D
E
7‐May‐12
7‐May‐12
7‐May‐12
1140
1453
938
1240
1553
1039
Y
Y
Y
.5in and Halved .5in and Halved .5in and Halved
1lb 3.8oz
1lb 4oz
15.6oz
8.8oz
11.8oz
8.6oz
11oz
8.2oz
7oz
55.56%
41%
44.87%
Tests A and B yield no char. The biomass did come out more burnt, but the charring was limited to the surface. Tests C, D, and E achieved the most success. Tests C and E produced the most torrified throughput and was completely black in color. Although the output of Test D was similar, the biomass still had a dark brown core. From the data, it is clear that different variables have a greater effect on throughput. The most noticeable is the glass envelope. With the glass on, tests C, D and E yielded much greater results in char and temperature and percent reduction compared to the test conducted the day before without the glass. Another key aspect of the testing was the time of day in which the experiment was performed. The experiments that were conducted earlier in the day (13:30 and 11:40) yielded better results than the tests that followed later in the day (15:03 and 14:53, respectfully). Unfortunately, the team did not get the opportunity to experiment accurately with different particle sizes. The two tests that had the cut up corn cobs (smaller particle size) did produce better results, however, this is most likely due to the glass being installed. 64 | P a g e 6.2.2 Temperature 250
Temperature (C)
200
150
Outside Temp
100
Inside Temp
50
0
0
500
1000
1500
2000
Time (Second)
Figure 46: Test A (Temperature) (5/06/2012, 13:30) 250
Temperature (C)
200
150
Outside
100
Inside
50
0
0
500
1000
1500
2000
Time (Second)
Figure 47: Test B (Temperature) (5/06/2012, 15:03) 65 | P a g e The ambient temperatures of tests A and B were 21° Celsius and 23° Celsius, respectively. This testing was for the system, which included the reflector, frame, and reactor at that time. The glass was not placed around the reactor tube for these first two tests. As seen above, the inside temperature of test A represents the temperature inside the insert and the outside temperature represents the temperature between the reactor tube and the insert. The reactor tube eventually reached 178° Celsius and the insert reached 148° Celsius during this 1 hour test. For the second test, the inside readings represent the temperature inside of a corn cob inside the insert and the outside again refers to the temperature between the insert and the reactor tube. This 1 hour test brought the inside of corncob and tube outside surface up to 152° Celsius and 200° Celsius. The outside readings of both tests represent the temperature of the same location, so comparing these two readings could help analyze the ambient temperatures effect on the system performance. From the testing result, the test B outside temperature is 22° Celsius higher than test 1. As the test B was conducted at a higher temperature, it indicates that the ambient temperature actually affect the temperature of the reaction tube can get up to. Both tests show upward trends for both inside and outside temperatures during the 1 hour test. This indicates that the temperature would have continued increasing if the tests were continued. 300
250
Temperature (C)
200
150
100
50
0
0
‐50
200
400
600
800
1000
1200
1400
1600
1800
Time (Second)
Figure 48: Test C (Temperature) (5/07/2012, 11:40) 66 | P a g e 300
250
Temperature (C)
200
150
100
50
0
0
‐50
200
400
600
800
1000
1200
1400
1600
1800
Time (Second)
Figure 49: Test D (Temperature) (5/07/2012, 14:53) In order to test the effectiveness of the glass on the system performance, tests C and D were conducted on the second day. The inside temperature readings were taken from the inside of a corn cob, which is a more accurate way to test the product. The inside of the corn cob reached up to 226° Celsius at 26 minutes and the reactor tube reached 231° Celsius at only 7 minutes. Due to the thermocouple and LabVIEW range issue, the thermocouples stopped reading at around 230° Celsius. This happened during both tests. As shown by the trend of the graph before the thermocouple stopped reading temperature accurately, the temperature would have continued increasing to around 300° Celsius during both tests C and D. Regardless, the tests from the second day proved that the glass is very effective for heating up the system and the biomass compared to the tests performed without the glass. For the tests performed without the glass, the temperature of the inside corncob was 43% lower than the test with the glass. The glass improves the system performance on heating the corncob by 43%. This is due to the fact that the use of the glass reduces the effect that the ambient air temperature and wind has on the reactor performance. Looking at the results of these two tests, the actual readings are very similar; the tested corncob reached 226° Celsius at 1547 seconds for test C and it reached 226° Celsius at 1537 seconds for test D. In conclusion, the use of the glass around the reactor improves the system performance, verifying the necessity of this component to increase throughput. 67 | P a g e 350
300
Temerature (C)
250
200
Outside Tube Temp vs. Time
150
Corn Temp vs. Time
100
50
0
0
500
1000
1500
2000
2500
Time (Sec)
Figure 50: Test E (Temperature) (5/12/2012, 9:38) After successfully fixing the issue with the temperature readings, the team ran another test again. Figure 50 shows the temperature of outside tube and corncob versus time, respectively. This test data shows the corncob temperature starting to equalize with the outside tube temperature at about 25 minutes. The two plot lines increase to 307 Celsius at 35 minutes and then remain at this temperature without much variance. After an hour of operation, the insert does reach the necessary torrefaction temperatures and hold at steady state. This shows the system does have the capability to torrefy the biomass and should have an increased effect in Ghana. 6.2.3 Control Power Testing Two tests were performed to verify the systems performance in power adverse conditions. One test examined the ability of the system to store power. The other test examined the discharge rate using the motor. At the conclusion of the testing, a determination in either the affirmative or the negative can be made as to whether a situation can arise when the system cannot actuate itself. Each of the photovoltaic panels is rated for 2 Watts at 6 Volts. The test assumes that the panels are not operating at peak performance and instead are running at ½ of rated power. Running at half power, the panels are expected to supply ~83mA to the circuit. The capacitors are assumed to be fully discharged. Using Bench‐top Supply XXX, 12 Volts with a limit of 83mA was set. The capacitor charged to 95% of 12 Volts in 2 minutes, 44 seconds. Note that this is less than the 4 minute wait time between motor actuations. 68 | P a g e The second test evaluates how well the motor can actuate if the solar panels are providing no power to the system. This is an extreme case. Even with the sun behind a cloud, the panels will be providing a modicum of power. The conditions of the test are as follows: The capacitor bank was fully charged using the Bench‐top supply XXX. The motor control was bypassed so that the motor would run continuously. The supply was turned off and a timer was started. The motor completed 4 revolutions before the stored voltage read 8.45 Volts. This voltage corresponds to the 50% power level. The motor continued to run after this, albeit at a much less energetic pace. There is little confidence that the motor can consistently actuate the system at or below the 50% power level. The results of the testing are favorable. The conversion of biomass requires substantial solar power. The system can fully charge in between actuations, if the panels operate at 50% power. This can be assumed to be likely, on average, if biomass is being successfully converted. If a cloud or other obstruction limits the power being gathered by the device, several actuations can be performed without added power input. It is highly unlikely that the system will be unable to actuate itself if there is adequate solar power to convert biomass. In the event of a single missed actuation, the solar misalignment will cause ~10% of the concentrated light to miss the reactor. This is fault is not high risk due to its probability and magnitude. 6.2.4 Drivetrain Testing The backlash of the panel drive unit is important because it influences some error that the tracking system can exhibit. If there is a gust of wind strong enough and in a direction to turn the panel slightly, the solar misalignment angle could be increased. During testing of the collector without the drive, the wind conditions did not manage to move the collector significantly; despite friction in the bushing were the only restraint. To test the backlash under a typical condition, 20 Newtons down were applied the one edge of the panel. The solar misalignment angle was noted. 20 Newtons down were applied to the opposite side of the panel. The difference of the two solar misalignment angles is approximately the backlash. The method used for fine calibration of the tracking system and for verifying the tracking speed drift, were the same. The tracking system was setup with the drum fully wound with rope. The device was supplied external power if necessary. The height position of the weight was noted. The time was noted and the system turned on. After several hours, the time and position of the weight were noted. The weight should have moved. L=
Total Time
Total Time
πD =
1.5πinches
Actuation Time
4 minutes
If the corresponding number of actuations was out of specification, then dip switch SW3 can be adjusted to increase or decrease the wait time between actuations. 69 | P a g e 6.3 Meeting the User Requirements Table 7: Technical Specifications with the wanted value and the actual tested value Technical Specifications Target Value Tested Value (Results) Necessary parts excluded 0 [parts] 0 [parts] Number of persons required 2 [persons] 2‐3 [persons] Parts require significant energy to fit together Amount of force required to fit parts 2 [parts] 1 [part] < 5 [lb] Meets target value Weight of heaviest part 40 [lb] < 25 [lb] Steps for setup 3 [steps] Meets target value Steps for batch 5 [steps] Meets target value Time to set up for day 10 [min] <10 [min] Time for batch process 45 [min] 50 [min] Max. pounds required 20 [lb] < 5 [lb] Nema rating for electro‐mechanical enclosures Parts that can corrode that are not coated with rust‐inhibitor Parts that move and are made of corrodible material Withstands winds of Nema 5 Estimated at Nema 5 0 [parts] 0 [parts] 0 [parts] 0 [parts] 20 [mph] 7.5 [degrees North] Meets target value 15 ± .1 [degrees/hour] 1 [degree] untested > 10 [years] Estimated to meet target value Angled toward the sun with elevation angle of The tracking system shall drive the panel at a speed of Error in tracking at any time does not exceed Minimum component life % of components replaceable in Ghana > 60% untested untested 70 | P a g e Price < $800 $1786.37 Payback period < 10 [years] >10 [years] Amount of char created 2 [lb/cycle] .5375 [lb/cycle] Sustains a temp. of 300 [°C] Estimated to meet target value Amount of time required to touch a 0 [sec] surface capable of causing burns *Based on Table 1: User Needs Meets target value 71 | P a g e 7. Conclusions In conclusion, the tests that were performed showed that this project will most likely work in Ghana. Since the tests were performed in New York at a higher latitude than in Ghana, the sun was not as strong as it is in Ghana. Thus, when this device is used in Ghana, the device should produce better results than the tests performed. Also due to the latitude difference, the angle that the device needed to be for testing here is different than the angle the device is designed for. Because of this discrepancy, the team believes the device will perform more effectively once it is in Ghana. This discrepancy originated due to the alternate frame that was used during testing. This introduced some frame twist and caused the reflector to slide out of position. These issues will be resolved in Ghana because the alternate frame system will not be necessary in Ghana. Finally, the results showed that the required temperatures for torrefaction are possible in New York; thus, when this device is used in Ghana, the required temperatures will be easily achievable. 8. Future work Future recommendations include changes to the reflector and simplifying the control system. The solar selective coating that the reactor is coated with may not be necessary. There are cheaper alternatives to the one used that may work just as efficiently. This may also allow further iterations to increase throughput by being able to increase the size of the reactor without much more cost due to less cost from the coating. Also, the tracking system is very complex and could be simplified. This also could be altered to include a simple mechanical back up system. The final recommendation for controlling the angle of the reflector is that it is acceptable to have a person move the reflector. Once the prototype is actually being used in Ghana, further changes can be made, as well as, further iterations on this design. For instance, the device could be made out materials found in Ghana to prevent the need for shipping. This would also lower the cost of the system, which is another recommendation from the team. Also, future teams should look into other ways than the glass tubing to implement the insulating glass idea because the glass tubing is not easily attainable in Ghana. Lastly, the reactor and, possibly, the reflector sizes could be made larger to increase throughput. However, with further testing in Ghana, these recommendations may be found to be unnecessary. Also, further testing to determine these factors is recommended. ●
The effectiveness of the glass envelope‐ Although the team achieved favorable throughput having the glass on, more tests (with different variables listed below) should have been conducted. Having this data would give us an idea on how the project would perform should the glass break or become damaged in the field ●
Time of day‐ The sun is stronger at different times of the day. We were only able to test in the afternoon and not in the early morning. The project is expected to be used from sunrise to sun set in the field, so testing should have been done to meet its use. 72 | P a g e ●
Biomass Moisture Content ‐ Multiple samples should have been used at various levels of dryness to determine how important biomass moisture and cooking time/char quality is. Also, if possible, the corn cobs should be dried outside in the sunlight to replicate what Ghanaian farmers would do. For this testing, the team used 3 batches of corn that were dried in different ovens for different times. ○
●
The process for drying the biomass for testing purposes varied. On average, the cobs were place in a conventional oven for about 10 hours at 250 degrees Fahrenheit. Particle Size‐ More testing should have been done to determine if the size of the biomass particles has a strong correlation to pyrolysis time/char quality. The team tested whole cobs without the glass attached twice and another two tests using cut up pieces of various sizes (pictured below). The second set of testing also had the glass on the reactor tube. Ideally, we would’ve like to test biomass cut at various equal measurements and not just cut randomly Figure 51: Pre‐charred processed corn cobs (input to the reactor) ●
●
Packing density‐ the correlation between the amount of biomass and pyrolysis time/char quality may not in fact be linear. Some variables to test this could be: ○
% full when inserting biomass (50%, 25%, etc) ○
Possibly adding low density fillers such as corn husks. Chemical Composition‐ ○
Before ○
After ○
analyzing the bio‐gas that is output (chemicals, and flow rate) 73 | P a g e ●
Char characteristics ○
Energy content (actually use it to cook) ○
pH and nutrients ○
Moisture content 74 | P a g e References Acciona Acciona North America [Online]. ‐ 2007. ‐ http://www.acciona‐na.com/About‐Us/Our‐
Projects/U‐S‐/Nevada‐Solar‐One. AET Solar AET Solar [Report]. ‐ 2011. Asiedu‐Bondzie A. Ayensu and V. Solar drying with convective self‐flow and energy storage [Journal] // Solar and Wind Technology. ‐ 1986. ‐ pp. 273‐279. Edward S. Lipinsky James R. Arcate, and Thomas B. Reed Enhanced Wood Fuels Via Torrefaction [Online] // Argonne National Lboratory. ‐ 2002. ‐ Feb 1, 2012. ‐ http://www.anl.gov/PCS/acsfuel/preprint%20archive/Files/47_1_Orlando_03‐02_0071.pdf. GNA Government of Ghana ‐ Official Portal [Online] // Government of Ghana ‐ Official Portal. ‐ 2011. ‐ http://www.ghana.gov.gh/index.php?option=com_content&view=article&id=6316:ghana‐wins‐first‐
prize‐at‐the‐worlds‐leading‐green‐energy‐awards&catid=28:general‐news&Itemid=162. NREL Concentrating Solar Power Projects [Online]. ‐ 2011. ‐ http://www.nrel.gov/csp/solarpaces/project_detail.cfm/projectID=109. Prins Mark Jan Thermodynamic analysis of biomass gasification and torrefaction [Report]. ‐ [s.l.] : Eindhoven Technical University, 2005. Wahab Suraj Ashden Sustainable Solutions [Online] // Ashden. ‐ 2011. ‐ http://www.ashden.org/blog/toyola‐brilliant‐african‐stove‐business‐realising‐big‐plans. Westenhaus Brian New Energy and Fuel [Online]. ‐ http://newenergyandfuel.com/http:/newenergyandfuel/com/2008/11/19/torrefaction‐%E2%80%93‐a‐
new‐process‐in‐biomass‐and‐biofuels/. 75 | P a g e Appendix A: Customer Requirements Table 8: Full Customer Requirements Table Customer Requirement Technical Requirement Approach/Type Technical Specification Target Value Justification Testing Easy to Assembly A Ghanaian farmer can assemble the system All parts needed, included Necessary parts excluded 0 [part(s)] Hidden costs, or shipping something that doesn't work will be confusing and frustrating and may cause them to abandon the device Will assemble and disassemble the torrefaction unit out of the crate, then use it Parts fit together easily Number of persons required 2 [person(s)] The product should not be so bulky a large number of people are required, but it is likely that 2 people will be available Age of persons required 13‐50 [years] While it is unlikely that the average Ghanaian farmer will be younger than 13 working on their own, it is also unlikely that a farmer will be over 50 years old working on their own, this also dictates part weight Parts require significant energy to fit together 2 [parts] Estimated by personal experience Amount of force required by difficult to fit parts <5lb 76 | P a g e Easy to Use A Ghanaian farmer can use the system Lightweight Weight of heaviest part 40 [lb] [http://www.hsbaseballweb.com/weig
ht_lifting.htm] Seems that most pubesant males can lift 10‐15lb 1 arm in repetition, so 2 arms between 2 people, so 40 lb seems reasonable. parts will be weighed Limit actions to use Steps for setup 3 [step(s)] will need to unweight, crank, and weight the system Should use the system and count Steps for batch 5 [step(s)] will need to pack, unload, load, lift and slide the system Time to set up for day 10 [min] time of work per day should not greatly exceed 1 hour Time for batch process 15 [min] Limit strength required Max pounds required 20 [lb] As in source X, 13 year olds start at 15 lb repetitive lifting Design electro‐
mechanical enclosure to resist water & dust Nema Rating for electro mechanical enclosures Nema 5 keeps out dust and water in windy areas outside purchasing only these materials/ no direct test Design components that are not easily corroded Parts that can corrode that are not coated with resistant paint 0 [parts] In order to be useable for at least 15 years, should not corrode design review/ no direct test Parts that move and are made of corrodible material 0 [parts] Limit length of actions Works in Ghana Elemental Resistance 77 | P a g e Tracking Long lasting Lasts long enough to pay for itself Drives against wind The panel tracks in a wind of 20 [mph] this is the maximum wind we've seen in Ghana on days where there is sufficient sun to operate Operate with a fan blowing on the reflector Accurately designed for Ghanaian Latitude Tracks angle of sun at median elevation angle for 7.5 [degree(s)] North Or end effects will become non negligible (>5%) Design at correct angle/ no direct test Tracking Accuracy The tracking system shall drive the panel at a speed of 15 ± .1 [degrees/hour] more than 10% of light will miss if not, and no longer function during time periods specified Measure rate of movement of tracking system while in use Limit areas of wear Minimum component life >10 [years] In order to exceed worst payback period, should last at least 10 years Design for longevity/no direct test Use simple components % of components replaceable in Ghana >60 [%] So that if something does break, it is likely it can be fixed look up potential suppliers of components in Ghana/ no direct test Reduce number of components & use inexpensive components Price <800 [$] In order to have a payback period <10 years Purchase orders/ BOM Payback Period <10 [years] Decided based on lowest achievable cost calculations based on value output and cost / no direct test Use only long lasting components Low cost Ghanaian farmers can receive a loan or grant for enough to buy system 78 | P a g e Creates Biochar Safe Creates biochar for cooking/ fertilizer The system does no harm to farmers or their neighbors and families Design reactor to hold biowaste amount of char char
created [kg ] 1.5 [kgchar] Based on previous tests & calculation, this should provide fuel for a 4 person family on 1 acre use system Design reactor thermally efficient Sustains a temperature of 300 [°C] Maximum efficiency for the torrefaction process Apply thermocouples during use Limit ability to look into reactor Amount of solar intensity that bystanders are exposed to ≤1 [sun] They merely have to walk 2 feet away. design to spec/ no direct test Amount of times you have to look at the reflector to use device 0 [times] So that one does not need to risk retinal damage to use the system Amount of time required to touch a surface capable of burning 0 minutes Don't want to burn anyone Does not require contact with hot components 79 | P a g e Appendix B: Test Plans Test Procedure for preprocessing the corn cobs Testing procedure for temperature measurement in actual system: Objectives:
To measure the precise temperature change vs. time during the torrefaction process by the actual built system
To determine the ideal ‘cook’ time of biomass to reach the desired characteristic of torrified char
To compare the throughput produced at different parts of the day Materials:
2 Thermocouples
2 thermocouple modules
1 multimeter
2 reference temperature thermostat
NI data acquisition board
Short Wires 80 | P a g e
Laptop with LabVIEW (DAQ) installed
Biomass apparatus (including cooper insert and steel hooks)
Zip Lock bags (labeled A, B, C, D respectively)
Sharpie or pen
Funnel
Bowl
Rag
Brush
Tape Part A – thermocouple & data acquisition setup 1. Obtain 4 thermocouples along with modules, data acquisition and multi‐meter 2. Calibrate the modules as instructed 3. Wire the thermocouples and the modules with data acquisition board 4. Create the appropriate program in LabVIEW to be able to measure and record temperatures 5. Test the program and the thermocouples by measuring surrounding temperature and the temperature when the thermocouples are gripped in hand. If the thermocouples are working the temperature reading will be warmer when the thermocouples are in hand. 6. Make sure the noise in the readings is within acceptable fluctuation range. 7. Put the 4 thermocouples, respectively, at: o
In between the outer reactor tube and the insert o
Inside the insert 8. Fix these thermocouples at the desired location 9. Load copper insert with one pre‐made group of corn cobs and place the insert into the reactor 10. Record the time the insert was placed into the reactor on the sandwich bag labeled ‘A’ 81 | P a g e 11. Start immediately recording the temperatures readings by turning the module on and start recording with the LabVIEW program and set it to take one measurement per second for 1 hour 12. After 1 hour, stop recording with LabVIEW and turn off the modules 13. Remove the thermocouples 14. Take the insert out of the tube using the ‘hay hooks’, carefully place it on the ground and allow it to cool 15. Once the insert is cool, empty the its contents into a bowl 16. When the processed biomass is cool to the touch, brush it into the sandwich bag (using the funnel) and seal the bag shut 17. Wipe off any residue in the bowl with the rag 18. Conduct the experiment again time, repeating steps 1 to 17, with the inside thermocouple recording the temperature inside of a corn cob 19. Conduct the experiment 1 more time, repeating steps 1 to 17 with the protective glass tube in place to determine the difference of the effectiveness of the system. 20. Save the data acquired 21. Make an Excel spreadsheet to plot the results 82 | P a g e Testing procedure for testing spot temperature measure and record Objectives:
To measure the local testing spot temperature while the “testing for temperature measurement in actual system” is proceeding. Material:
Using thermostat that is used for the reference temperature when calibrating the thermocouple module
Tape
A chair or small table with similar height of the reaction of the system
Laptop with Excel Procedure: 1. place a chair or table next to the system to place the equipment on 2. Place the thermostats on the table surface and tape the wire‐tip at the specific locations 3. Start recording the thermostat readings with LabView when the testing starts 4. Record the temperature every 5 minutes during the operation 5. When the test is complete, stop recording with the thermostat 6. Repeat steps 3 to 5, when the next test begins 83 | P a g e Appendix C: User Manual 84 | P a g e 85 | P a g e 86 | P a g e 87 | P a g e 88 | P a g e 89 | P a g e Appendix D: Cost Analysis Table 9: Cost‐benefit analysis total angle change Variation from mean Width (feet) focal length (feet) End area not covered (feet) in inches Length of reactor % of reactor not in light 49.715
24.8575
5
1.5
0.694925
8.339099
3
23.16416
reduced use => negligable impact Negligible percent reactor not in light reactor length not in light Variation from mean total change angle change per day number of days in use Percent of days in use 0.1
0.3
11.30993
22.61986
0.272411
83.03581
0.227495
Payback change Value per year Cost of unit Payback difference in payback in years Difference in value good 33.54647
500
14.9047
10.91558
366.1792
bad 12.57993 500 39.74586 27.68986 348.3364 90 | P a g e Appendix E: Expense Report Table 10: Overall Expense Report Reactor Material Glass Tube Insert Tube Coating threaded rod Reflector Square tube and Aluminum Backer 0
0
210 110
250
25.08
0
0
0
0
0
0
110 250 25.1 596 153.35
0
0
90
0
0
90
210
0
0
210
Total Cost of the device = 1786.37
Tracking ‐ circuit Tracking ‐ drivetrain 210.46
Seller Schott North America Schott North America AET Solar Woodwrd Co. Material Shipping Fabrication Total 450
0
0
450 25.08
0
0
25.1 265.75
0
0
266 Anomet Solar 50
0
0
50 50
0
0
50 50
0
0
50 891 Ribs Threaded rod Alanod Adhesive Backing sheet Wood Frame Shipping Fabrication Total 153 Albany Steel 91 | P a g e Appendix F: Decision Matrices Table 11: Reactor End Cap Matrix Cost Material Cost Cat Wt.
20
Weight
20
Plain copper end cap
Custom Steel end cap
0.01
20
Custom Monel/Kovar end cap
0.02
1
0.01
2
1
Material CTE 15
2
3
4
Weight 20
2
4
2
Thermal Conductivity 25
0
3
2
Manufacturability 60
20
25
30
0.04
0.1
0.03
0.08
0.04
0.03
Ease of assembly 10
3
4
3
Ease of glass replacement 10
0
0
0
0.16
0.12
Total 100
0.08
92 | P a g e Reactor End Cap Design Effectiveness
0.18
0.16
0.14
0.12
0.1
0.08
0.06
0.04
0.02
0
Plain copper end cap
Custom Steel end cap
Custom Monel/Kovar end
cap
Manufacturability
0.03
0.04
0.03
Material
0.04
0.1
0.08
Cost
0.01
0.02
0.01
Figure 52: Reactor End Cap Results 93 | P a g e Table 12: Glass Envelope Matrix Material Material Cost Weight Optical Properties Cat Wt.
25
Weight
25
Corning Tubing Schott DURAN® Tubing
0.02
0.03
25
25
25
0.1
Polymer Tubing
0.05
2 3
5
0 0
0
0.19
0.07
Optical Transmission [%] 12.5
6 8
4
Reflectivity 12.5
1 8
3
Dielectric Coating 3 3
0
Durability 25
Robustness against physical shock
0.18
0.06
8
3
Robustness against thermal shock
6 8
3
Lifetime in UV Environment
6 6
0
Ease of production Availability in Ghana 25
0.22
6 Manufacturability Total 25
25
25
25
100
0.08
0.1
0.1
6 8
5
2 2
5
0.38 0.54
0.28
94 | P a g e Glass Envelope
Design Effectiveness
0.6
0.5
0.4
0.3
0.2
0.1
0
Corning Tubing
Schott DURAN® Tubing
Polymer Tubing
Material
0.02
0.03
0.05
Optical Properties
0.1
0.19
0.07
Durability
0.18
0.22
0.06
Manufacturability
0.08
0.1
0.1
Figure 53: Glass Envelope Results 95 | P a g e Table 13: Reactor Insert Removal Method Matrix Cat Wt. Cost Weight 25 Predicted costs 25 Safety Threaded Pole/ Hay Hook
0.02
25 25 Double Hay Hook
25 Umbrella Spear
0.01
2
0.02
Ball Detent Spear
0.05
1 0.04
Permanent Handle 0.04
5
0.05
0.01
4
0.06
1 0.03
Direct risk 12.5 1
3 1
1
1 Indirect risk 12.5 1
1 4
5
2 Ergonomics 25 Ease of use Intuitiveness Production level Ease of production Total 25 0.12
0.12
0.07
6
8 6
6
7 6
6 6
6
0 25 25 100 0.14
25 25 0.12
0.06
0.08
6
0.22
0.01
8 0.27 0.01
0.04
1
1
4 0.23
0.23
0.15 96 | P a g e Reactor Insert Removal Method
Design Effectiveness
0.3
0.25
0.2
0.15
0.1
0.05
0
Threaded Pole &
Hay Hook
Double Hay
Hook
Umbrella Spear
Ball Detent
Spear
Permanent
Handle
Production level
0.06
0.08
0.01
0.01
0.04
Ergonomics
0.12
0.14
0.12
0.12
0.07
Safety
0.02
0.04
0.05
0.06
0.03
Cost
0.02
0.01
0.05
0.04
0.01
Figure 54: Reactor Insert Removal Method Results 97 | P a g e Table 14: Reactor Insert Matrix Material Material Cost Weight Cat Wt.
25
Weight
No Insert
25
Copper Pipe
0.2
Steel Pipe
0.15
0.14
5
10 7
8
20
10 8
6
Ease of Operation 25
25
0.02
0.13
0.13
Required manpower
12.5
1 8
8
Safety 12.5
1 5
5
Thermal Properties 25
25
0.08
0.18
0.12
Thermal Conductivity
12.5
4 9
6
Specific Heat 12.5
4 9
6
Manufacturability 25
25
0.05
0.05
0.05
Ease of production
12.5
5 5
5
Availability in Ghana
12.5
0 0
0
0.51
0.44
Total 100
0.35 98 | P a g e Reactor Insert
Design Effectiveness
0.6
0.5
0.4
0.3
0.2
0.1
0
No Insert
Copper Pipe
Steel Pipe
Material
0.2
0.15
0.14
Ease of Operation
0.02
0.13
0.13
Thermal Properties
0.08
0.18
0.12
Manufacturability
0.05
0.05
0.05
Figure 55: Reactor Insert Results 99 | P a g e Table 15: Reflector Material Matrix Cat Wt.
Weight
Solar Reflectivity 25
25
25
25
25
25
Reflectivity [%] Cost ($/m2) Cost Durability Flabeg Thick Glass
0.094
0.02
9.6 0.075
2
0.06
25
0.094
9.4
7.5 9
0.08
6.5
0.06
9.5
0.07
8
0.08
0.03
Breakage 10
3
6 2
8
3
Handling 10
6
6 6
8
3
Manufacturing scale up 5
6
2 2
8
3
0.319
0.49
0.285
125
0.05
0.047
0.324
6
7
Other 25
5 0.095
Durability 25
6
All‐Polymeric
0.09
0.065
0.05
Alanod
Total 25
ReflecTech Laminate
0.096
9.4
25
25
SAIC Glass
0.033
0.361 8
0.080
3
0.03
100 | P a g e Reflector Material
Design Effectiveness
0.35
0.3
0.25
0.2
0.15
0.1
0.05
0
Flabeg Thick
Glass
SAIC Glass
ReflecTech
Laminate
Alanod
All‐Polymeric
Solar Reflectivity
0.094
0.096
0.094
0.09
0.095
Cost ($/m2)
0.02
0.075
0.065
0.08
0.07
Durability
0.06
0.05
0.06
0.08
0.03
Other
0.05
0.047
0.033
0.080
0.03
Figure 56: Reflector Material 101 | P a g e Appendix G: Thermal Analyses
reactor pipe selective coating Biomass reactor insert Glass envelope a) With glass envelope
b) Without glass envelope
Figure 57: Thermal energy schematic of receiver assembly
102 | P a g e Figure 58: Thermal Resistance model (of Receiver Assembly) 103 | P a g e Table 16: List of heat fluxes (in Receiver Assembly) Heat Flux Heat Transfer Mode Heat Transfer Path From To q_b0_cond conduction insert inner surface biomass q_01_cond conduction insert outer surface insert inner surface q_12_cond conduction reactor inner surface insert outer surface q_12_conv convection reactor inner surface insert outer surface q_23_cond conduction reactor outer surface inner absorber pipe surface q_3_SolAbs solar irradiation absorption incident solar irradiation outer absorber pipe surface q_34_conv convection reactor outer surface inner glass envelope surface q_34_rad radiation reactor outer surface inner glass envelope surface q_45_cond conduction glass envelope inner surface outer glass envelope surface q_5_SolAbs solar irradiation absorption incident solar irradiation outer glass envelope surface q_56__conv convection glass envelope outer surface surrounding air q_57_rad radiation glass envelope outer surface sky q_36_conv convection reactor outer surface surrounding air q_37_rad radiation reactor outer surface sky 104 | P a g e 1‐D EES Thermal Analysis Script "INPUTS"
"Material constants, etc."
k_Reactor=400 "[W/m-K]" "Copper=400, Steel=17"
k_Glass=1.2 "[W/m-K]"
h_1_Air=15 "[W/m^2-K]"
h_56_Air=25 "[W/m^2-K]"
epsilon_3=0.97 "Reactor surface emissivity"
epsilon_4=0.05 "Inner Glass envelope emissivity"
epsilon_5=0.05 "Outer Glass envelope emissivity"
sigma=5.67E-8 "[W/m^2-K^4]"
"Dimensions [m]"
D[0]=0.063373 "Inner Insert Diameter"
D[1]=0.066675 "Outer Insert Diameter"
D[2]=0.074803 "Inner Reactor Diameter"
D[3]=0.0762 "Outer Reactor Diameter"
D[4]=0.107 "Inner Glass Diameter"
D[5]=0.110 "Outer Glass Diameter"
"Temperatures [°C]"
T[7]= T[6]-8 " 'Sky' "
T[6]= 296.15 "Ambient"
T[5]=T[4] "Outer Glass Surface = Inner Glass Surface
T[3] Outer Reactor surface
T[2] Inner Reactor surface
T[1] Outer Reactor Insert surface
105 | P a g e T[0] Inner Reactor Insert surface"
"Other"
q_Sol= 10000 "Solar Irradiation [W/m^2]"
L= 0.90 "[m]"
q_Solar=q_Sol*L "Solar Irradiation normalized for length of reactor [W/m]"
"Solar Absorption [W/m]"
q_5_SolAbs=q_Solar*0.08
"Absorption in Glass"
q_3_SolAbs=0.95*q_Solar*epsilon_3 "Absorption outer Reactor surface"
"Convection [W/m]"
q_12_conv=h_1_Air*pi*D[2]*(T[2]-T[1]) "Inner Reactor wall to Inner Air"
q_34_conv=h_1_Air*pi*D[4]*(T[4]-T[3]) "Inner Glass to Annulus"
q_56_conv=h_56_Air*pi*D[5]*(T[5]-T[6]) "Outer Glass to ambient"
"Conduction [W/m]"
q_01_cond=(2*pi*k_Reactor*(T[0]-T[1]))/ln(D[1]/D[0]) "Through Reactor insert wall"
q_23_cond=(2*pi*k_Reactor*(T[2]-T[3]))/ln(D[3]/D[2]) "Through Reactor wall"
q_45_cond=(2*pi*k_Glass*(T[4]-T[5]))/ln(D[5]/D[4])
"Through Glass wall"
"Radiation [W/m]"
q_34_rad=(sigma*pi*D[3]*((T[3]^4)-(T[4]^2)))/(1/epsilon_3 +(1-epsilon_4)*D[3]/(epsilon_4*D[4])) "Outer
Reactor surface to inner Glass surface"
q_57_rad=sigma*pi*D[5]*epsilon_5*((T[5]^4)-(T[7])^4) "Outer Glass surface to sky"
106 | P a g e "Energy Balances at each surface of the Solar Receiver cross-section (Inner to Outer)(Negecting heat
losses through frame bracket)"
"(0): Convection (inner reactor surface to 'inner air')=conduction (through Reactor Insert wall)"
q_12_conv=q_01_cond
"(1): Convection (inner reactor surface to 'inner air') = conduction(outer reactor surface to inner reactor
surface)"
q_12_conv=q_23_cond
"(2): Solar Absorption (on outer reactor surface) = convection (on outer reactor surface + radiation (from
outer reactor surface to inner glass surface) + conduction (though reactor wall)"
q_3_SolAbs=q_34_conv+q_34_rad+q_23_cond
"(3): Convection (convection (on outer reactor surface) +radiation (from outer reactor surface to inner
glass surface) = conduction (through glass wall)"
q_34_conv+q_34_rad=q_45_cond
"(4): conduction (through glass wall)+Solar Absorption (on outer glass surface) = convection (outer glass
surface to ambient air) + radiation (outer glass surface to ambient)"
q_45_cond+q_5_SolAbs=q_56_conv+q_57_rad
"(5): Heat Loss = convection (outer glass surface to ambient air) + radiation (outer glass surface to
ambient)"
q_HeatLoss=q_56_conv+q_57_rad
107 | P a g e Appendix H: Reflector analysis
Figure 60 ‐ Reflector focal length analysis
Figure 59 ‐ Reflector error analysis
108 | P a g e MATLAB script for Reflector analysis VISUALIZE System ERROR %=====Script Parameters===== %Points per Sweep Div = 15; Num = Div*50; zlimit = 3; pw = 4; rw = 2; %=====Device Parameters===== %All units in inches %Reactor Diameter D = 3; %Collector Width W = 68; % Distance from FP to AoR as % of Distance from FP to Base of Collector AoR = 0; %Focal Length FL = .3*W; %=====Errors===== %Angles in degrees and lengths in inches %Solar Angle Misalignment sam = 2; 109 | P a g e %Angular Parabola Error ape = 0; %Offset Parabola Error OPE = 0; %Convert Inches to reactor radius lengths and angles to radians R = D/2; r = 1; w = W/R; fl = FL/R; aor = (AoR/100)*fl; ope = OPE/R; sam = sam*pi/180; ape = ape*pi/180; %Init Parabola ‐ Origin at Axis of Rotation Rsam = [cos(sam) ‐sin(sam); sin(sam) cos(sam)]; fp = Rsam*[0; aor]; a = 1/(4*fl); c = ‐fl + aor; x = ‐.5*w:w/(Num‐1):.5*w; y = a*x.^2 + c; %True Shape TS = Rsam*[x; y]; xp = TS(1,:); 110 | P a g e yp = TS(2,:); %Calculate Parabola Angle from Global Horizontal ArcLength = 0; theta = zeros(1,Num); TSO = zeros(2,Num); for n = 2:Num‐1 if xp(n) <= 0 theta(n) = pi ‐ atan2(yp(n‐1)‐yp(n+1),xp(n‐1)‐xp(n+1)); else theta(n) = atan2(yp(n+1)‐yp(n‐1),xp(n+1)‐xp(n‐1)); end ArcLength = ArcLength + sqrt( (yp(n)‐yp(n‐1))^2 + (xp(n)‐xp(n‐1))^2 ); end TrueArcLength = ArcLength*R; theta(1)=theta(2); theta(Num) = theta(Num‐1); %plot(TS(1,:),theta) %Generate Offset Parabola for n = 1:Num if xp(n) <= 0 TSO(:,n) = TS(:,n) + [sin(theta(n)); cos(theta(n))]*ope; else TSO(:,n) = TS(:,n) + [‐sin(theta(n)); cos(theta(n))]*ope; 111 | P a g e end end z = zeros(1,Num); RRay = zeros(2,Num); N = zeros(2,Num); for n = 1:Num inc = theta(n) ‐ ape; RRay(:,n) = [fp(1)‐TSO(1,n); fp(2)‐TSO(2,n)]; if xp(n) <0 N(:,n) = [sin(inc); cos(inc)]; del = acos(dot(RRay(:,n),N(:,n))/(mag(RRay(:,n))*mag(N(:,n)))) ‐ inc; else N(:,n) = [‐sin(inc); cos(inc)]; del = ‐acos(dot(RRay(:,n),N(:,n))/(mag(RRay(:,n))*mag(N(:,n)))) + inc; end z(n) = sqrt(RRay(1,n)^2 + RRay(2,n)^2)*sin(del); if xp(n) > ‐.2 && xp(n) < .2 disp(del) end end %Plot Reflector with reference rays figure(1) clf hold on 112 | P a g e plot(TSO(1,:),TSO(2,:),'g','LineWidth',pw) circle(fp(1),fp(2),r,'k') for n = [1:Num/Div:Num Num] inc = theta(n) ‐ ape; %line([TSO(1,n) fp(1)], [TSO(2,n) fp(2)],'Color', [0 1 0]); %line([TSO(1,n) TSO(1,n)], [TSO(2,n) 1.2*fl]); line([TSO(1,n) TSO(1,n)+N(1,n)], [TSO(2,n) TSO(2,n)+N(2,n)],'Color', [1 0 0]); if xp(n) <=0 line([TSO(1,n) TSO(1,n)+.5*w*sin(2*inc)], [TSO(2,n) TSO(2,n)+.5*w*cos(2*inc)],'LineWidth',rw); else line([TSO(1,n) TSO(1,n)‐.5*w*sin(2*inc)], [TSO(2,n) TSO(2,n)+.5*w*cos(2*inc)],'LineWidth',rw); end end axis([‐.5*w‐2*r .5*w+2*r c‐r aor+2*r]) axis equal PLOT RAY OFFSET D = 3; W = 100; sam = 2.5; FLR = [.25 .30 .35 .40 .45]; pw = 3; 113 | P a g e R = D/2; w = W/R; zmin = 0; zmax = 1.5; N = length(FLR); for n = 1:N [x z] = RayOffset(D, W, FLR(n), sam); if n == 1 X = x; Z = z; else X = [X; x]; Z = [Z; z]; end end %Remove the garbage data near 0 %(most likely a result of roundoff and cosine of small angles) j = floor(length(X)/2); k = floor(length(X)/50); for i = 1:length(FLR) Z(i,j‐k:j+k) = linspace(Z(i,j‐k),Z(i,j+k),2*k+1); end clf 114 | P a g e figure(2) hold on plot(transpose(X),transpose(Z),'LineWidth', pw) legend(num2str(transpose(FLR)), 'Location', 'SouthEast') plot([‐.5*w‐2 .5*w+2],[‐1 ‐1], 'LineStyle','‐‐','Color',[0 0 0],'LineWidth', pw) line([‐.5*w‐2 .5*w+2], [1 1], 'LineStyle','‐‐','Color',[0 0 0],'LineWidth', pw) line([‐w*.5/2 ‐w*.5/2], [‐zmin zmax], 'LineStyle','‐‐','Color',[1 0 0],'LineWidth', pw) line([ w*.5/2 w*.5/2], [‐zmin zmax], 'LineStyle','‐‐','Color',[1 0 0],'LineWidth', pw) line([‐w*.75/2 ‐w*.75/2], [‐zmin zmax], 'LineStyle','‐‐','Color',[0 1 0],'LineWidth', pw) line([ w*.75/2 w*.75/2], [‐zmin zmax], 'LineStyle','‐‐','Color',[0 1 0],'LineWidth', pw) axis([‐.5*w .5*w zmin zmax]) xlabel('Collector Width (All distance normalized to reactor radius)') ylabel('Reflected Light Ray Offset from Reactor Centerline') text(‐w*.5/2+1,1.25,'50%') text(‐w*.75/2+1,1.25,'75%') text(0,.05,'Reactor Centerline') text(0,1.05,'Reactor Surface') text(0,1,'FLR = FL/ W') 115 | P a g e Calculate Ray Offset function [ x, z ] = RayOffset( D, W, FLR, sam ) %=====Script Parameters===== %Points per Sweep Div = 15; Num = Div*200; zlimit = 3; %=====Device Parameters===== %All units in inches %Reactor Diameter %D = 3; %Collector Width %W = 68; % Distance from FP to AoR as % of Distance from FP to Base of Collector AoR = 0; %Focal Length FL = FLR*W; %=====Errors===== %Angles in degrees and lengths in inches %Solar Angle Misalignment %sam = 1; %Angular Parabola Error ape = 0; 116 | P a g e %Offset Parabola Error OPE = 0; %Convert Inches to reactor radius lengths and angles to radians R = D/2; r = 1; w = W/R; fl = FL/R; aor = (AoR/100)*fl; ope = OPE/R; sam = sam*pi/180; ape = ape*pi/180; %Init Parabola ‐ Origin at Axis of Rotation Rsam = [cos(sam) ‐sin(sam); sin(sam) cos(sam)]; fp = Rsam*[0; aor]; a = 1/(4*fl); c = ‐fl + aor; x = ‐.5*w:w/(Num‐1):.5*w; y = a*x.^2 + c; %True Shape TS = Rsam*[x; y]; xp = TS(1,:); yp = TS(2,:); 117 | P a g e %Calculate Parabola Angle from Global Horizontal ArcLength = 0; theta = zeros(1,Num); TSO = zeros(2,Num); for n = 2:Num‐1 if xp(n) <= 0 theta(n) = pi ‐ atan2(yp(n‐1)‐yp(n+1),xp(n‐1)‐xp(n+1)); else theta(n) = atan2(yp(n+1)‐yp(n‐1),xp(n+1)‐xp(n‐1)); end ArcLength = ArcLength + sqrt( (yp(n)‐yp(n‐1))^2 + (xp(n)‐xp(n‐1))^2 ); end TrueArcLength = ArcLength*R; theta(1)=theta(2); theta(Num) = theta(Num‐1); %plot(TS(1,:),theta) %Generate Offset Parabola for n = 1:Num if xp(n) <= 0 TSO(:,n) = TS(:,n) + [sin(theta(n)); cos(theta(n))]*ope; else TSO(:,n) = TS(:,n) + [‐sin(theta(n)); cos(theta(n))]*ope; end end 118 | P a g e z = zeros(1,Num); RRay = zeros(2,Num); N = zeros(2,Num); for n = 1:Num inc = theta(n) ‐ ape; RRay(:,n) = [fp(1)‐TSO(1,n); fp(2)‐TSO(2,n)]; if xp(n) <0 N(:,n) = [sin(inc); cos(inc)]; del = acos(dot(RRay(:,n),N(:,n))/(mag(RRay(:,n))*mag(N(:,n)))) ‐ inc; else N(:,n) = [‐sin(inc); cos(inc)]; del = ‐acos(dot(RRay(:,n),N(:,n))/(mag(RRay(:,n))*mag(N(:,n)))) + inc; end z(n) = sqrt(RRay(1,n)^2 + RRay(2,n)^2)*sin(del); end end 119 | P a g e Appendix I: Energy Calculations
For the purposes of this discussion, a standard 1 [m2] reflector will be used. This means that the projected reflector area normal to the light source (Sun) is 1 [m2]. 0.25
1
∆
0.25
2676
84
0.64
1. Furthermore, from a chemical balance of the biomass, the process requires an input of energy to cause breakdown of hemicellulose, which for the biomass used here is on the order of 1.77 [MJ/kg], making the energy input required for chemical transformation of the sample: 1
1.77
1.77
2. Summed together, the total energy needed to drive off the water produced and undergo chemical transformation in the 1 [kg] sample is: 0.64
1.77
2.41
3. From the average Ghanaian solar intensity and 1[m2] collector, the total time required to torrefy 1 [kg] is: 2.41
0.75
3987
1.1
4. The design outlined in the reactor section of this paper holds an estimated 1.25 [kg] of biowaste and has an average normal area of 2 [m2]. Assuming that 5% of solar radiation is lost per glass‐air transition (as suggested by Professor Borton), the total cook time per reactor load is then: 66
1.25
1
750
1500
0.95
48
5. 120 | P a g e Appendix J: Torque Calculations
∗ (1)
∗
(2)
√
Where d is approximately one third of the arc length of the panel. ∗ (3)
At a wind speed of 20 [mph] and panel at 45 degrees (as shown) the approximate torque on the panel is 125 [in‐lb]. This calculation was used to determine the rated driving torque for the collector. A gearbox with a rated output torque of 445 [in‐lb] was selected. There is a concern that a passerby will hang from the edge of the collector. A 250 [lb] person could exert ~10,000 [in‐lb] on the gearbox. If this is deemed an unacceptable failure mode that requires mitigation then there are two clear paths. First the gearbox could be oversized to accommodate this load or a clutch or torque‐limiting device is placed in the drive‐
train. 60 Therefore, for the rated output torque of 445 [in‐lb], the input torque is: ,
(4)
9
With Aluminum on Aluminum contact and 2.5 in diameter escape wheel, the friction on the follower holding the escape wheel is: (5)
∗
,
. .
8.6
The force on the cam varies over the course of its rotation. It is a maximum when the offset direction from center is perpendicular to the contact point to the center. Assuming a 1.5 [lb] spring and cam has a mechanical advantage of 2 with respect to the spring, the force on the cam is: (6)
,
9.3
,
The friction force is perpendicular to the cam force. Now inserting the respective radii, a solution for the minimum cam torque is found. (7)
,
,
,
,
,
5.6
This will be used in the selection of the gear motor that will actuate the cam. 121 | P a g e Appendix K: CAD Section CAD Images Figure 61: Complete CAD Model of the device Figure 62: Reactor/Receiver with Insert 122 | P a g e Figure 63: Reactor (end view) Figure 64: Reactor (both ends) 123 | P a g e Figure 65: Reactor Mounting Bracket Figure 66: Reflector CAD image 124 | P a g e 8
5
6
7
4
15
21
6
D
2
3
20
5
ITEM
NO.
1
2
3
4
5
6
7
8
9
10
11
12
13
14
15
16
17
31
28
19
1
C
16
14
2
17
17
10
9
1
PART NUMBER
Description
QTY.
Gearbox
GearboxCover
EscapementMountingPlate
Wheel
GearboxMountingPlate
SolarPanel
Gearmotor
6436K15
OTS
Modified
Fabricated
Fabficated
Modifed
OTS
OTS
OTS Mcmaster
1
1
1
1
1
2
1
1
9489T45
Shaft_Input
CircuitBoard
LimitSwitch
Cam
OutputCoupler_Outer
OutputCoupler_Inner
ShaftSealMountandBearing
ShearDisc_Assy
OTS Mcmaster
Fabricated
Fabricated
OTS Mouser
Fabricated
Fabricated
Fabricated
Fabricated
Fabricated
2
1
1
1
1
1
1
2
1
18 InputCrankHandle
OTS Mcmaster
1
19 SolarPanelRibSpacer
Modified OTS
Mcmaster
4
Fabricated
1
OTS Mcmaster
1
20 SolarPanelandPulleyMount
21 ShaftCoupler
4
B
8
24
18
25
7
27
3
30
12
DIMENSIONS ARE IN INCHES
TOLERANCES:
FRACTIONAL
ANGULAR: MACH
BEND
TWO PLACE DECIMAL
THREE PLACE DECIMAL
23
A
INTERPRET GEOMETRIC
TOLERANCING PER:
PROPRIETARY AND CONFIDENTIAL
THE INFORMATION CONTAINED IN THIS
DRAWING IS THE SOLE PROPERTY OF
<INSERT COMPANY NAME HERE>. ANY
REPRODUCTION IN PART OR AS A WHOLE
WITHOUT THE WRITTEN PERMISSION OF
<INSERT COMPANY NAME HERE> IS
PROHIBITED.
7
6
Fabricated
Fabricated
Fabricated
Fabricated
Fabricated
Fabricated
1
1
1
1
1
1
28
29
30
31
Switch
BushingFollowerRightSpacer
CircuitBoardStandoff
BN4100806CH_Modified
OTS Mouser
Fabricated
Fabricated
Modified
1
1
4
1
UNLESS OTHERWISE SPECIFIED:
26
8
Follower_Right
Follower_Left
CatchBlock
BushingFollowerRight
BushingFollowerLeftSpacer
BushingFollowerLeft
C
B
13
22
11
22
23
24
25
26
27
D
5
MATERIAL
USED ON
NEXT ASSY
APPLICATION
4
NAME
DATE
DRAWN
RPI Design Lab: Biomass
CHECKED
TITLE:
A
ENG APPR.
MFG APPR.
Q.A.
COMMENTS:
SIZE DWG. NO.
B
FINISH
2
REV
SHEET 1 OF 1
SCALE: 1:12 WEIGHT:
DO NOT SCALE DRAWING
3
Exploded View
1
.390
.313
2X
.107 THRU ALL
6-32 UNC THRU ALL
.625
UNLESS OTHERWISE SPECIFIED:
DIMENSIONS ARE IN INCHES
TOLERANCES:
FRACTIONAL
ANGULAR: MACH
BEND
TWO PLACE DECIMAL
.02
THREE PLACE DECIMAL
.005
INTERPRET GEOMETRIC
TOLERANCING PER:
PROPRIETARY AND CONFIDENTIAL
THE INFORMATION CONTAINED IN THIS
DRAWING IS THE SOLE PROPERTY OF
<INSERT COMPANY NAME HERE>. ANY
REPRODUCTION IN PART OR AS A WHOLE
WITHOUT THE WRITTEN PERMISSION OF
<INSERT COMPANY NAME HERE> IS
PROHIBITED.
5
MATERIAL
USED ON
NEXT ASSY
APPLICATION
4
NAME
DATE
DRAWN
TITLE:
CHECKED
ENG APPR.
5/8 Clamp Collar Mod.
MFG APPR.
Q.A.
COMMENTS:
SIZE DWG. NO.
A
Alexander Nolet
FINISH
6436K150_Modified
2
REV
SHEET 1 OF 1
SCALE: 2:1 WEIGHT:
DO NOT SCALE DRAWING
3
RPI Design Lab: Biomass
1
8
5
6
7
4
2
3
1
Matches the hole in the Gearbox Mounting Plate
D
1.0
D
A
1.5
1.0
For Toggle Switch
2.500
4.475
3.0
3X
.291
1.190
3X 7mm Clearance
1.98
Same offset distance
down as Gearbox
1.460
4X
.150
.130
1.460
C
4X
.150
.130
4X #6 Clearance
B
C
B
2.05
4.75
R.25
4X
19/64
1.0
.20
Modify Existing Part
.50
UNLESS OTHERWISE SPECIFIED:
DETAIL A
DIMENSIONS ARE IN INCHES
TOLERANCES:
FRACTIONAL
ANGULAR: MACH
BEND
TWO PLACE DECIMAL
.03
THREE PLACE DECIMAL
.005
.30
A
INTERPRET GEOMETRIC
TOLERANCING PER:
PROPRIETARY AND CONFIDENTIAL
THE INFORMATION CONTAINED IN THIS
DRAWING IS THE SOLE PROPERTY OF
<INSERT COMPANY NAME HERE>. ANY
REPRODUCTION IN PART OR AS A WHOLE
WITHOUT THE WRITTEN PERMISSION OF
<INSERT COMPANY NAME HERE> IS
PROHIBITED.
1.5
8
7
6
5
MATERIAL
USED ON
NEXT ASSY
APPLICATION
4
NAME
DATE
DRAWN
RPI Design Lab: Biomass
TITLE:
CHECKED
NEMA Enclosure Mods
ENG APPR.
MFG APPR.
Q.A.
COMMENTS:
SIZE DWG. NO.
BN4100806CH_Modified
B
FINISH
2
REV
SHEET 1 OF 1
SCALE: 1:2.5WEIGHT:
DO NOT SCALE DRAWING
3
A
1
0.100
+0.005
0.236 0.000 THRU
0.13
8-32 Tapped
0.6
0.350
0.50
1.00
0.50
QTY. 1
UNLESS OTHERWISE SPECIFIED:
DIMENSIONS ARE IN INCHES
TOLERANCES:
FRACTIONAL
ANGULAR: MACH
BEND
TWO PLACE DECIMAL
.02
THREE PLACE DECIMAL .005
INTERPRET GEOMETRIC
TOLERANCING PER:
PROPRIETARY AND CONFIDENTIAL
THE INFORMATION CONTAINED IN THIS
DRAWING IS THE SOLE PROPERTY OF
<INSERT COMPANY NAME HERE>. ANY
REPRODUCTION IN PART OR AS A WHOLE
WITHOUT THE WRITTEN PERMISSION OF
<INSERT COMPANY NAME HERE> IS
PROHIBITED.
5
MATERIAL
USED ON
NEXT ASSY
APPLICATION
4
CRS
NAME
DATE
DRAWN
ENG APPR.
MFG APPR.
Q.A.
COMMENTS:
Alexander Nolet
FINISH
SIZE DWG. NO.
A
REV
Cam
1
SHEET 1 OF 1
SCALE: 2:1 WEIGHT:
DO NOT SCALE DRAWING
3
RPI Design Lab: Biomass
TITLE:
CHECKED
2
1
Really flexible on the Diameter
.5
.089
4-40 UNC
.350
.220
.159
10-32 UNF
.25
3.25
.25
Tapped Depths are approxiamate
UNLESS OTHERWISE SPECIFIED:
DIMENSIONS ARE IN INCHES
TOLERANCES:
FRACTIONAL
ANGULAR: MACH
BEND
TWO PLACE DECIMAL
THREE PLACE DECIMAL
INTERPRET GEOMETRIC
TOLERANCING PER:
PROPRIETARY AND CONFIDENTIAL
THE INFORMATION CONTAINED IN THIS
DRAWING IS THE SOLE PROPERTY OF
<INSERT COMPANY NAME HERE>. ANY
REPRODUCTION IN PART OR AS A WHOLE
WITHOUT THE WRITTEN PERMISSION OF
<INSERT COMPANY NAME HERE> IS
PROHIBITED.
5
MATERIAL
USED ON
NEXT ASSY
APPLICATION
4
.656
.500
This step doesn't have to be
consistent across parts. The narrower
width at the face is what's inmportant
NAME
DATE
DRAWN
TITLE:
CHECKED
ENG APPR.
MFG APPR.
Q.A.
COMMENTS:
SIZE DWG. NO.
REV
CircuitBoardStandoff
A
FINISH
3
SHEET 1 OF 1
SCALE: 1:1 WEIGHT:
DO NOT SCALE DRAWING
2
1
8
7
5
6
4
2
3
1
D
D
1.750
C
C
1.600
0.156 THRU
0
5 -0..000
005
0.075 2X
2.000
B
1.500
0.62
UNLESS OTHERWISE SPECIFIED:
DIMENSIONS ARE IN INCHES
TOLERANCES:
FRACTIONAL
ANGULAR: MACH
BEND
TWO PLACE DECIMAL
THREE PLACE DECIMAL .020
A
INTERPRET GEOMETRIC
TOLERANCING PER:
PROPRIETARY AND CONFIDENTIAL
THE INFORMATION CONTAINED IN THIS
DRAWING IS THE SOLE PROPERTY OF
<INSERT COMPANY NAME HERE>. ANY
REPRODUCTION IN PART OR AS A WHOLE
WITHOUT THE WRITTEN PERMISSION OF
<INSERT COMPANY NAME HERE> IS
PROHIBITED.
8
7
6
5
MATERIAL
B
NAME
DATE
DRAWN
TITLE:
CHECKED
A
ENG APPR.
MFG APPR.
Q.A.
COMMENTS:
SIZE DWG. NO.
B
Aluminum 6061
USED ON
NEXT ASSY
APPLICATION
4
FINISH
REV
Drum
SHEET 1 OF 1
SCALE: 1:1 WEIGHT:
DO NOT SCALE DRAWING
3
Design Lab - Biomass
2
1
.813
0
.813
1.3
1.3
.252 THRU ALL
.496 X 90°
4X
4X 6mm Flathead
1.5
+.005
.983 - .000 THRU
1.625
2.100
4.000
2.200
2.624
.150
2X
.144 THRU ALL
.279 X 100°, FAR SIDE
2X #6 Flathead, Farside
.276
+.005
.472 - .000 THRU ALL
1.220
R.13
DIMENSIONS ARE IN INCHES
TOLERANCES:
FRACTIONAL 1/32
ANGULAR: MACH
BEND
TWO PLACE DECIMAL
.02
THREE PLACE DECIMAL
.005
MATERIAL
Aluminum 6061 T6
NEXT ASSY
USED ON
APPLICATION
FINISH
DO NOT SCALE DRAWING
.070 THRU ALL
1/8 Thickness
.730
.128
0
.128
.730
2X
PROPRIETARY AND CONFIDENTIAL
THE INFORMATION CONTAINED IN THIS
DRAWING IS THE SOLE PROPERTY OF
<INSERT COMPANY NAME HERE>. ANY
REPRODUCTION IN PART OR AS A WHOLE
WITHOUT THE WRITTEN PERMISSION OF
<INSERT COMPANY NAME HERE> IS
PROHIBITED.
R.25 x4
.500
2X #0 Clearance
.126 THRU ALL
.248 X 90°
6X 3mm Flathead
6X
.975
QTY 1
NAME
DRAWN
DATE
RPI Design Lab: Biomass
CHECKED
ENG APPR.
MFG APPR.
Q.A.
COMMENTS:
Alexander Nolet SIZE DWG. NO.
REV.
A EscapementMountingPlate 1
SCALE:1:1
WEIGHT:
SHEET 1 OF 1
+.000
1.850 - .005
.40
1.57
.020 X 45.00°
1.625
#10 Clearance Hole x4
.10
1.625
2.35
UNLESS OTHERWISE SPECIFIED:
DIMENSIONS ARE IN INCHES
TOLERANCES:
FRACTIONAL
ANGULAR: MACH 3 BEND
TWO PLACE DECIMAL
.010
THREE PLACE DECIMAL
.005
INTERPRET GEOMETRIC
TOLERANCING PER:
PROPRIETARY AND CONFIDENTIAL
THE INFORMATION CONTAINED IN THIS
DRAWING IS THE SOLE PROPERTY OF
<INSERT COMPANY NAME HERE>. ANY
REPRODUCTION IN PART OR AS A WHOLE
WITHOUT THE WRITTEN PERMISSION OF
<INSERT COMPANY NAME HERE> IS
PROHIBITED.
5
MATERIAL
USED ON
NEXT ASSY
APPLICATION
4
NAME
DATE
DRAWN
TITLE:
CHECKED
ENG APPR.
MFG APPR.
Q.A.
COMMENTS:
SIZE DWG. NO.
Alloy Steel Alexander Nolet
A
FINISH
GearboxCover
2
REV
1
SHEET 1 OF 1
SCALE: 1:1 WEIGHT:
DO NOT SCALE DRAWING
3
RPI Desin Lab: Biomass
1
2.75
2.75
Matches Hole in Box Modification
Fits on Locating Step on Gearbox
+.005
Suggestion:
2.680 - .000
1.
Bolt Plate into Enclosure
2.
Drill 5/8 Clearance Hole
through back of box and
gearbox mounting plate
3.
Use hole in plate as
reference
3X
.299
.080
3X 7mm Clearance
1.640
3.0
6X #4 Clearance
1.5
2.8
4X
.177 THRU ALL
4X #8 Clearance
3.0
2.20
4X Existing Mounting Holes
2.750
2.35
Modify Existing Plate
UNLESS OTHERWISE SPECIFIED:
DIMENSIONS ARE IN INCHES
TOLERANCES:
FRACTIONAL
ANGULAR: MACH
BEND
TWO PLACE DECIMAL
.03
THREE PLACE DECIMAL
.005
INTERPRET GEOMETRIC
TOLERANCING PER:
PROPRIETARY AND CONFIDENTIAL
THE INFORMATION CONTAINED IN THIS
DRAWING IS THE SOLE PROPERTY OF
<INSERT COMPANY NAME HERE>. ANY
REPRODUCTION IN PART OR AS A WHOLE
WITHOUT THE WRITTEN PERMISSION OF
<INSERT COMPANY NAME HERE> IS
PROHIBITED.
5
MATERIAL
USED ON
NEXT ASSY
APPLICATION
4
NAME
DATE
DRAWN
RPI Design Lab: Biomass
TITLE:
CHECKED
ENG APPR.
MFG APPR.
Q.A.
COMMENTS:
SIZE DWG. NO.
GearboxMountingPlate
A
FINISH
3
SHEET 1 OF 1
SCALE: 1:2 WEIGHT:
DO NOT SCALE DRAWING
2
REV
1
3.75
4.00
0.80
1.50
0.00
0.25
Fillet Corners On Sander
2x
0.201 THRU ALL
1/4-20 UNC THRU ALL
0.201 THRU ALL
UNLESS OTHERWISE SPECIFIED:
DIMENSIONS ARE IN INCHES
TOLERANCES:
FRACTIONAL
ANGULAR: MACH
BEND
TWO PLACE DECIMAL
.02
THREE PLACE DECIMAL .010
INTERPRET GEOMETRIC
TOLERANCING PER:
PROPRIETARY AND CONFIDENTIAL
THE INFORMATION CONTAINED IN THIS
DRAWING IS THE SOLE PROPERTY OF
<INSERT COMPANY NAME HERE>. ANY
REPRODUCTION IN PART OR AS A WHOLE
WITHOUT THE WRITTEN PERMISSION OF
<INSERT COMPANY NAME HERE> IS
PROHIBITED.
5
MATERIAL
USED ON
NEXT ASSY
APPLICATION
4
FINISH
NAME
DATE
DRAWN
RPI Design Lab: Biomass
TITLE:
CHECKED
ENG APPR.
MFG APPR.
Q.A.
COMMENTS:
Aluminum 6061 Alexander Nolet
SIZE DWG. NO.
REV
A InputCrank 1
SHEET 1 OF 1
SCALE: 1:1 WEIGHT:
DO NOT SCALE DRAWING
3
0.25
2
1
8
7
5
6
4
2
3
1
D
D
1.625 2X
1.169 2X
0
0.331
1.500
C
C
+0.020
0.625 0.000 THRU
2.669
4.000
0.236 THRU 4X
UNIFORMLY CIRCULAR PATTERNED
6/32 TAPPED 2X
B
B
8.000
R0
.25
04
0.150
x
UNLESS OTHERWISE SPECIFIED:
DIMENSIONS ARE IN INCHES
TOLERANCES:
FRACTIONAL
ANGULAR: MACH
BEND
TWO PLACE DECIMAL
THREE PLACE DECIMAL
0.020
A
INTERPRET GEOMETRIC
TOLERANCING PER:
PROPRIETARY AND CONFIDENTIAL
THE INFORMATION CONTAINED IN THIS
DRAWING IS THE SOLE PROPERTY OF
<INSERT COMPANY NAME HERE>. ANY
REPRODUCTION IN PART OR AS A WHOLE
WITHOUT THE WRITTEN PERMISSION OF
<INSERT COMPANY NAME HERE> IS
PROHIBITED.
8
7
6
5
MATERIAL
NAME
DATE
DRAWN
TITLE:
CHECKED
A
ENG APPR.
MFG APPR.
Q.A.
COMMENTS:
SIZE DWG. NO.
USED ON
APPLICATION
4
FINISH
SHEET 1 OF 1
SCALE: 1:2 WEIGHT:
DO NOT SCALE DRAWING
3
REV
BMountingPlate
Aluminum 6061
NEXT ASSY
Design Lab - Biomass
2
1
2X
.136
8-32 UNC
.180
.500
.330
5.0
.625
DIMENSIONS ARE IN INCHES
TOLERANCES:
FRACTIONAL
ANGULAR: MACH
BEND
TWO PLACE DECIMAL
.05
THREE PLACE DECIMAL
.005
PROPRIETARY AND CONFIDENTIAL
THE INFORMATION CONTAINED IN THIS
DRAWING IS THE SOLE PROPERTY OF
<INSERT COMPANY NAME HERE>. ANY
REPRODUCTION IN PART OR AS A WHOLE
WITHOUT THE WRITTEN PERMISSION OF
<INSERT COMPANY NAME HERE> IS
PROHIBITED.
MATERIAL
NAME
DRAWN
DATE
RPI Design Lab: Biomass
CHECKED
ENG APPR.
MFG APPR.
Q.A.
COMMENTS:
NEXT ASSY
USED ON
APPLICATION
FINISH
DO NOT SCALE DRAWING
Alexander Nolet SIZE DWG. NO.
A OutputCoupler_Inner
SCALE:1:2
WEIGHT:
SHEET 1 OF 1
REV.
+.010
.625 - .000
.438
.440
2X
.136
8-32 UNC
.500
.330
.440
+.001
.250 - .001
3.25
1.125
DIMENSIONS ARE IN INCHES
TOLERANCES:
FRACTIONAL
ANGULAR: MACH
BEND
TWO PLACE DECIMAL
.02
THREE PLACE DECIMAL
.005
PROPRIETARY AND CONFIDENTIAL
THE INFORMATION CONTAINED IN THIS
DRAWING IS THE SOLE PROPERTY OF
<INSERT COMPANY NAME HERE>. ANY
REPRODUCTION IN PART OR AS A WHOLE
WITHOUT THE WRITTEN PERMISSION OF
<INSERT COMPANY NAME HERE> IS
PROHIBITED.
MATERIAL
NEXT ASSY
USED ON
APPLICATION
Alloy Steel
FINISH
DO NOT SCALE DRAWING
NAME
DRAWN
DATE
RPI Design Lab: Biomass
CHECKED
ENG APPR.
MFG APPR.
Q.A.
COMMENTS:
Alexander Nolet SIZE DWG. NO.
A OutputCoupler_Outer
SCALE:1:1
WEIGHT:
SHEET 1 OF 1
REV.
3.75
0.63
0.094
0.188
1.10
UNLESS OTHERWISE SPECIFIED:
DIMENSIONS ARE IN INCHES
TOLERANCES:
FRACTIONAL
ANGULAR: MACH
BEND
TWO PLACE DECIMAL
.02
THREE PLACE DECIMAL .005
INTERPRET GEOMETRIC
TOLERANCING PER:
PROPRIETARY AND CONFIDENTIAL
THE INFORMATION CONTAINED IN THIS
DRAWING IS THE SOLE PROPERTY OF
<INSERT COMPANY NAME HERE>. ANY
REPRODUCTION IN PART OR AS A WHOLE
WITHOUT THE WRITTEN PERMISSION OF
<INSERT COMPANY NAME HERE> IS
PROHIBITED.
5
MATERIAL
Plain Carbon Steel
USED ON
NEXT ASSY
APPLICATION
4
NAME
DATE
DRAWN
ENG APPR.
MFG APPR.
Q.A.
COMMENTS:
Alexander Nolet
FINISH
SIZE DWG. NO.
REV
A Shaft_Input 1
SHEET 1 OF 1
SCALE: 1:1 WEIGHT:
DO NOT SCALE DRAWING
3
RPI Design Lab: Biomass
TITLE:
CHECKED
2
1
+0.020
1.625 - 0.020
+0.020
0.625 0.000
0.625
0.125
CLEARNACE FOR #6 THRU
0.279 X 100°
4x
Quantity: 2
UNLESS OTHERWISE SPECIFIED:
DIMENSIONS ARE IN INCHES
TOLERANCES:
FRACTIONAL
TWO PLACE DECIMAL
THREE PLACE DECIMAL .005
NAME
DATE
DRAWN
TITLE:
CHECKED
ENG APPR.
MFG APPR.
INTERPRET GEOMETRIC
TOLERANCING PER:
PROPRIETARY AND CONFIDENTIAL
THE INFORMATION CONTAINED IN THIS
DRAWING IS THE SOLE PROPERTY OF
<INSERT COMPANY NAME HERE>. ANY
REPRODUCTION IN PART OR AS A WHOLE
WITHOUT THE WRITTEN PERMISSION OF
<INSERT COMPANY NAME HERE> IS
PROHIBITED.
5
MATERIAL
Q.A.
COMMENTS:
SIZE DWG. NO.
A
Aluminum 6061
USED ON
NEXT ASSY
APPLICATION
4
FINISH
2
REV
SHEET 1 OF 1
SCALE: 2:1 WEIGHT:
DO NOT SCALE DRAWING
3
Shaft Seal Cover
1
0.730
0.300
0.250
B
+0.020
1.750 - 0.020
1.125
+0.020
0.625 0.000
C
6/32 TAPPED THRU
4X
Quantity: 2
UNLESS OTHERWISE SPECIFIED:
DIMENSIONS ARE IN INCHES
TOLERANCES:
FRACTIONAL
TWO PLACE DECIMAL
THREE PLACE DECIMAL
.005
A
NAME
DATE
DRAWN
TITLE:
CHECKED
ENG APPR.
Shaft Seal Mount
MFG APPR.
INTERPRET GEOMETRIC
TOLERANCING PER:
PROPRIETARY AND CONFIDENTIAL
THE INFORMATION CONTAINED IN THIS
DRAWING IS THE SOLE PROPERTY OF
<INSERT COMPANY NAME HERE>. ANY
REPRODUCTION IN PART OR AS A WHOLE
WITHOUT THE WRITTEN PERMISSION OF
<INSERT COMPANY NAME HERE> IS
PROHIBITED.
8
5
MATERIAL
Q.A.
COMMENTS:
SIZE DWG. NO.
A
Aluminum 6061
USED ON
NEXT ASSY
APPLICATION
7 4
FINISH
63
5 2
USED ON
NEXT ASSY
SCALE: 2:1 WEIGHT:
DO NOT SCALE DRAWING
REV
SHEET 1 OF 1
APPLICATION
4 1
MATERIAL
FINISH
ITEM NO.
1
2
3
PART NUMBER
ShearDisc_Outer
ShearDisc_Inner
ShearDisc_SprinPin
Description
Fabricated
Fabricated
OTS Mcmaster
ExpViewConfig/QTY.
1
1
1
3
2
1
UNLESS OTHERWISE SPECIFIED:
DIMENSIONS ARE IN INCHES
TOLERANCES:
FRACTIONAL
ANGULAR: MACH
BEND
TWO PLACE DECIMAL
THREE PLACE DECIMAL
INTERPRET GEOMETRIC
TOLERANCING PER:
PROPRIETARY AND CONFIDENTIAL
THE INFORMATION CONTAINED IN THIS
DRAWING IS THE SOLE PROPERTY OF
<INSERT COMPANY NAME HERE>. ANY
REPRODUCTION IN PART OR AS A WHOLE
WITHOUT THE WRITTEN PERMISSION OF
<INSERT COMPANY NAME HERE> IS
PROHIBITED.
5
MATERIAL
USED ON
NEXT ASSY
APPLICATION
4
NAME
DATE
DRAWN
RPI Design Lab: Biomass
TITLE:
CHECKED
ENG APPR.
MFG APPR.
Q.A.
COMMENTS:
SIZE DWG. NO.
A
FINISH
2
REV
SHEET 1 OF 1
SCALE: 1:1 WEIGHT:
DO NOT SCALE DRAWING
3
ShearDisc_Assy
1
.625
+.002
.125 - .002
.180
#8 Clearance x2
.016 X 45.00° x2
DIMENSIONS ARE IN INCHES
TOLERANCES:
FRACTIONAL
ANGULAR: MACH
BEND
TWO PLACE DECIMAL
.020
THREE PLACE DECIMAL
.005
PROPRIETARY AND CONFIDENTIAL
THE INFORMATION CONTAINED IN THIS
DRAWING IS THE SOLE PROPERTY OF
<INSERT COMPANY NAME HERE>. ANY
REPRODUCTION IN PART OR AS A WHOLE
WITHOUT THE WRITTEN PERMISSION OF
<INSERT COMPANY NAME HERE> IS
PROHIBITED.
MATERIAL
NEXT ASSY
USED ON
APPLICATION
Alloy Steel
FINISH
DO NOT SCALE DRAWING
.300
NAME
DATE
DRAWN
RPI Design Lab: Biomass
CHECKED
ENG APPR.
MFG APPR.
Q.A.
COMMENTS:
Alexander Nolet
SIZE
A
DWG. NO.
SCALE:4:1
ShearDisc_Inner
WEIGHT:
SHEET 1 OF 1
REV.
1
1.13
+.002
.125 - .002
.625
.440
#8 Clearance x2
.020 X 45.00° x2
DIMENSIONS ARE IN INCHES
TOLERANCES:
FRACTIONAL
ANGULAR: MACH
BEND
TWO PLACE DECIMAL
.020
THREE PLACE DECIMAL
.005
PROPRIETARY AND CONFIDENTIAL
THE INFORMATION CONTAINED IN THIS
DRAWING IS THE SOLE PROPERTY OF
<INSERT COMPANY NAME HERE>. ANY
REPRODUCTION IN PART OR AS A WHOLE
WITHOUT THE WRITTEN PERMISSION OF
<INSERT COMPANY NAME HERE> IS
PROHIBITED.
MATERIAL
NEXT ASSY
USED ON
APPLICATION
Alloy Steel
FINISH
DO NOT SCALE DRAWING
.300
NAME
DRAWN
CHECKED
ENG APPR.
DATE
RPI Design Lab: Biomass
Alexander Nolet
MFG APPR.
Q.A.
COMMENTS:
SIZE
A
DWG. NO.
SCALE:2:1
ShearDisc_Outer
WEIGHT:
SHEET 1 OF 1
REV.
1
Top
.201 THRU ALL
.375
.200
4X
.125 THRU ALL
.450
.200
8X
4.100
Bottom
4.850
4.750
.75
9.00
3.900
.80
1.000
2.75
3.900
1.0
8.50
2X #6 Clearance THRU FACE
.150 THRU
2X
UNLESS OTHERWISE SPECIFIED:
DIMENSIONS ARE IN INCHES
TOLERANCES:
FRACTIONAL
ANGULAR: MACH
BEND
TWO PLACE DECIMAL
.02
THREE PLACE DECIMAL
.005
INTERPRET GEOMETRIC
TOLERANCING PER:
PROPRIETARY AND CONFIDENTIAL
THE INFORMATION CONTAINED IN THIS
DRAWING IS THE SOLE PROPERTY OF
<INSERT COMPANY NAME HERE>. ANY
REPRODUCTION IN PART OR AS A WHOLE
WITHOUT THE WRITTEN PERMISSION OF
<INSERT COMPANY NAME HERE> IS
PROHIBITED.
5
MATERIAL
NAME
7.2
DATE
DRAWN
TITLE:
CHECKED
ENG APPR.
MFG APPR.
Q.A.
COMMENTS:
SIZE DWG. NO.
SolarPanelandPulleyMount
A
Q.A.
MATERIAL
USED ON
FINISH
APPLICATION
4
RPI Design Lab: Biomass
FINISH
3
SHEET 1 OF 1
SCALE: 1:4 WEIGHT:
DO NOT SCALE DRAWING
SHEET 1 OF 1
2
REV
1
.40
.280
.144
.200
.10
QTY 1
DIMENSIONS ARE IN INCHES
TOLERANCES:
FRACTIONAL
ANGULAR: MACH
BEND
TWO PLACE DECIMAL
.02
THREE PLACE DECIMAL
.005
PROPRIETARY AND CONFIDENTIAL
THE INFORMATION CONTAINED IN THIS
DRAWING IS THE SOLE PROPERTY OF
<INSERT COMPANY NAME HERE>. ANY
REPRODUCTION IN PART OR AS A WHOLE
WITHOUT THE WRITTEN PERMISSION OF
<INSERT COMPANY NAME HERE> IS
PROHIBITED.
MATERIAL
NEXT ASSY
USED ON
APPLICATION
Bronze
FINISH
DO NOT SCALE DRAWING
NAME
DRAWN
DATE
RPI Design Lab: Biomass
CHECKED
ENG APPR.
MFG APPR.
Q.A.
COMMENTS:
SIZE
A
DWG. NO.
SCALE:4:1
BushingFollowerLeft
WEIGHT:
SHEET 1 OF 1
REV.
.40
.21
.150
QTY 1
DIMENSIONS ARE IN INCHES
TOLERANCES:
FRACTIONAL
ANGULAR: MACH
BEND
TWO PLACE DECIMAL
.02
THREE PLACE DECIMAL
.005
PROPRIETARY AND CONFIDENTIAL
THE INFORMATION CONTAINED IN THIS
DRAWING IS THE SOLE PROPERTY OF
<INSERT COMPANY NAME HERE>. ANY
REPRODUCTION IN PART OR AS A WHOLE
WITHOUT THE WRITTEN PERMISSION OF
<INSERT COMPANY NAME HERE> IS
PROHIBITED.
MATERIAL
NAME
DRAWN
DATE
RPI Design Lab: Biomass
CHECKED
ENG APPR.
MFG APPR.
Q.A.
COMMENTS:
NEXT ASSY
USED ON
APPLICATION
FINISH
DO NOT SCALE DRAWING
SIZE
DWG. NO.
A BushingFollowerLeftSpacer
SCALE:8:1
WEIGHT:
SHEET 1 OF 1
REV.
.40
.144
.10
.150
.200
QTY 1
DIMENSIONS ARE IN INCHES
TOLERANCES:
FRACTIONAL
ANGULAR: MACH
BEND
TWO PLACE DECIMAL
.02
THREE PLACE DECIMAL
.005
PROPRIETARY AND CONFIDENTIAL
THE INFORMATION CONTAINED IN THIS
DRAWING IS THE SOLE PROPERTY OF
<INSERT COMPANY NAME HERE>. ANY
REPRODUCTION IN PART OR AS A WHOLE
WITHOUT THE WRITTEN PERMISSION OF
<INSERT COMPANY NAME HERE> IS
PROHIBITED.
MATERIAL
NEXT ASSY
USED ON
APPLICATION
Bronze
FINISH
DO NOT SCALE DRAWING
NAME
DRAWN
DATE
RPI Design Lab: Biomass
CHECKED
ENG APPR.
MFG APPR.
Q.A.
COMMENTS:
SIZE
DWG. NO.
A BushingFollowerRight
SCALE:4:1
WEIGHT:
SHEET 1 OF 1
REV.
.40
.020
.21
QTY 1
DIMENSIONS ARE IN INCHES
TOLERANCES:
FRACTIONAL
ANGULAR: MACH
BEND
TWO PLACE DECIMAL
.020
THREE PLACE DECIMAL
.005
PROPRIETARY AND CONFIDENTIAL
THE INFORMATION CONTAINED IN THIS
DRAWING IS THE SOLE PROPERTY OF
<INSERT COMPANY NAME HERE>. ANY
REPRODUCTION IN PART OR AS A WHOLE
WITHOUT THE WRITTEN PERMISSION OF
<INSERT COMPANY NAME HERE> IS
PROHIBITED.
MATERIAL
NEXT ASSY
USED ON
APPLICATION
Bronze
FINISH
DO NOT SCALE DRAWING
NAME
DRAWN
DATE
RPI Design Lab: Biomass
CHECKED
ENG APPR.
MFG APPR.
Q.A.
COMMENTS:
SIZE
DWG. NO.
A BushingFollowerRightSpacer
SCALE:8:1
WEIGHT:
SHEET 1 OF 1
REV.
8
6
7
5
4
2
3
1
D
D
14.00
C
C
60.00
B
B
.75
UNLESS OTHERWISE SPECIFIED:
DIMENSIONS ARE IN INCHES
TOLERANCES:
FRACTIONAL
ANGULAR: MACH
BEND
TWO PLACE DECIMAL
THREE PLACE DECIMAL
A
INTERPRET GEOMETRIC
TOLERANCING PER:
PROPRIETARY AND CONFIDENTIAL
THE INFORMATION CONTAINED IN THIS
DRAWING IS THE SOLE PROPERTY OF
<INSERT COMPANY NAME HERE>. ANY
REPRODUCTION IN PART OR AS A WHOLE
WITHOUT THE WRITTEN PERMISSION OF
<INSERT COMPANY NAME HERE> IS
PROHIBITED.
8
7
6
5
MATERIAL
NAME
DATE
DRAWN
TITLE:
CHECKED
USED ON
APPLICATION
4
FINISH
Router/Laser
MFG APPR.
Q.A.
COMMENTS:
SIZE DWG. NO.
B
Quantity: 5
Glue Rib
2
REV
1
SHEET 1 OF 1
SCALE: 1:16 WEIGHT:
DO NOT SCALE DRAWING
3
A
Glue Rib
ENG APPR.
3/4" Plywood
NEXT ASSY
Design Lab - Biomass
1
8
6
7
5
4
2
3
1
D
D
62.43
5x
.386±.005
C
C
14.26
.125
B
B
UNLESS OTHERWISE SPECIFIED:
DIMENSIONS ARE IN INCHES
TOLERANCES:
THREE PLACE DECIMAL
A
0.005
NAME
DATE
DRAWN
Design Lab - Biomass
TITLE:
CHECKED
MFG APPR.
INTERPRET GEOMETRIC
TOLERANCING PER:
PROPRIETARY AND CONFIDENTIAL
THE INFORMATION CONTAINED IN THIS
DRAWING IS THE SOLE PROPERTY OF
<INSERT COMPANY NAME HERE>. ANY
REPRODUCTION IN PART OR AS A WHOLE
WITHOUT THE WRITTEN PERMISSION OF
<INSERT COMPANY NAME HERE> IS
PROHIBITED.
8
7
6
5
MATERIAL
1/8" 6061
USED ON
NEXT ASSY
APPLICATION
4
FINISH
As Machined
Q.A.
COMMENTS:
SIZE DWG. NO.
B
Quantity: 7
Inner Rib
2
REV
1
SHEET 1 OF 1
SCALE: 1:16 WEIGHT:
DO NOT SCALE DRAWING
3
A
Inner Rib
ENG APPR.
1
8
7
6
5
4
2
3
1
D
D
52.25
1.00
A
C
C
DETAIL A
SCALE 1 : 2
.500
.500
B
2X
DETAIL B
SCALE 1 : 2
B
UNLESS OTHERWISE SPECIFIED:
DIMENSIONS ARE IN INCHES
TOLERANCES:
ANGULAR: 0.5
TWO PLACE DECIMAL 0.050
THREE PLACE DECIMAL
0.005
A
DRAWN
.257 THRU
B
NAME
DATE
HBW
3/21/2012
Design Lab - Biomass
TITLE:
CHECKED
MFG APPR.
INTERPRET GEOMETRIC
TOLERANCING PER:
MATERIAL
Q.A.
COMMENTS:
SIZE DWG. NO.
B
1" x 0.072" Sq. Steel Tube
FINISH
Quanity: 1
Mill
7
6
5
4
3
Crossbar
2
REV
1
SHEET 1 OF 1
SCALE: 1:8 WEIGHT:
DO NOT SCALE DRAWING
8
A
Crossbar
ENG APPR.
1
8
7
5
6
4
2
3
1
2.38
D
D
4.28
38.1°
6.00
2.01
76.3°
B
2.875
G
45.0°
10.75
VIEW G-G
SCALE 1 : 3
2.78
C
C
G
47.35
DETAIL D
SCALE 1 : 2
DETAIL C
SCALE 1 : 2
.26 THRU
4X
5/16-18 UNC THRU
46.0°
B
B
A
A
C
.625 THRU
51.9°
16.86
DETAIL B
SCALE 1 : 2
D
25.27
A
.257 THRU
UNLESS OTHERWISE SPECIFIED:
DIMENSIONS ARE IN INCHES
TOLERANCES:
ANGULAR: 0.5
TWO PLACE DECIMAL 0.050
THREE PLACE DECIMAL
0.005
DRAWN
NAME
DATE
HBW
3/21/2012
TITLE:
CHECKED
MATERIAL
Q.A.
COMMENTS:
SIZE DWG. NO.
B High Side
1" x 0.072" Sq. Steel Tube
FINISH
SECTION A-A
8
7
6
5
Quanity: 1
Mill
3
2
REV
1
SHEET 1 OF 1
SCALE: 1:8 WEIGHT:
DO NOT SCALE DRAWING
4
A
High Side
ENG APPR.
MFG APPR.
INTERPRET GEOMETRIC
TOLERANCING PER:
Design Lab - Biomass
1
8
5
6
7
4
2
3
1
6.25
B
.406 THRU
C
D
D
30.77
12.23
MITER 45
90.0°
D
2.60
A
76.1°
DETAIL A
SCALE 1 : 2
DETAIL C
SCALE 1 : 2
DETAIL B
SCALE 1 : 2
E
C
C
58.9°
90.0°
+.005
.500
- .000
B
B
DETAIL E
SCALE 1 : 2
DETAIL D
SCALE 1 : 2
48.00
UNLESS OTHERWISE SPECIFIED:
DIMENSIONS ARE IN INCHES
TOLERANCES:
ANGULAR: 0.5
TWO PLACE DECIMAL 0.050
THREE PLACE DECIMAL
0.005
A
DRAWN
NAME
DATE
HBW
3/21/2012
TITLE:
CHECKED
Support Frame
ENG APPR.
MFG APPR.
INTERPRET GEOMETRIC
TOLERANCING PER:
MATERIAL
Q.A.
COMMENTS:
SIZE DWG. NO.
B
1" x 0.072" Sq. Steel Tube
FINISH
Quanity: 1
Mill
7
6
5
4
3
Support Frame
2
REV
1
SHEET 1 OF 1
SCALE: 1:8 WEIGHT:
DO NOT SCALE DRAWING
8
Design Lab - Biomass
1
A
8
6
7
5
4
2
3
1
D
D
B
2.78
38.0°
.625 THRU
C
C
52.0°
34.02
DETAIL C
SCALE 1 : 2
DETAIL B
SCALE 1 : 2
B
B
C
19.28
.257
UNLESS OTHERWISE SPECIFIED:
DIMENSIONS ARE IN INCHES
TOLERANCES:
ANGULAR: 0.5
TWO PLACE DECIMAL 0.050
THREE PLACE DECIMAL
0.005
A
DRAWN
NAME
DATE
HBW
3/21/2012
TITLE:
CHECKED
MATERIAL
Q.A.
COMMENTS:
SIZE DWG. NO.
B Low Side
1" x 0.072" Sq. Steel Tube
FINISH
Quanity: 1
Mill
7
6
5
4
3
2
REV
1
SHEET 1 OF 1
SCALE: 1:8 WEIGHT:
DO NOT SCALE DRAWING
8
A
Low Side
ENG APPR.
MFG APPR.
INTERPRET GEOMETRIC
TOLERANCING PER:
Design Lab - Biomass
1
8
7
5
6
4
2
3
D
1
D
0.13in
3.18mm
A
60
g
de
PIC
TY
C
3.00in
76.20mm
5.00in
127mm
C
AL
3.500in
88.90mm
DRILL #9 THRU
B
B
A
SECTION A-A
UNLESS OTHERWISE SPECIFIED:
DIMENSIONS ARE IN INCHES
TOLERANCES:
FRACTIONAL
ANGULAR: MACH 0.5
TWO PLACE DECIMAL
0.010
THREE PLACE DECIMAL
0.005
A
INTERPRET GEOMETRIC
TOLERANCING PER:
MATERIAL
MILD STEEL
FINISH
AS MACHINED
DRAWN
NAME
DATE
HBW
2/29/2012
TITLE:
CHECKED
Lower Flange
ENG APPR.
MFG APPR.
Q.A.
COMMENTS:
SIZE DWG. NO.
Quantity: 1
7
6
5
4
3
B
Lower_Flange
2
REV
2
SHEET 1 OF 1
SCALE: 1:1 WEIGHT:
DO NOT SCALE DRAWING
8
Design Lab - Biomass
1
A
Note: This schematic is for use as a water jet cutting reference only. Do not use to machine other features.
5.00
3.00
.125
UNLESS OTHERWISE SPECIFIED:
DIMENSIONS ARE IN INCHES
TOLERANCES:
FRACTIONAL
ANGULAR: MACH
BEND
TWO PLACE DECIMAL
THREE PLACE DECIMAL
INTERPRET GEOMETRIC
TOLERANCING PER:
PROPRIETARY AND CONFIDENTIAL
THE INFORMATION CONTAINED IN THIS
DRAWING IS THE SOLE PROPERTY OF
<INSERT COMPANY NAME HERE>. ANY
REPRODUCTION IN PART OR AS A WHOLE
WITHOUT THE WRITTEN PERMISSION OF
<INSERT COMPANY NAME HERE> IS
PROHIBITED.
5
MATERIAL
Mild Steel
USED ON
NEXT ASSY
APPLICATION
4
FINISH
NAME
DATE
DRAWN
TITLE:
CHECKED
ENG APPR.
Lower_Flange_WJ
MFG APPR.
Q.A.
COMMENTS:
SIZE DWG. NO.
Quantity: 1
A
Mill
Lower_Flange_WJ
2
REV
2
SHEET 1 OF 1
SCALE: 1:2 WEIGHT:
DO NOT SCALE DRAWING
3
Design Lab - Biomass
1
8
7
5
6
4
2
3
1
0.500in
12.70mm
0.375in
9.53mm
0.250in
6.35mm
D
A
D
g
de
60
PIC
TY
C
3.117in ±0.001
79.17mm ±0.03
3.845in
97.66mm
4.000in
101.60mm
C
AL
3.500in
88.90mm
6X DRILL #25 0.45
TAP #10-24 0.25 MIN
B
B
A
SECTION A-A
SCALE 1 : 1
UNLESS OTHERWISE SPECIFIED:
DIMENSIONS ARE IN INCHES
TOLERANCES:
FRACTIONAL
ANGULAR: MACH 0.5
TWO PLACE DECIMAL
0.01
THREE PLACE DECIMAL
0.005
A
INTERPRET GEOMETRIC
TOLERANCING PER:
MATERIAL
MILD STEEL
FINISH
AS MACHINED
DRAWN
NAME
DATE
HBW
2/29/2012
TITLE:
CHECKED
Reactor Endcap
ENG APPR.
MFG APPR.
Q.A.
COMMENTS:
SIZE DWG. NO.
B
Quantity: 2
7
6
5
4
3
Reactor_Endcap
REV
2
SCALE: 1:2 WEIGHT: 0.63 lb SHEET 1 OF 1
DO NOT SCALE DRAWING
8
Design Lab - Biomass
2
1
A
Note: This schematic is for use as a water jet cutting reference only. Do not use to machine other features.
4.13
3.00
.50
UNLESS OTHERWISE SPECIFIED:
DIMENSIONS ARE IN INCHES
TOLERANCES:
FRACTIONAL
ANGULAR: MACH
BEND
TWO PLACE DECIMAL
THREE PLACE DECIMAL
INTERPRET GEOMETRIC
TOLERANCING PER:
PROPRIETARY AND CONFIDENTIAL
THE INFORMATION CONTAINED IN THIS
DRAWING IS THE SOLE PROPERTY OF
<INSERT COMPANY NAME HERE>. ANY
REPRODUCTION IN PART OR AS A WHOLE
WITHOUT THE WRITTEN PERMISSION OF
<INSERT COMPANY NAME HERE> IS
PROHIBITED.
5
MATERIAL
NAME
DATE
DRAWN
TITLE:
CHECKED
ENG APPR.
Reactor_Endcap_WJ
MFG APPR.
Q.A.
COMMENTS:
SIZE DWG. NO.
A
Mild Steel
USED ON
NEXT ASSY
APPLICATION
4
FINISH
Quantity: 2
Mill
Reactor_Endcap_WJ
2
REV
2
SHEET 1 OF 1
SCALE: 1:1 WEIGHT:
DO NOT SCALE DRAWING
3
Design Lab - Biomass
1
8
7
5
6
4
2
3
D
1
D
0.13in
3.18mm
A
60
g
de
PIC
TY
C
5.00in
127mm
C
AL
3.500in
88.90mm
DRILL #9 THRU
B
B
A
SECTION A-A
UNLESS OTHERWISE SPECIFIED:
DIMENSIONS ARE IN INCHES
TOLERANCES:
FRACTIONAL
ANGULAR: MACH 0.5
TWO PLACE DECIMAL
0.010
THREE PLACE DECIMAL
0.005
A
INTERPRET GEOMETRIC
TOLERANCING PER:
MATERIAL
MILD STEEL
FINISH
AS MACHINED
DRAWN
NAME
DATE
HBW
2/29/2012
TITLE:
CHECKED
Upper Flange
ENG APPR.
MFG APPR.
Q.A.
COMMENTS:
SIZE DWG. NO.
B
Quantity: 1
7
6
5
4
3
Upper_Flange
2
REV
2
SHEET 1 OF 1
SCALE: 1:1 WEIGHT:
DO NOT SCALE DRAWING
8
Design Lab - Biomass
1
A
Note: This schematic is for use as a water jet cutting reference only. Do not use to machine other features.
5.00
.125
UNLESS OTHERWISE SPECIFIED:
DIMENSIONS ARE IN INCHES
TOLERANCES:
FRACTIONAL
ANGULAR: MACH
BEND
TWO PLACE DECIMAL
THREE PLACE DECIMAL
INTERPRET GEOMETRIC
TOLERANCING PER:
PROPRIETARY AND CONFIDENTIAL
THE INFORMATION CONTAINED IN THIS
DRAWING IS THE SOLE PROPERTY OF
<INSERT COMPANY NAME HERE>. ANY
REPRODUCTION IN PART OR AS A WHOLE
WITHOUT THE WRITTEN PERMISSION OF
<INSERT COMPANY NAME HERE> IS
PROHIBITED.
5
MATERIAL
Mild Steel
USED ON
NEXT ASSY
APPLICATION
4
FINISH
NAME
DATE
DRAWN
TITLE:
CHECKED
ENG APPR.
Upper_Flange_WJ
MFG APPR.
Q.A.
COMMENTS:
SIZE DWG. NO.
Quantity: 1
A
Mill
Upper_Flange_WJ
2
REV
2
SHEET 1 OF 1
SCALE: 1:2 WEIGHT:
DO NOT SCALE DRAWING
3
Design Lab - Biomass
1