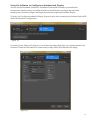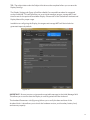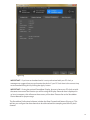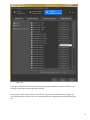
1
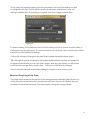
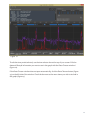
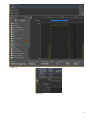
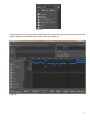
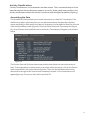
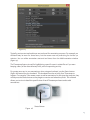
User Manual
SenseWear® Software
Version 8
BodyMedia®
SenseWear® 8.0 Software Manual
TABLE OF CONTENTS
•
•
•
•
•
•
•
•
•
•
•
•
Introduction
SenseWear Software
Retrieving Data to Your Computer
Viewing and Analyzing the Data
Viewing and Editing Health Indicators
Advanced Graphing of the Data
Annotating the Data
Creating Reports
Exporting Data
Application Preferences
Using the Software to Configure an Armband and Display
Troubleshooting Information
2
2
3
5
8
10
14
16
17
17
22
26
IMPORTANT: This product is not to be used as the sole basis for medical diagnosis, care, or treatment.
Read the entire SenseWear device Manual, including the section on CAUTIONS, before using the
SenseWear system.
WARNING: Be careful not to over-tighten the strap of the SenseWear Armband while on your arm.
If you feel constriction or loss of circulation at any time, loosen the adjustable strap and readjust it to a
more comfortable setting. If you experience pain, bruising, swelling, or discoloration of the arm,
discontinue use and consult a physician.
CAUTION: You must clean and disinfect the SenseWear Armband and Display before distributing
them to a new user. Information on how to properly clean and disinfect can be found in the Care
Instructions section of the SenseWear Armband & Display Manual.
CAUTION: When giving an Armband to a user, the SenseWear Quick Start Guide must also be
provided. Available from sensewear.bodymedia.com/Support/SW-User-Guides
IMPORTANT: If you choose to use the export or SFTP (Secure File Transfer Protocol) functionality, you
do so at your own risk. You are solely responsible for any disclosure of information resulting from use of
this information.
1
Introduction
Welcome to the BodyMedia SenseWear System. The SenseWear System, including the SenseWear
Software, allows you to retrieve and save physiological and lifestyle data collected by the SenseWear
Armband. Please read and follow these instructions before connecting the SenseWear Armband to your
computer.
This manual explains the setup of the system step-by-step: installing the software, configuring the
SenseWear Armband, and collecting and retrieving data from the Armband. Please read and follow these
directions.
SenseWear Software
To run the SenseWear Software or SenseWear Professional Software, the minimum requirements for
your PC are Pentium III or higher, with at least 256 MB of RAM, Windows XP / Vista / 7 32bit & 64bit / 8
64bit, video resolution of 1024x768 or higher, and a USB (Universal Serial Bus) port for the Armband
connection. To activate SenseWear Professional you will need to purchase the license key for an
additional cost. Please contact your distributor for details.
BodyMedia’s SenseWear Professional Software
• Retrieves and saves physiological and lifestyle data collected by the SenseWear Armband
• Organizes, graphs, and exports it for further analysis
• Offers an extra level of customization to configure the data collection channels of an
Armband, and the criteria used for Activity Level reporting.
In order to ensure proper data retrieval, please read and follow these instructions before connecting
the SenseWear Armband to your computer.
Step 1 – Installation
1. Download the SenseWear Software from sensewear.bodymedia.com.
2. Run the downloaded installer program.
3. After a few seconds the installation wizard appears. Follow the instructions on your screen.
4. Before starting SenseWear Professional, insert the license key into an available USB
port on your computer. Windows will detect the new hardware and load the
appropriate drivers. You may or may not see a visual confirmation; it depends on
your version of Windows.
During installation you may receive a pop-up window indicating that you do not have the proper
authorizations to install this product. If you receive this message, contact your Administrator or IT
Department for assistance.
Step 2 – Armband Configuration
Follow this procedure to configure the Armband before wearing it.
1. Before starting the software, insert the license key into an available USB port on your
computer.
2. Plug the USB cable into an available USB port on your computer.
2
3. Plug the opposite end of the USB cable into the Armband. Windows will detect the new
hardware and load the appropriate drivers. Depending upon your version of Windows, you
may or may not receive visual confirmation of the installation.
4. Double click the Armband icon on your desktop to open the SenseWear Software.
5. Click Configure Armband & Display at the top of the screen.
6. Click Retrieve Configuration.
7. Enter the appropriate information in the Subject Info tab.
8. Click Apply at the bottom of the window.
9. Leave the Armband plugged in until the battery LED (Light Emitting Display) is blinking green
to indicate a full charge.
10. Detach the Armband from the USB cable.
The Armband is now ready for data collection. Reference the SenseWear Armband and Display Manual
for instructions on how to wear the Armband.
Step 3 – Data Retrieval
1. If using SenseWear Professional, insert the license key into an available USB port on your
computer before starting the software.
2. Double click the SenseWear icon on your desktop to open the SenseWear Software.
3. Click the Retrieve Armband Data button.
4. Click Retrieve Data.
5. Name and save your file.
Retrieving Data to Your Computer
To start the program, plug in the license key (if you have one) into a USB port and double-click the
SenseWear icon on your desktop.
The main screen (figure 1) will appear as shown. There are three buttons at the top under the
menu bar: Retrieve Armband Data, View & Annotate Armband Data and Configure Armband &
Display. Retrieve Armband Data will already be selected.
Figure 1
Connect the USB cable to the Armband and to one of your computer’s USB ports. Then click Retrieve
Data to transfer data from the Armband to your PC. A window will pop up (figure 2), requesting you to
enter a file name. Enter a name and click Continue. The data file will be saved in your default directory.
3
Figure 2
If you want to change the location of your default directory, click Browse and select a new
destination directory.
IMPORTANT: After the Armband data has been successfully retrieved and saved to a data file, the
data is cleared. If you want the data to remain on the Armband, unselect the Clear Armband for
next use checkbox before clicking Continue.
If the Armband was not configured prior to wearing, you will receive a pop up window (figure 3) after
the data has been retrieved. The window will prompt you to enter the wearer’s Subject Info and
other important information needed to derive accurate lifestyle information. The subject
information MUST be entered to ensure that the software can accurately analyze the raw data
collected by the Armband. See Step 2, Armband Configuration, in the SenseWear Software section
above.
4
Figure 3
The software will display a message that you have successfully retrieved data in a pop up
window (figure 4). The retrieved data will be displayed automatically.
Figure 4
Viewing & Analyzing the Data
Data from the Armband will immediately be displayed after it is retrieved. If you would like to
view a previously saved data file, choose Open Data File or go to File on your menu bar and
select Open Data File. A window (figure 5) will open up to your default directory. Double click
on the data file you wish to open.
5
Figure 5
IMPORTANT: SenseWear Software and SenseWear Professional Software are designed to
work with MF (SenseWear WMS) armbands, MF-SW (BodyMedia) armbands, and their data
files. The software does not support other Armbands. The software does support existing data
files that were recorded with SenseWear Pro3 armbands.
On the View & Annotate Armband Data screen (figure 6), the total duration of the file and
on-body data collection times is indicated on the interactive time selector (figure 7) on the
upper right of your screen. The bottom half of the screen is a summary of the Lifestyle
Indicators and Health Indicators. By default, the Lifestyle Indicators tab will be selected,
displaying a summary of the derived Armband data for the entire duration of the collected
data file. Clicking on the Health Indicators tab will Display a graph of any available biometric
data (blood pressure, blood glucose, or weight) that have been manually entered.
6
Figure 6
7
The date and time located to the left and right just above the selector indicate the total
duration of the data file. Inside the rectangle itself, the beginning of each day (midnight) within
this duration is marked by the date and a thin vertical light grey line. Solid-colored areas show
periods when the Armband was on-body and when the Armband was collecting data. Thin
horizontal grey lines show periods when the Armband was off-body and not collecting data.
The shorter blue vertical lines indicate that the Timestamp/Status button was pressed (figure
7).
You can highlight different time periods within the entire duration of the collected data with
the time selector. To select only one day from the time selector, click anywhere on the day you
wish to view. The selector will automatically select that day (midnight to midnight). To select
multiple complete days click on the first day you would like to view and shift-click on the final
day you want displayed.
To select start and end times, drag the time selectors below the horizontal box. You can then
move the selected time period by dragging the bar between the widgets. All values for these
selected times will be automatically updated.
Click the Show Sessions and Timestamps checkbox under the Subject ID on the upper left of
your screen for a chronological list of all on-body sessions and Timestamps. The list will appear
in the window below the Subject ID. Clicking on a specific day or time on the list will also
highlight that item in the interactive time selector.
Figure 7
TIP: To select only one day from the interactive time selector (Figure 7), simply position your
mouse on top of the day you wish to view and click. You can then drag the selected area to
move this 24 hour time period.
Viewing and Editing Health Indicators
The Health Indicators tab (figure 8) will display all biometric readings within the date range of
the data file. These manually entered readings are displayed in the graph. You can customize
the graph by using the legend. Clicking the arrow icon next to each reading type will reveal
options to change the unit of measure used for that reading. If there is no biometric data, only
Energy Expenditure will be graphed and displayed in the legend.
8
Figure 8
To add, edit, or delete a reading, click on the Update Health Indicators button. The Update
Health Indicators (figure 9) window will pop-up with 3 tabs: Blood Glucose, Blood Pressure and
Weight. Select the tab of the reading type you wish to update.
Figure 9
To manually enter a new reading, click on the Add button. A pop-up window will appear for you
to enter date, time, and a reading. You can also select a unit of measure for blood glucose and
weight. Keep in mind that each type of reading must have the same unit of measure and can
only be changed if there are no existing readings.
9
To edit, select the biometric reading by clicking anywhere in the row of the reading you wish
to change and click Edit. The Edit window (figure 10) will appear with the date, time, and
reading in editable fields. Once editing is complete, click Save Changes and then Save.
Figure 10
To delete a reading, click anywhere in the row of the reading you wish to remove and click Delete. A
confirmation message will appear. To remove more than one reading at a time, hold down the Shift or
Control key to select additional readings.
Clicking OK will apply all changes to the data file and update the health indicator graph.
TIP: Although all updates will appear in the Update Health Indicators window, no changes will
be applied to the data file until you click Save Changes. After any type of edits, you will receive
a confirmation message after you select Save. Clicking Cancel will undo any changes.
Keep in mind that manually entered data readings are subject to entry errors or typos.
Advanced Graphing of the Data
The Graph button located on the bottom of the screen generates a detailed graph (figure 11) of
all the data collected and derived for the selected time frame. Access to this feature requires a
SenseWear Professional license key. The values shown in the graph are approximate.
10
Figure 11
To edit the time period selected, use the time selector box at the top of your screen. Edit the
data and lifestyle information you want to see in the graph with the Data Chooser window I
(figure 12).
If the Data Chooser window does not open automatically, click the Data Chooser button (figure
13) on the left side of the window. Check the box next to the menu items you wish to include in
the graph (figure 14).
11
Figure 12
Figure 13
12
Figure 14
Positioning the mouse over a graph line displays the time, and positioning the mouse over an activity bar
displays the duration and label of the activity at that time (figure 15).
Figure 15
13
Activity Classifications
“Activity Classifications” can be selected in the data chooser. This is a statistical analysis of the
data that matches the recorded sensor patterns to activity. Under steady state conditions, the
activity classifications indicate the activity from the set with the highest probability (figure 15).
Annotating the Data
The SenseWear Software allows you to make annotations to a data file. For example, if the
data shows a spike in physical activity you can add an annotation that describes what the
wearer was doing for that specific time period. Annotations can be added to data files from the
View & Annotate Data screen (figure 6). Check the Show Sessions & Timestamps box (figure
16). A list of Session Start and End times as well as any Timestamps will appear in the window
below.
Figure 16
The Session Start and End times demarcate periods when the device was continuously onbody. To annotate either an entire session or an event within the session, click on the Session
Start time and Shift-click on the Session End time. Then click the Add Annotation button
above and to the right of the Sessions and Timestamps window. A list of annotations will
appear (figure 17). Choose one from the list and click OK.
14
Figure 17
Typically, session start and end times are too broad for annotation purposes. For example, an
Armband may be worn for three hours, but the wearer was only exercising for the last 40
minutes. You can refine annotation start and end times from the Add Annotation window
(figure 17).
The Timestamp feature is used for highlighting a specific event in a data file as if you were
keeping a diary of the data collected, time, and corresponding activity.
For greater accuracy in your annotations, when using an Armband, use the Status button
(figure 18) located on your Armband. The Armband must be on-body for a Timestamp to
register. For example, if the wearer wants to add an annotation for the time they exercise, they
would press the Status button as they begin to exercise and when they finish. The software
allows you to view in detail the specific time of each Timestamped event and to add
annotations.
Status Button
Figure 18
15
Creating Reports
The SenseWear Software and SenseWear Professional Software allows you to create a report of the data
(figure 19a). To create a basic report, follow these simple steps:
1. Open the data file.
2. Go to the View & Annotate Data screen and select the time period you would like to
see on the report.
3. The report includes the subject and clinician information, plus any recorded notes.
Change these values from the My Data Properties page. The My Data Properties
button is located in the bottom left of your screen (figure 6).
4. Click Generate Report to create a pdf report (figure 19a).
SenseWear® Professional software also allows you to create a report with more detail (Figure
19b). To create a more detailed report, click the Graph button in the bottom left of your
screen. A window will open showing a graph of the data. The current set of graphed data will
be included in the detailed report.
Click the Data Chooser button to edit the data. Go to the File menu from the toolbar at the top
of the graph screen and select Generate Report from the drop down menu. A report will be
generated that includes a summary page followed by more detailed graphs and information
on the succeeding pages.
Figure 19a
Figure 19b
TIP: To customize the reports, go to the Reports tab under Application Preferences for additional options
16
Exporting Data
The SenseWear® Professional software allows you to export data in XLS or CSV format for
Microsoft Excel and other data analysis applications.
Automatic Exporting of Data
When data is retrieved from a device a .swd data file is saved. At this time, the data can also be
automatically exported, this feature is set in the Settings - Preferences menu. A SenseWear
Professional license key allows for detailed data to be automatically exported. Otherwise
summary information is exported.
Exporting Data
Exporting detailed data requires a SenseWear Professional license key. To export a data file, go
to the View & Annotate Data screen (figure 6). Click the Export button located at the bottom of
your screen. When prompted, name and save the .xls or .csv file. To view the exported file,
double click on the file.
The detailed .xls file will include five tabs: Data, Subject Info, Summary, Clinician Info, and
Legend. The Data tab contains detailed data samples including raw measures, derived values,
Timestamps and annotations. The Subject Info tab includes the Subject’s body information.
The Summary tab includes a day by day breakdown of derived information. The Clinician Info
tab includes notes and pertinent information about the data file for the clinician. The data
exported from SenseWear Professional also contains Blood Pressure, Blood Glucose and
Weight tabs, if the data were entered manually. The Legend tab includes a key to values used in
the Data tab.
Application Preferences
Application Preferences allow you to control the behavior of certain SenseWear Software and
SenseWear Professional features. Go to the menu bar at the top of your screen. Click Settings
and select Application Preferences from the drop down menu. A window will appear with the
following five tabs.
General
The General tab (figure 20) allows you to select how date, time, height, and weight values
should be displayed and entered, and how energy expenditure values should be displayed.
When selecting how the energy expenditure value is displayed, you can choose to include or
exclude off-body estimates in the total energy expenditure results.
17
Figure 20
TIP: Accurate energy expenditure values can only be calculated for periods when the
Armband is worn (on-body). The SenseWear Software includes an estimate of energy
expenditure while the Armband is off-body. By default, the option to include off-body
estimate is selected in the General tab. This feature is most effective when off-body periods
are short and sedentary and the energy expenditure is approximately 1.0 METs.
Data File
The Data File tab (figure 21) allows you to customize the format for naming the data file
when retrieving data from the Armband.
18
Figure 21
Clinician Info
In this tab (figure 22), enter information specific to the clinician and organization that manages all data
files.
Figure 22
METs (SenseWear Software only)
From the METs tab (figure 23a) you can set the threshold value used for determining physical activity.
19
Figure 23a
Activity Levels (SenseWear Professional only)
You can specify from two to five Activity Levels and SenseWear Professional will determine the
amount of time spent at each level (figure 23b). An Activity Level is simply a METs range, defined
by an upper and lower value. Note: the upper value of the first Activity Level (1.5 METs when
using the default settings) is also used as the threshold value for determining physical activity.
Figure 23b
NOTE: Information entered in Clinician Info, METs and Activity Levels of Application
Preferences window are the default settings and will be applied to all new data files. If you
20
want to change the information in a currently open data file only, click the My Data Properties
button at the bottom of your screen.
Figure 24
Reports
The Reports tab allows you to customize the generated reports (figure 25). Check or uncheck the
boxes to control what data appears in the reports.
Figure 25
21
Using the Software to Configure an Armband and Display
You can use the SenseWear Software or SenseWear Professional Software to personalize the
Armband to a specific wearer, to configure the data to be collected, to configure the associated
sampling rates, and also configure the targets if you have the optional SenseWear Display.
To begin, click Configure Armband & Display (figure 26) and, after connecting the Armband via the USB
cable, click Retrieve Configuration.
Figure 26
From the first tab, Subject Info (figure 27) you will see the subject data (if any) is currently stored on the
Armband. To edit this information for a new wearer, simply modify the fields and click Apply.
Figure 27
22
TIP: The subject data under the Subject Info tab must be complete before you can save the
Display Settings.
The Display Settings tab (figure 28) will be editable if a compatible armband is connected
such as model MF. This tab will allow you to set initial message, targets, average METs and
time format for the optional SenseWear Display. Please refer to the SenseWear Armband and
Display Manual for proper usage.
In addition to configuring the Display, the targets and average METs will be included on
generated reports by default.
Figure 28
IMPORTANT: Be sure to enter a unique and recognizable message in the Initial Message field.
This allows you to confirm that the Display is correctly paired with the Armband.
The Armband Parameters tab (figure 29) allows you to verify the date and time of the
Armband clock. It also allows you to check the hardware version, serial number, battery level,
and memory capacity.
23
Figure 29
IMPORTANT: If you have an Armband and it is not synchronized with your PC clock, a
message may suggest that you synchronize the clocks. If your PC clock time is the correct time,
we recommend doing this by clicking the Apply button.
IMPORTANT: If using the optional SenseWear Display, be sure to have your PC clock set with
the same time zone of the location you will be using the Display. Because data is displayed in
24 hour increments, this will ensure the accuracy of the data. Please refer to the SenseWear
Device Manual for proper usage.
The SenseWear Professional software includes the Data Channels tab feature (figure 30). This
tab lets you configure the data channels to be collected and the sampling rates used by each
channel.
24
Figure 30
If you are not familiar with the low-level physiological parameters the device collects, we
strongly recommend not changing this section
If you need to clear memory from an Armband, select Armband Maintenance (figure 31)
from the menu bar at the top of your screen and select the appropriate command from the
list.
25
Figure 31
IMPORTANT: Do not select Reboot Armband unless instructed to do so by a BodyMedia
representative or your Technical Support Specialist. Unnecessary reboots of the device can
result in data loss.
Troubleshooting Information
For troubleshooting information, please visit sensewear.bodymedia.com.
26
BodyMedia, Inc.
One Gateway Center
420 Fort Duquesne Blvd.
Suite 1900
Pittsburgh, PA 15222
USA
www.bodymedia.com
Emergo Europe
Molenstraat 15
2513 BH, The Hague
The Netherlands
Asia-Pacific Authorized Representative
Emergo Asia-Pacific Level 20,
Tower II Darling Park
201 Sussex Street
Sydney, NSW 2000
Australia
© Copyright 2014 BodyMedia, Inc.
2014-03-17-EN