1
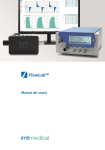
User Manual 302.908.000_01, 2015-09 USER MANUAL FLOWLABTM 1 Content 1 Content ............................................................................................................. 2 2 Preface ............................................................................................................. 3 3 Intended Use .................................................................................................... 4 4 Technical Data ................................................................................................. 5 5 FlowLabTM Software ........................................................................................ 6 4.1 5.1 5.2 5.3 5.4 5.5 5.5.1 5.5.2 5.5.3 5.5.4 5.6 5.6.1 5.6.2 5.7 5.7.1 5.7.2 5.8 5.9 5.10 5.11 Minimum PC Requirements ............................................................................................. 5 Installation ....................................................................................................................... 6 Compatible devices ......................................................................................................... 6 USB Communication ....................................................................................................... 6 Overview ......................................................................................................................... 7 Panels ............................................................................................................................. 8 Panels Show .............................................................................................................. 9 Panels Configuration ................................................................................................ 10 Panels Curve Trigger ............................................................................................... 11 Customizing cursors and curves ............................................................................... 12 Numerics ....................................................................................................................... 13 Numerics Show ........................................................................................................ 13 Numerics Configuration ............................................................................................ 14 Trending ........................................................................................................................ 15 Trending Show ......................................................................................................... 15 Trending Configuration ............................................................................................. 16 Reports ......................................................................................................................... 18 Options ......................................................................................................................... 19 Gas Calculator .............................................................................................................. 20 FlowLabTM Settings ....................................................................................................... 20 2015-09 Page 2 / 21 USER MANUAL FLOWLABTM 2 Preface Application This documentation applies to the products described as: FlowLabTM Software and Firmware versions This documentation applies to the following versions: FlowLabTM Software Version 5.0.4 FlowAnalyserTM Firmware Version 4.3.1 CITREXTM Firmware Version 3.6.0 When using older or newer versions small differences to this manual may appear. Key to symbols used in this manual References to pages and chapters The symbol (> XY) is used for references to pages and chapters. Version details Edition of this User Manual: 09.15 Subject to technical modification without prior warning. Page 3 / 21 2015-09 USER MANUAL FLOWLABTM 3 Intended Use To minimize connectivity problems, please follow the recommend connection procedure: 1. 2. 3. 4. Power on the device and wait until it is started up Attach the USB cable to the computer (on the first time the driver is installed automatically) Start FlowLabTM Start measuring Power saving options like standby or hibernate while FlowLabTM is running and devices are connected can lead to connectivity problems. FlowLabTM is a measuring software for testing and calibrating ventilators together with a FlowAnalyser TM or CITREX TM. The FlowLab TM should not be used for patient monitoring. FlowLab TM must not be connected to a ventilator which is being used by a patient. 2015-09 Page 4 / 21 USER MANUAL FLOWLABTM 4 4.1 Technical Data Minimum PC Requirements Intel® Pentium® 4 2.4 GHz (Intel® Core TM2 Duo recommended) Microsoft® Windows® Vista, 7, 8 (32 bit / 64 bit) Microsoft® .NET Framework 3.5 or above 128 MB RAM (512 MB recommended) 160 MB hard disc space (full installation) Screen 800 x 600 (1280 x 1024 recommended) Page 5 / 21 2015-09 USER MANUAL FLOWLABTM 5 FlowLabTM Software 5.1 Installation Check that your computer meets all minimum requirements before installation (> 4.1 Minimum PC Requirements) and disconnect your FlowAnalyserTM / CITREXTM. Please observe the software instructions during the installation process. During installation the digitally signed USB drivers will be automatically installed. If you wish to reinstall the driver manually after installation, the USB drivers are located in your FlowLabTM installation directory. Download-Link: http://downloads.imtmedical.com/flowanalyser/flowlab 5.2 Compatible devices FlowLabTM can be operated with a FlowAnalyserTM or CITREXTM. To make the user manual easier to read, all examples are related to FlowAnalyserTM. On application startup FlowLabTM searches for available devices. If there are multiple devices to connect, you are going to be asked which one you would like to use. Note about multiple instances: It is possible to have multiple FlowLabTM instances running in parallel. However there exists only one configuration file. This means that the last instance which is closed overwrites the previous configuration. This use case is not officially supported. 5.3 USB Communication If your device was not configured to use FlowLabTM software in the factory, you will need to do this afterwards by entering a clearance code for the USB interface. This code can be obtained from your FlowAnalyserTM / CITREXTM dealer. 2015-09 Page 6 / 21 USER MANUAL FLOWLABTM 5.4 Overview A B C D (A) Application header. Information about the connected device and window commands (minimize, restore and close) (B) Menu & submenu navigation. FlowLabTM software is divided into five main areas: Panels Numeric Trending Reports Options Select the required area from the main navigation area. The main areas will be described in the following chapters. (C) Content area. Content of selected main area (specific for each) (D) Status bar. Status information Page 7 / 21 2015-09 USER MANUAL FLOWLABTM 5.5 Panels The panels area has three specific areas: Show Configuration Curve Trigger 2015-09 Page 8 / 21 USER MANUAL FLOWLABTM 5.5.1 Panels Show A (A) B C Panels toolbar. Toolbar buttons to configure the behavior of the real-time curves Run / Freeze. Run / freeze the panels Autoscale. Automatic adjustment of real-time curve value scale Zoom in / Zoom out. Increase / decrease scale resolution Global value cursor. Y value at the point where the cursor is Global time / frequency cursor. Time / frequency between two cursors Global value to value cursor. Y value between two cursors Curve trigger auto. Continuous panel updates (roll mode) Curve trigger normal. Updates when specific curve trigger reached Curve trigger single. Updates once when specific curve trigger reached (B) Real-time curves. Graphical representation of data A maximum of 6 readings can be graphically displayed here. All related settings can be made in the Configuration menu. (C) Page 9 / 21 Numerics side panel. Current numerical values. The configuration can be made in Numerics configuration menu. 2015-09 USER MANUAL FLOWLABTM 5.5.2 Panels Configuration B A (A) Value configuration. Configure which values and appearance of real-time curves. A maximum of three real-time curves can be displayed simultaneously. 1 4 2 3 5 (1) Value. Measured variable and its unit of measurement. (2) Grid. A grid can be displayed. (3) Line color and its type can be chosen. (4) Curve type. The curve can be chosen in function of the time or as loop. For the display of a loop two values have to be selected, one for the x-axis and one for the y-axis. (5) Title/Background color. Each chart can here be identified by title. The back color of the chart can be changed. 2015-09 Page 10 / 21 USER MANUAL FLOWLABTM Sensor highlighter. Whenever you select a variable the corresponding mechanical connection is highlighted in the box on the right-hand side, and the range is shown below. (B) 5.5.3 Panels Curve Trigger The menu curve trigger is relates to the graphical display of the curves. If the curve shall be displayed as Norm- or Single Shot Curve, curve triggers are needed to start the display. Do not confuse this trigger with the volume trigger, which calculates volumes and respiratory coefficients. 1 2 3 4 5 (1) Trigger source. Here you can choose the curve which shall be adjusted below. (2) Trigger type. Here you can choose the type of the trigger. This setting stays the same for all curves. There are three different types: Auto: This always displays the updated curve. No curve triggers are needed! Norm: This displays a static curve, which is updated with each new trigger. Single Shot: Use this function to capture a single curve. The trigger has to be activated manually. (3) Trigger level. The curve starts to be displayed when the measured value passes this level. (4) Pretrigger. If a certain period of the curve has to be displayed prior the effective trigger point this can be adjusted here. (5) Edge for the trigger. Page 11 / 21 2015-09 USER MANUAL FLOWLABTM 5.5.4 Customizing cursors and curves If you wish to look at a curve in more detail, this can easily be done with the cursors provided. Altogether there are 4 different styles of cursor Value Y intersected. Displays the Y value at the point where the cursor is Period Displays the time period between two cursors. Frequency Displays the frequency between two cursors. Peak - Peak Displays the Y value between two cursors. A B C (A) Global Cursor. By choosing one of the 4 corresponding icons you can select a cursor to apply to all displayed curves in the corresponding style. (B) Individual Curser. It is also possible to apply a cursor only for one curve. If you rightclick the cursor, a menu pops up where you can change the style of the cursor. (C) Curve. If two curves are displayed simultaneously in one panel, you can click the corresponding curve title to select the curve relating to the cursor. 2015-09 Page 12 / 21 USER MANUAL FLOWLABTM 5.6 Numerics The numerics area has two specific areas: Show Configuration 5.6.1 Numerics Show The general sensor variables are in the top section and the respiratory parameters in the bottom section. B A (A) Numerics toolbar. Reset the statistics min / max / average (B) Numerical values. Numerically representation of data. C The statistical values for each variable can also be seen here, i.e. the mean value, and the smallest and largest value since the last reset (C) Tolerance check. Configurable setpoint and limits It’s possible to check the tolerance of each measurement. If the measured value is fitting to the predefined accepted measurement range, the software will mark the value with: Page 13 / 21 2015-09 USER MANUAL FLOWLABTM 5.6.2 Numerics Configuration B A (A) Value Configuration. The overall appearance of the Numerics display can also be adjusted to individual requirements in the Configuration menu. In the columns Setpoint, Limit Lo and Limit Hi you can set the conditions for the automatic check of the measurements. (B) Sensor highlighter. Whenever you select a variable the corresponding mechanical connection is highlighted in the box on the right-hand side, and the range is shown below. 2015-09 Page 14 / 21 USER MANUAL FLOWLABTM 5.7 Trending In this area measurements can be recorded within a specific time range. Select the Configuration menu to start a specific trending recording 5.7.1 Trending Show In the Display view the curves can be visualized and analyzed. By pressing load trend you can load another trending file which has been produced earlier. Page 15 / 21 2015-09 USER MANUAL FLOWLABTM 5.7.2 Trending Configuration 1 2 3 7 4 5 6 8 (1) In the field Measured Variables you can define the variables and units of measurement to be recorded. You can also select the color of the graphical display. The corresponding mechanical connection and possible measurement range can be found in the box at the top right-hand section of the display. (2) In the field Recording duration you can specify the length of the data recording. The range goes from 1 minute to 100 hours. (3) The field Recording interval defines how often data should be recorded. Select from a range of 0.1 seconds to 60 minutes. (4) In the Time axis field you can select the unit of measurement which applies to the x-axis. (5) In the field Memory resources you can check the expected file size and required working memory. Depending on the recording time and interval very large files a ring buffer has to be used to visualize the trending data. The data recording into the file however is not affected by this. If this is the case, the keyword “Buffer” is displayed next to the RAM resource. (6) In the File name field you can specify the file name and storage location. (7) The section File enables you can to enter a title, which will be displayed above the trending curves. Descriptive notes will be copied to the trending file but are not shown in the Display section. 2015-09 Page 16 / 21 USER MANUAL FLOWLABTM (8) Once the Start button is pressed, the data are captured as defined and displayed in real time. Two files will be generated: The *.log file is containing all measurements and can be used by Excel or other data base systems. The *.cfg file contains the information for FlowLabTM to be able to reopen the trending files. You can follow the data acquisition in the Trending show menu. Page 17 / 21 2015-09 USER MANUAL FLOWLABTM 5.8 Reports The reporting function is to print out your measurements in a sheet which includes the measured numerical data, the curves, the company’s data and descriptions. 5 2 1 6 3 7 4 (1) In the Reporting Options area you can select whether numerical data and/or curves shall be printed in the report. (2) In the Test Equipment area you see all information regarding the connected device. The data is automatically loaded from the device. (3) In the Test Center field you can edit the company’s data and there is also the possibility to load your company’s logo to be shown in the report. (4) Use the Test Object area to edit the information about the test object, such as place of test, tested instrument or serial number of the instrument under test. Further you can define to print a unique ID number in the footer of the report. (5) Apply changes and save configuration. (6) With the Preview / Print Actual Data Report button an actual data report can be produced, which displays the actual numerical data and curves. On the preview screen you have access to the printing options as well as to page layout and save settings options. 2015-09 Page 18 / 21 USER MANUAL FLOWLABTM (7) With the Preview / Print Trending Report button a trending data report can be produced, which displays the trending curves. 5.9 Options In the Options menu you can set the same settings as in Menu of the device: Language Gas type Gas standardisation Volume Triggers Warning: Except of the language the device will adopt any changes that you make here to the device! Additionally you can find the setting Performance where you can change the update rate for the real-time panels. If you change the trigger setting in the flowlab, this will be changed and saved on the CITREX or FlowAnalyser too. Also, if you then disconnect the measurement devices, the setting will be kept on the measurement devices. => FlowLab is Master If you save the flowlab settings for example for the bellavista ventilator to an .ini-file, and if you later load this setting-file (measurement device must be connected), all settings will be applied also to the measurement devices. => FlowLab is Master If you have set up the flowlab without connection with a measurement device, and then connect a measurement devics to flowlab => all setting in flowlab will be changed to the measurement device settings => Measurement device is Master Page 19 / 21 2015-09 USER MANUAL FLOWLABTM 5.10 Gas Calculator The gas calculator enables users to configure a mixture of varying gas fractions for flow and volume measurements. Users can select the ratio of standard gases as well as the ratio and physical characteristics of customized gases. 5 2 3 1 4 (1) Customized gases (user-defined) (2) Ratio of the total gas volume (3) Physical characteristics (entered by the user) (4) Total gas mixture (5) Balance Gas (The ratio of the balance gas is automatically calculated. The sum of the ratios must be 100%.) 5.11 FlowLabTM Settings In the header toolbar menu listing under File the Load FlowLab Settings… and Save FlowLab Settings options allows users to save and load user-defined settings. The following settings can be saved using this important menu function: Panels Numerics Trending Reports The settings are then saved as an *.ini File. 2015-09 Page 20 / 21 302.908.000_01, 2015-09 imtmedical ag . Gewerbestrasse 8 . 9470 Buchs SG . Switzerland T: +41 81 750 66 99 . www.imtmedical.com