1
Public Disclosure Authorized
THE WORLD BANK
ENVIRONMENTALLY SUSTAINABLE DEVELOPMENT STAFF
TRANSPORTATION, WATER & URBAN DEVELOPMENT DEPARTMENT
TRANSPORT DIVISION
Public Disclosure Authorized
Public Disclosure Authorized
Report TWLT 12
HDM Manager Version 2.1
Rodrigo Archondo-Callao
Public Disclosure Authorized
March 1994
Technical Paper
This is a document publishedinformally by the World Bank. The views and
interpretations hereinare those of the authors and should not be
attributed to the World Bank, to its affiliated organizations,
or to any individual acting on their behalf.
The Highway Design and Maintenance Standards Series
HDM Manager Version 2.1
TheHighway
Design
andMaintenance
Standards
ModelSeries
Transportation.
Water& UrbanDevelopment
Department.
TheWorldBank
HDMManager.
Version
2.1,04/04/94
Analysis
|
Control
P
H
|Road
Characteristics
+
<
HDM Model
Vehicle
|
FleetData
+
.
Deterioration
CostStreams
.-
{ Economic
Analysis
Strategi:es: -Project
l
e
F
OtherOptions
Summary|
QuitProgram
Rodrigo Archondo-Callao
Transportation, Water & Urban DevelopmentDepartment
The World Bank
This report presents the HDM Manager software developed by Rodrigo Archondo-Callao, The Transportation,
Water & Urban Development Department, The World Bank. To obtain a copy of the HDM Manager software,
contact the following organization:
World Bank
Transportation, Water & Urban Development Department
Transport Division
1818 H Street, N.W.
Washington, DC 20433, U.S.A.
Telephone: (202) 473-5205
Fax: (202) 522-3223
The Highway Design and Maintenance Standards Model (HDM) developed by the World Bank (Thawat Watanatada
and others) is required to be used in conjunction with the HDM Manager. To obtain a copy of the HDM Model,
contact the following organization:
University of Florida
McTrans
Center for Microcomputers in Transportation
512 Weil Hall
PO BOX 116585
Gainesville, FL 32611-6585, U.S.A.
Telephone: (904) 392-0378
Fax: (904) 392-3224
Copyright I 1994
The International Bank for Reconstruction
and Development / The World Bank
1818 H Street, N.W.
Washington, DC 20433, U.S.A.
All rights reserved
Manufactured in the United States of America
First printing March 1994
HDM Manager is designed for use on 286, 386 or 486 personal computers. A hard disk of 20 megabytes and
minimum installed memory of 640K is required to run the HDM Manager program, using MS-DOS 3.3 or higher.
The HDM Manager program was written to assist in the operational work of the World Bank. The author, the
World Bank, the members of its Board of Executive Directors, and the countries they represent make no
representations or warranty with respect to the HDM Manager program other than as specified in the User License
Agreement. The User assumes all risk for the installation and use of, and results obtained from, the program. The
author and The World Bank shall not be liable for any error contained in the program or in the supporting manual
or documentation supplied with the program or for incidental or consequential damage resulting from furnishing,
performance, or use of the program.
Although every effort has been made to test HDM Manager and ensure its accuracy, the World Bank is not in a
position to provide user support.
Table of Contents
Introducing HDM Manager .................................................
1
Installing the Program ....................................................
2
Program Requirements .....................................
...............
3
Starting the Program .....................................................
3
The Main Menu ........................................................
3
Learning the Basics ......................................................
4
Defining the Analysis Control
...............................................
5
Defining Road Characteristics ...............................................
6
Defining Vehicle Fleet Data
7
................................................
Working with
Strategies
............................................................
10
Running the HDM Model ...................................................
17
Viewing the Road Deterioration ..............................................
17
Viewing the Costs Streams .................................................
19
Viewing the Economic Analysis ..............................................
20
Producing the Project Summmy ..............................................
20
Working with Other Options ................................................
21
Exiting the Program
22
.....................................................
Storing the Data Sets in Otier Directories ........................................
23
Printing the Graphs ......................................................
23
Monochrome Monitors ....................................................
23
HDM Manager and HDM ..................................................
23
Annexes .............................................................
24
References
27
...........................................................
I
HDM Manager 1
Introducing HDM
Manager
Manager
The Highway Design and Maintenance Standard Model HDM' is a
computer program for analyzing the total transport costs of alternative road
improvement and maintenance strategies. The program provides detailed
modeling of pavement deterioration and maintenance effects, and calculates
annual costs of road construction, maintenance, and vehicle operation.
Accidents and other impacts can be added exogenously to the economic
evaluation. It is widely used in the evaluation of specific road proposals,
national or regional road investments analysis, and road maintenance policy
assessment.
HDM Manager is a user-friendly shell environment for specific customized
applications of HDM (see the figure below). It stores the input data
efficiently, creates all the required HDM input files, runs the HDM program,
collects the results, and presents the results in a practical way. The program
is a simple but powerful package for learning and using the major concepts of
HDM.
HDM-111
Manager
HDM Manager is designed for use with the full HDM software package and
documentation, which must be obtained separately. While you can use the
HDM Manager software alone for demonstration purposes, it cannot analyze
new options or save new data without the presence of the full HDM model.
HDM Manager is designed to evaluate a set of road agency strategies applied
to paved and unpaved roads. The program computes the road deterioration,
the cost streams (agency costs, vehicle operating costs, and total society
costs) for each of the road agency strategies being evaluated, and the
economic indicators (net present value of net benefits and the internal rate of
return) used to compare the set of road agency strategies.
2
HDM Manager
HDM Manager incorporates most but not all the features of HDM and has
some constraints on parameter choices, e.g. must use seven vehicle types.
The main HDM features not included in this version are the following: i)
Division of links into sections and subdivision of sections into three
subsections, ii) Execution of more than one link at a time, iii) Definition of
exogenous costs and benefits, and iv) Use of alternative vehicle operating
costs relationships.
Installing the
Program
To use HDM Manager, you first need to install the HDM program into your
hard disk. The steps to install the HDM program, as given by the HDM-PC
manual', are the following:
STEP 1 - Make a directory called HDM for HDM with the DOS
command:
MD\HDM
STEP 2 - Change to the HDM directory with the following DOS
command:
CD\HDM
STEP 3 - Place the first HDM program disk in drive A: and enter:
COPY A:*.*
STEP 4 - Repeat step 3 for all the HDM disks supplied.
After installing HDM, install HDM Manager with the following steps:
STEP 1 - Make a directory called HDM-MAN for HDM Manager
with the DOS command:
MD\HDM-MAN
STEP 2 - Change to the HDM-MAN directory with the following
DOS command:
CD\HDM-MAN
STEP 3 - Place the HDM Manager program disk in drive A and
enter:
COPY A:*.*
HDM Manager 3
Program
Requirements
To run HDM Manager you need DOS 3.3 or higher and 600 KB of free
in
conventional
memory.
file:Also make sure that the followingline is included
the CONFIG.SYS
FILES = 30
Starting the
Program
Start the program followingthe steps below:
STEP 1 - Change to the HDM-MANdirectory with the following
DOS command:
CD\HDM-MAN
STEP 2 - Run the program with the command:
HDM-MAN
The Main Menu
The main menu (shown below) shows you the basic structure of the program
and gives you a series of options (AnalysisControl, Deterioration, etc.). At
this type of menu, select an option by using the cursor keys to highlightthe
option and pressing the Enter key or by pressing the first letter of the option
selected.
The HighwayDesignand Maintenance
Standards
ModelSeries
Transportation,
Water& UrbanDevelopment
Department,
The WorldBank
HDM Manager,Version2.1, 04/04/94
r
AnalysisControl
H
Deterioration
H
Cost Streams
W
+
EconomicAnalysis
W
H
ProjectSummary
>
|Road
Characteristics
+
2
-
|Vehicle Fleet Data
Strategies
l
LOther
Options||
HDM Model
-
QuitProgram|
4
HDM Manager
Learning the
Basics
To do a basic economic analysis of road agency strategies applied to a paved
or unpaved road, follow the steps below:
STEP 1 - Define the Analysis Control. Enter the discount rate, the
analysis period, the calendar year of the initial year, and the
currency to be used.
STEP 2 - Define the Road Characteristics. Enter the road geometry,
road structure, road condition, environment, daily traffic, and the
traffic growth.
STEP 3 - Define the Vehicle Fleet Data. Enter the vehicle fleet
characteristics and the vehicle operation unit costs.
STEP 4 - Define the Strategies. Enter the maintenance operations
and construction unit costs, define a data bank of possible road
agency maintenance and construction policies, and define the road
agency strategies being evaluated. Each strategy should include one
or more road agency policies.
STEP 5 - Execute the HDM Model. Run the HDM model from
within the shell environment. Note that after the HDM run is
completed, the HDM Manager program collects the HDM results
from the HDM output files.
STEP 6 - View the Deterioration. Examine the road deterioration
= behavior of each of the road agency strategies being evaluated.
STEP 7 - View the Cost Streams. Examine the financial and
economic cost streams (agency costs, vehicle operating costs, and
total society costs) of the road agency strategies being evaluated.
STEP 8 - View the Economic AnalYsis. Examine the economic
comparison of the strategies being evaluated. The comparison is
based on the net present value of benefits (NPV) or the internal rate
of return (IRR) of each strategy in relation to a base strategy (the
first strategy).
STEP 9 - Produce the Proiect Summay. Select the optimal road
agency strategy among the five strategies being evaluated and create
a project summary report for the selected strategy. The project
summary report contains all the basic inputs and results for the
selected strategy.
STEP 10 - Explore Other Options. For example: export the results
to Lotus 1-2-2, view or print the original HDM output files, or
manage the input data set files.
For each step described above, select the corresponding option at the main
menu.
HDMManager 5
Defining the
Analysis Control
Select the Analysis Control option at the main menu to enter the control data
HDMbelow)
run. When
you select this option, the Analysis
to be used
in the(shown
Control
screen
appears.
Analysis Control
Description
HDM-III Runs for North Region
Day 03
Run Date
Month 03
12.0
Discount Rate (X)
20
Analysis Period (years)
Calendar Year of Initial Year
1993
Input Currency Name
US DOLLARS
Output Currency Name
US DOLLARS
Output Currency ConversionMultipLier
Edit
Print
Year 93
Keep
1.0000000
Get
Save/Exit
The screen presents the current informationin memory and a menu of options
at the bottom of the screen. To modify any of the input variables, use the
Edit option and to print the current information,use the Print option. In this
type of menu, you should select an option using the arrow keys and the Enter
key or by pressing the first letter of the selected option.
When you select the Edit option, the program presents the inputs that you can
change. The HDM Manager has three types of inputs: i) Required inputs, ii)
Optionalinputs, and iii) Lookup table inputs. The required inputs are
displayedin Black and should be entered by the user. The optional inputs are
displayedin Purple and if the user wants the HDM model to estimate the
input as a functionof other inputs, the user can leave the input empty (not
zero). The lookup table inputs are displayedin Brownand accept only a valid
choice from a list of options. Press the F10 key, when the cursor is at the
input field, to displaythe list of valid options and select an option with the
Enter key.
The informationdisplayedon this type of screen (Blue background) will be
what is used by the HDM model to computethe results. The informationon
a screen is saved automaticallyby HDM Manager each time you exit the
screen with the Save/Exitoption. That is, if you use the Save/Exit option,
exit the program and later you load the program and go back to the screen,
the informationpreviouslyon the screen will be there.
You also have the option of storing the informationcurrently on the screen in
a data set file to create a library of informationfiles. If you store the
informationin a data set file, you can retrieve it later. To store the
informationcurrently on the screen, use the Keep option. This option
6
HDM Manager
prompts for the name of the data set file to store the information. Enter up to
six characters or digits.
To retrieve the informationof a previously stored (with the Keep option) data
set file, use the Get option. This option lists the available data sets. Highlight
the data set you want and press the Enter key. The program will get the
informationfrom the data set file and present it on the screen. Remember
that the HDM model uses the current informationdisplayedon the screen
(saved automaticallywith the Save/Exitoption)to computethe results.
To return to the main menu use the Save/Exitoption. If you press the Escape
key, the program will return to the menu but it will not save the latest screen
changes. Note that in the HDM Manager at any moment you can press the
Escape key to cancel an operation or to go back to a previous menu.
Defining Road
Characteristics
Select the Road Characteristicsoption at the main menu to enter the road
informationto be used in the HDM run. When you select this option,the
Road Characteristicsscreen (shownbelow) appears.
Road Characteristics
Page 1/3
Description
Gravel Road 1 in North Region
Road Type (Paved/Unpaved) U
GEOMETRY
Road Length (km)
One ShoulderWidth (m)
Rise & Fall (m/km)
Superelevation(%)
ENVIRONMENT
Altitude (m)
100.0
0.4
40.0
0.0
Road Width (m)
EffectiveNumber of Lanes
Curvature (deg/km)
500
Rainfall (m/month)
6.0
100.0
0.0300
Next Page
Edit
Print
Keep
Get
Save/Exit
The Road Characteristicsmenu is similar to the Analysis Control menu. Use
the E option to edit the information,the Print option to print the
information,the KeeMoption to store the informationinto a data set file for
future use, the Get option to retrieve a data set information,and the
Save/Exitoption to save the current informationand return to the previous
menu.
Note that if you decide to store the current information(Keep option), you
can use the same data set name for an AnalysisControl, Vehicle Fleet,
MaintenanceUnit Costs, Road Agency Policies, or a Road Agency Strategies
data set. The HDM Managerprogram treats each set of information(Analysis
Control, Road Characteristics,Vehicle Fleet, MaintenanceUnit Costs,
HDMManager 7
Policies and Strategies) as independent of each other. Therefore, you can use
the same data set name for all the input sets.
The Road Characteristics data is divided into three screen "pages": i) Page 1
with the road type, road geometry and environment data, ii) Page 2 with the
road structure and condition data, and iii) Page 3 with current traffic and
expected traffic growth data. Note that the data requested on the second page
changes as a function of the road type (paved or unpaved).
To move among the three pages use Next Page option or press the Page Up
or Page Down keys. When you use the Edit option, you edit the page being
displayed. To edit another page, you have to display the page and then use
the Edit option. When you use the Print, Keep, and Get options, you are
working with the data of all three pages. Therefore, when you use the Keep
option, you are storing the data of all three pages into a single data set file.
For detailed information on the information requested at the Road
Characteristics option, refer to the HDM manuals3 . This input screens contain
the information required by the HDM model to describe the road
characteristics and traffic (series A and E in HDM). Note that if you don't
want to include a particular vehicle type, you should enter 0 (zero) in the
corresponding average daily traffic (ADT) field. Note also that as in the
HDM Model you have the option of entering both the Structural Number and
the Benkelman Beam deflection or just either one of these variables leaving
the other as blank.
Defining Vehicle
Fleet Data
Select the Vehicle Fleet Data option at the main menu to enter the vehicle
fleet characteristics to be used in the HDM run. When you select this option,
the Vehicle Fleet Data menu (shown below) appears.
RequiredParameters
OptionalParameters
VehicteFleetDatE
|
Exit
8
HDM Manager
You have three options: i) Enter the Required Parameters, ii) Enter the
Optional Parameters, or iii) Exit the menu. Select an option using the arrow
keys and the Enter key or by pressing the first letter of the selected option.
When you select the Required Parametersoption, the Vehicle MleetData Required Parametersscreen (shownbelow) appears.
VehicLeFLeetData - RequiredParameters
Page 1/2
Description
Required
Data for NorthRegion
BASICCHARACTERISTICS
Car Pickup
LightMedium HeavyArtic.
Bus Truck Truck Truck Truck
GrossVehicleWeight(t) 1.200 1.80010.900 5.60011.300 20.80027.000
ESAI Factorper Veh.(E4)0.000 0.010 0.500 0.100 1.000 3.000 5.000
Numberof AxLes
2
2
2
2
2
3
5
Numberof Tires
4
4
6
6
6
10
18
Numberof Passengers
1.00 1.00 1.00 1.00 1.00 1.00 1.00
VEHICLEUTILIZATION
DATA
ServiceLife(yr)
10.0 8.0
8.0
8.0
8.0
8.0
8.0
HoursDrivenper Year
450 1300 2000 1300 2100 2000 1900
Km Drivenper Year
18000 30000 80000 50000 65000 67500 80000
Depreciation
Code
2
2
2
2
2
2
2
Utilization
Code
1
3
3
3
3
3
3
AnnuaLInterest
Rate (%) 12.00 12.00 12.00 12.00 12.00 12.00 12.00
i Next PageIL
Edit
Print
Keep
Get
Save/Exit
The RequiredParametersmenu is similar to the Analysis Control and Road
Characteristicsmenus. Use the Edit option to edit the information, the Print
option to print the information,the Keep option to store the informationinto
a data set file for future use, the Get option to retrieve a data set infonnation,
and the Save/Exitoptionto save the current informationand return to the
previous menu.
The Required Parametersare defined in two pages of information.Use the
Next Page option to move among pages. Rememberthat the Edit option acts
on the current page while the Print, Keep, and Get options act on all the
pages.
The Required Parameters(all inputs in Black) option contains the basic
vehicle characteristics,the vehicle utilization, and the vehicle unit costs data.
The HDM model uses this informationto compute the vehicle operatingcost
of the vehicle fleet as a functionof the road geometry and the road
roughness.
When you select the Optional Parametersoption at the VehicleFleet Data
menu, the Vehicle Fleet Data - OptionalParameters screen (shown below)
appears.
HDM Manager 9
Vehicle Fleet Data - Optional Parameters
Page 1/2
Description
OptionalData for North Region
VEHICLE PARAMETERS
Payload (Tons)
AerodynamicDrag Coeff.
Projected FrontalArea
Driving Power (Metric HP)
Braking Power (Metric HP)
Paved Desired Spd (km/h)
UnpavedDesired Sp (km/h)
Energy EfficiencyFactor
Hourly UtilizationRatio
CalibratedEng Spd (rpm)
WeibullShape Parameter
Max Avg Rect Vel (mm/s)
Width Parameterfor Spd
Fuel Adjustment Factor
Light Medium Heavy Artic.
Bus Truck Truck Truck Truck
Car Pickup
0.20
0.40
3.50
2.80
.
.
.
.
.
.
.
.
.
.
.
.
.
.
.
.
.
.
.
.
.
.
.
.
.
.
.
.
.
.
.
.
.
.
.
.
.
.
.
.
.
.
.
.
.
.
7.60 12.80 22.00
.
.
.
.
.
.
Next Page
Edit
Print
Keep
Get
Save/Exit
The Optional Parametersmenu is similar to the AnalysisControl and Road
Characteristicsmenus. Use the Edi option to edit the information, the Print
option to print the information,the Ke option to store the informationinto
a data set file for future use, the Get option to retrieve a data set information,
and the Save/Exitoption to save the current informationand return to the
previousmenu.
The Optional Parametersoption (all inputs in Purple) is used to enter the data
required to calibrate the vehicle operatingcosts model. Remember that if you
want to change any of the default values supplied by the HDM model, you
should enter the new values, otherwiseleave the fields blank (not zero).
For detailedinformationon the informationrequested at the Vehicle Fleet
Data option, refer to the HDM mamnals.The HDM manuals describe each
input item, the units used, and the valid range. This option contains the
vehicle fleet characteristicsrequired by HDM (series D in HDM). Note that
the currency used to enter the unit costs is defined in the Analysis Control
screen.
The HDM Managerprogram adoptsthe Brazil vehicle operating costs
relationshipsof HDM and defines seven types of vehicles. The number of
vehicle types definedis fixed by the HDM Manager program. Therefore,
while the full HDM program allows you to change the number of vehicle
types and their names, these cannot be changed through the HDM Manager.
The HDM Manager allowsyou to change the characteristicsof each of the
seven vehicle types defined and if in your analysis you don't want to include
a particular vehicle type, enter 0 (zero) in the correspondingaverage daily
traffic (ADT) field at the Road Characteristicsoption. Note also that HDM
Manager does not present the computedvehicle operating costs and vehicle
speed by vehicle type, which is availablein the full HDM.
10
HDM Manager
Working with
Strategies
Select the Strategiesoption at the main menu to define the road agency
strategiesto be evaluated in the HDM run. This option displays the Strategies
Menu screen (shownbelow). You have five options: i) Enter the maintenance
and constructionoperationsunit costs, ii) Define the road agency strategies,
iii) Define a library of possiblepaved road maintenancepolicies, iv) Define a
library of possible unpavedroad maintenancepolicies, v) Define a library of
possible constructionpolicies.
OperationsUnit Costs
Definitionof Strategies
Strategies
l
l
PoLiciesData Bank
Paved MaintenancePolicies
l
Unpaved MaintenancePolicies
ConstructionPolicies
Exit
To define the road agency strategies to be evaluated, follow the steps below:
STEP 1 - Define ODerationsUnit Costs
Define the maintenanceand constructionoperationsunit costs. The
OperationsUnit Costs menu is similar to the AnalysisControl menu (see
below). Use the Edit option to edit the information,the Print option to print
the information,the Keen option to store the informationinto a data set file
for future use, the Get option to retrieve a data set information,and the
Save/Exitoption to save the current informationand return to the previous
menu.
The unit costs entered are the costs for a particular (user defined) operation.
For example, in the screenbelow: the financial unit cost for an overlay is
equal to 8.00 $/km, the thicknessand the material being defined by the user.
This cost, for example, may be based on a 40 mm asphalt concrete overlay,
but these details are not shownin the input screen. The cost for a particular
operation can be adjustedby a cost factor to consider variations on the
defined operation (for exampleto considerdifferent thicknessesor materials)
in each policy to be defined in step 2.
The maintenanceand constructionunit costs can be in any currency (defined
in the AnalysisControl screen)and will be used by all the road agency
HDM Manager
11
policies to be defined in Step 2. Note that the unit cost for the construction
operation is in thousands of the currency defined in the Analysis Control
screen.
Strategies
- Operations
Unit Costs
Description
UnitCostsfor NorthRegion
FinancialEconomic
Unit CostUnit Cost
Operation
Grading(Currency
per km of roadgraded)
SpotRegraveling
(Currency
per cu m)
GravelResurfacing
(Currency
per cu m)
(Currency
per km per yr)
UnpavedRoutineMaintenance
85.0
7.20
17.80
100
70.0
6.00
12.50
85
Patching(Currency
per sq m)
Resealing
(Currency
per sq m)
Overlay(Currency
per sq m)
Reconstruction
(Currency
per sq m)
PavedRoutineMaintenance
(Currency
per km per yr)
8.00
3.20
8.00
40.00
500
6.80
2.70
6.80
34.00
425
Construction
(Thousands
currencyper km)
120.0
86.0
Note:The inputcurrencyis definedin theAnalysisControLData
Edit
Print
Keep
Get
Save/Exit
STEP 2 - Define Policies Data Bank
The HDM Manager evaluates road agency strategies. Each road agency
strategy is composed of one or more than one paved maintenance policy,
unpaved maintenance policy, or construction policy. Therefore, you have to
create a Data Bank of road agency policies before defining the strategies to
be evaluated.
For example:
Strategy X
Policy 1:
- Grading every 90 days, plus gravel
resurfacing (from 1993 to 2011)
Strategy Y
Policy 1:
- Reseals every 5 years (from 1993 to
2002)
- Overlays every 9 years (from 2003 to
2011)
Policy 2:
Strategy Z
Policy 1:
Policy 2:
Policy 3:
- Grading every 90 days (from 1993 to
1994)
- Paving the road (in 1995)
- Overlays when roughness > 4.5 (from
1996 to 2011)
Note that strategies are the road agency alternatives (with the first being the
base case) being evaluated. Policies within a strategy are not alternatives, but
12
HDM Manager
a sequence,with only one being applicablein a given year. Note also that a
policy can include a number of actions which may be scheduledor condition
responsive.
You define the paved maintenancepolicies, unpaved maintenancepolicies,
and constructionpolicies that should belong to your Data Bank. These
policies are stored in data set files with unique file names and should have
unique and clear descriptionsto identify the policies at the Definition of
Strategiesphase.
Paved MaintenancePolicies
When you select the Paved MaintenancePolicies option at the Strategies
menu, the screen below appears.
Data Bank - Paved MaintenancePolicies
Page 1/3
Description
Yes/No
Y
ROUTINE MAINTENANCE
Features: Cost factor
N
N
0.00
PATCHING
(Scheduledor Responsive)
Scheduled: Area to be patched (m2/km/y)
Responsive: Percent of pothoLe area to be patched
Maximum applicablearea (m2/km/y)
Features: Cost factor
Last applicableyear
Maximum applicableroughness(IRI)
RESEALING
(Scheduledor Responsive)
Scheduled: Resealinginterval (y)
Responsive: Maximum allowabletotal damaged area (%)
Minimum applicableresealinginterval (y)
Maximumnapplicableresealinginterval (y)
R
0.0
0.0
0.00
R
0
0.0
Next Page
Edit
Print
Save
Retrieve
Exit
The Paved MaintenancePolicies menu is different from the Analysis Control
menu or the other previousinput data menus described so far. To show that,
the screen backgroundis Green while at the previousinput data screens the
backgroundis Blue. On the Blue input screens, after you select the Save/Exit
option, the program saves and retains in memory the informationdisplayed
on the screen. This informationis then used by the HDM program. The
Green input screens are managing a Data Bank of policies stored on files.
Therefore, the informationis not retained in memory when you select the
Exit option. To save the informationrelated to a policy, you have to
explicitlyuse the Save option and supply a file name.
Use the Edit option to edit the information,the Print option to print the
information,the Save option to save the informationin a file, the Retrieyv
option to retrieve previously saved informationfor editing or viewing
HDM Manager
13
purposes, and the Exit option to return to the previousmenu. When you use
the Save option, you are requested to enter a six digit/character file name and
when you use the Retrieve option, the program displays a list of previously
saved policies.
Rememberthat in this step you are not deciding whichpolicies to include in
the strategies to be evaluated.You are managinga series of road agency
policies stored in files that could or could not be used by the HDM program.
You define the policies to be includedin each strategy and the timing of these
policies in the Definitionof Strategiesoption (see Step 3).
The Paved MaintenancePolicies informationis composed of three screen
"pages".In these pages, you define the maintenance operationsincluded in
the policy and the characteristicsof the operations. A paved maintenance
policy is composedof Routine Maintenanceand if wantedother maintenance
operations(Patching,Reseal, Overlay or Reconstruction).Each maintenance
operationcan be scheduledat a certain time interval or activated in response
to the conditionof the road. Note that the Routine Maintenanceoperation is
always includedand that you can have more than one operation in a policy.
To show that a certain operationshould be included on the policy being
defined, enter a "Y" at the left column of the screen at the corresponding
operation. Otherwise,enter "N" or leave it blank. To select the type of
operation (Scheduledor Responsive)place an "R" or "S" at right of the
"Scheduledor Responsive"line. If you select the Scheduledoption, enter the
informationat the Scheduledline (lines)and disregard the informationon the
Responsiveline (lines). If you select the Responsiveoption, enter the
informationat the Responsiveline (lines), and disregardthe Scheduledline
(lines). In both cases, Scheduledor Responsiveoptions, you should define the
Featuresof the operation.
UnpavedMaintenancePolicies
When you select the UnpavedMaintenancePolicies option at the Strategies
menu, the screenbelow appears.
The UnpavedMaintenancePoliciesmenu is equal to the Paved Maintenance
Policies menu. Use the Edit option to edit the information, the Print option to
print the information,the Save option to save the informationin a file, the
Retrieve option to retrieve previouslysaved informationfor editing or
viewing purposes, and the Exit option to return to the previous menu. When
you use the Save option, you are requestedto enter a six digit/character file
name and when you use the Retrieve option, the program displays a list of
previously savedpolicies.
Rememberthat the inputs in Black are required, the inputs in Purple are
optional (you can leave them blank, not zero), and the inputs in Brown are
obtained from a list of valid options (press FIO).
14
HDM Manager
Data Bank - Unpaved MaintenancePolicies
Page 1/2
Description
Yes/No
Y
ROUTINE MAINTENANCE
Features: 'Costfactor
0.00
R
N
N
GRADING
(Scheduledor Responsive)
Scheduled: Time intervalbetween gradings (d)
Responsive: Traffic intervalbetween grading (vet)
Minimum applicabletime interval(d)
Maximum appLicabLetime interval(d)
Features:
Cost factor
0.00
0
0
SPOT REGRAVELLING (Scheduledor Responsive)
Scheduled: Gravel volume (m3/km/y)
Responsive: Percent annuaL material Loss replaced (%)
Maximun applicablegravel volume (m3/km/y)
0.00
Features:
Cost factor
R
0.0
0
I Next Page
Edit
Print
Save
Retrieve
Exit
The Unpaved Maintenance Policies structure is similar to the Paved
Maintenance Policies structure. The only difference is the type of operations
included (Grading, Spot Regravelling, and Gravel Resurfacing). Remember
that you select an operations by placing a "Y" at the left of the operation line
and you decide between a Scheduled or Responsive operation by placing an
'R" or "S" at right of the corresponding line.
Construction Policies
When you select the Construction Policies option at the Strategy menu, the
screen below appears. The Construction Policies menu is equal to the Paved
Maintenance Policies menu.
Use the Edit option to edit the information, the Print option to print the
information, the Save option to save the information in a file, the Retrieve
option to retrieve previously saved information for editing or viewing
purposes, and the Exit option to return to the previous menu. When you use
the Save option, you are requested to enter a six digit/character file name and
when you use the Retrieve option, the program displays a list of previously
saved policies.
Remember that each policy should have a unique file name and a unique
description. While defining the strategies in Step 3, you will identify the
policies that are part of a strategy through the policy description.
The Construction Policies option requests the characteristics of a construction
policy. That is, the construction duration and costs, the new road
characteristics, and an optional generated traffic.
HDM Manager 15
Data Bank - ConstructionPoLicies
Page 1/3
Description
CONSTRUCTION
ConstructionDuration (y)
Annual Cost Stream (% of total cost):
Salvage Value (% of totaL cost)
Cost Factor
,GEOMETRY
P
Road Type (Paved/Unpaved)
1.0
Road Length (km)
One ShoulderWidth (m) 0.0
Rise & Fall (m/km)
0.0
Superelevation(X)
1
ConstructionYear 1
ConstructionYear 2
ConstructionYear 3
ConstructionYear 4
ConstructionYear 5
0.0
0.0
0.0
0.0
0.0
0.0
0.00
Road Width (m)
EffectiveNumber of Lanes
Curvature (deg/km)
2.5
0.0
Next Page
Edit
Print
Save
Retrieve
Exit
For detailedinformationon the informationrequestedat the Paved
MaintenancePolicies, UnpavedMaintenance,and ConstructionPolicies
options, refer to the HDM manuals. The HDM manuals describe each input
item, the units used, and the valid range.
STEP3 - Define Stratezies
The HDM Manager evaluatesand compares five road agency strategies at a
time. Each strategyis composedof one or more than one road agency policy
that is valid for a certain period. The program always analyzes five
strategies. Therefore, you always have to define five strategies even if you
are interestedin the results of only one or two strategies. You could use the
other strategies to do some sensitivityanalysis.
When you select the Define Strategiesoption, the screen below appears. The
Definitionof Strategiesmenu is similar to the AnalysisControl menu. Use
the Edit option to edit the information,the Print option to print the
information,the Keen option to store the informationinto a data set file for
future use, the Get option to retrieve a data set information, and the
Save/Exitoption to save the current informationand return to the previous
menu.
To define the strategies enter the descriptionof the set of strategies and for
each strategy definesthe policies that compose the strategy. For each
strategy, define at least the followinginformation:
- The description of the strategy
- The starting year of the first policy
- The descriptionof the first policy
16
HDM Manager
Strategies
- Definition
of Strategies
Page 1/2
Description
Paving Strategies,
Gravel Road 1
STRATEGY1:
Grading every 90 days + Regrav.
Starting
in Year: 1993 PoLicy: Grading (90d), Regravelling
(G_R90
(
(
STRATEGY
2:
Paving in 1993 + Reseal at 20%
Starting
in Year: 1993 PoLicy: Grading (90d), No Regravelting
1993
Paving Gravel Road 1
1994
Reseal (12mn,20%), Patching
Note: Strategy
1 is the base strategy
for
)
)
(G_90 )
(P GRO1)
(SST_20)
the economic analysis.
| Next Page
Edit
Print
Keep
Get
Save/Exit
Each strategy shouldhave at least one policy and the first policy should start
at the calendar year of the begimningof the analysisperiod. Each strategy can
have a maximum of four policies. For example:
Starting
in year
Policy Description
(Paved Maint., UnpavedMaint.,
or Construction)
STRATEGY1
1992
Grading every 90 days
STRATEGY2
1992
1993
1994
2004
Grading every 90 days
Paving the road
Reseal when damage > 30%
Overlayswhen IRI > 4.5
A policy will be active from the starting year up to the end of the analysis
period, unless a new policy starts. If a new policy starts, the previous policy
will be stopped.
Enter the startingcalendar year for each policy and to enter the policy
descriptionpress the FIOkey while the cursor positionedat the description
field. When you press the F10 key at a policy descriptionfield, the program
lists all the availablepolicies (stored in your Data Bank and managed in Step
2). Select a policy by highlightingit and pressing the enter key.
Note that the first strategyis the strategy definedby the HDM Manager as
the base strategy(do minimum case). The HDM Managercomputes the
economicbenefitsof implementingthe other strategiesin relation to
implementingthe first strategy.
HDM Manager
Running the
HDM Model
17
After defining all the input data, run the HDM model with the "HDM
Model" option. This option creates all the input data files required by HDM,
runs the HDM program automatically,and after the HDM run is completed,
collects the HDM results. Note that you need 3.5 Mb of empty hard disk to
store the temporary files created by the HDM program. These temporary
files are erased automaticallywhen you exit the HDM Manager program.
If there is an input data or system error detected by the HDM program, the
HDM program will not generate the results. The HDM Manager program
shows this fact by giving you a warningmessage. If there is an input data
error, you should locate it by viewing the output HDM scan files. Use the
"Other Options"option at the main menu. View the SCAN 1 file to locate
errors on the Analysis Control and Road CharacteristicsData. View the
SCAN 2 file to locate errors on the Vehicle Fleet Data and Road Agency
Policies. View the SCAN 3 file to locate errors on the Road Agency
Strategiesand the structure of the run and to obtain a summarytable of
errors and warnings. View the SCAN 4 file to locate execution errors. After
locating the errors, you should fix them and run the HDM model again. If
HDM is not installed on your hard disk, the HDM Managerpresents a
warningmessage and doesn't computethe results.
Viewing the Road
Deterioration
Select the Deteriorationoption at the main menu to view the road
deterioration under the five standards being evaluated. When you select this
option, the periodic operationstable appears and if you select the Next Table
option, the followingdeterioration(Roughness)table appears.
Roughness
(IRIm/km)
Year
1 1993
2 1994
3 1995
4 1996
5 1997
6 1998
7 1999
8 2000
9 2001
10 2002
11 2003
12 2004
13 2005
14 2006
15 2007
First Second Third Fourth Fifth
StrategyStrategyStrategy
StrategyStrategy
10.2
10.5
11.2
12.0
12.2
12.3
12.5
11.8
12.8
13.0
13.1
13.3
12.5
13.6
13.8
10.2
2.7
2.7
2.8
2.9
3.0
3.0
3.1
3.2
3.3
3.4
3.4
3.5
3.6
3.7
10.2
10.5
2.7
2.7
2.8
2.9
3.0
3.0
3.1
3.2
3.3
3.4
3.4
3.5
3.6
10.2
10.5
10.7
2.7
2.8
2.8
2.9
3.0
3.0
3.1
3.2
3.3
3.4
3.4
3.5
10.2
10.5
10.7
10.8
2.7
2.8
2.8
2.9
3.0
3.0
3.1
3.2
3.3
3.4
3.4
|ChangeYears
Next Table Prev.Table SelectTable GraphTable OutputTable
Exit
The Roughnesstable presents the roughness progressionfor all five standards
and is only one of the followingfifteen availabletables:
18
HDM Manager
Periodic Operations
Roughness (IRI m/krn)
All Cracks (%)
Wide Cracks (%)
Area Ravelled (%)
Pothole Area (%)
Rut Depth (mnm)
SD Rut Depth (mm)
Modified Structural Number
Surface Type
Gravel Thickness
Two-Way Average Daily Traffic
Two-Way Annual Equivalent Standard Axles ('000)
First Strategy Deterioration
Second Strategy Deterioration
Third Strategy Deterioration
Fourth Strategy Deterioration
Fifth Strategy Deterioration
To display the next table, select the Next Table option and to display a
previous table, select the Previous Table option. To display a particular table,
use the Select Table option. Note that the last five tables present all the
deterioration characteristics for each strategy (see example below).
First Strategy - Grading every 90 days + Regrav.
Annual
Gra
Oper Rough All Wide Rave Potho Rut
atio ness Crck Crck lIed les Dpth Mod Sur vel 2-Way 2-Way
mm
SN face mn ADT ESA 000
%
%
%
IRI
%
Year ns
GRAV
GRAV
GRAV
GRAV
GRAV
GRAV
GRAV
GRAV
GRAV
GRAV
GRAV
GRAV
GRAV
GRAV
GRAV
1 1993
10.2
2 1994 RESU 10.5
11.2
3 1995
12.0
4 1996
5 1997
12.2
12.3
6 1998
7 1999 RESU 12.5
11.8
8 2000
12.8
9 2001
13.0
10 2002
13.1
11 2003
12 2004 RESU 13.3
12.5
13 2005
13.6
14 2006
13.8
15 2007
Next Table
Prev. Table
Select Table
Graph Table
72
200
23.8
24.5
193 207
164 215
25.3
26.1
134 223
26.9
103 231
27.7
71
240
28.6
189 249
29.5
156 259
30.4
123 269
31.4
89
279
54
289
32.4
33.4
168 300
34.4
131 312
93
323
35.5
36.6
55
336
1 Change Years P
Output Table
Exit
To print, save into an ASCII file or export to Lotus 1-2-3 a particular table,
select the Output Table option. If you save or export a table, the program
asks for a filename. Enter a legitimate DOS filename including a path and
extension if necessary. To graph a particular table, select the Graph Table
option.
HDM Manager
Viewing
Streams
the Cost
19
Select the Cost Streams option at the main menu to view the cost streams for
the five strategies being evaluated. When you select this option, the following
costs table (Financial Agency Capital Costs) appears.
Financial
AgencyCapitalCosts
(miLlion
US DOLLARS)
Year
1 1993
2 1994
3 1995
4 1996
5 1997
6 1998
7 1999
8 2000
9 2001
10 2002
11 2003
12 2004
13 2005
14 2006
15 2007
First
Second Third
Fourth Fifth
StrategyStrategyStrategyStrategyStrategy
0.000
1.709
0.000
0.000
0.000
0.000
1.709
0.000
0.000
0.000
0.000
1.709
0.000
0.000
0.000
12.000
0.000
0.000
0.000
0.000
0.000
0.000
0.000
0.000
0.000
0.000
0.000
0.000
2.240
0.000
0.000
12.000
0.000
0.000
0.000
0.000
0.000
0.000
0.000
0.000
0.000
0.000
0.000
0.000
2.240
0.000
0.000
12.000
0.000
0.000
0.000
0.000
0.000
0.000
0.000
0.000
0.000
0.000
0.000
0.000
0.000
0.000
0.000
12.000
0.000
0.000
0.000
0.000
0.000
0.000
0.000
0.000
0.000
0.000
0.000
ChangeYears
c
Next Table Prev.Table SelectTabLe GraphTable OutputTable
Exit
The table presents the financial agency capital cost stream for all five
strategies and is only one of the following eleven available tables:
Financial Agency Capital Costs
Financial Agency Recurrent Costs
Economic Agency Capital Costs
Economic Agency Recurrent Costs
Economic Vehicle Operating Costs
Economic Total Society Costs
Net Economic Benefits
First Strategy Costs
Second Strategy Costs
Third Strategy Costs
Fourth Strategy Costs
Fifth Strategy Costs
To display the next table select, the Next Table option and to display a
previous table select, the Previous Table option. To display a particular table,
use the Select Table option. Note that the last five tables present all the cost
streams for each strategy.
To print, save into an ASCII file or export to Lotus 1-2-3 a particular table,
select the Output Table option. If you save or export a table, the program
asks for a filename. Enter a legitimate DOS filename including a path and
extension if necessary. To graph a particular table, select the Graph Table
option.
20
HDM Manager
Viewing the
Economic
Analysis
Select the Economic Analysis option at the main menu to view the economic
analysis performed by the HDM model. When you select this option, the
following table appears.
Economic Analysis (millionUS DOLLARS)
Stra
tegy
Internal
Total
Net Rate of
Constr. Periodic Recurrent Total Vehicle
Recons. Maint.
Maint. Agency Operating Society Present Return
Costs
Costs
Costs
Costs Value (X)
Costs Costs
0.0% Discount Rate
1
2
3
4
5
0.00
7.74
7.74
7.74
7.74
6.00
1.89
1.89
1.89
1.89
0.74
0.84
0.84
0.83
0.83
6.74
10.47
10.47
10.46
10.46
74.6
45.0
45.8
46.5
47.4
81.3
55.5
56.2
57.0
57.9
0.0
25.9
25.1
24.3
23.5
NONE
17.1
18.7
20.8
MANY
29.4
26.2
26.0
25.8
25.7
0.0
3.2
3.4
3.6
3.7
NONE
17.1
18.7
20.8
MANY
12.0% Discount Rate
1
2
3
4
5
0.00
8.50
7.58
6.76
6.02
2.40
0.43
0.39
0.35
0.31
NPV Sensitivity
0.31
0.35
0.34
0.34
0.34
2.71
9.28
8.31
7.44
6.67
Graph Table
26.7
16.9
17.7
18.4
19.0
Output Table
Exit
To print, save into an ASCII file or export the table to Lotus 1-2-3, select the
Output Table option. If you save or export the table, the program asks for a
filename. Enter a legitimate DOS filename including a path and extension if
necessary. Select the NPV Sensitivity option to compute the Net Present
Value of all strategies for a range of discount rates. Select the Graph Table
option to graph the table.
Producing the
Project Sulmmaiy
ProJect
Summary
Select the Project Summary option to view, print, or export a summary
report for your selected project (see Annex 1). Your selected project should
be one of the four strategies being analyzed (second strategy to fifth
strategy). Remember that the first strategy is the base strategy (without
project case) used to compute the benefits of implementing the other
strategies. The summary report prints for the without project case (first
strategy) and for the selected project the following information:
- Roughness Prpgression
- Average Daily Traffic
- Periodic Maintenance Actions
- Financial Road Agency Costs
- Economic Vehicle Operation Costs
- Economic Total Society Costs
- Net Economic Benefits
- Project Net Present Value
- Project Internal Rate of Return
HDMManager 21
Note that even if the HDM program finds many Internal Rates of Return
(MANYis displayedat the EconomicAnalysis screen) for a particular
strategy, the project summaryreport routine computesthe rates of return and
presents the appropriaterate of return for the strategy. The appropriate rate
of return will be the first rate of return greater than the discountrate if the
net present value is positive, and the first rate of return less than the discount
rate if the net present value is negative.
Working with
Other Options
Select the Other Optionsoption at the main menu to perform any of the tasks
listed in the Other Optionsmenu (shownbelow).
Export ResuLts
View HDM-III Output Files
Print HDM-III Output FiLes
Keep HDM-III Output Files
Delete a Data Set
Copy a Data Set
Copy Att Data Sets
Other Options |-
Exit
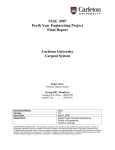
Select the "Export Results " option to export the results to Lotus 1-2-3 or
Dbase. You can create a Detailed Lotus 1-2-3Table (see Annex 2), or a
SummaryLotus 1-2-3Table (see Annex 3). When you select this option, the
program asks for a filename. Enter a legitimate DOS filename including a
path if necessary. Note that you don't have to include the .WK1 or .DBF
extensionin the filename. The Lotus 1-2-3 tables can be used to prepare plots
or charts, or perform further analysis of the results. The Dbase tables can be
used to merge the results of differentroads. For this purpose when creating
the Dbase Results Table, you can give to each road and strategy an
identificationcode.
Selectthe "View the HDM Output Files" option to view the output files
created by HDM or any text file. When you select this option and the file to
view, the file you selectedis displayedon the screen. Use the arrow keys to
move through the file and press the ESC key to return to the previous memn.
Select the "Print the HDM Output Files" option to print the output files
created by HDM. When you select this option, you have to select the file you
want to print and a printer from a list of availableprinters. Note that the
HDM output files contain 132 charactersper line.
22
HDMManager
Selectthe "KeepHDM output files" option to store the HDM output files.
Each time you run the HDM program, the previous HDM output files created
by the previous HDM run are overwritten. Therefore, use this option to make
a copy of these output files for future use before they are overwritten. When
you select the file you want to keep, the program asks for the filename
(includepath and extension)to copy the file. When you select to keep the
EBMfile, the program requests some additional information(see the screen
below).
Keep EBM
CURRENT
FILE
DOSfilename
Road code
Strategy 1 code
Strategy 2 code
Strategy 3 code
Strategy 4 code
Strategy 5 code
Road Name
Strategy 1
Strategy 2
Strategy 3
Strategy 4
Strategy 5
NEWFILE
TO BE CREATED
HDMOUT.EBM \HDM-MAN\
ROAD
STD1
STD2
STD3
STD4
STD5
Gravel Road 1 in
Grading every 90
Paving in 1993 +
Paving in 1994 +
Paving in 1995 +
Paving in 1996 +
North Region
days + Regrav.
Reseal at 20%
Reseal at 20%
Reseal at 20%
Reseal at 20%
While you are making a copy of the EBM file, you have the option of
changing the road and the strategycodes defined in the current EBM file
created by HDM. You may want to change the road and the strategy codes to
obtain a unique EBM file for each road.
Select the "Delete a Data Set" option to delete a data set of a particular input
module (AnalysisControl, Road Characteristics,Vehicle Fleet Data, etc.).
Select the "Copy a Data Set" option to copy a data set of a particular input
module (AnalysisControl, Road Characteristics,Vehicle Fleet Data, etc.) to
a different drive or directory.
Select the "Copy all Data Set" option to copy all data sets to a'different drive
or directory.
Exiting the
Program
Select the Quit Programoption at the main menu to exit the program and
return to DOS.
HDM Manager 23
Storing the Data
Sets Other
0in
Sets n O er
Directories
The default setup of the HDM Manageris to store the data sets in the HDMMAN directory (current directory). If you want to store the data sets in
anotherdisk drive or directory, start the program as follows:
HDM-MAN xxxxxxx
replace xxxxxxxby the disk/directorypath. For example:
HDM-MAN c:\hdmdata\
Printing the
Graphs
To print the graphs, you have the followingoptions::
a) To produce a screen dump to an Epson printer, IBM Proprinter
printer, or HP Laserjet printer, press the F7 Key while displayinga
graph.
b) To print a high quality graph in a Lasetjetprinter, press the F9
Key while displayinga graph.
Note that if you run the HDM Managerunder Windows, you can also
capture the graphs using the clipboard of Windows.
Monochrome
Monitors
HDM Managerdetects if you have a color or monochromeboard and sets the
screen colors accordingly.If you want to force HDM Manager to use the
monochromepalette (for example on portable computers), start the program
as follows:
HDM-MAN
xxxxxxx M
replace xxxxxxxby the disk/directorypath. For example:
HDM-MAN c:\hdmdata\
HDM Manager
and HDM
M
The HDM program reads a series of input files (ASCII text files) and after it
computesthe results, it creates another series of output text files. The HDM
Managerprogram stores the input data and the results in Dbase files.
Therefore, the HDM input files you created with your word processor or
with the HDM Input Data Facility are not compatiblewith HDM Manager.
That means that you cannot import the data stored in HDM input files into
HDM Manager.
The 11DMManagercreates all the required HDM input files before it runs
HDM. These files are named HDMDATA.*. That is, HDMDATA.RUN,
HDMDATA.AAA,HDMDATA.BBB,etc. You can view and modify these
files with a word processor or the HDM Input Data Facility to run the HDM
model directly.
24
HDM Manager
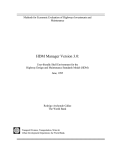
Annex 1 - Project Summary Table
HDM Manager: Project Summary
Project Name : SAMPLE PROJECT SUMMARY
Run Name : HDM-III Runs for North Region
Run Date : 03/03/93
Road Name: Gravel Road 1 in North Region
Road Length: 100.0 km
Currency: Million US DOLLARS
WITHOUT PROJECT
Grading every 90 days + Regrav.
FINANCIAL
YEAR
ADT OPER IRI
1993
1994
1995
1996
1997
1998
1999
2000
2001
2002
2003
2004
2005
2006
2007
2008
2009
2010
2011
2012
200
2207
215
223
231
240
249
259
269
279
289
300
312
323
336
349
362
376
390
405
1
1
1
1
Average
10.2
RESU 10.5
11.2
12.0
12.2
12.3
RESU 12.5
11.8
12.8
13.0
13.1
RESU 13.3
12.5
13.6
13.8
RESU 14.0
13.1
14.3
RESU 14.5
13.5
ECONOMIC
AGENCY
COSTS
V.O.C.
COSTS
0.044
1.753
0.044
0.044
0.044
0.044
1.753
0.044
0.044
0.044
0.044
1.753
0.044
0.044
0.044
1.753
0.044
0.044
1.753
0.044
2.309
2.425
2.594
2.790
2.913
3.038
3.169
3.181
3.445
3.598
3.754
3.917
3.912
4.261
4.451
4.645
4.625
5.054
5.279
5.248
ECONOMIC
FINANCIAL
ECONOMIC
ADT OPER IRI
AGENCY
COSTS
2.346
3.662
2.631
2.826 I
2.950
3.075
4.406
3.218
3.482
3.635
3.791
5.154
3.949 1
4.298 1
4.488
5.882
4.662
5.091
6.515
5.285 1
200
207
215
223
231 CONS
240
249
259
269
279
289
300
312
323
336
349
362 RESE
376
390
405
0.044
0.044
0.044
12.044
0.050
0.050
0.050
0.050
0.050
0.050
0.050
0.050
0.050
0.050
0.050
0.050
2.290
0.050
0.050
-1.150
2.309
2.425
2.532
2.644
1.747
1.811
1.877
1.945
2.016
2.091
2.172
2.257
2.346
2.438
2.534
2.634
2.739
2.847
2.961
3.079
2.346
2.462
2.569
11.281
1.789
1.853
1.919
1.988
2.059
2.133
2.215
2.300
2.388
2.481
2.577
2.677
4.671
2.890
3.003
2.262
14.016
9.165
47.404
19.024
57.863
25.691
10.2
10.5
10.7
10.8
2.7
2.8
2.8
2.9
3.0
3.0
3.1
3.2
3.3
3.4
3.4
3.5
3.6
3.7
3.8
3.9
V.O.C.
COSTS
ECONOMIC
TOTAL
COSTS
12.7
Total tundiscounted)
Total (at 12.00 %)
WITH PROJECT
Paving in 1996 + Reseat at 20%
4.7
9.425
3.786
74.608
26.697
Project NPV at 12.00 % Discount Rate:
Project Internal Rate of Return (%):
3.7
23.9
81.346
29.406
NET
TOTAL ECONOMIC
COSTS BENEFITS
0.000
1.200
0.062
-8.455
1.161
1.222
2.487
1.230
1.423
1.502
1.577
2.855
1.561
1.818
1.911
3.205
-0.009
2.201
3.512
3.023
HIW M_:ge
Te
0e1d
Run NaM:
HDON- Runs lo Moult Region
Run Date:
03103/93
Road Name:
GrIvel Road I In Nroth Rgion
lOOD0
Road Langth #un):
Strategy
Yer
I - GradIng every 90 days + llRegrv
1993
1994
1996
096G
1997
1996
I9W
200o
2001
2c02
2D03
2004
2005
2500
2007
206
2509
2510
20tt
2012
2- Paving in 1993 4
eal
at 2D% 19t3
1964
t945
I9wo
1997
1990
1096
20to
,n US DOCLARS)
Nat
Economl Economi Econodi Economl
Gravel FnnciaW Fnbcil
Rut SD Rut Modified Surta
All
W¶ie
Ara Poioe
2-Way
2-Way Roughn Peukdic
Vehicl
Socety Economl
Type Thicknes Agency Agency Agency Ancy
Are Dept De$t Stuctural
IRI Mainbane Crcke Cracke Revelled
Daily Trali ESA Annus
To
Benefits (
Code
(rat
Capital Recunen Capital Racurren Operalo
(%)
%) (rim (nan) Number
re) A#plld
(%)
N
(vpd)
pOO) D
200.0
207.0
215.0
223.0
231.0
240.0
249.0
259.0
260.0
279.0
299.0
300.0
312.0
323.0
336.0
349.0
362.0
370.0
390.0
405.0
23.6
24.5
25.3
29.1
25.9
27.7
26.6
20.s
30.4
31.4
32.4
33.4
34.4
35.5
36.0
37.7
38.9
40.1
41.4
42.7
102
10S
11.2
12.0
12.2
12.3
12S
11.
12.8
13.0
13.1
133
12.5
13.0
13.0
140
13.1
14.3
145
135
240.0
207.0
2t5.0
223.0
231.0
240.0
249.0
214.0
23.6
24.5
25.3
26.1
29.9
27.7
10.2
2.7
2.7
2J
2.9
3.0
3.0
3.1
2Z.0
29.5
RES&J
RESU
RESU
RESU
RESU
CONS
lcosrtARete
1 Graing evwy90day 4 Raw
+ Ree at M%
a - PwadgIbn1
- PevOgin 164+
eadt 4a26%
4 . PAWInt 1996.+ Re_A 403%
S-Paing&tV
eaDai2
0.0
0.0
0.0
0.0
0.0
0.
0.0
0.0
0.0
0.0
0.0
0.0
0.0
0o0
0.0
00
0.0
0.0
00
O
00
0.0
0.
0.0
o0
0.0
0.0
0.0
0.0
0.0
o0
0.0
0.0
0.0
0.0
0.0
0.0
0.0
0.0
0.0
0.0
o0
o0
00
0.0
0.0
0.0
0.0
22
2.S
2.7
30
3.1
33
SA
00
10
1.1
1.2
1.2
1.3
1.3
1.3
0.0
2.8
20
2z
2.
2.8
z2
2.
0.0
0.0
0.0
0.0
0.0
0.0
0.0
00
0.0
0.0
0.0
0.0
0.0
00
0.0
00
0.0
0.0
0.0
0.0
0.0
0.0
0.0
0.0
0.0
0.0
0.0
0.0
0.0
0.0
0.0
O
0.0
00
00
0.0
00.
00
0.0
0.0
0.0
CAMrPeden
.4 Ib-legle
staeCe
0.0
0.0
0.0
0.0
0.0
0.0
0.0
0.0
0.0
0.0
0.0
0.0
0.0
0.0
00
0.0
0.0
0.0
0.0
00 0.0
00 0.0
0.0 0.0
0.0 0.0
0.0 0.0
0o0 0.0
0.0 0.0
0.0 0.0
0.00o0
0.0 0.0
0.0 0.0
00 0.0
0.0 0.0
0.
0.0
0.0 0.0
0.0
0.0
0.0
0.0
0.0
0.0
0.0
0.0
0.0
0.0
0.0
0.0
0.0
0.0
0.0
0.0
0.0
0.0
0.0
0.0
0.0
0.0
0.0
0.0
0.0
0.0
0.0
00
O
0.0
0.0
0.0
0.0
O
00.
GRAV
GRAV
GRAV
GRAV
GRAV
GllAV
GRAV
GRAV
GRAV
GRAV
GRAV
GRAV
GRAV
GRAV
GRAV
GRAV
GRAV
GRAV
GRAV
GRAV
71.9
193.2
143.0
133
102.7
71.3
180.2
156.4
1229
80.6
53.5
167.7
131.0
93.4
55.0
105.6
125.2
03.8
191.4
147.8
GRAV
ST
ST
71.9
0.0
0.0
0.0
0.0
0.0
00
0.0
ST
ST
ST
ST
ST
0.044
0.044
0.044
044
0.044
0.044
0.044
0.044
0.044
0.044
0.044
0.044
0.044
0.044
0.044
0.044
0.044
0.044
0.044
0.044
0000
1.2D0
0.000
OOO
0.000
0.037
0.037
0.037
0.037
0.037
O.OCO 0.037
1.200
0.037
O.0DO
0.037
0.000
0.037
O.00
0.037
0.037
O.OD
1.2D0
0.037
0.037
O.OD
o.o00
0.037
0.000
0.037
1.250
0.037
0.037
0.000
O.000
0.037
1.200
0.037
0.000
0.037
2.346
3.002
2.631
2.826
2.950
. 3.075
4.400
3.216
3.445 3.4e2
3.03s
3.598
3.754
3.791
5.154
3.917
3.912
3.949
4.2e1
4.28
4.451
4.488
5.582
4.645
4.625
4.662
5.054
5.09t1
6.515
1.279
5.248
5.25
12.0
0.000
0.044
OOO
O.0
0.00
0060
0.00
.4000
o.o0
o.ooo
o.0oo
0.000
0.000
O6
OCO
00D0
OcO
2.309
1 J72
t.530
1.669
1.711
1.J14
1161
1064
OC0O
1.709
0.
O
0.000
0.000
0.000
1.709
0.000
o0o0
0.000
O.0o
t.709
0.000
0.000
O.O0
1.709
OC0
o0oo
1.709
0.000
Oc0
ooc
OttO
00
OCo
*
O050
0.037
0.043
0.043
0.043
0.043
0.043
0.043
0.043
2.309
2.425
2.594
2.790
2.913
3.030
3.169
3.151
10.46
1.614
1A72
1.732
1.793
1J57
1.923
1.997
0.000 0.000CC
0.00
A
0.000
o.000
0.000
0.000
0.000
o.ooo
0.000
O.000
0.OD0
0.000
0.000
oo.0
OODO
0.000
oo.
0.000
o0c0
-O.600
2.047
osss
tDs5
1.157
1.210
2.48
I2
idntena
Consr Peddc Recurent TOtl VeSic Tol
Not
RAecnMtin"
Menlen
Agony Opwe
4
Slad Pe
Code Coats Ve
COde Co_
Code
Code
Rateof
PASun
tb
M
1t2O
00
6AO
70A
6.7
6.s9
2.40
OAS
0AS
6.3
"01
0.31
06s
0.34
0.54
9.84
2.71
OAS
O.31
744
GM
26.70 33.40
1900 260.1
17.70 2.06
M.40 2S60
SAO
a.70
0A
3.2
SA
3
S.?
17.1
1.7
26.6
CD
t
Mmag r S_mn y Table
MDM
R1nNHum:
M-tl Runelor iha Ragln
RunDxte:
0303
RoadNome:
GravatRoadI In Nont Ragio
Caldr Ya
DaltyTnaftk(ADT)
Two-Way
ESA(000)
AnnualTwo-Way
ESA(mintne/yr)
Cunamutativa
ReughnoxxORI)
ModSxntcWraNo(ISN)
PFernt Al Cracks(ALL)
Age(yr
Pavenmnt
Lnth
(knt)
Strategy
I . Grding every 00 days + R grav.
2 -PavIngIn 1003 + R*wealat 20%
3 -Pvringin 1004 + Resealat20%
4 Paving In 1995 + Raseslat20%
5 - Paving In ¶00 + Reaa at 20%
Stait
1093
200
2t3.
0.01
10.2
0.0
0.0
5
4
End
2012
405
42.7
0.32
(IQ
0
0
Currency MIUON US DOLLARS
100.0
Financial FinncIa FInaneal FinancIal EconomIe Economic
Total
Vehicle
Agency Agency Agency Agency
Tota OperaUon Society
Total Rvcurnen
Recurrn
12.00%
12.00%
0.00% 12.00% 12.00%
0.00%
Net
Premnt
Value
NPV
29.40
26.20
26.00
25.80
25,70
0.00
3.20
3.40
3.60
3.70
6.54
13.04
13.04
13.04
13.04
0.43
14.03
14.03
14.02
14.02
3.42
12.37
11.03
9.84
6.77
3.79
12.76
11.44
10.24
0.17
2t.70
16.00
17.70
18.40
10.00
lntemal
Rate of
Rabim
iRR
Avg STO
IFR IRI
NONE 12.7
17.10 3.7
18.70 4.0
20.0
4.4
MANY
4.7
1.2
1.o
2.2
2.7
3.0
Min Max End
IrU
R
t
10.2
2.7
2.7
2.7
2.7
14.5
10.2
10.5
10.7
¶0.8
End
IPJ MSN
13.5
4.2
4.1
4.0
3.0
0.0
2.0
2.9
2.0
2.9
End End Operatona
ALL AGE
0.0
0.0
0.0
0.0
0.0
1.0
6.0
5.0
4.0
3.0
1tt4RESU
1004CON
lOOSCON
1tttCON
1907CON
1000RESU 2004RESU 200tRESU 2011RESU
200tRESE
2007RESE
200tRESE
2)00RESE
HDMManager 27
References
1.
The Highway Design and Maintenance Standards Series:
- Vehicle Operating Costs: Evidence from Developing Countries. Andrew Casher and Robert Harrison.
- Vehicle Speeds and Operating Costs: Models for Planning and Management. That Watanatada, Ashok
M. Dhareshwar, and Paulo Roberto S. Rezende Lima.
- Road Deterioration and Maintenance Effects: Models for planning and Management. William D. 0.
Paterson.
Washington, D.C.: Transportation Department, World Bank, 1987.
2.
The Highway Design and Maintenance Standards Model: HDM-PC User's Guide and PC Disks,
Rodrigo Archondo-Callao and R. K. Purohit. Washington D.C.: Transportation Department, World
Bank, 1989.
Distributed Exclusively by:
McTrans
Center for Microcomputers in Transportation
University of Florida
512 Weil Hall
Gainesville, FL 32611-2083
(904) 392-0378
1-800-226-1013
McFax (904) 392-3224
McLink (904) 392-3225
3.
The highway Design and Maintenance Standards Model
- Volume 1. Description of the HDM-III Model
- Volume 2. User's Manual for the HDM-II Model
Thawat Watanatada, Clell G. Harral, William D. O. Pateron, Ashok M. Dhareshwar, Anil Bhandari,
and Koji Tsunokawa. Washington D.C.: Transportation Department, World Bank, 1987.