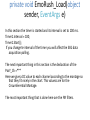
1
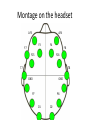
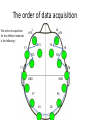
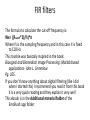
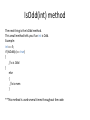
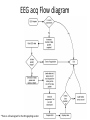
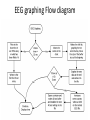
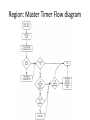
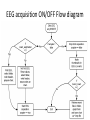
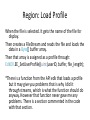
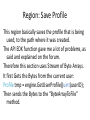
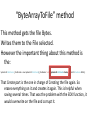
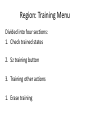
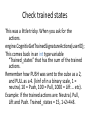
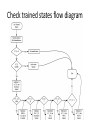
EmoRush CODE Tutorial for the programmer Daniel Ehrens [email protected] 2242233387 Before we start… Before we start I suggest you go through the EmoRush app Tutorial presentation and through the Emotiv UserManual (when reading the User Manual don’t focus a lot on the Code). Once you’ve done that and fully understood how to use the EmoRush App then comeback to this tutorial. So you’re back... The sole objective of this presentation is to: 1. To do everything in my power to help you understand the code behind the EmoRush application through a power point presentation. Before getting into the code There are somethings you should know about the headset. You have 14 channels, 7 on each side. However you have 16 contacts on the headset because one on each side is the GROUND. The headset has an analog bandwidth of 0.16Hz to 85 Hz and then some serious digital notch filters at 50 Hz and at 60 Hz. The EEG has a sampling rate of 128 Hz, so if you think about it you can’t even see anything above 64 Hz. ***Link to emotiv… Montage on the headset AF3 AF4 F3 F7 F4 FC5 F8 FC6 T7 T8 GND GND P7 P8 O1 O2 The order of data acquisition 1 AF3 The order of acquisition for the different channels is the following: 14 F3 F7 AF4 F4 FC5 F8 FC6 T7 T8 GND GND P7 P8 O1 O2 General characteristics of the CODE • The code was built on Visual Studio 2010, Professional edition. • It is written in C#. • It is a Windows Forms program. • It is 2600+ lines of code long. Everything was done from the beginning having in mind that someone else was gonna continue the project. Helpful links For me C# was a new language when I started this project. Here are some helpful links to help you with any doubt you might have on some of the functions: ***http://www.dotnetperls.com/ ***http://msdn.microsoft.com/en-us/library/aa288436(v=vs.71).aspx Also if you struggle with any of the Emotiv functions you can post a thread in the Emotiv SDK forum at emotiv.com/forum (I posted a few). There are also some great examples there. ***http://www.emotiv.com/forum/forum15/ The program… To open the program go to: EmoRush appCODE folderEmoRush_WFA That is the folder for all the files that have to do with the programing. To open the code open the file: EmoRush_WFA.csproj Visual Studio will launch. (If the code doesn’t open instantly) On your left side you have your solution Explorer, double click on the EmoRush.cs and the Designer form will appear double click on it ant the code will appear. I do not know how familiarized you are with this type of programming but basically you add items to the “Design” and then add actions to it by implement the code. Windows Forms Applications ***http://msdn.microsoft.com/en-us/library/360kwx3z(v=vs.90).aspx It is quite easy and there are a lot of examples out there so you don’t have to worry. Layout of the code The Code is fairly organized into “regions” and there are comments on what is happening everywhere along the code. The regions start right after the method called “IsOdd”. We are going to go through each region I will show you a few flow diagrams to show you what was the general idea of that region or part of code. You don’t need to be a skilled programmer to do this, you basically need to know “if”s and “for”s that is what programming is all about, at least that is what I say. My recommendation is that you open the code and start going through the regions and sections as they are mentioned in this tutorial. Beginning of the Code… The first thing there you find are all the libraries that you use. For example: Using Emotiv; This is the Emotiv library that uses the edk.dll, edk_utils.dll and the DotNetEmotivSDK.dll. After this in the public partial class EmoRush:Form You have the declaration of all the global variables that will be used throughout the code. The following section of the code is the public EmoRush() section Here the handlers for events are created so that when an event happens (i.e. TrainingStarted…When training of an action starts the code goes to that handler.) Here you will also find the InitializeComponent(); this is very important and basically launches the whole application. The static void Main() Only launches the code with the Application.Run(new EmoRush()); Nothing else really in the Main… Then comes the private void EmoRush_Load(object sender, EventArgs e) This is quite important because whatever happens here is done at the very beginning when the program is launched. private void EmoRush_Load(object sender, EventArgs e) In this section the timer is started and its interval is set to 100 ms. Timer1.Interval = 100; Timer1.Start(); If you change te interval of the timer you will affect the EEG data acquisition polling. The next important thing in this section is the declaration of the PosY_Ch =*** Here we give a DC value to each channel according to the montage so that they fit nicely in the chart. This valuess are for the Circumferential Montage. The most important thing that is done here are the FIR filters. FIR filters This is our first region. Here we create the filters for the SODA bandwidth. In this region we create the FIR (Finite Impulse Response) filters. For the following bandwidths: • 1-8Hz • 1-10Hz • 1-12Hz • 1-14Hz • 1-16Hz • 1-35Hz FIR filters The formula to calculate the cut-off frequency is: Wx= ((Fcutoff*2)/fs)*π Where fs is the sampling frequency and in this case it is fixed to 128 Hz. This routine was basically inspired in the book: Biosignal and Biomedical Image Processing: Matlab based applications- John L. Semmlow Pg. 105 . If you don’t know anything about digital filtering (like I did when I started this) I recommend you read it from this book it is a very quick reading and they explain it very well This ebook is in the Additional material folder of the EmoRush app folder IsOdd(int) method The next thing is the IsOdd method. This small method tells you if an int is Odd. Example: int x = 5; if (IsOdd(x) == true) { // x is Odd } else { //x is even } **This method is used several times throughout the code. Region: Read cognitiv and send to EmoCube This is the basic flow diagram for the region. Read Cognitiv To get the current state you have to create an object object to access the class EmoState. The current Action comes as a string you can see that in the switch case. The Action Power comes in a scale from 0 to 1 so that is why it is multiplied by 100. Communicating with RushCube application The RushCube application receives the data through and UDP network connection socket. This is declared above with all the variables: UdpClient EmoCube = new UdpClient (“127.0.0.1”, 5204) Where 5204 is the Port being used and the 127.0.0.1 the hostname. *the hostname means its this computer, and the port was picked An action is communicated as two comma-separated, ASCII formatted values. Example: You send “2,80” for PUSH with Power 80% That is in: EmoCube.Send(Encoding.ASCII.GetBytes(Cube_data),Cube_data.Length)); Region: Winks Very similar to the last region in the sense that you create an object and ask which type of wink is happening and then just put it in a label. Region: User Handler This region is fairly simple it basically asks for the userId which depends on how many headsets are turned on and connected, in this case most of the times the userId is 0. It enables the EEG data acquisition for that user, only possible if you have the Research Edition SDK. Sets the EEG data buffer to 1 sec of data so 128 data values. Region: User Removed I think the only time this comes up is when you disconnect the receiver from the computer. But it’s here just in case something happens. Region: Outputfile Header This part creates the file where the EEG data will be written. Opens a stream to write on the file and writes the first line on the file. Read the CAUTION comment on this. The order of the header that is written is important, since it is used later on to verify that when you select a file to open it is an EEG file created by the object. The EEG acquisition is always in this order, no matter if you change the montage it doesnt affect the order the channels data is retrieved from the headset. AF3, F7, F3, FC5, T7, P7, O1, O2, P8, T8, FC6, F4, F8, AF4 This is also shown in slide #6. Region: Raw EEG acquisition and file output writing. I think this is one of the most complex regions and I think the longest. So after this everything is pretty much down hill. This region is in charge of acquiring the EEG data packets, graphing the EEG in the chart, calling the SODA and displaying the timer for EEG acquisition. This method is called from the Master Timer region if the acquire is set to true, which is toggled by the EEG acquisition ON/OFF button. EEG acq Flow diagram *There is a flow diagram for the EEG graphing section EEG acquisition The count_eegPacket is just a basic counter of the packets that have been acquired, this helps to know if it is the first EEG recording. This EEG acquisition method is suppossed to be called every 100 miliseconds or so, however each packet has a buffer size of approximately 20 values. The more processing you do the buffer size will increase. If you get to 128 then you are already losing data, plus the display will have a lot of delay. Remember the buffer size was set to 1 sec. EEG acquisition The graph will display 10 sec which is the convention for reviewing EEG. That is why a 10 second buffer is created to store EEG data. The EEG signal from the headset comes with a DC offset. To solve that issue we get the mean value for each channel of the first second of acquisition and substract it to each channel and add a value for it to be displayed nicely. Since the EEG acquisition was enabled since the user was added the data buffer is already full with one second of data so the first data packet has already one sec of data. EEG graphing Flow diagram EEG graphing The program was designed to graph and at the same time record in a *.csv file the data. First it fills the 10 sec display and then it does a shifting of the 10 second array, the length of the shift is determined by the buffer size. *The functions that are being used for graphing were not developed for high resolution real time signal display. So they are not effective and can produce a lot of delay. That is why in the shifting graphing section only the Odd points are being graphed. If there is a Sz Event If there is a seizure event then it will be marked in the EEG file with a “1000”. Also a stream is started and writes the 40 seconds before the event onset that was detected and sets to true the EEG_Szevent flag which wil enable the program to write the following 40 seconds to the event file. This event files are the ones that are reviewable through the menu: ApplicationLoadEEG data The time display The time display is based on the number of values that are acquired. That number is converted to seconds and then to minutes and so forth. Then there is a section that makes sure that the SODA is called every second. Even if SODA is deactivated it should be called here since in that method the 40 second buffer is also built. Region: EEG filtering and Seizure detection algorithm The first part of this region is a lot like the EEG graphing part where a buffer of 40 seconds is filled and once it is filled there is a shifting of one second to keep it updated. After this there is comes the section to keep writing in a file every second for 40 seconds in case a seizure event is detected. So basically if a seizure event is detected what happens is that a file is created in which the 40 second buffer is written and then for next 40 seconds data is written to that file. SODA The SODA is pretty simple using simple math… The signal processing is the following: 1. Convolution of the FIR and the raw EEG. 2. Derivative of the filtered EEG. 3. Make all values positive. 4. Calculate the area under the curve for the 1st derivative of the EEG, this is done for a window of 20 sec. 5. Compares the mean value of the AUC of the 1st derivative of the selected channels of the first 10 seconds against the last 10 seconds of this 20 seconds window. Basically SODA does a comparison every second between shiftin 10 seconds window of the AUC of the 1st derivative for the filtered EEG. The AUC of the 1st derivative of the filtered EEG tells us the amount of change in the slope(dynamic change) of the frequencies of interest. Region: Chart preparation This region is pretty simple. Clears the chart and creates the series and states the specifics about the axes and the position of the chart. Region: Master Timer Flow diagram Region: Master Timer This is suppossed to happen every 100ms. The first thing that happens is that it calls Engine.ProcessEvents(); This will check if there are any pending events like if the EmoState has been updated, if it has goes to that handler and then sends the new action to the cube. After that it if a second has passed then: Checks if neutral state is being trained or if the beeping alarm is on. Region: Master Timer The neutral state has to be trained here because its function doesn’t have a intrinsicate timer of 8 seconds like the other training actions. Therefore we do the 10 second counting of the training here. The beeping alarm flags are modified when you move the block in the read cognitiv region. Either increasing the frequency or decreasing it. Region: Connect Button This region has the handler of the click event and then calls the method Connect(); This method just asks if there is a user connected. If the userID is -1 there is no one connected. engine.Connect(); is used to connect with the headset directly. engine.RemoteConnect(“127.0.0.1”, 1726(or 3008)); is used to connect with the control panel or with the emocomposer, 1726 is the port for the emocomposer. Region: Alarm Button This region toggles the beeping alarm on or off. The starting frequency for this is 1 beep every second, this can be easily changed with the beep_counter = x; EEG acquisition ON/OFF Flow diagram EEG acquisition ON/OFF This region toggles the acquisition of the EEG. If it is off, it asks if it is the first time it will be turned on or not. Then prepares everything and activates the acquisition with the flag acquire. If it is turning off the acquisition then it will ask for the Seizure event files. If there are any then it will graph them and take a snapshot and save it as a *.bmp file in that folder, this files are used in to make the ImageView that is used in the Listview. Region: Make Thumbnails of files generated This region is within the EEG acquisition ON/OFF. It is very similar to the prepare chart region with the exception that 80 seconds are being graphed into the chart. Then it reads all the Event files, graphs them and saves them as a *.bmp snapshot. chart1.SaveImage(); is used to save them. Region: Toggle montage This region has a counter that increases according to the times the button is clicked. It basically reorders the labels for the channel names and gives an offset to the channels for them to appear in the montage selected. This offset was determined empirically by trial an error. The offset is added once the DC is removed from the channel. Region: Enable Cube One of the simplest regions in the code. This pretty much just toggles the flag enable_cube Which will enable the cube in the ReadCognitiv region. Region: Load previous file EEG file Listview This region is in charge of responding to the .. ApplicationLoadEEG data It asks you for the folder where the event files are. Then in that folder it looks for the *.bmp files, creates an ImageList with these files. Adds these Images to the ListView with the number of the EEG recording and then the event number. So 1.3 means EEG 1 event 3. *This format is important later on when the event is graphed. ***http://www.dotnetperls.com/listview ***http://www.dotnetperls.com/imagelist Region: Graph Event This chunk of code is in charge of graphing the event when one of the thumbnails is doubleclicked upon in the ListView. So first is.. ApplicationLoadEEG data Once it loads the thumbnails then selected one, it goes into here. It basically looks for that file and then graphs the file, very much like in the make the Thumbnails or EEG acq. This time the chart has a 10 sec reference since it is for EEG analysis. Region: Add Profile With this section, the Load and Save Profile, I struggled a little so there is a thorough explanation in the Community Forum, Emotiv SDK. “Erasing cognitiv training, How to handle training in C#” *** emotiv.com/forum/forum15/topic2528/ Since you depend on what the emotiv function does it can mess up other things. So basically what this section does is that it saves the current profile or if there is none it creates one with a new name. Like mentioned before you have to save the profile created for it to stay like that. Region: Load Profile When the file is selected. It gets the name of the file for display. Then creates a FileStream and reads the file and loads the data in a Byte[] buffer array. Then that array is assigned as a profile through: EdkDll.EE_SetUserProfile((uint)userID, buffer, file_length); *There is a function from the API edk that loads a profile but it may give you problems that is why I did it through streams, which is what the function should do anyway. However that function never gave me any problems. There is a section commented in the code with that section. Region: Save Profile This region basically saves the profile that is being used, to the path where it was created. The API EDK function gave me a lot of problems, as said and explained on the forum. Therefore this section uses Stream of Byte Arrays. It first Gets the Bytes from the current user: Profile tmp = engine.GetUserProfile((uint)userID); Then sends the Bytes to the “ByteArrayToFile” method. “ByteArrayToFile” method This method gets the file Bytes. Writes them to the File selected. However the important thing about this method is the: System.IO.FileStream _FileStream = new System.IO.FileStream(_FileName+”.emu”,System.IO.FileMode.Create,System.IO.FileAccess.Write); That Create part is the one in charge of Creating the file again. So erases everything on it and creates it again. This is helpful when saving several times. That was the problem with the EDK function, it would overwrite on the file and corrupt it. Region: Training Menu Divided into four sections: 1. Check trained states 2. Sz training button 3. Training other actions 1. Erase training Check trained states This was a little tricky. When you ask for the actions. engine.CognitivGetTrainedSignatureActions(userID); This comes back in an int type variable “Trained_states” that has the sum of the trained actions. Remember how PUSH was sent to the cube as a 2, and PULL as a 4. (kinf of in a binary scale, 1 = neutral, 10 = Push, 100 = Pull, 1000 = Lift … etc). Example: If the trained actions are: Neutral, Pull, Lift and Push. Trained_states = 15, 1+2+4+8. Check trained states flow diagram CAUTION! This chunk of code was made to recognize actions trained by the EmoRush Application. If you use a profile that has actions trained in the Control Panel different from: • Push • Pull • Lift • Drop • Rotate_Reverse Then it will not recognize the actions properly Sz Train Button This section is called when the SZ train button is clicked. It will start the training for the SZ (COG_ROTATE_REVERSE), the action for the SZ can be trained here. The training is done twice so that it records 16 sec of the seizure. Training Actions This does the same thing as the SZ button but through the Training Menu, and trains all the other actions. Only once so 8 seconds. It also makes sure that you dont have more than 2 actions trained besides the SZ. You can have up to 4 actions trained and active at the same time but it is really hard to control them. Erasing actions Very simple, and similar to the training action section. It can individually erase an action or erase all actions which is handled in the training event handlers. Region: Training Event Handlers In this part you will see the handlers for: • Training Succeeded • Training Started • Training Completed • Training Reset when erasing one action • Training Erase for erasing all actions The flow diagram of how the training works is in the User Manual pg 59 Region: About SW This region is purely in charge of displaying a message box with my contact information. If you make significant changes to the code you might want to include your contact information too. You reach this section through: ApplicationAboutSoftware Region: ON/OFF SODA This region toggles the SODA. A label on the right side of the SODA Bandwidth should say “On” or “Off” telling you if it is activated. It is reached through: ApplicationSODAON/OFF SODA Region: Toggle Bandwidth for SODA This region works similar to the EEG montage region. With the exception that it toggles the FIR filter that will be used for the SODA. It is also shown in the label on the right side of the button.