1
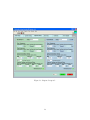
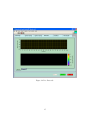
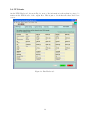
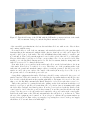
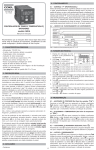
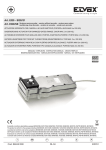
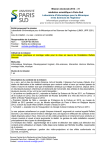
Version 1.0
User’s Manual
LWA Portable RFI Monitor
Frank Schinzel, Ylva Pihlström, Joe Craig, and Ted Jaeger
July 24, 2008
Contents
1 Introduction
3
2 Hardware
2.1 Antennas and Baluns . . . . .
2.2 Receiver Box . . . . . . . . .
2.3 Bias-Tee and Power Supply .
2.4 Spectrum Analyzer and GPIB
2.5 Noise Source . . . . . . . . .
2.6 GPS Receiver . . . . . . . . .
2.7 Computer . . . . . . . . . . .
2.8 Full Setup . . . . . . . . . . .
. . . . . .
. . . . . .
. . . . . .
interface
. . . . . .
. . . . . .
. . . . . .
. . . . . .
.
.
.
.
.
.
.
.
.
.
.
.
.
.
.
.
.
.
.
.
.
.
.
.
.
.
.
.
.
.
.
.
.
.
.
.
.
.
.
.
.
.
.
.
.
.
.
.
.
.
.
.
.
.
.
.
.
.
.
.
.
.
.
.
.
.
.
.
.
.
.
.
.
.
.
.
.
.
.
.
.
.
.
.
.
.
.
.
.
.
.
.
.
.
.
.
.
.
.
.
.
.
.
.
.
.
.
.
.
.
.
.
.
.
.
.
.
.
.
.
.
.
.
.
.
.
.
.
.
.
.
.
.
.
.
.
.
.
.
.
.
.
.
.
.
.
.
.
.
.
.
.
.
.
.
.
.
.
.
.
.
.
.
.
.
.
.
.
.
.
.
.
.
.
.
.
.
.
.
.
.
.
.
.
.
.
.
.
.
.
.
.
.
.
.
.
.
.
.
.
3
4
6
8
9
10
10
11
11
3 Software
3.1 Labview Program
3.2 System Setup . .
3.3 Capture Setup .
3.4 Live Data . . . .
3.5 Statistics . . . .
3.6 FITS Header . .
.
.
.
.
.
.
.
.
.
.
.
.
.
.
.
.
.
.
.
.
.
.
.
.
.
.
.
.
.
.
.
.
.
.
.
.
.
.
.
.
.
.
.
.
.
.
.
.
.
.
.
.
.
.
.
.
.
.
.
.
.
.
.
.
.
.
.
.
.
.
.
.
.
.
.
.
.
.
.
.
.
.
.
.
.
.
.
.
.
.
.
.
.
.
.
.
.
.
.
.
.
.
.
.
.
.
.
.
.
.
.
.
.
.
.
.
.
.
.
.
.
.
.
.
.
.
.
.
.
.
.
.
.
.
.
.
.
.
.
.
.
.
.
.
.
.
.
.
.
.
.
.
.
.
.
.
13
13
13
14
15
15
19
.
.
.
.
20
20
22
22
22
.
.
.
.
.
.
.
.
.
.
.
.
.
.
.
.
.
.
4 Field Setup and Operation
4.1 Field Setup . . . . . .
4.2 Calibration with Noise
4.3 Strong RFI Survey . .
4.4 Packing Up . . . . . .
.
.
.
.
.
.
.
.
.
.
.
.
.
.
.
.
.
.
.
.
.
.
.
.
. . . .
Source
. . . .
. . . .
.
.
.
.
.
.
.
.
.
.
.
.
.
.
.
.
.
.
.
.
.
.
.
.
.
.
.
.
.
.
.
.
.
.
.
.
.
.
.
.
.
.
.
.
.
.
.
.
.
.
.
.
.
.
2
.
.
.
.
.
.
.
.
.
.
.
.
.
.
.
.
.
.
.
.
.
.
.
.
.
.
.
.
.
.
.
.
.
.
.
.
.
.
.
.
.
.
.
.
.
.
.
.
.
.
.
.
.
.
.
.
.
.
.
.
.
.
.
.
.
.
.
.
.
.
.
.
.
.
.
.
.
.
.
.
.
.
.
.
.
.
.
.
.
.
.
.
.
.
.
.
1 Introduction
The LWA portable RFI monitor (LPRM) is a mobile system capable of monitoring and recording
a local site’s RF signals in a user-specified frequency and time range. The LPRM consists of a Big
Blade prototype antenna with active balun, broadband antenna, low-noise pre-amplifier, remotely
controlled spectrum analyzer with GPIB port, and a laptop PC running Labview. The frequency
coverage is limited by the pre-amplifier to a range 1-1000 MHz, although the type of antenna used
limits the effective bandwidth. The equipment has a power load of ∼ 250 W and can easily be
operated in remote locations using a portable power generator supplying 115VAC.
The data are recorded as time-frequency dynamic spectra and saved in FITS1 binary table format
at user supplied intervals. The table consits of a time axis corresponding to the number of captured
spectra and a frequency axis for the spectral bins. The power in each spectral bin is recorded in dB
as captured by the spectrum analyzer. The frequency span, resolution per bandwidth and sweep
time are user selectable using simple GUI dialog boxes. Instrument and user interfaces are controlled
using Labview modular VI’s (Virtual Instruments). The LPRM was designed primarily to monitor
radio frequency interference (RFI) in the 10-90 MHz band in support of site selection for the Long
Wavelength Array. Recently it has been upgraded to to provide a larger frequency coverage due to
changed requirements.
The LPRM system originally came from the University of Iowa (IPRM; LWA memo 76) and has
been re-designed and upgraded on the receiver side to an intermediate second generation system
that was capable of recording shorter strong RFI with a single antenna. The latest third generation
of the system has the capability to switch between two antennas, thus two different frequency ranges
within the same recording. The Labview software has been upgraded for these changes as well.
2 Hardware
The third generation LPRM system consists of the following components (Fig. 1):
1. Antennas:
• Big Blade antenna (1-100 MHz)
• Icom discone antenna (100-1000 MHz)
2. Active balun:
For measurements with the Big Blade antenna, the signal passes through an LWDA Teletech/Hicks
balun (G=+24 dB, IIP3=7.5 dBm, NF=2.7 dB)
3. Bias-Tee:
The active balun is powered via a Bias-Tee (ZBNT-60-1W, using +9 VDC and 0.32 mA, G=
-0.2 dB, NF = 0.2)
4. RF switch:
A highly isolated switch operating on a single supply voltage selects the channel input (ZX80DR230+, G=-1dB, IIP3=+55dBm)
1
FITS (Flexible Image Transport System) format utilizing the NASA CFITSIO library.
3
5. LP filter:
BPL-1200 with a cutoff at 1200 MHz (Gain = -0.1 dB, NF = 0.1)
6. LNA:
ZFL-1000LN (G=+23.5 dB, IIP3 = -8 dBm, NF=2.9)
7. Noise Source for system calibration:
Elecraft N-gen wideband noise generator (100 kHz - 500 MHz, ±3 dB)
8. Spectrum Analyzer:
Advantest R3131A
9. USB-GPIB interface
10. Laptop:
IBM Thinkpad T40 laptop running Windows XP Professional and National Instruments (NI)
Labview 8.0
11. Power supply for the LNA and the bias-T:
Instek GPS-4303
12. GPS Receiver Garmin eTrex Vista HCx
13. Portable generator:
United Power 7200 W
14. Battery Backup:
APC UPS XS Series (540W/900VA)
In addition to the components listed above we also have the possibility of including additional
attenuators, which is needed for the lower frequency range that has an additional amplifier as
compared to the higher frequency range. When used, these attenuators are inserted between the
Big Blade antenna terminals and the active balun. The attenuators are SMA fixed coaxial types of
+5, +10, and +20 dB respectively, 2 of each (Mini-circuits VAT-5+, VAT-10+, and VAT-20+).
2.1 Antennas and Baluns
Currently, there are two sets of antennas employed. The LWA Big Blade prototype antenna, shown
in Fig. 2, a cross-dipole antenna with bent dipoles to increase the sky coverage. The antenna blades
have a 50 Ω input impedance. Details about design and characteristics can be found in LWA Memos
#78, #84, and #90. Eventually, the Big Blade is going to be replaced by the actual LWA prototype
antenna.
An active balun is attached to the antenna blades using either SMA pig-tails or an adaptor
attaching to the input stubs. For strong RFI measurements an LWDA Teletech/Hicks balun (Fig. 3)
is used with a gain of 24 dB. The balun is equipped with two separate input/output channels for the
two polarizations. In the future this is going to be replaced with a prototype balun (Fig. 3) with a
4
Trailer
Big Blade
antenna
Pre-amp enclosure
+15VDC
Teletech/Hicks
Gain +24dB
Balun
ZX80-DR230+
Gain -0.7 dB
ZNBT-60-1W
Gain -0.2 dB
30m LMR240
BiasT
A
BPL-1200
Gain -0.1 dB
LNA
B
Icom discone
antenna
320mA
+9VDC
ZFL-1000LN
Gain +23.5 dB
DIO
USB
30m LMR240
United Power
7200 W
Laptop
Generator
IBM T40 Windows XP
Labview 8
GPIB
Spectrum
Analyzer
Advantest R3131A
Figure 1: Block diagram of the LPRM/IPRM (version 3). The system can switch between taking
data from the Big Blade and the discone antenna.
Figure 2: LWA Big Blade dipole antenna at LWDA site.
5
gain of ∼28 dB. Its design is based on the RTA balun described in LWA Memo #120. Currently, the
prototype balun is only capable of powering one polarization at a time. Both are powered through
the feed cable with DC power. The LWDA balun is to be powered using a set current of 320 mA due
to the lack of an integrated voltage regulator. The new prototype baluns have voltage regulators
included, thus a supply voltage of 15 VDC should be used.
Figure 3: Left: Teletech/Hicks active balun, seen below the faceplate, with blades attached through
pig-tails and added attenuators. Right: New LWA prototype active balun attached to the
blades through adaptor braces.
2.2 Receiver Box
The receiver box, shown in Fig. 4 and consists of the Low Noise Amplifier (LNA, Mini-circuits
ZFL-1000LN), a low-pass filter BPL-1200 with a cutoff at 1200 MHz, and a RF-switch powered
through USB. The Low Noise Amplifier has a gain of 23.5 dB and a noise figure of 2.9 dB over
the frequency range 1-1000 MHz. Even considering the poor noise figure of the spectrum analyzer
(perhaps 15 dB) the large gain of the LNA ensures that the sensitivity of the LPRM is dominated
by the noise temperature of the LNA (Tn ∼ 250 K). The low-pass filter with a cutoff of 1200 MHz
(Gain = -0.1 dB, NF = 0.1) minimizes aliasing of strong signals over 1000 MHz. The receiver
box requires +15 VDC to power the LNA and +5 VDC provided through USB to power the RF
switch. The highly isolated switch operating on a single supply voltage selects the channel input
(ZX80-DR230+, G=-1dB, IIP3=+55dBm).
The above described parts are housed in a metal box. On its front panel Input and Output
Channels are attached through BNC connectors. Two switches control the behavior of the RF
switch, one can operate the RF switch in manual mode overwriting any command sent from the
PC or operate in PC mode, where the switching control is left to the PC. The green LEDs next to
the input connectors indicate which input channel is active. Power is supplied from the back, the
+15VDC through the banana plugs and +5 VDC through the USB connector attached to the PC
laptop. When the pre-amp is powered the red LED on the back should be illuminated.
6
Figure 4: Upper left: Front panel of the unpowered receiver box with the two RF Inputs and one
RF Output, switches and indicator LEDs. Upper right: Back panel of the unpowered
receiver box with the power inputs and USB connector. The RS232 connector is not used.
Lower center: Inside of the receiver box showing the RF switch and controller board,
pre-amplifier and low-pass filter.
7
2.3 Bias-Tee and Power Supply
To power the active balun installed at the lower band antenna (e.g. Big Blade) a wideband Bias-Tee
is employed. More specific a Mini-Circuits ZNBT-60-1W+ wideband (2.5 - 6000 MHz) Bias-Tee
(Fig. 5) with a maximum input loss of 0.3 dB at 50 MHz and 300 mA DC current. Maximum
specified DC voltage is 30 V and maximum current is 500 mA.
The DC power to the Bias-Tee and LNA is supplied through a laboratory power supply of the type
Instek GPS-4303 200 W (Fig. 5). The power supply has 4 output channels that can be regulated
separately or can be combined using parallel/series operation. CH1/CH2 has a setting range of 0-30
V and 0-3 A, CH3 2.2-5.2 V and 1 A Max., CH4 8 - 15 V and 1 A Max.
After turning on the power supply, the power settings can be made without actually supplying
the set power. To activate the power outputs, the On/Off push-button labeled for Output needs to
be pressed. If done so, the indicator LED should turn green and the Overload indicator LEDs turn
off. The displayed values for the individual Channels can be selected with the sliders next to the
displays on the left and right side respectively.
Figure 5: Left: Bias-T, Mini-Circuits ZNBT-60-1W+. Right: Laboratory power supply INstek
GPS-4303 with Bias-T attached to Channel 2.
8
2.4 Spectrum Analyzer and GPIB interface
The spectrum analyzer is an Advantest R3131A (Fig. 6) with a frequency range 9 kHz - 3 GHz.
It is controlled by the GPIB-USB interface attached to the GPIB port at the rear of the unit and
attached to the Computer via a USB connector. Using the GPIB, all user-controllable features of
the spectrum analyzer (e.g. frequency span, resolution) can be set remotely. This is done by using
a Labview VI as described in section 3.1 below.
The spectrum analyzer should be calibrated every time it is turned on. This is done pushing
”SHIFT” and the blue CAL (or 7) button. Then select ’Cal All’ with the button on the right of the
screen. A note of caution, if the sweep time is set too short for the resolution bandwidth, then the
averaged spectra produce a ’comb’ like structure at the edges of each frequency bin.
Figure 6: Spectrum Analyzer Advantest R3131A calibrating.
9
2.5 Noise Source
The noise source (Fig. 7) is used to calibrate gain of the system before use. To do so, the noise
source is first attached to the input of the spectrum analyzer and about 20 spectra a recorded for
the desired frequency range. Then the noise source is attached to the input of the antenna at the
far end and another set of spectra is recorded. The actual gain calibration is then done using the
post-processing software and the two calibration datasets.
The noise source itself is an Elecraft N-gen wideband noise source with a frequency range of 100
kHz - 500 MHz (within 3 dB). In the field it is powered using a 9V block battery or through an
external DC power source between 9V and 15V+DC. The current consumption is about 25 mA.
The excess noise output is approximately 35 dB.
Figure 7: Elecraft N-gen wideband noise source.
2.6 GPS Receiver
The GPS receiver is used to record the geographic coordinates, verify the system time and orient the
prototype antenna according to its compass. The GPS is a Garmin eTrex Vista HCx (Fig. 8). It can
store map and coordinate information on a mini-SD card inside the device. Information obtained
from the GPS is written on the Log sheet and put into the according fields in the recording software.
The coordinates and time are written in the FITS header of each data sample. The GPS can also be
used to navigate to the selected field testing location. The GPS requires two standard AA batteries
to operate, which give an approximate operation time of about 36 hours. The GPS unit can be
programmed with maps and position data using a standard USB cable.
Figure 8: Garmin etrex Vista HCx GPS unit.
10
2.7 Computer
The computer is an IBM Thinkpad T-40 (Fig. 9) notebook with a 1.5 GHz Pentium M processor, 1.5
GB memory, and 40 GB hard drive. It has two USB 1.1 ports, one of which is used to establish the
connection to the spectrum analyzer. The second one is used to power and control the RF switch in
the receiver box. The onboard wireless option of the T40 is disabled in the BIOS. Windows XP SP2
is the system operating system. The O/S system time zon is MST/MDT. The operating software
is Labview2 8.0
Figure 9: IBM Thinkpad T-40 notebook running the Labview VI.
2.8 Full Setup
The complete field setup is shown in Fig. 10. The spectrum analyzer and laboratory power supply
use a standard electronic power cable as well as the laptop (IBM 19V AC/DC adaptor). Everything besides equipment with its own battery should be connected to the APC UPS XS Series
(540W/900VA) which will continue delivering power in case of a power failure. Usually a portable
power generator United Power 7200 W provides the required power in the field.
The laptop is connected to the spectrum analyzer using the National Instruments GPIB-USB
adaptor as well as to the RF switch controller board through a second USB connection. Usually
the setup is installed in the LWA trailer which provides cable feed-throughs to the antennas and for
power.
2
c a product of National Instruments.
Labviewis
11
Figure 10: Upper left: Data recording laptop and data reduction laptop. Upper right: From top to
bottom the spectrum analyzer, power supply and receiver box. Lower left: APC UPS
XS Series (540W/900VA). Lower right: United Power 7200 W portable power generator.
12
3 Software
3.1 Labview Program
All LPRM equipment and data collection routines are written using Labview 8.0 virtual instrument
(VI) modules. Labview provides some desirable characteristics, such as a modular design, connectivity to various data ports (serial, USB, etc.), remote access over the Internet, as well as compatibility
to external functions via dynamic link libraries.
A Labview VI contains three main components:
• A Front Panel which displays all Inputs and Outputs adjustable by the end user.
• A Block Diagram which contains the actual program structure
• Action buttons that control the start, stop or repetition of the virtual instrument.
As a general user of the LPRM system, one only has to deal with the Front Panel and thus should
not be concerened with the underlying structure of the VIs.
The main IPRM VI is opened by clicking the “LPRM” shortcut located on the desktop or by
opening the file “C:\ LPRM\ main.vi” inside Laview 8.0. (The block diagram for the VI is hidden
by default).
Figure 11: User interface blocks of the Labview recording software.
To execute the LPRM VI, press the START action butten indicated by the right arrow icon. The
VI should now show the active Front Panel. The LPRM VI contains six tabs which allow varying
functionality to the user. Fig. 11 shows the different front panels (tabs) available to the end user.
The Input group are the panels that require user input and have to be filled out before the data
is recorded. The Output group are the panels that visualize the data that is being recorded and
show instantly what information is recorded, before it writes out a FITS file. The “IPRM Main”
tab is just a front page and has no functionality. Usage and functions for these individual panels
are described in the following sections.
3.2 System Setup
The “System Setup” tab, shown in Fig. 12 contains information about the current system settings. It
is separated into two groups, “Hardware Settings” and “Observer and Site Information”. In general
“Hardware Settings” do not need to be changed. There the Spectrum Analyzer control channel is
13
selected and the directory where the FITS files are going to be written at is defined. Usually this
should be “C:/LPRM/savefiles/”. The “Observer and Site Information” need to be adjusted. The
names of the observers need to be entered, the abbreviated site name (e.g. NA, MA), Northern
Latitude and Western Longitude coordinates of the site in the format indicated (dd:mm:ss), there
is also room for a short note about the site/setup which is going to be stored in the FITS file as
well.
Figure 12: System Setup tab.
3.3 Capture Setup
Another input tab is the “Capture Setup” (Fig. 13), here everything about the data recording and
settings of the spectrum analyzer is defined. The panel is split in two sections, one for Channel A
and one for Channel B corresponding to the Inputs labeled A and B on the receiver box. To switch
between Channel A only and Channel A and Channel B modes just use the check-box at the upper
right corner indicating whether Channel B is enabled or not. If Channel B is disabled all the Input
boxes are grayed out and parameters can not be changed.
The boxes labeled Model are for entering the antenna type, in this example we have the Big Blade
1 antenna in East-West direction, “BB1EW”, on Channel A and a “discone” antenna on Channel B.
Then the capture settings are defined for each Channel. Start and Stop frequencies can be either
14
selected from the drop down menus or by checking the manual check-boxes custom defined. Her for
example we have Channel A defined ranging from 1 to 100 MHz and Channel B from 100 to 1000
MHz. The the resolution bandwidth (RBW) needs to be defined from the drop-down menus. For
the lower frequencies we like to have higher resolutions, thus we usually select 10 kHz, for higher
frequencies to speed up things we go to a RBW of 100 kHz. The reference level (REF level) needs
to be adjusted according to the maximum power level expected in the spectrum. For the discone
antenna -40 dB is a good value, for the Big Blade due to the active balun the level is usually higher
around -10 to -20 dB. The dB per DIV value does not need to be changed, the default value is just
right. The sweep time is a crucial parameter. For higher RBW a longer sweep time is recommended
in order to avoid producing artifacts in the spectrum like ’comb’ structures. For 10 kHz RBW a
sweep time of 250 ms is adequate, for 100 kHz, 150 ms can be used.
Then the sample intervals (Samp. Int) need to be defined. This specifies after how many spectra
new FITS file is written out to the harddrive, a good measure should be every half hour or full
hour. The value for sample intervals is based on past experience, because the time per interval can
only be estimated. A Samp. Int. of 100, as indicated in the figure, usually corresponds to around
120 minutes of data. The values for “Pre-Amp”, “Balun” and “Atten” correspond to the gain of the
components used in the individual Channel. These values are written into the FITS file headers for
later reference. The “Duty Cycle” of Channel B should always be 1 for our purposes. This number
defines how many spectra are being recorded for Channel B per sample interval.
Once all the information is entered and verified the green “Record” button can be pressed and the
system starts recording. To stop the data recording there are two methods available. By pressing
the red “Stop” button, the system finished the last sample interval and writes out a half completed
FITS file, at the moment there is no mean of handling these half written files. The other method is
to just press the stop button of the Labview program (red stop sign) close to the run button (right
arrow) that has been pressed to start the program. This stops the data recording instantly and all
spectra that have not been saved to a file yet are lost.
3.4 Live Data
After the data recording process has been started the instantaneous spectrum spectrum can be seen
under the “Live Data” tab, Fig. 14. The screen is split in two sections, the top part shows the most
recent spectrum recorded, the lower part shows a time footprint of all the plots that have been
recorded since the last file writeout. This is also an indicator on the progress and how long it takes
until a new FITS file is going to be written out. On the bottom left there are two tabs with which
the viewed Channel can be selected.
3.5 Statistics
The statistics tab, Fig. 15, shows standard deviation, maximum, mean, median and minimum values
of the recorded spectra since the last file writeout. This means that once a new FITS file has been
written the statistics window is being reset. When the program is running, there will be a spectrum
close to 0 dB which shows the standard deviation, and below follows in order the maximum, the
median and the minimum spectra. Like in the “Live Data” tab the showed Channel can be selected
from the tabs on the lower left. The values from the statistics are not recorded into the FITS file.
The FITS file only contains the individual raw spectra.
15
Figure 13: Capture Setup tab.
16
Figure 14: Live Data tab.
17
Figure 15: Statistics tab.
18
3.6 FITS Header
On the FITS Header tab, shown in Fig. 16, most of the information is shown that is going to be
written in the FITS header of the output files. This is just to check that all values entered are
correct.
Figure 16: Fits Header tab.
19
4 Field Setup and Operation
The following gives a step by step instructions on how the system is commonly deployed in the field
for strong RFI survey purposes.
4.1 Field Setup
First thing on arriving at the site the truck needs to roll onto the stand for the pole the discone
antenna is going to be attached to. To give a rough overview what needs to be done for setting up
the system, here are the basic steps that should be followed:
1. Take the pull off the suspension of the pulling vehicle by extending the stand of the trailer.
2. Assemble the Big Blade antenna close to the spot it is going to stay at.
3. Assemble the Discone antenna and install it on the extendable pole.
4. Run cables to each of the antennas and attach to the pass-through connectors, do not attach
on the antenna side yet, that can be done later.
5. Take out the power generator and place it in front of the truck.
6. Ground the generator with the grounding stick and jumper cables.
7. Run the power cord from the generator to the trailer.
8. Setup Laptop inside and check the installed equipment in the rack for functionality.
9. Power on UPS and generator.
After these steps have been followed the whole setup should like similar to the one shown in
Fig. 17. The tools needed to perform these steps: hammer, Phillips screwdriver, lug wrench, and
an Allen wrench. These can all be found in the box labeled “Tools” together with all the screws and
parts that are needed.
Extend the stand of the trailer by using the winch, thus taking of the pull on the suspension of
the truck. Then open up the trailer take out all parts of the Big Blade antenna. Place the antenna
about 15-20 m away from the trailer and the road. Make sure it is also at least 10 m away from a
fence or other metal structure and at least 25-50 m away from any low voltage power line. Orient
the blades in the rough directions corresponding to the labels of the blades. One can use the GPS
electronic compass for help on the orientation. Then lay out the support beams according to their
labeling numbers going from 1 to 16. The numbers should go one time around in order. Then get
the faceplate and attach the first blade to it using the short screws. While one person is holding
the faceplate and the first blade up (the blade should have roughly 45 degree angle to the ground),
the other one attaches the beams/PVC pipe joint to the base of the blade through the holes and
screws. Then the next blade follows first adding it to the faceplate and then the PVC pipes to the
base going around until the whole antenna is assembled.
Next thing is the discone antenna. It is stored in its original packaging. Look for the central
piece, it is obvious once you found it. Then attach the thick long hollow beams that go off at an
angle using the right Allen wrench. Now attach the short metal rods that go off perpendicular to
the center piece, they just screw in. Screw on the top part. Now the antenna can be placed ontop
20
Figure 17: Typical field setup of the LPRM with the RFI trailer, generator in front of the truck,
discone antenna on the pole, and the Big Blade antenna to the left.
of the extendable post that fits into the base the truck has rolled onto with one tire. Place it there
and continue with the setup.
Now unroll cables to each of the two antennas, only attach the trailer side to the pass throughs.
Start unrolling at the antenna side with the SMA connector, then left over cable can be kept rolled
up and be placed ontop of the trailer. The cable is LMR240, thus a little sturdy, be careful to put
no bends into it. Three cable pass-throughs are located on the top left of the side door of the trailer.
They are labled with colored tape red or blue, corresponding to the color on your roll of cable. Blue
usually goes to the Big Blade antenna and red to the discone antenna, thus the wiring inside the
trailer does not need to be changed all the time.
Next unhook the power generator in the trailer and roll it out the back and then to the front
of the truck. If it needs to be refueled do so now. Then drive one of the grounding sticks of the
trailer into the ground and attach the jumper cables to it and the generator. Get the power cable,
attach one end to the power outlet to the outside of the trailer (front wedge close to the door) on
the generator side do not attach the power cable yet.
Setup all the equipment in the trailer. The Laptop should be setup on the table, the power cord
attached and two USB cable attached to it connecting the Spectrum Analyzer and the Receiver
Box. A cable each should run from the pass-throughs inside to the inputs of receiver box. The cable
that goes to the Big Blade antenna has a Bias-T attached to it before it reaches the receiver box.
Turn on the generator by opening the fuel valve, pulling out the choke and start it with the recoil
winch, do not forget to put the power switch into the ’on’ position. Once it is running stable push
the choke slider back into its normal position. Now the power is selected with the switch on the
control panel to 130 V, then the power breaker is turned on and the panel should show the right
voltage. Now the power cord to the trailer can be attached to the power outlet at the control panel.
Back at the trailer turn on the UPS and wait until after the self check to go in Line mode. Then
the rest of the equipment can be turned on. Do not forget to calibrate the spectrum analyzer as
described in section 2.4. Turn on the power supply, for powering the receiver box the power supply
should have 15 V set and draw a few milli amps.
21
4.2 Calibration with Noise Source
At this point do not forget to start filling out the log sheet. Fill in all the necessary information
about the site, weather conditions and other things that are unique and noteworthy. From now on
keep track of things your are doing, like every step of the calibration procedure, etc. and timestamp
it with a remark on the log sheet.
Before we start the data collection we need to calibrate and check the whole system. Start the
Labview recording software on the Laptop. Attach the Noise Source directly to the input of the
spectrum analyzer and record at least 20 spectra for each of the observed frequency ranges, 1100 MHz and 100-1000 MHz. Then attach the cable of the Big Blade antenna to the active balun
on the face plate using the torque wrench. Then attach a 50 Ohm load to one of the Inputs of the
two Inputs of the Balun that are going to be used. The Noise Source is attached to the other Input
of the Balun. Check inside the trailer that the balun draws the right amount of current (0.32 mA
at about 9 V). Then take the same number of spectra as before just for the lower frequency range.
Detach the Noise Source and the 50 Ohm load from the antenna and attach pig tails to the
blades connecting to the inputs of the Balun. Check the shape of the spectrum on the spectrum
analyzer and identify the strongest peak. The reference level should be set to about 5-10 dB above
the maximum peak for best accuracy. If the maximum level exceeds -10 dB attenuation should be
introduced between the Input of the Balun and the blades using Mini Circuits attenuators.
Now attach the Noise Source to the end of the cable to the discone antenna and record a spectrum
for the high frequency range. After this detach the Noise Source, attach the cable to the output of
the Discone antenna and extend the pole the discone antenna is mounted to. If winds are high or
expected to pick up make sure the connection at the discone antenna is tight and screw the cable
feed shaft to the center piece of the discone to make sure the cable does not get twisted.
4.3 Strong RFI Survey
We are ready to start recording the actual RFI spectra. Modify the settings of the software for
longer runs, saving about 50-150 spectra per file, depending on the length of the run (3 hours or 24
hours). Make sure the switching between channels works properly and the recorded spectra look as
expected.
For 24 hour runs at least once during the run the generator needs to be refueled. Write down in
the log when process has started, the system will continue running on battery power through the
UPS for a limited time, but interference caused by turning off/on the generator could be identified.
Then turn-off the generator by bringing the circuit breaker into off position, deselect the voltage
level and turn-off the power switch. Refuel the generator. Then make sure no gasoline spilled. Put
the power switch back into the “on” position, pull out the choke if necessary and pull the recoil.
The generator should be back up. Select the power level, turn on the circuit breaker.
Sometimes strong winds shake connectors loose, if you see outages in the recorded live spectra go
and check for loose connectors. If a thunderstorm looms use common sense, a lightning detector is
provided with the equipment. If a storm gets too close stop recording and detach every cable that
attaches to the inside and seek shelter in the trailer until the storm passes.
4.4 Packing Up
Packing up is pretty much a reversal of setting up everything. But there are a few things to watch
for that might keep things easier for the next time the system is setup.
22
Once data taking is done, copy all the files off the laptop onto a USB stick for backup. detach
the laptop and put it back into its case. Turn off all the equipment and the UPS. Then turn-off the
generator. Pull out the grounding stick and the jumper cable. The generator is the first piece that
has to be moved back into the trailer, because it needs to be put as close as possible to the truck
thus in the wedge of the trailer. Safely secure the generator from moving around in the trailer,
by using several bungee cords from moving around in the trailer. The equipment rack can help
with that. Then disassemble the discone antenna. Make sure that the headless screws of the center
piece are screwed in back tight, if they are loose or not screwed in at all after the beams have been
removed, they will fall out and get lost making it impossible to assemble it the next time in the
field without getting new parts. Then roll up all the cables and store them in the trailer. Finally
disassemble the Big Blade antenna by reversing the process used assembling it. There is no good
way to store the blades in the trailer. Usually two blades can slide under the generator and two fit
on the side of the door between generator and door. The PVC pipes just slide under the generator
and also fit to the side between two blades.
Before pulling out do not forget to pull up the stand of the trailer and do not forget to take the
stand for the pole of the discone antenna. Make sure all the trailer is locked once everything is
packed-up.
23