1
Section 5: Import data to other Applications
Why import to other applications
Measurement information by itself is sometimes confusing to analyze especially if you have a
lot of data. The MeterMate program automates the measurement process allowing you to
gather a lot of measurement data very quickly, or spread your measurements out over time to
do long term measurement sessions. Viewing your data graphically with a spreadsheet
program like Excel may sometimes give you further insights into your data.
With the addition of GPS capability, each measurement may be tagged with a GPS location,
This allows the data to be imported into popular mapping programs. Microsoft MapPoint is
one such program that allows direct import of data to create colored symbols that represent
different field strength values. This visual representation allows you to quickly identify weak
signal areas.
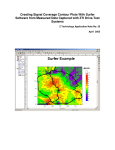
When enough data is collected, the data can be used to interpolate what a signal level would
be at a near by location inaccessible for measurement. There are a number of applications
that will do prediction of non measured areas based on results of measured areas. The result
is a contour map of lines or colors representing signal strength levels. “Surfer” by Golden
Software www.goldensoftware.com is one such commercial application. Another “3Dfields” by
Vladimir Galouchko www.3dfmaps.com is a shareware application.
Using the Excel import Wizard
Importing to Excel allows you to use an Excel Chart to view your data. One such handy
application of this is to view your data over time in graphic format. Below is an example of
data taken over time with the MeterMate application, then graphed with Excel.
•
Open Excel
•
Click the “File” menu then click “Open” this will open a file “Open” browse window
•
On the “Files of Type” box select “Text Files (*.prn; *.txt; *.csv)
MeterMate software User Manual
Page 5-1