1
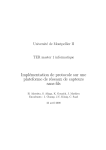
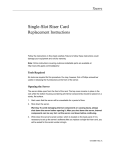
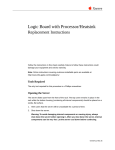
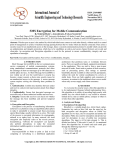
Iraq J. Electrical and Electronic Engineering ﺍﻟﻤﺠﻠﺔ ﺍﻟﻌﺮﺍﻗﻴﺔ ﻟﻠﻬﻨﺪﺳﺔ ﺍﻟﻜﻬﺮﺑﺎﺋﻴﺔ ﻭﺍﻻﻟﻜﺘﺮﻭﻧﻴﺔ Vol.7 No.2, 2011 2011 ,2 ﺍﻟﻌﺪﺩ,7ﻣﺠﻠﺪ ________________________________________________________________________________________________________________________ oc s e a o a Co e gy, o e a d Co o as a U e s y, as a , aq 30 o o ec 0 0 Building an HMI and Demo Application of WSN-based Industrial Control Systems Ali A. Abed1, AbdulAdhem A. Ali2 Nauman Aslam 1 Department of Electrical Engineering 2 Department of Computer Engineering University of Basra, IRAQ [email protected], [email protected] Abstract— In this paper we present the details of methodology pursued in implementation of an HMI and Demo Temperature Monitoring application for wireless sensor-based distributed control systems. The application of WSN for a temperature monitoring and control is composed of a number of sensor nodes (motes) with a networking capability that can be deployed for monitoring and control purposes. The temperature is measured in the real time by the sensor boards that sample and send the data to the monitoring computer through a base station or gateway. This paper proposes how such monitoring system can be setup emphasizing on the aspects of low cost, energy-efficient, easy ad-hoc installation and easy handling and maintenance. This paper focuses on the overall potential of wireless sensor nodes and networking in industrial applications. A specific case study is given for the measurement of temperature (with thermistor or thermocouple), humidity, light and the health of the WSN. The focus was not on these four types of measurements and analysis but rather on the design of a communication protocol and building of an HMI software for monitoring. So, a set of system design requirements are developed that covered the use of the wireless platforms, the design of sensor network, the capabilities for remote data access and management, the connection between the WSN and an HMI software designed with MATLAB. I. INTRODUCTION Recent advances in electronic miniaturization, software engineering and wireless communication technologies have enabled the deployment of low-power micro radio tiny sensor nodes often referred as “motes” that are equipped with an embedded processing unit, memory, data storage, powersupply, radio communication facilities . A network of motes, or Wireless Sensor Network (WSN), consists of a large number of interconnected sensor nodes that interact with the physical environment for collection and dissemination of data useful in areas where ordinary networks are unsuitable. Each mote carries different types of sensors suitable for a desired application. There are a large number of applications for WSNs such as: Industrial, environmental, fire-fighting, antitheft, habitat, agriculture, health-care, wind monitoring, air conditioning, HVAC Instrumentation and control and so on. The use of wireless network for monitoring will not only Department of Engineering Mathematics and Internetworking, Dalhousie University, Halifax, NS, Canada [email protected] reduce the overall monitoring system cost in terms of facilities setup and labor cost, but will also provide flexibility in terms of distance or location, scalability and reliability [1]. It is important to have a monitoring system with characteristics of autonomous, lower cost, reliable, scalable and flexible [2]. The use of automation in monitoring task will reduce the reliance on human power thus reducing the cost. As the monitoring is intended to be carried out in a remote area with limited access, signal or data from the sensor unit will then be transmitted wirelessly to the base station in the control room. Temperature monitoring represents a class of sensor network applications with potential benefits in many areas especially in industrial applications. It enables a long-term data collection at scales and resolutions that are difficult to obtain otherwise. The ability to communicate not only allows information and control to be communicated across the network of nodes, but nodes to cooperate in performing more complex tasks like sampling, data aggregation, system health and status monitoring and in different formats. Increased power efficiency gives applications flexibility in resolving some of design tradeoffs, e.g., between sampling rates and battery lifetimes. Low-power radios with well-designed communication protocol allows a generalized communication among the network nodes, rather than the point-to-point communication. The computing and networking capabilities allow sensor networks to be reprogrammed or re-tasked after deployment in the field. Nodes have the ability to adapt their operation over time in response to changes in the plant or the status of the sensor network itself. Also if a node is reset, it will rapidly re-synchronize and display the correct value after it reboots. This paper develops a specific industrial application in the domain of temperature monitoring. It presents a collection of requirements, constraints and guidelines that serve as a basis for a general WSN architecture for building a wireless DCS system. It describes the core components of the WSN, the hardware platforms, the interconnection topology, and the data management capabilities. There is some development in our work related to the communication protocol, use of TinyOS 107 Iraq J. Electrical and Electronic Engineering ﺍﻟﻤﺠﻠﺔ ﺍﻟﻌﺮﺍﻗﻴﺔ ﻟﻠﻬﻨﺪﺳﺔ ﺍﻟﻜﻬﺮﺑﺎﺋﻴﺔ ﻭﺍﻻﻟﻜﺘﺮﻭﻧﻴﺔ Vol.7 No.2, 2011 2011 ,2 ﺍﻟﻌﺪﺩ,7ﻣﺠﻠﺪ ________________________________________________________________________________________________________________________ components, server program, and the way for creating spreadsheet files. The development of a graphical user interface (GUI) for monitoring purposes at the host computer is another main component in the project. The GUI should be capable of displaying the physical quantities continuously in real time. Several measurements and performance analysis to evaluate the reliability, feasibility and effectiveness of the designed monitoring system are also presented. sensors are used for monitoring the health of the system. Also the onboard thermistor may be used as a cold-junction compensation for the thermocouple. As the industrial control application relies on precise measurement of temperature, we used type T thermocouples for this purpose. The MDA300CA then attached with an IRIS mote, which is programmed with an XMDA300_D application with id number equals to 1. The connection diagram is shown in Figure 2. In spite of the many works on the application of WSN in temperature monitoring [3][4][5], but they still not enough and not specified strictly to industrial applications. Also, all these works are not intended to lead to a complete temperature control system in which there should be inputs from sensor boards and outputs to actuators. In [3], all the physical quantities are inputs from different types of sensors. Hence, the project was not designed for industrial applications. All other works such as [4] [5] are related to temperature monitoring for environmental or non industrial applications. The rest of the paper is organized as follows: Section II is concerned to the building of the WSN with its demo applications and the hardware requirements. In section III, the software templates and tools needed for the work are discussed. Section IV deals with results gained from the testing of the prototype system to prove its performance. Section V summarizes the main conclusions and gives some recommendations for the extension of this work. NETWORK ARCHITECTURE AND COMMUNICATION PROTOCOL In this work, we used a hierarchical architecture consisting of sensor nodes, routers and a gateway station. Sensor nodes that are responsible for monitoring the physical environment (Temperature in our case) are placed at the lowest level of the hierarchy. Router nodes constitute the next level that collect the information from sensor node and send it to the gateway node via one or multiple hops. The architecture is illustrated in Figure 1. II. Figure2: Type T-Thermocouple Connected to MDA300 Sensor Board Another option is to use the AD595 thermocouple amplifier [7] for signal conditioning before connecting the thermocouple to one of the analog input channels of the MDA300CA data acquisition board. The second sensor board is the MDA100 which contains a precision thermistor, a light sensor, and a general prototyping area [8]. The prototyping area supports connection to all of the eight channels of the Mote’s analog to digital converter (ADC0-7). Hence, this sensor board may also be used for monitoring all the signals that are connected to the ADC0-7 channels. The health and status of this node are also monitored. After attachment of the MDA100 to an IRIS mote, the node is programmed with XMDA100 application with id number equals to 2. The node hardware is shown in Figure 3. Gateway RouterNode Thermocouple Sensor IRISmote IRISmote DataAcquisitionSystem MDA300CA DataAcquisitionboard MDA100 Thermistor Sensor Humidity Sensor light Sensor ADC07 Figure1: Distributed Controllers Connections and Communications The first sensor board is the MDA300CA data acquisition board which contains onboard sensors for temperature and humidity. Also, it has analog input channels that are used for thermocouple sensor input. For more details about MDA300CA refer to [6]. The temperature and humidity 108 Figure3: MDA100 Sensor Board Connected to IRIS mote As shown in Figure1 above, all the nodes of the hierarchical multi-hop mesh network should send the data wirelessly to a gateway (base station) which in turns is connected to a server and then to the HMI for the purpose of monitoring. In this paper, we used MIB520 Interface board attached with an IRIS mote, as shown in Figure 4, for the purpose of mote programming and as a gateway. It is a USB Iraq J. Electrical and Electronic Engineering ﺍﻟﻤﺠﻠﺔ ﺍﻟﻌﺮﺍﻗﻴﺔ ﻟﻠﻬﻨﺪﺳﺔ ﺍﻟﻜﻬﺮﺑﺎﺋﻴﺔ ﻭﺍﻻﻟﻜﺘﺮﻭﻧﻴﺔ Vol.7 No.2, 2011 2011 ,2 ﺍﻟﻌﺪﺩ,7ﻣﺠﻠﺪ ________________________________________________________________________________________________________________________ interface board that when attached with a mote it will collect data from the mesh network wirelessly and routes it through UART port to the server and vice versa as shown in Figure 1. As the gateway needs to continuously receiving data from the field devices, there is no sleep mode with that gateway and hence it is normally remains powered. It takes its power from the computer via the USB port. The gateway is programmed with XmeshBase application with id number equals to 0. • Microsoft Excel • MATLAB In this work, we used TinyOS 1.1.10 for the demo applications creation and Programmer’s Note for applications edition and motes programming. The average current consumption of the sensor motes should be calculated with PCSS to know the power performance and battery life time to prove the optimality of the sleep/wake up mode of the demo applications as will be explained in Section IV. A. After the installation of the complete WSN, the network should be tested for performance with Xsniffer program for link quality, motes positions, and network behavior as will be explained in Section IV. B. After that Xserve should be run. Xserve is a User Interface that serves as a server program which receives data from the WSN and displays the outputs in the Cygwin window. Xserve is included within Cygwin. For more information about Xserve program refer to its user guide [9]. In order to save or log data coming from the different sensor nodes in a csv file, write the following command in the Cygwin command window: $xserve –device=comx >different_Sensors.csv Figure4: MIB520 with attached IRIS mote to constitute the Gateway The sensor node defined as a router is responsible for routing data from other routers or end devices to the coordinator (base station) or to other routers closer to the coordinator. This has an advantage in industrial systems which is to avoid obstacles and hence keeps the transmission as a line-of-sight which saves power and keeps long transmission distances. Also the use of routers between the sensor nodes and the base station is expected to further increase the coverage distance as it may operate as a repeater. Care should be taking to program all the motes with the same frequency and group id. All the sensors are powered with two AA (3V) batteries. The hardware requirements summarized as in the Table 1. for this project Components The relationship among XMDA300_D, XMDA100, XmeshBase, Xserve, the logged csv file, MATLAB m-file, and the HMI is shown in Figure 5. HMI are Table 1: Hardware Requirements of the project No. Then all the required data will be saved automatically to the Excel csv file. MATLAB is used to build the HMI for the overall system. Hence, the m- file should be capable of reading the various data from the csv file via the csvread command and makes its own data structures in order to move these data to the main GUI window that designed with GUIDE tool for the purpose of monitoring. MATLABm(file QTY 1 A Computer with USB port 1 2 Crossbow MIB520 1 3 Crossbow IRIS Motes 4 4 Crossbow MDA300 Data Acquisition board 1 5 Crossbow MDA100 Data Acquisition board 1 6 Type-T Thermocouple 1 7 AD595 Thermocouple Amplifier 1 (csvreadcommand) csvfilecreatedby Xserve XServeprogram $Xserve–device=com4>different sensors.csv III. USING THE TEMPLATE The software requirements needed for this project are summarized as follows: • MoteWorks ver. 2.0F: MDA100+IRISmote programmedwith XMDA100 (TinyOS, Cygwin, Xserve, Xsniffer) • MIB520+IRISmoteprogrammedwithXMeshBase Power Calculator Spread Sheet PCSS. MDA300CA+IRISmote programmedwith XMDA300_D Figure5:SoftwareLayersoftheOverallSystem 109 Iraq J. Electrical and Electronic Engineering ﺍﻟﻤﺠﻠﺔ ﺍﻟﻌﺮﺍﻗﻴﺔ ﻟﻠﻬﻨﺪﺳﺔ ﺍﻟﻜﻬﺮﺑﺎﺋﻴﺔ ﻭﺍﻻﻟﻜﺘﺮﻭﻧﻴﺔ Vol.7 No.2, 2011 2011 ,2 ﺍﻟﻌﺪﺩ,7ﻣﺠﻠﺪ ________________________________________________________________________________________________________________________ IV. TESTING AND RESULTS Several preliminary measurements are carried out to evaluate the performance and effectiveness of our WSN and software for the monitoring purposes. A. Power Consumption Low power (LP) consumption is an important criterion in WSN to ensure their operation for a long time and with minimum maintenance. In the LP, motes are entered the sleep mode and wake up periodically. LP mesh is suitable for low bandwidth and high latency applications [10]. The power consumption measurement is done for the sensor nodes by using the “power calculator spreadsheet” to estimate average current consumption for our IRIS platforms. Each of the sensor nodes enter the sleep mode if there is no transmission and after a 100ms it wakes up for transmission to the base station. Noting that the sample time of the system is controllable and can be changed wirelessly. B. Monitoring Network Health and Performance There are two types of health packets that are useful in estimating the performance of the network with time: Neighbor health and Statistics health [10]. • Neighbor health is useful for estimating the overall connectivity graph of the network with time and identifying nodes that are not well connected to their neighbors. • Statistics health is useful in estimating important network performance parameters such as the end-to-end message reliability and network throughput. In this work we used the Xsniffer tool to monitor the behavior of the network and hence proving our network performance. Xsniffer displays all radio messages overheard within its radio range. The following are proved with Xsniffer: _ See if our motes have joined the network. _ Monitoring the motes radio packets. _ Monitoring the downstream packets. _ Monitoring the messages retries. _ Monitoring the route update and time synchronization messages. _ Received Signal Strength for link quality indication RSSI Optimal node placement is also part of network deployment. In industrial applications, the node placement is an important thing because generally the field is not open to do a line-of-sight transmission besides the nearly long distance between the site and the control room. Sensor nodes placement depends on the actual location of points to be sensed in the plant. So, the big effort that must be done is to determine the location and number of remaining router nodes to form the multi-hop network. In this work we also used the Xsniffer tool for monitoring radio activity of our deployed nodes. We depended essentially on the RSSI to choose the optimal mote positions. So the result gained is a mesh network with good stability and efficiency. All these measurements led to a WSN with a suitable and acceptable performance. 110 C. Human Machine Interface (HMI) The GUI platform is successfully developed using MATLAB GUIDE tool with an m-file that is able to read data from the csv file created by the Xserve. The data is then monitored on the main graphical display as shown in Figure6. The temperature, humidity, and light are displayed graphically as plots and as numeric values. All other input channels are displayed as numeric values. These input channels may be used for any other types of sensors or an extra number of thermocouples. Figure6: HMI main window V. CONCLUSIONS AND FUTURE WORK In this paper, an implementation of a prototype WSN for temperature monitoring system which offers a low power consumption with good reliability, scalability and flexibility is presented. This WSN is suitable for activities in industrial applications that provide a large area of monitoring which depend on the number of nodes in the mesh network i.e. the network size. Another feature for our system is the easy installation of the overall system and the monitoring task can be done by any operator with a minimal training at the beginning of installation. The temperature system presented here is a monitoring only i.e. only inputs from different sensors are sampled and sent to the HMI of the system for monitoring. Hence, we recommend to do outputs from the HMI to the sensors in order to do not only monitoring but also a control activities. This will lead to a complete temperature control system. Indeed, this is the activity that we will proceed in the near future in order to reach the goal point which is the design of a wireless DCS system. There are some output functions that may be used to send output to the sensor board. Hence, the XMDAs’ applications should be further modified to add these output functions. VI. ACKNOWLEDGEMENT This work is done in collaboration with faculty of Engineering-Dalhousie University-Canada as a part of an ongoing bigger project for designing a wireless DCS (Distributed Control System) in Basra University-IRAQ. Hence, the authors would like to thank Dalhousie University for providing this opportunity to do this work. Iraq J. Electrical and Electronic Engineering ﺍﻟﻤﺠﻠﺔ ﺍﻟﻌﺮﺍﻗﻴﺔ ﻟﻠﻬﻨﺪﺳﺔ ﺍﻟﻜﻬﺮﺑﺎﺋﻴﺔ ﻭﺍﻻﻟﻜﺘﺮﻭﻧﻴﺔ Vol.7 No.2, 2011 2011 ,2 ﺍﻟﻌﺪﺩ,7ﻣﺠﻠﺪ ________________________________________________________________________________________________________________________ REFERENCES [1] P. Wright, D. Dornfeld, and N. Ota,” Condition Monitoring in End-milling Using Wireless Sensor Networks (WSNs)”, Transactions of NAMRI/SME Vol:36, 2008. [2] Z. Rasin and M.R. Abdullah,” Water Quality Monitoring System Using Zigbee Based Wireless Sensor Network”, IJET Vol:9 No:10. [3] Jose A. B. Maciel, “Wireless Sensor Networks: Development of an Environment data acquisition Prototype System and Graphical User Interface”, A Master thesis presented to the faculty of California Polytechnic State University, November 2006. [4]T. Ahonen, et al.,” Greenhouse Monitoring With Wireless Sensor Network”, department of computer science, university of Vaasa, Finland. [5] L. B. Tik, et al.,” Monitoring of an Aeroponic Greenhouse with a Sensor Network”, IJCSNS, Vol:9, No:3, 2009. [6] “MDA300CA Sensor board user’s manual” , Crossbow Technology, Inc., 2007 www.xbow.com [7] “Monolithic Thermocouple Amplifier with Cold Junction Compensation”, Analog Devices, www.digikey.com [8] “MDA100 Sensor board user’s manual” , Crossbow Technology, Inc., 2007 www.xbow.com [9] “Xserve user’s Manual”, Crossbow Technology, Inc., 2007 www.xbow.com [10] G. Baleri, “Guidelines for WSN design and Development”, Crossbow Technology, Inc., www.xbow.com 111