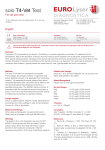
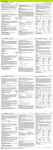
1
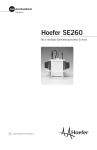
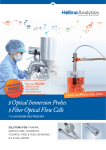
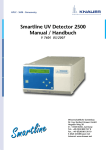
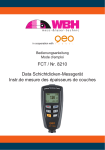
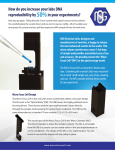
High Precision in Spectro-Optics HANDHABUNGSHINWEISE/USER MANUAL TrayCell DIE FASEROPTISCHE ULTRA-MIKRO-MESSZELLE FÜR DIE UV/VIS-ANALYSE THE FIBER-OPTIC ULTRA-MICRO CELL FOR UV-VIS ANALYSIS www.hellma-analytics.com INHALT 2 Contents 1. Produktbeschreibung ............................. SEITE 4 1. Product description ................................ PAGE 5 2. Lieferumfang........................................... SEITE 6 2. Product contents .................................... PAGE 6 3. Produkteigenschaften ............................ SEITE 8 3. Product features ..................................... PAGE 9 4. Sicherheitshinweise ............................... SEITE 10 4. Safety information .................................. PAGE 11 5. Funktionsweise ....................................... SEITE 12 5. Operation ................................................. PAGE 13 6. Messbereich ............................................ SEITE 16 6. Measuring process ................................. PAGE 17 7. Anwendungen ......................................... SEITE 24 7. Applications ............................................. PAGE 25 8. Reinigung und Pflege ............................. SEITE 26 8. Cleaning and maintenance .................... PAGE 27 9. Materialbeständigkeit der TrayCell ...... SEITE 28 9. Stability of TrayCell materials ................ PAGE 29 10. Transport und Lagerung ........................ SEITE 30 10. Transportation and storage ................... PAGE 31 11. Technische Daten ................................... SEITE 30 11. Technical specifications ......................... PAGE 31 12. Technische Daten: Deckel ..................... SEITE 32 12. Technical specifications: Cap................. PAGE 33 13. FAQ ........................................................... SEITE 34 13. FAQs ......................................................... PAGE 36 3 1. PRODUKTBESCHREIBUNG Hightech auf kleinstem Raum – mit patentiertem Funktionsprinzip Die TrayCell besteht aus einer faseroptischen Messzelle und einem Deckel mit integriertem Spiegel. Ein Tropfen (0,7 µl – 10 µl) der Probe wird auf das Messfenster pipettiert und anschließend wird der Deckel aufgesetzt. Der genau definierte Abstand zwischen dem Messfenster und dem Spiegel im Deckel sorgt für eine präzise und gleichbleibende Deckel Spiegel Probenflüssigkeit Messfenster optische Schichtdicke. Ein Verstellen der Schichtdicke ist damit nicht möglich und aufwendige Kalibrierungen und Nachjustierungen sind überflüssig. Das Licht wird über Prismen und faseroptische Lichtleiter durch die Probe geführt, am Spiegel reflektiert und über die Lichtleiter wieder aus der TrayCell heraus zum Detektor geführt. Deckel Spiegel Schichtdicke Fenster Faseroptische Lichtleiter Strahlungsquelle 4 Prismen Lichtstrahl Detektor 1. Product description High tech, tiny footprint, patented operating principle The TrayCell comprises a fiber-optic measuring cell and a cap with an integrated mirror. A small drop (0.7 µl – 10 µl) of sample is pipetted onto the window and the cap is then placed on top. The precisely defined spacing between the window and the mirror inside the cap ensures that the optical path length is accurate and remains constant. It is therefore impossible for the path length to change, rendering costly calibrations and readjustments unnecessary. Light is guided through the sample via prisms and fiber-optic waveguides, reflected in the mirror and then guided back out of the TrayCell to the detector via the waveguides. Cap Mirror Sample Window Cap Mirror Light Path Window Optical fiber Prisms Source Light beam Detector 5 2. A B C D E F G A B C D E F G LIEFERUMFANG Delivery content 1 × TrayCell mit 8,5 mm Zentrumshöhe (Typ: 105.800-UVS oder 105.810-UVS) 1 × Deckel mit 0,2 mm Schichtdicke (Faktor 50)*, Artikel-Nr. 665-704-0.2-40 1 × Deckel mit 1,0 mm Schichtdicke (Faktor 10)*, Artikel-Nr. 665-703-1-40 1 × Adapter für 15 mm Zentrumshöhe 1 × Adapter für 20 mm Zentrumshöhe 1 × Schraubendreher für Zentrumshöhen-Adapter 1 × Aufbewahrungsbox Optional erhältliches Zubehör 1 x Deckel mit 0,1 mm Schichtdicke (Faktor 100)*, Artikel-Nr. 665-706-0.1-40 1 x Deckel mit 2,0 mm Schichtdicke (Faktor 5)*, Artikel-Nr. 665-705-2-40 1 x TrayCell with 8.5 mm center height, type: 105.800-UVS or 105.810-UVS 1 x cap with 0.2 mm path length (factor 50)*, Article-No. 665-704-0.2-40 1 x cap with 1.0 mm path length (factor 10)*, Article-No. 665-703-1-40 1 x adapter for 15 mm center height 1 x adapter for 20 mm center height 1 x screwdriver for center height adapter 1 x storage box Optional Accessories 1 x cap with 0.1 mm path length (factor 100)*, Article-No. 665-706-0.1-40 1 x cap with 2.0 mm path length (factor 5)*, Article-No. 665-705-2-40 6 * bezogen auf 10 mm Schichtdicke * based on 10 mm path length G A E C D F B 3. PRODUKTEIGENSCHAFTEN Fest definierte präzise Schichtdicken kein Verstellen möglich Schichtdicken in der Standardlieferung: 1,0 mm und 0,2 mm Zusätzliche Schichtdicken: 2,0 mm und 0,1 mm (optional erhältlich) Sehr kleines Probenvolumen: 0,7 µl – 10 µl Großer Messbereich von ca. 6 – 8.500 ng/µl (dsDNA)* und ca. 0,1 – 100 mg/ml (Protein)* Kein Verdünnen der Probe erforderlich Keine Verdampfung der Probe dank Deckel Rückgewinnung von Proben durch einfaches Abpipettieren Exzellente Reproduzierbarkeit Schnelle und leichte Reinigung Hohe Flexibilität Geeignet für alle gängigen Spektralfotometer mit Standard-Küvettenschacht Verwendungsbeispiele: Reinheits- und Konzentrationsbestimmung von Proteinen (Direktmessung oder chromatografische Assays) Reinheits- und Konzentrationsbestimmung von DNA/RNA Bestimmung der Labeling-Effizienz für MicroarrayExperimente Sämtliche spektralfotometrischen Mikrovolumenmessungen (0,7 µl – 10 µl) im UV/Vis-Bereich von 190 nm bis 1.100 nm 8 * abhängig vom verwendeten Spektralfotometer und der Art der Probe (siehe Beispiele Kapitel 6. Messbereich) 3. Product features Strictly defined, precise path lengths misadjustment impossible Path lengths in standard model: 1.0 mm and 0.2 mm Additional path lengths: 2.0 mm and 0.1 mm (optional) Extremely small sample volumes: 0.7 µl – 10 µl Large measuring range from approx. 6 – 8,500 ng/µl (dsDNA)* and approx. 0.1 – 100 mg/ml (protein)* No need to dilute samples Cap prevents evaporation of samples Easy recovery of samples by pipetting Excellent reproducibility Quick and easy to clean Highly flexible Suitable for all current spectrophotometers Examples for use: Determining the purity and concentration of proteins (direct measurement or using colorimetric assay) Determining the purity and concentration of DNA/RNA Determining labeling efficiency for microarray experiments All microvolume, spectrophotometric measurements (0.7 µl – 10 µl) in the UV-Vis range from 190 nm to 1,100 nm 9 * depending on the spectrophotometer used and the sample type (see example in chapter 6. Measuring range) 4. SICHERHEITSHINWEISE Die TrayCell ist ausschließlich für den Einsatz in Spektralfotometern bestimmt, z. B. zur Konzentrationsbestimmung von Analyten in Flüssigkeiten. Der Strahlengang des Spektralfotometers wird innerhalb der TrayCell so umgeleitet, dass der von der Lichtquelle kommende Strahl nach oben entweichen kann, wenn der Deckel mit dem Spiegel auf die TrayCell nicht aufgesetzt ist. Stellen Sie vor Beginn jeder Messung sicher, dass sich der Deckel mit dem Spiegel auf der TrayCell befindet. Die TrayCell darf nicht bei Temperaturen unter 4 °C und über 50 °C gelagert werden. Bei der Verwendung aggressiver Reinigungs- und Desinfektionsmittel besteht Korrosionsgefahr. Verwenden Sie keine korrosiven Reinigungsmittel, aggressiven Lösungsmittel oder abrasiven Polituren. Die TrayCell besteht aus Quarzglas- und Metallkomponenten und ist daher mit Vorsicht zu behandeln. Legen Sie die TrayCell nach Gebrauch in die Aufbewahrungsbox zurück und schließen Sie diese. Die TrayCell kann in aufrechter Lage leicht umkippen, was eine Beschädigung zur Folge haben kann. Legen Sie daher die TrayCell immer auf einer fusselfreien Unterlage oder in der Aufbewahrungsbox ab. 10 4. Safety information The TrayCell is solely intended for use in spectrophotometers, e.g. for determining the concentration of analytes in liquids. The light path of the spectrophotometer is diverted within the TrayCell such that the beam emanating from the light source is able to escape upwards if the mirrored cap is not positioned on the TrayCell. Before each measurement, ensure that the mirrored cap is in place on the TrayCell. The TrayCell may not be stored at temperatures below 4°C or above 50°C. There is a risk of corrosion if aggressive cleaning products and disinfectants are used. Do not use corrosive cleaning agents, aggressive solvents or abrasive polishes. The TrayCell consists of quartz glass and metal components, and must therefore be handled with care. After use, return the TrayCell to the storage box and ensure that this is closed. Do not put the TrayCell down in an upright position. If it tips over, the quartz glass optical head may break. 11 5. FUNKTIONSWEISE Die TrayCell ist eine faseroptische Mikrovolumen-Messzelle und wurde für die UV/Vis-Analyse von Proteinen und DNA/ RNA entwickelt. Die Abmessungen der TrayCell entsprechen denen einer Standardküvette, sodass sie in den meisten Spektralfotometern verwendet werden kann. Überprüfen Sie zunächst die erforderliche Zentrumshöhe Ihres Spektralfotometers und stellen Sie sicher, dass die TrayCell auf die richtige Zentrumshöhe eingestellt ist. Die TrayCell wird mit einer Zentrumshöhe von 8,5 mm ausgeliefert. Falls die Zentrumshöhe korrigiert werden muss, verwenden Sie bitte den entsprechenden Adapter. Dieser wird mit den passenden Schrauben geliefert. Schrauben Sie den Adapter von unten in die dafür vorgesehenen Bohrungen der TrayCell. 12 Setzen Sie die TrayCell mit dem Fenster in Richtung Strahlengang in den Küvettenschacht ein. Wir empfehlen, das Hellma-Logo nach vorne zu richten. Setzen Sie die TrayCell immer in der gleichen Richtung ein. Die Bestleistung der TrayCell wird erreicht, wenn der Lichtstrahl, der die Messkammer passiert, einen Durchmesser von weniger als 4 mm hat. Für die Messung muss die TrayCell richtig in den Küvettenschacht eingesetzt sein. Anschließend sollte die TrayCell für alle im Rahmen einer Messreihe durchgeführten Probenmessungen und Reinigungsschritte in dem Küvettenschacht verbleiben. Sämtliche Positionsänderungen der TrayCell während einer Messreihe (entfernen und wiedereinsetzen) sind zu vermeiden. 5. Operation The TrayCell is a fiber-optic, microvolume measuring cell and was developed for the UV-Vis analysis of proteins and DNA/RNA. To enable its use in a majority of spectrophotometers, the TrayCell’s dimensions are the same as those of a standard cuvette. First check the center height required for your spectrophotometer and ensure that the TrayCell is set to the correct center height. The TrayCell is supplied with a center height of 8.5 mm. If you need to adjust the center height, please use the relevant adapter. This is supplied with appropriate screws. Screw the adapter into the pre-drilled holes on the TrayCell from below. Position the TrayCell in the cuvette holder with the window facing in the direction of the light path. We recommend placing the Hellma logo at the front. Always insert the TrayCell in the same direction. Maximum TrayCell performance is achieved when the light beam that passes through the measuring chamber has a diameter below 4 mm. The TrayCell must be correctly inserted into the cuvette holder for measurements to be performed. It should then remain in the cuvette holder for the duration of all sample measurements and cleaning processes carried out within a measurement series. The TrayCell should not be moved at all (removed and re-inserted) during a series of measurements. 13 5. FUNKTIONSWEISE Bitte beachten Sie, dass die leere TrayCell eine Absorption von etwa 1 hat. Um diese charakteristische Absorption zu korrigieren, führen Sie eine Referenzmessung ohne Probe durch. Anschließend können Sie die Messung mit Probe starten. Bitte beachten Sie, dass der Deckel richtig auf die TrayCell aufgesetzt werden muss, bevor Sie eine Messung starten! Bei Bedarf kann die Probe nach der Messung wieder abpipettiert werden. Reinigen Sie anschließend das Messfenster und den Spiegel im Deckel. A TrayCell in den Küvettenhalter des Spektralphotometers stellen. 14 B Probe auf das Messfenster pipettieren. C Deckel aufsetzen. Messung starten. D Deckel abnehmen und Probe evtl. rückgewinnen. E Messfenster und Deckel reinigen (TrayCell verbleibt im Spektralfotometer). F Neue Probe pipettieren. 5. Operation Please note that the empty TrayCell has an absorbance of around 1. To correct this characteristic absorbance, first carry out a reference measurement without the sample. You can then start taking measurements with the sample. Please note that the cap must be correctly positioned on the TrayCell before you start measuring! If necessary, the sample can be recovered by pipetting once the measurements are complete. Finally, clean the window and the mirror inside the cap. A Insert TrayCell into cuvette holder of the spectrophotometer. B Pipette sample onto window. C Position cap. Start measurement. D Remove cap and recover sample if necessary. E Clean window and cap (TrayCell remains in spectrophotometer). F Pipette new sample. 15 6. MESSBEREICH Durch die Verwendung verschiedener Deckel und damit Schichtdicken ist es meist nicht mehr nötig, die Probe zu verdünnen. Dadurch kann der Konzentrationsbereich stark vergrößert werden. Anwendungsbeispiel: Quantifizierung von Nukleinsäuren Um den Gehalt von Nukleinsäuren in einer Lösung zu bestimmen, wird der Absorptionswert der Lösung bei 260 nm (A260) verwendet. Es wird folgende aus dem Lambert-Beerschen Gesetz abgeleitete Berechnung angewendet: Konzentration [ng/µl] = Absorption (260 nm) x probenspezifischer Faktor x virtueller Verdünnungsfaktor Der probenspezifische Faktor gibt die spezifische Absorption eines Stoffes bzw. Moleküls bei einer bestimmten Wellenlänge an. So weist z. B. dsDNA mit einer Konzentration von 50 ng/µl bei 260 nm eine spezifische Absorption von 1 bei einer Schichtdicke von 10 mm auf. Aufgrund der unterschiedlichen Schichtdicken bei der TrayCell muss zusätzlich der virtuelle Verdünnungsfaktor berücksichtigt werden. Dieser ist für jeden Deckel als Faktor angegeben. (Siehe gelistete Werte je nach Schichtdicke auf der nächsten Seite) 16 6. Measuring range By employing a variety of caps, and thus path lengths, the necessity to dilute samples is significantly reduced, which allows the concentration range to be significantly increased as a result. Example of use: Nucleic acid quantitation A solution’s ratio of absorbance at 260 nm (A260) is used to determine its nucleic acid content. The following calculation derived from the Beer-Lambert law is used here: Concentration [ng/µl] = absorbance (260 nm) x sample-specific factor x virtual dilution factor The sample-specific factor indicates the specific absorbance of a material or molecule at a certain wavelength. For example, dsDNA with a concentration of 50 ng/µl at 260 nm exhibits a specific absorbance of 1 at a path length of 10 mm. Owing to the varying path lengths possible in the TrayCell, the virtual dilution factor must also be taken into account. This is given as a factor for each cap. (See listed values for each path length on the next page) 17 6. MESSBEREICH Für unterschiedliche Nukleinsäureproben ergibt sich für Absorptionsmessungen bei einer Wellenlänge von 260 nm der mittlere dynamische Bereich der Konzentration in Abhängigkeit von der optischen Schichtdicke und den Absorptionsgrenzwerten von 0,025 – 1,7 wie folgt: NUKLEINSÄUREN PROBEN-SPEZIFISCHER 2,0 mm Deckel FAKTOR** (Faktor 5) [ng/µl] * 1,0 mm Deckel 0,2 mm Deckel (Faktor 10) [ng/µl] * (Faktor 50) [ng/µl] * 0,1 mm Deckel (Faktor 100) [ng/µl] * dsDNA 50 6 – 425 13 – 850 63 – 4250 125 – 8500 6 – 8500 ssDNA 37 5 – 315 9 – 629 46 – 3145 93 – 6290 5 – 6290 RNA 40 5 – 340 10 – 680 50 – 3400 100 – 6800 5 – 6800 Oligo 30 4 – 281 8 – 561 41 – 2805 83 – 5610 4 – 5610 * typische, mit einem durchschnittlichen Spektralfotometer messbare Konzentrationswerte ** probenspezifischer Faktor bei Nukleinsäureproben = Konzentration (ng/µl) bei einer Absorption von 1 Erforderliche Probenmenge 18 Gesamt-Messbereich [ng/µl] * 6 – 10 µl 3 – 5 µl 0,7 – 4 µl 0,7 – 3 µl 6. Measuring range Absorption measurements at a wavelength of 260 nm on different nucleic acid samples show the mean dynamic range of concentration as a factor of the optical path length and the absorption thresholds of 0.025 – 1.7 as follows: NUCLEIC ACIDS SAMPLE-SPECIFIC FACTOR** 2.0 mm cap (factor 5) [ng/µl]* 1.0 mm cap (factor 10) [ng/µl]* 0.2 mm cap (factor 50) [ng/µl]* 0.1 mm cap (factor 100) [ng/µl]* Total measuring range [ng/µl]* dsDNA 50 6 – 425 13 – 850 63 – 4250 125 – 8500 6 – 8500 ssDNA 37 5 – 315 9 – 629 46 – 3145 93 – 6290 5 – 6290 ssRNA 40 5 – 340 10 – 680 50 – 3400 100 – 6800 5 – 6800 Oligomers 30 4 – 255 8 – 510 38 – 2550 75 – 5100 4 – 5100 0.7 – 4 µl 0.7 – 3 µl * typical concentration values that can be measured using an average spectrophotometer ** sample-specific factor of nucleic acid samples = concentration (ng/µl) at an absorbance of 1 Sample quantity required 6 – 10 µl 3 – 5 µl 19 6. MESSBEREICH Anwendungsbeispiel: Quantifizierung von Proteinen Um den Gehalt von Proteinen in einer Lösung zu bestimmen, wird häufig der Absorptionswert der Lösung bei 280 nm (A280) verwendet. Alternativ können Proteine auch über die Absorption bei 230 nm oder über chromatografische Assays gemessen werden. Folgende aus dem Lambert-Beerschen Gesetz abgeleitete Berechnung wird für die Direktmessung bei 280 nm angewendet: Konzentration [mg/ml] = 1 × Absorption (280 nm) × Verdünnungsfaktor Probenspezifischer Faktor Der probenspezifische Faktor gibt die spezifische Absorption eines Proteins bei einer bestimmten Wellenlänge an. So weist z. B. BSA (bovine serum albumin) mit einer Konzentration von 1 mg/ml bei 280 nm und einer Schichtdicke von 10 mm eine spezifische Absorption von 0,64 auf. Aufgrund der unterschiedlichen Schichtdicken bei der TrayCell muss zusätzlich der virtuelle Verdünnungsfaktor berücksichtigt werden. Dieser ist für jeden Deckel als Faktor angegeben. (Siehe gelistete Werte je nach Schichtdicke auf der nächsten Seite) 20 6. Measuring range Example of use: Protein quantitation A solution’s absorbance at 280 nm (A280) is often used to determine its protein content. Alternatively, proteins can also be measured through absorbance at 230 nm or in colorimetric assays. The following calculation derived from the BeerLambert law is used to perform direct measurements at 280 nm: Concentration [mg/ml] = 1 × absorbance (280 nm) × dilution factor sample specific factor The sample-specific factor indicates the specific absorbance of a protein at a certain wavelength. For example, BSA (bovine serum albumin) with a concentration of 1 mg/ml at 280 nm and a path length of 10 mm exhibits a specific absorbance of 0.64. Owing to the varying path lengths possible in the TrayCell, the virtual dilution factor must also be taken into account. This is given as a factor for each cap. (See listed values for each path length on the next page) 21 6. MESSBEREICH Für unterschiedliche Proteinproben ergibt sich für Absorptionsmessungen bei 280 nm der mittlere dynamische Bereich der Konzentration in Abhängigkeit von der optischen Schichtdicke und den Absorptionsgrenzwerten 0,025 – 1,0 wie folgt: PROTEINE PROBEN-SPEZIFISCHER 2,0 mm Deckel 1,0 mm Deckel 0,2 mm Deckel FAKTOR** (Faktor 5) [mg/ml] * (Faktor 10) [mg/ml] * (Faktor 50) [mg/ml] * 0,1 mm Deckel Gesamt-Messbereich (Faktor 100) [mg/ml] * [mg/ml]* BSA (bovine serum albumin) 0,64 0,2 – 7,8 0,4 – 15,6 2,0 – 78 3,9 – 156 0,2 – 156 IgG (bovine gamma globuline) 1,4 0,1 – 3,6 0,2 – 7,1 0,9 – 36 1,8 – 71 0,1 – 71 Lysozym 2,64 0,05 – 1,9 0,1 – 3,8 0,5 – 19 0,9 – 38 0,05 – 38 * typische, mit einem durchschnittlichen Spektralfotometer messbare Konzentrationswerte ** probenspezifischer Faktor bei Proteinproben = Absorption (A280) bei einer Konzentration von 1 mg/ml Erforderliche Probenmenge 22 6 – 10 µl 3 – 5 µl 0,7 – 4 µl 0,7 – 3 µl 6. Measuring range Absorption measurements at 280 nm on different protein samples show the mean dynamic range of concentration as a factor of the optical path length and the absorption thresholds of 0.025 – 1.0 as follows: PROTEINS SAMPLE-SPECIFIC FACTOR** 0.2 mm cap 2.0 mm cap 1.0 mm cap (factor 5) [mg/ml]* (factor 10) [mg/ml]* (factor 50) [mg/ml]* 0.1 mm cap (factor 100) [mg/ml]* Total measuring range [mg/ml]* BSA (bovine serum albumin) 0.64 0.2 – 7.8 0.4 – 15.6 2.0 – 78 3.9 – 156 0.2 – 156 IgG (bovine gamma globulin) 1.4 0.1 – 3.6 0.2 – 7.1 0.9 – 36 1.8 – 71 0.1 – 71 Lysozyme 2.64 0.05 – 1.9 0.1 – 3.8 0.5 – 19 0.9 – 38 0.05 – 38 0,7 – 4 µl 0,7 – 3 µl * typical concentration values that can be measured using an average spectrophotometer ** sample-specific factor of protein samples = absorbance (A280) at a concentration of 1 mg/ml Sample quantity required 6 – 10 µl 3 – 5 µl 23 7. ANWENDUNGEN TrayCell-Applikationen Auf unserer Website www.hellma.analytics.com finden Sie über folgenden Link: www.hellma-analytics.com/app Applikationsberichte, welche die Vorteile des Einsatzes der TrayCell mit Spektralfotometern beschreiben. Photometrisc he Analyse im Durch eine integrierte Strahlumlenkung und die Verwendung von faseroptischen ischen Lichtleitern ist es möglich, die Probe direkt auf die Oberfläche des Messfensters aufzubringen. ingen. Das verschließende Element („Deckel“) sorgt für eine definierte optische Schichtdicke von 1 mm. Der Deckel kann arretiert werden und hat Öffnungen, um einen Druckaufbau bau beim Schließen zu verhindern. Spektrenscan In einem Beispiel wurden Spektren von DNA in verschiedener Konzentration aufgenommen. genommen. Die Referenzmessung wurde mit Wasser durchgeführt. Folgende Parametereinstellungen instellungen wurden verwendet: Anzeige Absorption Korrektur Referenz Lampenwechsel 320 nm Spalt 4 nm Messmodus Schrittbetrieb Schrittweite [nm] 1 Bereich [nm] Integrationszeit [s] Photometrische Analyse im Ultra-Mikroliterbereich Kennziffer: UV_ALL_05_05_d | 06 / 2005 | JN 200 – 350 0,1 2/4 Photometrische Analyse im Ultra-Mi kroliterbereich Kennziffer: UV_ALL _05_05_d | 06 / 2005 | JN 24 Ultra - Mikrolite rbereich Allgemeines Durch den Einsa tz der faseroptisch en Ultra-Micro Photometer SPEC Messzelle TrayC ORD und SPEK ell von Hellma OL der Analy in die Bestimmungen tik Jena AG mit sehr gering können photo en Probevolum metrische Beispiel die Reinh ina durchgefüh eit sowie die Konze rt werden. So können zum ntration von DNA bestimmt werde und RNA in nur n. Die Analytik wenigen Mikro von Proteinen ebenfalls im litern (A280, Bradford, Mikroliterbereich Lowry , Biuret, u.s.w. durchführbar. Eigenschaften ) ist Die hervorragen der SPEKOL den photometris und SPECORD chen einen sehr große -Serie bieten in n Absorptionsbereic Verbindung mit h. der Traycell Umgang mit der Traycell Die Traycell wird mittels justierbaren Halter in das SPEKOL / SPEC ORD eingesetzt und optimal positioniert. Für Justierbarer Halter das SPECORD SPEKOL (links) kann mit entsprechendem und Halter die Zentru SPECORD (unten) mshöhe 15 mm oder 8,5 mm verwendet werde n. Das SPEK OL misst in einer Zentru mshöhe von 8,5 mm. Weder zum Befüll en noch zur Reinig ung muss die dem Photometer Messzelle aus genommen werde n. Das garan durchgängig gleich tiert eine e Positionierung der Apertur im damit keine Messw Messstrahl und ert-Abweichungen im Vergleich Messung. Nach zur ReferenzAbnehmen des Deckels wird die Substanz auf die zu untersuchen Oberseite der de Messzelle pipett wird wieder aufge iert. 3 bis 5 µl Probe genüg setzt und die Probe vermessen. en! Der Decke Trockenreiben l Die Reinigung mit weichen Tüche erfolgt einfach rn oder Tupfe Reinigungs- oder durch rn und, nach Bedarf, Lösungsmitteln. mit den üblich en 1/4 7. Applications TrayCell applications On our website www.hellma.analytics.com you will find the following link to our application reports, which describe the advantages of the TrayCell for use in spectrophotometers: www.hellma-analytics.com/apps Photometric anal ysis s possible to Through the integrated beam deflection and the use of fibre-optic cables, it is g component measure the sample directly on the surface of the optical window. The closing s apertures to (“cap”) ensures a well-defined optical light path of 1 mm. It comes with openings prevent pressure build-up when being closed. Spectral scan In an example, spectra of DNA in different concentrations were measured. The reference measurement was performed with water. The following parameter settings were used: Display Absorbance Correction reference Slit [nm] 4 Lamp change at [nm] step mode Range [nm]: 200 – 350 Delta lambda [nm] 1 Integration time [s] 0.1 Photometric analysis in the ultra-microlitre range Index: UV_ALL_05_05_e | 06 / 2005 | JN The measuring cell does not need to be spectrophotomet removed from er for filling the or cleaning. continuously identi This guarantees cal positioning of the aperture and therefore in the light beam no variation in comparison measurement. to the refere After the cap is nce removed, the samp is directly pipett le to be measured ed onto the surfac e of the meas sufficient! When uring cell. Just the cap is replac 3 to 5 µl of samp ed the sample is simply rubbe le is can be measured. d dry with a soft For cleaning the tissue or a pad surface solvents as requir and using common ed. cleaning agent s or 320 Meas. mode in the ultra-mic rolitre range General Photometric meas urement of very small sample optic ultra micro volumes can be measuring cell performed with and the SPEC the fibreAnalytik Jena AG. ORD or SPEK OL spectropho For example, the tometers from purity as well as measures in using concentration of just a few micro DNA and RNA litres. The analy can be Biuret, etc.) can sis of proteins also be perfor (A280 , Bradford, Lowry med in the micro properties of the , litre range. The SPEKOL and outstanding photo SPECORD series metric cell, offer a very , in combinatio broad absorption n with the ultra range. microlitre Handling the ultra microlitre cell The ultra micro litre cell is place d in the SPEK SPECORD by OL / means of the adjus table holder and optimally positi Adjustable holder is oned. A centre height of 15 mm SPEKOL (left) mm can be used and or 8.5 SPECORD (below with the SPEC ORD with the ) holder. The SPEK relevant OL measures at a centre 8.5 mm. height of 2/4 Photometric analysis in the ultra-microlitre range Index: UV_ALL_05_0 5_e | 06 / 2005 | JN 1/4 25 8. REINIGUNG & PFLEGE Reinigen Sie die TrayCell immer mit einem fusselfreien Tuch oder Tupfer. Bei der Reinigung der TrayCell ist Folgendes zu beachten: Die TrayCell nicht in Wasser oder in Reinigungslösungen eintauchen Die TrayCell nicht in einem Ultraschallbad reinigen Keine abrasiven Reinigungsmittel verwenden Verwenden Sie zur Reinigung der TrayCell je nach Probe 60%iges Isopropanol, Ethanol oder Reinstwasser. Bei Bedarf kann die TrayCell mit dem Lösungsmittel sauber gewischt werden, welches zur Lösung der Probe verwendet wurde. Das Küvetten-Reinigungskonzentrat Hellmanex III eignet sich sehr gut für eine optimale Reinigung der TrayCell. Die TrayCell besteht aus Quarzglas- und Metallkomponenten und ist daher mit Vorsicht zu behandeln. Während die Quarzglaskomponenten sehr robust gegenüber Laborreinigungsmitteln sind, gilt es bei den Metallkomponenten darauf zu achten, keine ätzenden bzw. korrosiven Reinigungsmittel zu verwenden. Legen Sie die TrayCell nach Gebrauch und Reinigung wieder in die mitgelieferte Aufbewahrungsbox und schließen Sie diese. Hellmanex III Reinigungskonzentrat 26 8. Cleaning and maintenance Always clean the TrayCell with a lint-free cloth or swab. Please observe the following when cleaning the TrayCell: Do not immerse the TrayCell in water or cleaning solutions Do not clean the TrayCell in an ultrasonic cleaner Do not use abrasive cleaning agents Depending on the sample, use a 60% isopropanol solution, ethanol or ultrapure water to clean the TrayCell. If necessary, the TrayCell can be wiped clean with the solvent used to dissolve the sample. Hellmanex III cuvette cleaning concentrate is ideally suited for optimal TrayCell cleaning. The TrayCell consists of quartz glass and metal components, and must therefore be handled with care. While the quartz glass components are highly resistant to laboratory cleaning agents, attention must be paid to ensure that no caustic or corrosive cleaning agents are used on metal components. After use and cleaning, return the TrayCell to the storage box supplied and ensure that this is closed. Hellmanex III Cleaning concentrate 27 9. MATERIALBESTÄNDIGKEIT DER TRAYCELL Der Messkopf der TrayCell inklusive des Deckels ist bei Raumtemperatur beständig gegenüber vielen organischen Lösungsmitteln, Säuren bis pH ≥ 2 sowie Laugen bis pH ≤ 10. Für folgende Verbindungen ist eine chemische Beständigkeit des Messkopfes der TrayCell bei Raumtemperatur gegeben: Aceton (bis 5%) Acetonitril Benzol Toluol Phenol (bis 1%) Tetrachlorkohlenstoff Chloroform Dichlormethan Methanol Ethanol Butanol 28 n-Propanol Isopropanol Ether Hexan HEPES MES MOPS Salzhaltige Puffer, z. B. PBS, Citrat- oder Boratpuffer im Bereich pH 4 – 10 Säuren und Laugen in niedriger Konzentration! 9. Stability of TrayCell materials At room temperature, the TrayCell measuring head, including the cap, is resistant to many organic solvents, acids up to pH ≥ 2 and alkaline solutions up to pH ≤ 10. The TrayCell measuring head is resistant to the following chemical compounds at room temperature: Acetone (up to 5%) Acetonitrile Benzene Toluene Phenol (up to 1%) Carbon tetrachloride Chloroform Dichloromethane Methanol Ethanol Butanol n-Propanol Isopropyl alcohol Ethers Hexane HEPES MES MOPS Saline buffers, e.g. PBS, Citrate or borate buffer in a pH range from 4 – 10 Low (!) concentrations of acids and alkaline solutions 29 10. TRANSPORT & LAGERUNG Transportieren und lagern Sie die TrayCell nur in der mitgelieferten Aufbewahrungsbox. Lagern Sie die TrayCell nicht bei Temperaturen unter 4 °C bzw. über 50 °C. 11. TECHNISCHE DATEN TYP 105.800-UVS 105.810-UVS Artikel-Nr. 105800-A3-V1-46 105810-A3-V1-46 Material Fenster Quarzglas SUPRASIL® Quarzglas SUPRASIL® Breite/Tiefe 12,5 x 12,5 mm 12,5 x 12,5 mm Höhe * 68,5 mm (Zentrumshöhe 8,5 mm) 75 mm (Zentrumshöhe 15 mm) 80 mm (Zentrumshöhe 20 mm) 53 mm (Zentrumshöhe 8,5 mm) 59,5 mm (Zentrumshöhe 15 mm) 64,5 mm (Zentrumshöhe 20 mm) Volumen 0,7 – 10 µl 0,7 – 10 µl Schichtdicke 0,2 mm oder 1,0 mm (+/- 0,02 mm) 0,1 mm oder 2,0 mm (Optional) 0,2 mm oder 1,0 mm (+/- 0,02 mm) 0,1 mm oder 2,0 mm (Optional) Max. Temperatur 50 °C 50 °C Zentrumshöhe ** 8,5 mm; 15 mm oder 20 mm (andere Zentrumshöhen auf Anfrage) 8,5 mm; 15 mm oder 20 mm (andere Zentrumshöhen auf Anfrage) Lichtleiter fest eingebaut, nicht auswechselbar UV/Vis-solarisationsarm 190 nm – 1.100 nm (52,632 cm¯¹ – 9,100 cm¯¹) fest eingebaut, nicht auswechselbar UV/Vis-solarisationsarm 190 nm – 1.100 nm (52,632 cm¯¹ – 9,100 cm¯¹) * Die Auswahl der richtigen Höhe hängt von der Auslegung des Küvettenschachtes und der Bauart des Spektralfotometers ab. Die TrayCell sollte im Messschacht des Spektralfotometers gut erreichbar sein und der Deckel gut zu schließen sein. ** Die Zentrumshöhe kann durch die mitgelieferten Adaptern angepasst werden. Bei der Bestellung geben Sie bitte die notwendige Zentrumshöhe oder die Marke und das Modell des Spektralfotometers an. 30 10. Transport and Storage Only transport and store the TrayCell in the storage box supplied. Do not store the TrayCell at temperatures below 4°C or above 50°C. 11. Technical specifications TYPE 105.800-UVS 105.810-UVS Product No. 105800-A3-V1-46 105810-A3-V1-46 Window material Quartz SUPRASIL® Quartz SUPRASIL® Width x depth 12.5 x 12.5 mm 12.5 x 12.5 mm Height* 68.5 mm (center height 8.5 mm) 75 mm (center height 15 mm) 80 mm (center height 20 mm) 53 mm (center height 8.5 mm) 59.5 mm (center height 15 mm) 64.5 mm (center height 20 mm) Volumes 0,7 - 10 µl 0,7 - 10 µl Path length 0.2 mm or 1 mm (+/- 0.02 mm) 0.1 mm or 2 mm (Optional) 0.2 mm or 1 mm (+/- 0.02 mm) 0.1 mm or 2 mm (Optional) Max. temperature 50 °C 50 °C Center height** 8.5 mm, 15 mm or 20 mm* (other center heights available on request) 8.5 mm, 15 mm or 20 mm* (other center heights available on request) Fiber optics built in, not exchangeable UV/Vis low solarisation 190 nm – 1,100 nm (52.632 cm-1– 9.100 cm-1) built in, not exchangeable UV/Vis low solarisation 190 nm – 1,100 nm (52.632 cm-1– 9.100 cm-1) * The correct height will depend on the cuvette holder design and the spectrophotometer model The TrayCell should be easily accessible within the cuvette holder of the spectrophotometer and it should be possible to close the cap. ** The center height can be adjusted using the adapter supplied. When ordering, please state the required center height or the brand and model of your spectrophotometer. 31 12. TECHNISCHE DATEN: DECKEL STANDARD Typ 665.703 665.704 665.705 665.706 Artikel-Nr. 665-703-1-40 665-703-0.2-40 665-705-2-40 665-706-0.1-40 Beschreibung Standardschichtdicke Fenstermaterial 32 OPTIONAL Deckel aus Edelstahl mit integriertem Spiegel aus Quarzglas mit Aluminium-Spiegelschicht 1,0 mm 0,2 mm 2,0 mm Quarzglas SUPRASIL® mit Aluminium-Spiegelschicht 0,1 mm 12. Technical specifications: Cap STANDARD OPTIONAL Type 665.703 665.704 665.705 665.706 Product No. 665-703-1-40 665-703-0.2-40 665-705-2-40 665-706-0.1-40 Description Path length Mirror material Stainless steel cap with integrated mirror for adjusting path lengths 1.0 mm 0.2 mm 2.0 mm 0.1 mm Quartz glass SUPRASIL® with aluminium mirror coating 33 13. FAQ 1. 2. 3. 4. 5. 6. 7. 8. 9. 10. Welche ist die richtige TrayCell für mein Gerät? Was muss ich beim Einsetzen der TrayCell beachten? Wann verwende ich welchen Deckel? Wie reinige ich die TrayCell? In welchem Wellenlängenbereich kann ich messen? Wie benutze ich die TrayCell in einem Zweistrahlfotometer? Welcher Konzentrationsbereich ist abgedeckt? Bis zu welcher Absorption kann ich messen? Kann ich hochkonzentrierte Proteine messen? Kann ich Proben mit geringer Oberflächenspannung messen? 11. Meine Messwerte schwanken – Was kann ich tun? 1. Welche ist die richtige TrayCell für mein Gerät? Hellma bietet die TrayCell in zwei Bauhöhen an. Die „kurze“ TrayCell 105.810UVS passt gut in Geräte, deren Probenraum mit einem Deckel verschlossen wird. Die „lange“ TrayCell 105.800-UVS erleichtert das Pipettieren in Geräten, die einen tiefen Probenraum haben. Die Eigenschaften beider Messzellen sind ansonsten identisch. Bei beiden Varianten ist es möglich, mit einem Distanzstück ganz nach Bedarf verschiedene Zentrumshöhen zu erreichen. Ihre TrayCell ist damit problemlos in Spektralfotometern mit unterschiedlichen Zentrumshöhen einsetzbar. Wenn Sie nicht sicher sind, welche Zentrumshöhe Sie benötigen, nennen Sie uns Ihr Gerät und wir empfehlen Ihnen die passende TrayCell. 2. Was muss ich beim Einsetzen der TrayCell beachten? Wie bei der Verwendung von Küvetten ist auch bei der TrayCell darauf zu achten, dass sie gerade und stabil im Strahlengang steht. Für eine möglichst gute Reproduzierbarkeit der Messwerte empfehlen wir, die TrayCell immer in der gleichen Richtung mit 34 3. 4. 5. 6. dem Hellma-Logo nach vorne einzusetzen und zwischen den Messungen nicht aus dem Halter zu nehmen. Wann verwende ich welchen Deckel? Je geringer die Schichtdicke, desto höhere Konzentrationen einer Probe können im Linearitätsbereich des Spektralfotometers bzw. des Probensystems gemessen werden. Gegenüber der üblicherweise eingesetzten Küvette mit 10 mm Schichtdicke bietet der Deckel mit 1 mm Schichtdicke einen „Verdünnungsfaktor“ von 10, der Deckel mit 0,2 mm Schichtdicke sogar einen „Verdünnungsfaktor“ von 50. Der Faktor gibt also das Maß der Verdünnung an, die sonst in einer konventionellen Küvette notwendig wäre (virtueller Verdünnungsfaktor). Wie reinige ich die TrayCell? Die TrayCell besteht aus Quarzglas- und Metallkomponenten und ist daher vorsichtig zu behandeln. Während die Quarzglaskomponenten sehr robust gegenüber Laborreinigungsmitteln sind, sollten bei den Metallkomponenten keine ätzenden bzw. korrosiven Reinigungsmittel verwendet werden. Wir empfehlen für die Reinigung fusselfreie Wattestäbchen oder fusselfreie Labortücher. Die Probe kann vorher mit einer Pipette zurückgewonnen werden. Der verbleibende Rest wird mit Wattestäbchen oder einem Labortuch abgewischt. Bei Bedarf kann mit einem für die Probe geeigneten verwendeten Lösungsmittel nachgereinigt werden. Ergänzend eignet sich unser Reinigungsmittel Hellmanex III sehr gut für eine gründliche Reinigung der TrayCell. In welchem Wellenlängenbereich kann ich messen? Die TrayCell zeichnet sich durch die Verwendung solarisationsarmer Lichtleiter aus. Der Messbereich liegt zwischen 190 und 1.100 nm. Wie benutze ich die TrayCell in einem Zweistrahlfotometer? Das übliche Verfahren einer Referenzmessung in einem Zweistrahlfotometer ist mit einer zweiten TrayCell nicht möglich. Die Unterschiede der Fasern in der optischen Charakteristik sind zu groß, um einen sinnvollen Abgleich zu ermöglichen. Für Standardmessungen ist ein solcher Abgleich nicht notwendig, da eine Basislinienkorrektur in den meisten Fällen ausreichend ist. Um nötigenfalls das Signal-Rausch-Verhältnis zu verbessern, ist es empfehlenswert, den Referenzstrahl auf eine Intensität von etwa 20% abzuschwächen. Dies kann mit einer simplen Lochblende im Referenzstrahlengang ganz einfach erreicht werden. 7. Welcher Konzentrationsbereich ist abgedeckt? Bei Nukleinsäuren ergeben sich je nach untersuchter Probe (doppelsträngge oder einzelsträngige DNA oder RNA, Oligomere etc.) Konzentrationsbereiche von etwa 6 bis 8.500 ng/µL für einen Absorptionsbereich von 0,025 – 1,7 (siehe Kapitel 6. Messbereich). Bei Proteinen sollte maximal bis zu einer Absorption von 1 gemessen werden, da aufgrund der Streuung darüber keine Linearität nach dem Lambert-Beerschen Gesetz mehr gegeben ist. Für ein Protein mit einer Absorption von 1 bei einer Konzentration von 1 mg/ml ergibt sich mit der TrayCell ein Konzentrationsbereich von 0,1 – 100 mg/ml. Dieser Konzentrationsbereich variiert je nach dem spezifischen Absorptionskoeffizienten der einzelnen Proteine (siehe Kapitel 6. Messbereich). 8. Bis zu welcher Absorption kann ich messen? Die maximal messbare Absorption wird durch den Linearitätsbereich des verwendeten Spektralfotometers begrenzt. Die leistungsfähigsten Spektralfotometer auf dem Markt erlauben Messungen bis zu einer Absorption von höchstens 10. Die Angaben deutlich höherer Absorptionen in der Literatur sind als theoretische Werte zu verstehen. Diese „theoretischen“ Absorptionswerte geben an, was zu erwarten wäre, wenn die vermessene Probe unverdünnt in einer Küvette mit 10 mm Schichtdicke gemessen werden könnte. Der Absorptionsbereich eines Spektralfotometers mit einem linearen Messbereich bis 1,7 würde bei der Verwendung einer Schichtdicke von 0,2 mm (Faktor 50) einer „theoretischen“ Absorption von bis zu 1,7 x 50 (Faktor) = 85 in einer 10-mm-Küvette entsprechen. 9. Kann ich hochkonzentrierte Proteine messen? Die Messung von hochkonzentrierten Proben ist durch den linearen Absorptionsbereich des verwendeten Spektralfotometers bestimmt. Auch spielt die Art der gemessenen Probe eine Rolle, da z. B. Proteine nur bis zu einer Absorption von ca. 1 korrekt gemessen werden können. Durch die Verwendung verschiedener Schichtdicken mit der TrayCell können somit auch hochkonzentrierte Proteinproben gemessen werden. 10. Kann ich Proben mit geringer Oberflächenspannung messen? Ja. Da das Messfenster eine kleine Vertiefung hat und die Messung in der Horizontalen durchgeführt wird, kann die Flüssigkeit nicht entweichen. Für beste Ergebnisse empfehlen wir hierfür, wenn möglich, die Verwendung des Deckels mit Schichtdicke 0,2 mm oder den optional erhältlichen Deckel mit der Schichtdicke 0,1 mm. 11. Meine Messwerte schwanken – Was kann ich tun? Überprüfen Sie, ob eine ausreichend große Menge Probe aufpipettiert ist. Das Volumen sollte der für die entsprechende Schichtdicke empfohlenen Mindestmenge entsprechen. Manche Pipetten sind für sehr kleine Probenvolumina nicht genau genug. Erhöhen Sie im Zweifelsfall die Probenmenge ein wenig. Bei sehr geringen Volumina empfiehlt es sich, die Probe direkt auf den Spiegel in der Deckelinnenseite zu pipettieren. Prüfen Sie, ob das Spektrum Rauschen zeigt, das ein Schwanken des Messsignals bewirken würde. Vorausgesetzt, dass die Konzentration bzw. die Absorption der Probe innerhalb des Messbereichs liegt, wird eine längere Integrationszeit die Messung verbessern. 35 13. FAQs 1. Which TrayCell is right for my device? 2. Where should I pay special attention when inserting the TrayCell? 3. When do I use which cap? 4. How do I clean the TrayCell? 5. In which wavelength range can I take measurements? 6. How do I use the TrayCell in a double beam spectrophotometer? 7. What is the concentration range covered? 8. What is the maximum absorbance I can measure? 9. Can I measure highly-concentrated proteins? 10. Can I measure samples with a low surface tension? 11. My measurement values fluctuate, what can I do? 1. Which TrayCell is right for my device? Hellma offers the TrayCell in two different lengths. The ‘short’ TrayCell 105.810UVS fits well in devices where the sample compartment is closed with a cap. The ‘long’ TrayCell 105.800-UVS makes pipetting easier in devices with deep sample compartments. The properties of the two measuring cells are otherwise identical. Spacers can be used in both models to achieve various center heights as necessary. Your TrayCell can therefore be used problem-free in spectrophotometers with different center heights. If you are unsure as to which center height you require, tell us the details of your device and we will recommend the most suitable TrayCell. 2. Where should I pay special attention when inserting the TrayCell? As is the case when using cuvettes, you should be careful to ensure that the TrayCell stands straight and stable in the light path. To achieve the best possible reproducibility 36 3. 4. 5. 6. of measurement values, we recommend always inserting the TrayCell in the same direction, with the Hellma logo facing the front, and leaving it in the holder between measurements. When do I use which cap? The smaller the path length, the higher the concentrations of samples that can be measured within the linearity range of the spectrophotometer or sample testing system. In contrast to the customary cuvettes with their 10 mm path length, the 1 mm path length cap offers a ‘dilution factor’ of 10, and the cap with a 0.2 mm path length even provides a ‘dilution factor’ of 50. This factor therefore indicates the extent of dilution that would be necessary in a conventional cuvette (virtual dilution factor). How do I clean the TrayCell? The TrayCell consists of quartz glass and metal components, and must therefore be handled with care. While the quartz glass components are highly resistant to laboratory cleaning agents, no caustic or corrosive cleaning agents should be used on metal components. We recommend using lint-free swabs or lint-free lab cloths for cleaning. Samples can be recovered beforehand using a pipette, and the remainder is then wiped away using a swab or lab cloth. If necessary, final cleaning may be performed with a solvent used for the sample. In addition, our Hellmanex III cleaning agent is perfect for thorough TrayCell cleaning. In which wavelength range can I take measurements? The TrayCell is characterized by its use of low solarization fiber optics. It permits a measuring range of between 190 and 1,100 nm. How do I use the TrayCell in a double beam spectrophotometer? It is not possible to simply use a second TrayCell and follow the usual procedure for taking reference measurements in a double beam spectrophotometer. The differences in the optical characteristics of the fibers are too great to allow any sensible comparisons to be drawn. Baseline correction is sufficient in the ma- jority of cases, however, making such comparisons unnecessary for standard measurements. If you need to improve the signalto-noise ratio, we recommend reducing the reference beam to an intensity of around 20%. This can easily be achieved using a simple aperture in the reference beam path. 7. What is the concentration range covered? Depending on the sample being analyzed (double-stranded or single-stranded DNA or RNA, oligomers, etc.) we see nucleic acid concentration ranges from around 6 to 8,500 ng/µl for an absorbance range of 0.025 – 1.7 (see chapter 6. Measuring range). In the case of proteins, measurements should only be taken up to a maximum absorbance of 1, since the scattering above this level would no longer ensure linearity as defined by the BeerLambert law. For a protein with an absorbance of 1 at a concentration of 1 mg/ml, the concentration range with a TrayCell would be 0.1 – 100 mg/ml. This concentration range varies depending on the specific absorption coefficients of the individual proteins (see chapter 6. Measuring range). 8. What is the maximum absorbance I can measure? The maximum absorbance that can be measured is limited by the linearity range of the spectrophotometer used. The highest performance spectrophotometers available on the market permit measurements up to a maximum absorbance of 10. Statements in the literature referring to far greater absorbance ratios should be understood as theoretical values. These ‘theoretical’ absorbance ratios indicate the results that could be expected if we were able to measure undiluted samples in cuvettes with 10 mm path lengths. When using a path length of 0.2 mm (factor 50), the absorbance range of a spectrophotometer with a linear measuring range up to 1.7 would equate to a ‘theoretical’ absorbance of up to 1.7 x 50 (factor) = 85 in a 10 mm cuvette. 9. Can I measure highly-concentrated proteins? The ability to measure highly-concentrated samples is determined by the linear absorbance range of the spectrophotometer used. The type of sample being measured also plays a role, as proteins, for example, can only be measured correctly up to an absorbance of 1. By using different path lengths with the TrayCell, even highlyconcentrated proteins can be measured. 10. Can I measure samples with a low surface tension? Yes. As the window is slightly indented and measurements are performed in the horizontal plane, the liquid is unable to escape. To achieve the best results, we recommend using the cap with the 0.2 mm path length where possible, or the 0.1 mm path length cap that is available as an optional accessory. 11. My measurement values fluctuate, what can I do? Check that a sufficiently large sample quantity has been pipetted onto the window. The volume should be equivalent to the minimum quantity recommended for a given path length. Some pipettes are not precise enough for transferring small sample volumes. If in doubt, increase the sample volume a little. In the case of very low volumes, we recommend pipetting samples directly onto the mirror inside the cap. Check whether the spectrum is showing a high noise level, that could cause the measurement signal to fluctuate. Provided that the concentration and/or absorbance of the sample lies within the measuring range, an extended integration period will improve the measurements. 37 NOTIZEN 38 Note 39 High Precision in Spectro-Optics Danke für den Kauf unserer TrayCell Sehen Sie den Anwendungsfilm auf www.traycell.com Thank you for purchasing a TrayCell Please watch the instructional video on www.traycell.com Hellma GmbH & Co. KG Klosterrunsstraße 5 // 79379 Müllheim/Germany phone: +49 7631 182-0 // fax: +49 7631 182-1011 e-mail: [email protected] Technische Änderungen vorbehalten. Subject to change without notice. 064-500-PB03-725 //D//GB//12//2014 Printed in Germany Alle Hellma-Videos auf YouTube All Hellma videos on YouTube www.hellma-analytics.com