1
Virtual Weather Station User's Guide
Virtual Weather Station Version 12
User's Manual
For Davis Instruments Vantage, Vantage Pro, Weather Monitor II, Weather Wizard III, Oregon Scientific
WMR-918 (cable free), Oregon Scientific WMR-968 (cable free), Huger WMR-968H (cable free), Oregon
Scie ntific WM-918, Huger WM-918H, Radio Shack WX-200, Radio Shack 63-1016 Wireless, Peet Bros
Ultimeter100/800/2000, Rainwise WS -2000 and WT-2000 Weather Stations, Texas Weather Instruments
Weather Stations, 1-Wire Weather Stations, RxComm, Columbia Weather Systems Weather Stations,
Campbell Scientific Weather Stations, and Kestrel 4000 PC Interface
©Copyright 2000-2002, Ambient LLC. All Rights Reserved.
Virtual Weather Station is a registered trademark of Ambient, LLC. Microsoft and Windows are U.S. registered
trademarks of Microsoft Corporation. Names of products mentioned herein are used for identification purposes only
and may be trademarks and/or registered trademarks of their respective company.
-1-
09/20/02
Virtual Weather Station User's Guide
Ambient, LLC License Agreement
READ CAREFULLY BEFORE USING THIS SOFTWARE
License Agreement. This software license agreement is a legal agreement between you (either an individual or
entity) and Ambient, LLC.
Copies and Adaptations. This software is copyrighted material. This license permits you to use one copy on a
single computer. You may not rent, lease or loan the software. Ambient, LLC reserves the right to terminate this
license if there is a default of this agreement. At this time, all copies of the software must be returned to Ambient,
LLC.
Software Uses. This software is for entertainment use only.
Liability. To the maximum extent permitted by applicable law, in no event shall Ambient, LLC be liable for any
damages beyond the cost of the software (including without limitation, direct or indirect damages for personal
injury, loss of business profits, business interruption, loss of business information, or other pecuniary loss) arising
out of the use or inability to use this product, even if Ambient, LLC has been advised of the possible of such
damages.
In any case, Ambient, LLC's entire liability under any provision of this agreement shall be limited to the price of the
software.
Export Requirements. You may not export or re -export the Software of any copy or adaptation in violation of any
applicable laws or regulations.
US Government Restricted Rights. The Software and any accompanying documentation have been developed
entirely at private expense. They are delivered and licensed as "commercial computer software" as defined in
DFARS 252.227-7013 (Oct 1988, DFARS 252.211-7015 (May 1991) or DFARS 252.227-7014 (Jun 1995) as a
"commercial item" as defined in FAR 2.101(a), or as "Restricted Computer Software" as defined in FAR 52.227-19
(Jun 1987)(or any equivalent agency restriction or contract clause), whichever is applicable. You may have only
those rights provided for such Software and any accompanying documentation by applicable FAR or DFARS
clause.
By installing this software, you indicate acceptance of the aforementioned License Agreement.
-2-
09/20/02
Virtual Weather Station User's Guide
Table of Contents
1
GENERAL DESCRIPTION............................................................................................................................................9
2
VIRTUAL WEATHER STATION EDITIONS .........................................................................................................9
3
WEATHER STATION PART NUMBERS .................................................................................................................9
4
HARDWARE AND SOFTWARE REQUIREMENTS AND DISPLAY PREFERENCES .........................11
4.1
4.2
5
HARDWARE AND SOFTWARE REQUIREMENT S...................................................................................................... 11
DISPLAY PREFERENCES............................................................................................................................................ 11
GETTING STARTED .....................................................................................................................................................11
5.1
5.2
5.2.1
5.2.2
5.2.3
5.3
5.4
5.5
6
INSTALLING THE SOFTWARE .................................................................................................................................... 11
CONNECTING YOUR COMMUNICATION PORT TO THE W EATHER STATION ...................................................... 11
Oregon Scientific, Radio Shack and Huger Weather Stations....................................................................11
Rainwise Weather Stations................................................................................................................................11
Davis Instruments................................................................................................................................................12
RUNNING VIRTUAL WEATHER STATION ............................................................................................................... 12
LICENSE INFORMATION............................................................................................................................................ 12
UPGRADE TO PRO OR INTERNET EDITIONS............................................................................................................ 12
VIRTUAL WEATHER STATION BASE EDITION FEATURES ....................................................................13
6.1
6.2
6.2.1
6.2.2
6.3
6.4
6.5
6.5.1
6.5.2
6.5.3
6.5.4
6.5.5
6.5.6
THE A SSISTANT ......................................................................................................................................................... 13
CONVERSIONS............................................................................................................................................................ 13
Unit Conversions.................................................................................................................................................13
Total Rain Offset .................................................................................................................................................13
CALIBRATION............................................................................................................................................................. 14
PRECISION .................................................................................................................................................................. 15
COMMUNICATION...................................................................................................................................................... 16
Weather Station ...................................................................................................................................................16
Communication Port...........................................................................................................................................16
Baud Rate .............................................................................................................................................................16
Communication Rate..........................................................................................................................................16
Complete Record Mode (Peet Bros Only).......................................................................................................17
Sensor and Battery Status (WMR-918 and WMR-968 only)........................................................................17
6.5.6.1
6.5.6.2
6.5.7
6.5.8
Communication OK..................................................................................................................................... 17
Battery OK................................................................................................................................................... 17
1-Wire Stations....................................................................................................................................................18
Stationless Operation.........................................................................................................................................18
6.5.8.1
6.5.8.2
6.5.8.3
Connecting to a Computer Across the Network.......................................................................................... 19
Displaying METAR Data in the Stationless Mode...................................................................................... 20
File Timer Access........................................................................................................................................ 20
6.6
GENERAL PROGRAM SETTINGS ............................................................................................................................... 20
6.6.1
Start Program Hidden........................................................................................................................................20
6.6.2
Reboot Schedule..................................................................................................................................................21
6.6.3
CPU Resources....................................................................................................................................................21
6.7
STATION SETTINGS ................................................................................................................................................... 21
6.7.1
Longitude and Latitude......................................................................................................................................21
6.7.2
Time Zone .............................................................................................................................................................22
-3-
09/20/02
Virtual Weather Station User's Guide
6.7.3
Altitude..................................................................................................................................................................22
6.7.4
Air Data Calculator (correcting Pressure to Sea-level Conditions)..........................................................22
6.7.5
Celestial Calendar..............................................................................................................................................23
6.8
REAL-TIME DATA...................................................................................................................................................... 23
6.9
W EATHER DISPLAYS................................................................................................................................................. 23
6.9.1
Icon (WM-918, WMR-918 and WMR-968 only)............................................................................................24
6.9.2
Broadcast..............................................................................................................................................................24
6.9.3
Color Spectrum....................................................................................................................................................24
6.9.4
High / Low Display.............................................................................................................................................24
6.9.5
Distribution Chart...............................................................................................................................................24
6.9.6
Wind Direction ....................................................................................................................................................25
6.9.7
Thermometer ........................................................................................................................................................25
6.9.8
Gauge....................................................................................................................................................................25
6.9.9
Meter .....................................................................................................................................................................26
6.9.10
Graph...............................................................................................................................................................26
6.9.11
Strip Chart.......................................................................................................................................................26
6.9.12
Tank..................................................................................................................................................................27
6.9.13
Alpha Numeric................................................................................................................................................27
6.9.14
Moon Phase ....................................................................................................................................................27
6.9.15
Difference Between Graphs and Strip Charts...........................................................................................27
6.10
CUSTOMIZING DISPLAYS.......................................................................................................................................... 28
6.11
A DDING AND DELETING DISPLAYS ........................................................................................................................ 28
6.11.1
Modifying the Display and Display Attributes..........................................................................................29
6.11.2
Broadcast Display Settings..........................................................................................................................31
6.11.2.1
Displaying the Icon...................................................................................................................................... 32
6.11.2.2
Changing the Background Image ................................................................................................................ 32
6.11.2.3
Changing the Logo Image........................................................................................................................... 32
6.11.2.4
Web Cams, Weather Cams and Dynamic Images ....................................................................................... 32
6.11.2.4.1 Displaying the WeatherCam Image in the Broadcast Panel................................................................... 32
6.11.2.4.2 Sizing the Image..................................................................................................................................... 32
6.11.2.4.3 Image Time Stamp ................................................................................................................................. 32
6.11.2.4.4 Daytime Update Only............................................................................................................................. 32
6.11.2.4.5 Time Lapse............................................................................................................................................. 32
6.11.2.4.6 Reset Display at Midnight...................................................................................................................... 33
Memory leaks may occur with some operating systems when updating images. To reset memory at midnight, select
the checkbox and the panel will be discarded and reloaded........................................................................................ 33
6.12
GENERAL DISPLAY SETTINGS ................................................................................................................................. 33
6.12.1
Full Screen Display.......................................................................................................................................34
6.13
DATABASE .................................................................................................................................................................. 35
6.13.1
Database Timer..............................................................................................................................................35
6.13.2
Database Format...........................................................................................................................................36
6.13.3
Editing and Deleting Database Records....................................................................................................38
6.13.4
Resizing the Database...................................................................................................................................38
6.14
JPEG FILES.................................................................................................................................................................. 38
6.14.1
Image Quality.................................................................................................................................................39
6.14.2
Jpeg File Location.........................................................................................................................................39
6.14.3
Jpeg File Naming Convention .....................................................................................................................39
6.15
A DVANCED PARAMETER SETTINGS ........................................................................................................................ 40
6.15.1
Degree Days Heating and Cooling.............................................................................................................40
6.15.1.1
6.15.1.2
6.15.2
6.15.3
6.15.4
6.15.5
Heating Threshold ....................................................................................................................................... 40
Cooling Threshold ....................................................................................................................................... 40
Wind Run.........................................................................................................................................................40
Pressure Trend ...............................................................................................................................................40
Setting Daily and Monthly Rain..................................................................................................................40
Wind Gust Calculation..................................................................................................................................40
-4-
09/20/02
Virtual Weather Station User's Guide
6.15.6
Filtered Average Time Constant .................................................................................................................41
6.15.7
New Wind Chill Calculation........................................................................................................................41
6.15.8
Use Channel 1 As Outdoor Temperature ..................................................................................................42
6.15.9
Resetting Daily Minimum and Maximum Values....................................................................................42
6.16
COMPLETE PARAMETER LIST .................................................................................................................................. 43
6.16.1
Daily Highs and Lows...................................................................................................................................43
6.16.2
Average Values...............................................................................................................................................43
6.17
RATE OF CHANGE VALUES...................................................................................................................................... 43
6.18
DAILY, M ONTHLY AND YEARLY SUMMARY......................................................................................................... 50
6.18.1
Recalling the Daily, Monthly and Yearly Summary.................................................................................50
6.18.2
Daily Summary...............................................................................................................................................51
6.18.3
Monthly Summary..........................................................................................................................................51
6.18.4
Yearly Summary .............................................................................................................................................51
6.18.5
Changing Daily, Monthly or Yearly Rain..................................................................................................52
6.19
A LARMS AND MEMORY (WM-918 AND WX-200 ONLY) ................................................................................... 53
6.20
A LARMS...................................................................................................................................................................... 53
6.20.1
Alarm Settings................................................................................................................................................53
6.20.2
Launching Executable or Batch Files........................................................................................................54
6.21
SYNCHRONIZE DATE AND TIME.............................................................................................................................. 55
6.22
DESKTOP OPTIONS.................................................................................................................................................... 55
6.22.1
The Taskbar....................................................................................................................................................55
6.22.2
The Toolbar.....................................................................................................................................................56
6.23
RAINWISE SETTINGS ................................................................................................................................................. 56
6.23.1
Sea-level Barometer Adjustment (418 MHz systems only).....................................................................56
6.23.2
Reset Barom to Absolute Pressure..............................................................................................................56
6.23.3
Reset Daily Min/Max Data...........................................................................................................................56
6.23.4
Reset Daily and Monthly Rainfall...............................................................................................................56
6.23.5
Reset Total Rainfall to Zero .........................................................................................................................56
6.23.6
Reset High Windspeed ..................................................................................................................................56
6.23.7
Clear All Logged Data..................................................................................................................................56
6.23.8
No. Items Logged...........................................................................................................................................57
6.23.9
Update Computer Interfaces Clock ............................................................................................................57
6.23.10
Increment Logging Interval..........................................................................................................................57
6.23.11
Battery Voltage...............................................................................................................................................57
6.23.12
Version.............................................................................................................................................................57
6.24
RAINWISE DATA LOGGER ........................................................................................................................................ 58
6.25
VANTAGE / WEATHER LINK SETTINGS .................................................................................................................. 58
6.25.1
Vantage Pro Settings.....................................................................................................................................58
6.25.2
Vantage / WeatherLink Highs and Lows ...................................................................................................59
6.25.3
Vantage / WeatherLink Alarm Settings...................................................................................................60
6.26
CSV FILE EXPORT .................................................................................................................................................... 61
6.27
OTHER DISPLAY FEATURES..................................................................................................................................... 64
6.27.1
Minimizing the Program and Display........................................................................................................64
6.27.2
Hiding Virtual Weather Station...................................................................................................................64
6.28
W EATHERLINK A UTOMATION (DAVIS INSTRUMENTS ONLY)............................................................................ 64
6.29
W EATHERVOICE........................................................................................................................................................ 65
6.29.1
What you Need to Get Started.....................................................................................................................66
6.29.2
Configuring WeatherVoice...........................................................................................................................66
7
VIRTUAL WEATHER STATION PRO EDITION...............................................................................................67
7.1
FILE SETTINGS (DATA LOGGING) ........................................................................................................................... 67
7.1.1
Daily File..............................................................................................................................................................68
7.1.2
Date Stamped File...............................................................................................................................................68
-5-
09/20/02
Virtual Weather Station User's Guide
7.1.3
7.1.4
Csv File.................................................................................................................................................................68
Archive File..........................................................................................................................................................68
7.1.4.1
Daily Archive Files...................................................................................................................................... 69
7.1.4.1.1
Previous Daily Files ............................................................................................................................... 69
7.1.4.2
Monthly Archive Files................................................................................................................................. 69
7.1.4.3
Yearly Archive Files.................................................................................................................................... 69
7.1.5
Date Stamped Archive File................................................................................................................................70
7.1.5.1
Date Stamped Archive Daily Files .............................................................................................................. 70
7.1.5.1.1
Previous Daily Files ............................................................................................................................... 70
7.1.5.2
Date Stamped Archive Monthly Files ......................................................................................................... 70
7.1.5.3
Date Stamped Archive Yearly Files ............................................................................................................ 70
7.1.6
7.1.7
7.1.8
7.2
7.3
7.3.1
7.4
7.4.1
7.5
8
Summary Files .....................................................................................................................................................71
File Update Timer...............................................................................................................................................71
Create / Modify File List....................................................................................................................................71
CLIMATE REPORTS.................................................................................................................................................... 72
M ONTHLY CLIMATE REPORT .................................................................................................................................. 72
Modifying the Monthly Climate Report...........................................................................................................73
YEARLY CLIMATE REPORT ...................................................................................................................................... 73
Modifying the Yearly Climate Report..............................................................................................................74
CLIMATE REPORT TEXT FILE AND PRINTING CLIMATE REPORTS..................................................................... 74
VIRTUAL WEATHER STATION INTERNET EDITION .................................................................................74
8.1
W EATHER WEBSITE BUILDER................................................................................................................................. 75
8.2
INTERNET FEATURES AND OPERATION.................................................................................................................. 76
8.3
REMOTE SERVER APPLICATIONS ............................................................................................................................ 77
8.4
CONNECTING TO THE INTERNET.............................................................................................................................. 77
8.5
NETWORK CONNECTION .......................................................................................................................................... 77
8.6
DIAL-UP CONNECTION.............................................................................................................................................. 78
8.6.1
Number of Dial-up Attempts .............................................................................................................................78
8.6.2
Number of Seconds to Wait Between Attempts ..............................................................................................78
8.6.3
Use the Following Dial-up Networking Connection.....................................................................................78
8.6.4
Username, Password and Domain...................................................................................................................78
8.6.5
Dial-up Automation............................................................................................................................................78
8.7
GENERAL FTP SETTINGS ......................................................................................................................................... 79
8.7.1
FTP Timeout ........................................................................................................................................................79
8.7.2
Successive Login Attempts.................................................................................................................................80
8.7.3
Maximum Connect Time ....................................................................................................................................80
8.7.4
Time Delay Between Transfers .........................................................................................................................80
8.7.5
Display Connect Timer.......................................................................................................................................80
8.7.6
Max CPU During FTP .......................................................................................................................................80
8.7.7
FTP Priority.........................................................................................................................................................80
8.8
VIRTUAL W EATHER STATION JPEG IMAGES.......................................................................................................... 81
8.9
JPEG FILE INDEX........................................................................................................................................................ 81
8.10
OTHER JPEG FILENAMES.......................................................................................................................................... 88
8.11
INTRANET AND LOCAL A REA NETWORK APPLICATIONS.................................................................................... 88
8.12
W EB PAGE TEMPLATES............................................................................................................................................ 88
8.13
CREATING W EB PAGES WITH VIRTUAL WEATHER STATION TAGS................................................................... 89
8.13.1
Description of HTML Tags ..........................................................................................................................89
8.13.2
Creating an HTML Template File (htx file)..............................................................................................89
8.13.3
Inserting HTML Tags Into the Templates..................................................................................................89
8.13.4
Creating the HTML File from the HTML Template (htx) File...............................................................92
8.14
HTML FILE TAGS..................................................................................................................................................... 93
8.15
FTP OPERATION......................................................................................................................................................... 94
8.15.1
Connecting to Your Remote Ftp Server .....................................................................................................95
-6-
09/20/02
Virtual Weather Station User's Guide
8.15.2
Automatic Ftp Features................................................................................................................................96
8.15.2.1
Sending Jpeg Files Displayed in Virtual Weather Station Desktop to the Internet (Jpeg FTP Settings).... 97
8.15.2.1.1 Creating Temporary Jpg Files First On the Server................................................................................. 97
8.15.2.1.2 Send Files to this Location on Server..................................................................................................... 97
8.15.2.2
Sending (Upload) User Selectable Files to the Internet (FTP Server)......................................................... 98
8.15.2.3
Sending (Upload) the Entire Contents of a Folder to the Internet (FTP Server)......................................... 98
8.15.2.4
Retrieve (Download) Files from the Internet............................................................................................... 99
8.16
E MAIL W EATHER REPORTS AND ALARMING....................................................................................................100
8.16.1
Email Settings.............................................................................................................................................. 101
8.16.2
Weather Reports.......................................................................................................................................... 102
8.16.3
Email Alarms ............................................................................................................................................... 102
8.16.4
Reporting Alarm Codes Only.................................................................................................................... 103
8.17
METAR....................................................................................................................................................................103
8.17.1
General Description................................................................................................................................... 103
8.17.2
Finding METAR Reports ........................................................................................................................... 103
8.17.3
Locating a Station Near You..................................................................................................................... 104
8.17.4
METAR Station Setup................................................................................................................................. 104
8.17.5
Displaying METAR Icons on the Desktop .............................................................................................. 106
8.17.6
METAR Settings.......................................................................................................................................... 107
8.17.7
METAR Report Generator........................................................................................................................ 108
8.17.8
METAR Text Reports.................................................................................................................................. 109
8.17.8.1
8.17.8.2
8.17.8.3
METAR Summary Text Report................................................................................................................. 109
METAR Historical Text Report ................................................................................................................ 110
METAR Raw Data.................................................................................................................................... 110
8.17.9
Learning More About METAR ................................................................................................................. 111
8.18
W EATHER SERVERS ................................................................................................................................................111
8.18.1
WxWatch.com.............................................................................................................................................. 111
8.18.2
WxHost.com................................................................................................................................................. 111
8.18.3
Other Servers............................................................................................................................................... 112
8.18.3.1
8.18.3.2
Weather Underground ............................................................................................................................... 112
Weatherforyou Weather Server................................................................................................................. 112
8.18.4
APRS ............................................................................................................................................................. 112
8.19
INTERNET STATUS AND LOG .................................................................................................................................113
8.19.1
Turning Off the Internet Functions.......................................................................................................... 113
8.19.2
Error Messages and Log ........................................................................................................................... 113
9
VIRTUAL WEATHER STATION ADD ON AND PLUG-INS ....................................................................... 114
9.1
X10 HOME A UTOMATION WITH VIRTUAL WEATHER STATION, HOMESEER (BASE OR PRO VERSION OF
VIRTUAL W EATHER STATION REQUIRED ) ..........................................................................................................................114
9.1.1
General Description........................................................................................................................................ 114
9.1.2
X10 Controls..................................................................................................................................................... 115
9.1.3
HomeSeer Automation Software Description.............................................................................................. 115
9.1.4
How the Home Automation System Works................................................................................................... 115
9.1.5
Configuring HomeSeer.................................................................................................................................... 116
9.1.6
Purchasing the Virtual Weather Station HomeSeer Plug-in .................................................................... 116
9.2
W EATHERVOICE (INTERNET VERSION OF VIRTUAL W EATHER STATION).....................................................117
9.2.1
What you Need to Get Started........................................................................................................................ 117
9.2.2
WeatherVoice General Description.............................................................................................................. 118
9.2.3
TTS Voices and Microsoft’s TTS Center...................................................................................................... 118
9.2.4
WeatherVoice Set-up ....................................................................................................................................... 119
9.2.4.1
9.2.4.2
9.2.4.3
9.2.4.4
9.2.4.5
Open Text File........................................................................................................................................... 119
Converted File ........................................................................................................................................... 119
Open Wav File........................................................................................................................................... 119
Voices ........................................................................................................................................................ 120
Text to Wav Conversion Timer................................................................................................................. 120
-7-
09/20/02
Virtual Weather Station User's Guide
9.2.4.6
9.2.4.7
9.2.4.8
9.2.4.9
9.3
10
W EATHERFLASH (INTERNET VERSION OF VIRTUAL WEATHER STATION REQUIRED ).................................122
TROUBLESHOOTING TIPS .................................................................................................................................... 123
10.1
10.2
11
Voice Speed............................................................................................................................................... 120
Volume ...................................................................................................................................................... 120
Pitch........................................................................................................................................................... 120
Sample Rate............................................................................................................................................... 120
A DVANCED COMMUNICATION TROUBLESHOOTING TIPS.................................................................................134
SUPPORT ...................................................................................................................................................................135
GLOSSARY OF TERMS ............................................................................................................................................ 135
11.1
11.2
11.3
BEAUFORT SCALE ...................................................................................................................................................138
HEAT STRESS INDEX...............................................................................................................................................139
COMFORT INDEX .....................................................................................................................................................140
-8-
09/20/02
Virtual Weather Station User's Guide
1 General Description
Virtual Weather Station is a software package that allows you to connect your personal computer
to your weather station to display, plot and store data for comprehensive monitoring and
analysis.
Virtual Weather Station brings your PC to life with a rich array of dynamic and colorful gauges,
dials, graphs and charts. The desktop is completely customizable - you can arrange the virtual
instruments based on your own personal preferences or application. You have literally ove r 1000
ways to display your data.
You do not even need a station to operate Virtual Weather Station. The data can be collected
across a network, or downloaded from a METAR compatible weather station.
Virtual Weather Station runs on any Windows 32-bit operating system (95/98/NT/2000/ME/XP).
2 Virtual Weather Station Editions
There are three editions of Virtual Weather Station, based on features:
1. Virtual Weather Station Base Version. This version provides real-time display of the
weather parameters.
2. Virtual Weather Station Pro Edition (formally Weather Lab). This version adds detailed
data analysis and reports.
3. Virtual Weather Station Internet Edition. This version provides all of the features in the
Base and Pro Edition and adds Internet features.
This manual is separated into the three editions.
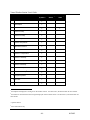
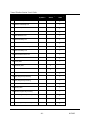
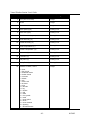
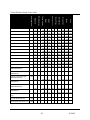
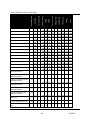
3
Weather Station Part Numbers
The software operates with Davis Instruments, Oregon Scientific, Huger, Rainwise and Radio
Shack weather stations.
Table 1 - Station Part Numbers and Corresponding Reference in Virtual Weather Station
provides a cross reference if your station's part number is different.
Manufacturer
Part Number
Corresponding Reference in Virtual Weather
Station
Accuweather
63-1016
WMR-968
Davis Instruments
Vantage Pro
Vantage Pro
-9-
09/20/02
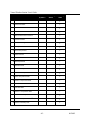
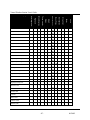
Virtual Weather Station User's Guide
Manufacturer
Part Number
Corresponding Reference in Virtual Weather
Station
Davis Instruments
Vantage Pro Plus
Vantage Pro Plus
Davis Instruments
Weather Monitor WeatherLink
II
Davis Instruments
Weather Wizard
III
WeatherLink
Oregon Scientific
WM-918
WM-918
Oregon Scientific
WMR-918
WMR-918
Oregon Scientific
WMR-968
WMR-968
Huger
WMR-918H
WMR-918
Huger
WM-918H
WM-918
Nielsen Kellerman
Kestrel 4000
Kestrel 4000
Radio Shack
WX-200
WM-918
Rainwise
WS-2000
Rainwise
Rainwise
WT-2000
Rainwise
Peet Bros
100 / 800 / 2000
Peet Bros
Texas Weather
Instrument s
1-Wire Weather
Stations
Texas Weather Instruments
AAG 1-Wire Weather
Station
1-Wire
RxComm
Peet Bros
Columbia Weather
Systems
Capricorn II,
Capricorn 2000
Columbia Weather Systems
Table 1 - Station Part Numbers and Corresponding Reference in Virtual Weather Station
-10-
09/20/02
Virtual Weather Station User's Guide
4 Hardware and Software Requirements and Display Preferences
4.1
Hardware and Software Requirements
The following hardware is required for communicating to the Weather Station:
•
4.2
PC running Windows 95, 98, NT 4.0 (or greater), 2000, ME and XP with at least 10 MB of free
disk space
•
8MB RAM
•
Serial Communication Port
•
Serial Cable
Display Preferences
•
Virtual Weather Station prefers high resolution or 16-bit color. Some images may result in
poor quality at lower resolution settings.
•
Virtual Weather Station is best viewed at 800 x 600 pixels or greater.
•
Power or Energy saving features may result in distorted jpeg images.
5 Getting Started
HINT: Menu Shortcuts are displayed in blue font.
5.1
Installing the Software
To install the software, run the following:
•
setup.exe
If transferring the files to your hard drive, copy all of the files to a common directory and run setup.exe.
5.2
Connecting Your Communication Port to the Weather Station
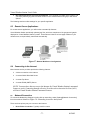
5.2.1 Oregon Scientific, Radio Shack and Huger Weather Stations
Connect your weather station directly to your PC using a standard DB9M/DB9F serial or RS-232
cable (supplied by Ambient, LLC). The serial port on your computer is generally a 9-pin, male
connector, similar to the 9-pin female RS-232 connector on your weather station.
5.2.2 Rainwise Weather Stations
Connect your weather station directly to your PC using the cable provided with your Rainwise
Computer Interface.
-11-
09/20/02
Virtual Weather Station User's Guide
5.2.3 Davis Instruments
Connection to the weather station requires the WeatherLink module.
5.3
Running Virtual Weather Station
Connect a serial cable to your computer's comport and verify your Weather Station is turned on.
Run Virtual Weather Station from the Virtual Weather Station icon.
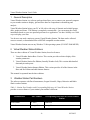
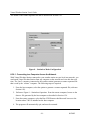
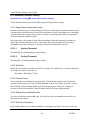
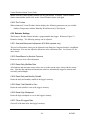
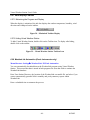
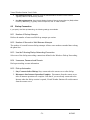
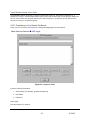
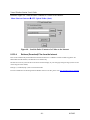
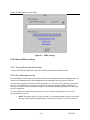
5.4
License Information
•
Menu Shortcut: Help u Registration Information
Enter the license information provided from online registration or the inside cover of the CD.
The software includes a 30-day fully functional trial period.
Figure 1 - License Information
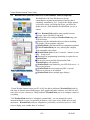
5.5
Upgrade to Pro or Internet Editions
To upgrade to Virtual Weather Station Pro or the Internet Editions, contact Ambient for upgrade
costs. A registration number will be sent to you via Email. Enter this registration number by
selecting the Upgrade button.
-12-
09/20/02
Virtual Weather Station User's Guide
6 Virtual Weather Station Base Edition Features
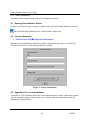
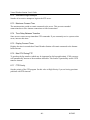
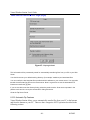
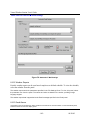
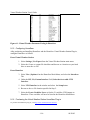
6.1
The Assistant
•
Menu Shortcut: Help u Assistant
If you are a new user, it is advisable that you completely run through the assistant to understand
all of the features of Virtual Weather Station.
When launching Virtual Weather Station for the first time, the Assistant will automatically be
displayed.
Figure 2 - The Assistant
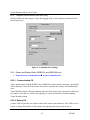
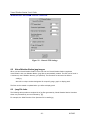
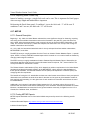
6.2
Conversions
•
Menu Shortcut: Settings u Conversions
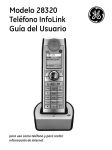
6.2.1 Unit Conversions
You may select the units of measure in which the data is displayed throughout the software. All
program windows and files will display these units.
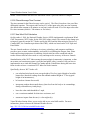
6.2.2 Total Rain Offset
You can account for year to date rain by entering a total rain offset in the numerical field. Note
-13-
09/20/02
Virtual Weather Station User's Guide
that your weather station may not accurately display the year to date rain total.
Figure 3 - Unit Conversion Settings
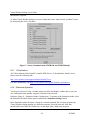
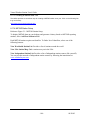
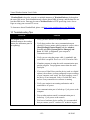
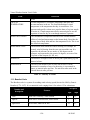
6.3
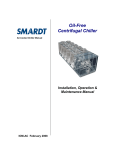
Calibration
Menu Shortcut: Settings u Calibration
Virtual Weather Station allows you to calibrate for improved accuracy. In addition, if your wind
speed sensor is below the expected reading due to bearing life, or the anemometer is obstructed
by trees, these errors can be adjusted to provide realistic values.
The calibration takes the form of the following equation:
Calibrated Value = Gain x Measured Value + Offset
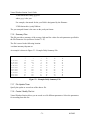
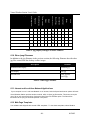
Reference Table 2 - Examples of Calibration. The table provides solutions for typical
measurement problems. NOTE - changing the calibration settings in Virtual Weather Station
will not adjust the parameters displayed from the console.
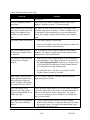
Proble m
Solution
The wind speed is reading 50% low because
the sensor is obstructed by trees. In other
words, when the wind speed reads 3 mph, it is
actually 6 mph.
Set the wind speed gain to 2.00.
One of my temperature sensors is off by 3
degrees
Set the temperature offset to 3.00
I installed my anemometer incorrectly, and
when it points north, it should measure south
Set the wind direction offset to 180.00
-14-
09/20/02
Virtual Weather Station User's Guide
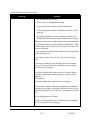
Proble m
Solution
when it points north, it should measure south
Table 2 - Examples of Calibration
Figure 4 - Calibration
6.4
Precision
Menu Shortcut: Settings u Precision
Precision is the number of decimal places. For example a precision of two would be represented
as 3.14, and a precision of three would be represented as 3.141.
Virtual Weather Station allows you to customize the precision for each variable (unless
otherwise noted on specific display panels). These precision values are represented in files,
HTML tags and other various displays.
The precision can be changed for the values (which include averages) and rates of change.
Changing the precision for the temperature will change all of the temperatures (example, indoor
and outdoor).
-15-
09/20/02
Virtual Weather Station User's Guide
Figure 5 - Precision
6.5
Communication
•
Menu Shortcut: Communication u Communication
6.5.1 Weather Station
Select your weather station from the list. If you do not own a weather station, select the
Stationless mode of operation.
6.5.2 Communication Port
Select the communication port. Refer to the chapter on Troubleshooting Tips for more
information on selecting the correct communication port if you are unsure.
6.5.3 Baud Rate
The baudrate is adjustable for the Davis and Rainwise stations.
6.5.4 Communication Rate
Specify the communication rate that VWS communicates to the weather station. If the computer
performance is poor, try increasing this timer.
-16-
09/20/02
Virtual Weather Station User's Guide
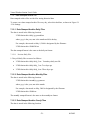
6.5.5 Complete Record Mode (Peet Bros Only)
Defines whether the data output is in the data logging mode or the complete record mode (Peet
Bros Station only).
Figure 6 - Communication Settings
6.5.6 Sensor and Battery Status (WMR-918 and WMR-968 only)
•
Menu Shortcut: Communication u Sensor Communication
6.5.6.1 Communication OK
After communication with the WMR-918 or WMR-968 weather station is detected, a green LED
will be displayed. After all of the remote devices have reported, this window will automatically
close.
Virtual Weather Station will begin updating when all of the sensors have reported (can take up to
one minute). Note that if a sensor is not reporting, it can be deactivated to continue running
Virtual Weather Station.
6.5.6.2 Battery OK
A status LED will provide you with the status of the remote sensor batteries. If the LED is red, it
is time to change the batteries. If the station is not reporting, the battery may be low or
-17-
09/20/02
Virtual Weather Station User's Guide
interference is present.
To allow Virtual Weather Station to execute without the sensor, inactivate the "problem" sensor
by deselecting the Active checkbox.
Figure 7 - Sensor Communication (WMR-918 and WMR-968 only)
6.5.7 1-Wire Stations
All 1-Wire Stations utilize PointSix’s OneSix DDE Server. To download the OneSix server,
please select the following link:
http://www.pointsix.com/support/software/OneSix32.exe
For more information, visit http://www.pointsix.com/cgi-bin/PointSix.cgi?Software
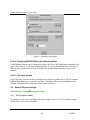
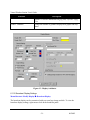
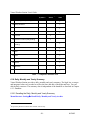
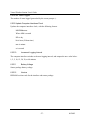
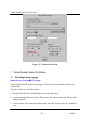
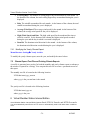
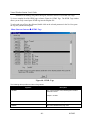
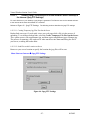
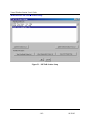
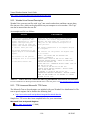
6.5.8 Stationless Operation
You do not even have to own a weather station to collect and display weather data, or you can
view information from another computer collected on the network.
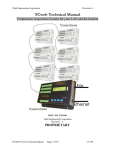
Reference Figure 8 – Stationless Mode Configuration. To operate in the Stationless mode, select
the Stationless Weather Station option, and then the Stationless Settings button.
In the Stationless mode, the input is based on a comma separated file (csv) data generated by
Virtual Weather Station running on a different computer across the network, from data
downloaded from a METAR weather site, or data input from a third party program.
-18-
09/20/02
Virtual Weather Station User's Guide
The format of the comma separated file data is described in Section 6.26.
Figure 8 – Stationless Mode Configuration
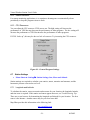
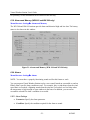
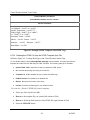
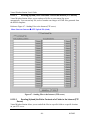
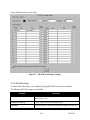
6.5.8.1 Connecting to a Computer Across the Network
With Virtual Weather Station connected to your weather station on your local area network, you
can launch Virtual Weather Station from any computer on the network and view this data realtime. The “host” computer (connected to the weather station) generates a comma separated file
that is read by the “remote” computer. The following steps are required.
1. From the host computer, select the option to generate a comma separated file (reference
Section 6.26).
2.
Reference Figure 9 – Stationless Operation. From the remote computer, browse to the
data.csv file generated by the host computer as described in Section 6.26.
3. From the remote computer, select the Run VWS Remote checkbox and browse to the
location where VWS is installed on the host computer.
4. The program will automatically quit, and must be restarted.
-19-
09/20/02
Virtual Weather Station User's Guide
Figure 9 – Stationless Operation
6.5.8.2 Displaying METAR Data in the Stationless Mode
Virtual Weather Station can be configured to gather data from a METAR station, and display this
data. VWS creates a csv file from the METAR data. To specify the METAR data, select the Use
METAR file checkbox and select the METAR File Location button to browse to the csv file
location.
6.5.8.3 File Timer Access
Set the file timer access to the rate at which the host computer updates the csv file. For example,
METAR data updates may occur once per hour. Continuous file access, particularly across a
network will degrade the performance of the remote computer.
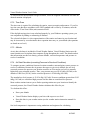
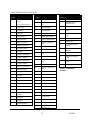
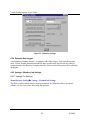
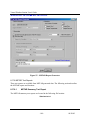
6.6
General Program Settings
Menu Shortcut: Settings u Program Settings
6.6.1 Start Program Hidden
The program can be set to start hidden when the computer starts. To view the hidden program,
double click on the icon in the taskbar.
-20-
09/20/02
Virtual Weather Station User's Guide
6.6.2 Reboot Schedule
For remote monitoring applications, it is sometimes advantageous to automatically reboot
periodically to keep the program resources fresh.
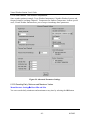
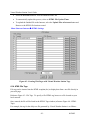
6.6.3 CPU Resources
You can adjust the CPU resources VWS uses to run. The high setting will increase the
performance of VWS but may decrease the perfo rmance of other programs. The low setting will
decrease the performance of VWS but increase the performance of other programs.
If VWS “locks up”, this may be due to a lack of resources. Try increasing the CPU resources.
Figure 10 – General Program Settings
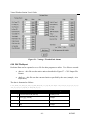
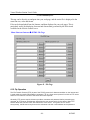
6.7
Station Settings
•
Menu Shortcut: Settings u Station Settings, Sun, Moon and Altitude
Station settings are required to calculate your sunrise, sunset, moonrise and moonset, and the
barometric pressure corrected to sea- level.
6.7.1 Longitude and Latitude
To calculate the sunrise, sunset, moonrise and moonset for your location, the longitude, latitude,
and time zone is required. If the sunrise and sunset appear incorrect, see Troubleshooting Tips.
There are several sources for determining the longitude and latitude for your location. The best
source is the Internet. Another source may be your local town hall.
Map Blast provides this information at the following link:
www.mapblast.com
-21-
09/20/02
Virtual Weather Station User's Guide
To convert the decimal notation to degree notation, select the longitude and latitude link after the
decimal notation is displayed.
6.7.2 Time Zone
The time zone is required for calculating the sunrise, sunset, moonrise and moonset. If you live
in a time zone that does not adhere to the GMT standard and is offset by 30 minutes, enter the
offset in the +Time Zone Offset (min) numerical field.
If the daylight savings time is not calculated properly by your Windows operating system, you
can compensate by adding or subtracting 60 minutes.
The celestial calculator is a close approximation of the sunrise and sunset in your location and
may be inaccurate by several minutes due to equation inaccuracy or your altitude (the equations
are based on sea- level).
6.7.3 Altitude
An air data calculator is included in Virtual Weather Station. Virtual Weather Station uses the
same formulas used in airplane data computers flying throughout the world. The altitude and air
data information provides air density, pressure altitude, corrected temperature and pressure to
sea-level conditions.
6.7.4 Air Data Calculator (correcting Pressure to Sea-level Conditions)
To compare pressure conditions from one location to another, meteorologists correct pressure to
sea-level conditions. Because the air pressure decreases as you rise in altitude, the sea- level
corrected pressure (the pressure your location would be at if located at sea-level) is generally
higher than your measured pressure. Thus, your pressure may read 28.62 inHg (969 mb) at an
altitude of 1000 feet (305 m), but the corrected pressure is 30.00 inHg (1016 mb).
The standard sea-level pressure is 29.92 in Hg (1013 mb). Pressure conditions greater than 29.92
inHg (1013 mb) are considered high pressure and less than are considered low pressure.
Most weather stations instruct you to find a reporting station near your location to identify the
corrected pressure, but Virtual Weather Station calculates this offset for you.
To calculate this offset:
•
Enter your altitude
•
Virtual Weather Station displays your bias with respect to sea- level.
•
Enter this bias in your weather station (see the weather station instruction manual for
details).
Sea-level temperature is important to racing enthusiasts and engineers for calculating
-22-
09/20/02
Virtual Weather Station User's Guide
performance characteristics.
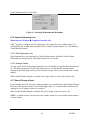
6.7.5 Celestial Calendar
Virtual Weather Station includes a celestial calendar for calculating sunrise, sunset, moonrise
and moonset times. You can calculate these times for any calendar date.
Figure 11 - Station Settings (Location and Altitude)
6.8
Real-time Data
Virtual Weather Station continuously collects data from your weather station. The sample rate
varies based on your weather station's specifications. See your weather station user manual for
specifics on the sample rate.
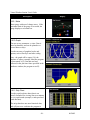
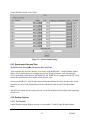
6.9
Weather Displays
Table 3 provides a list of the weather displays and a description of each display.
-23-
09/20/02
Virtual Weather Station User's Guide
Description
Display
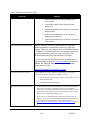
6.9.1 Icon (WM-918, WMR-918 and
WMR-968 only)
Weather conditions based on weather station
prediction. Switches from day to night based
on sunrise and sunset times.
6.9.2 Broadcast
TV broadcast display. Logo and location name
can be modified by selecting right- mouse click
on display.
6.9.3 Color Spectrum
Color bars change color based on adjustable
color spectrum. Displays daily high, low and
current value. Rate of change arrow represents
rising, falling or steady.
6.9.4 High / Low Display
Simple daily high and low display. Displays
daily high, low and current value. Rate of
change arrow represents rising, falling or
steady.
6.9.5 Distribution Chart
Pie chart displays historical distribution. Range
values are adjustable.
Note - the chart will be empty if (1) the
database is empty (example, when the program
is first started, or (2) Data has not been
collected in the plot time frame specified in the
attributes window (the program was off).
-24-
09/20/02
Virtual Weather Station User's Guide
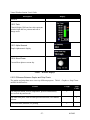
Description
Display
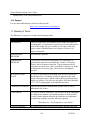
6.9.6 Wind Direction
Displays current wind direction. Display fills
clockwise from the North.
6.9.7 Thermometer
Thermometer gauge with rate of change arrow
and high / low pointers.
6.9.8 Gauge
Rotary gauge with rate of change arrow. If the
maximum limit of the gauge is exceeded, the
gauge displays a red alarm box.
-25-
09/20/02
Virtual Weather Station User's Guide
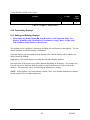
Description
Display
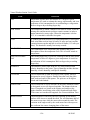
6.9.9 Meter
Meter gauge with rate of change arrow. If the
maximum limit of the gauge is exceeded, the
gauge displays a red alarm box.
6.9.10 Graph
Plot one or two parameters vs. time. Data is
based on database, and can be plotted over
several hours or days.
Provides an array of graphical styles and
options, such as line style and auto scaling.
Note - the graph will be empty if (1) the
database is empty (example, when the program
is first started, or (2) Data has not been
collected in the plot time frame specified in the
attributes window (the program was off)..
6.9.11 Strip Chart
Provides rapid real- time data (data is not
stored). Intended for viewing data over minutes
to view rapid trends (example, wind speed and
wind direction).
The strip chart does not store historical data,
and will start over each time the program is
launched.
-26-
09/20/02
Virtual Weather Station User's Guide
Description
Display
launched.
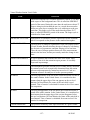
6.9.12 Tank
Colorful display fills based on color spectrum.
Includes high and low pointers and rate of
change arrow.
6.9.13 Alpha Numeric
Simple alphanumeric display.
6.9.14 Moon Phase
Current Moon phase or moon day.
Table 3 - Weather Displays
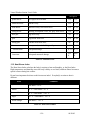
6.9.15 Difference Between Graphs and Strip Charts
The graphs and strip charts serve two very different purposes. Table 4 - Graphs vs. Strip Charts
outlines the differences:
Feature
Graph
Plot long term trends, such as temperature, pressure and humidity
over several days and weeks.
Strip
Chart
ü
ü
Plot short term plots, such as wind speed and direction, over minutes
or hours
ü
Uses stored data (database) for plotting
-27-
09/20/02
Virtual Weather Station User's Guide
Feature
Graph
Strip
Chart
ü
Loses data after program is restarted
Table 4 - Graphs vs. Strip Charts
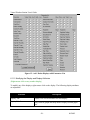
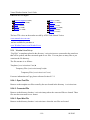
6.10 Customizing Displays
6.11 Adding and Deleting Displays
•
Menu Shortcut: Modify Display u Icon, Broadcast, Color Spectrum, High / Low
Display, Wind Direction, Distribution, Thermometer, Gauge, Meter, Graph, Strip
Chart, Ribbon, Alpha Numeric, Moon Phase
The desktop can be completely customized, including size and location of the displays. You can
choose hundreds of different display combinations.
Select the display type and parameter from the menu bar, and the display will be added to (or
deleted from) the desktop.
Right-mouse-click on the display to modify the individual display attributes.
Note that some of the check boxes will be dimmed depending on the display. For example, the
Forecast can not be displayed from the graphs or strip charts because it is not saved in the
database. All parameters can be viewed using the alphanumeric display.
NOTE - Sensor options vary from station to station. Check your Weather Station user's manual
for the complete list of weather parameters.
-28-
09/20/02
Virtual Weather Station User's Guide
Figure 12 - Add / Delete Displays with Parameter List
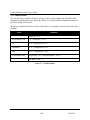
6.11.1 Modifying the Display and Display Attributes
{Right- mouse-click on any weather display}
To modify any of the displays, right- mouse-click on the display. The following display attributes
are adjustable:
Attribute
Description
Display Title
Display Tit le can be modified for each display
Display Title 2
Only valid for graphs and strip charts. Displays second graph
title.
-29-
09/20/02
Virtual Weather Station User's Guide
Attribute
Description
Title Color
Changes the title color.
Title Color 2
Only valid for graphs and strip charts. Changes the title 2
color.
Lower Limit
Lower display numerical limit.
Upper Limit
Upper display numerical limit.
Precision
Numbers left of the decimal point. For example, a precision of
zero is 76, a precision of 2 is 76.03.
Background Color
The display background color.
Number Color
The number color for all of the numbers in the display
Frame Color
Weather display frame color
Needle Color
Needle color for meter and rotary gauge
Fill Color
Fill color for gages and graphs
Frame Width
The width of the frame
Scale
Adjusts weather display size. If the scale is 100%, changing
the display size from the desktop will not resize the contents. If
the scale is not 100%, changing the size from the desktop will
resize contents.
Autoscale Plot
Auto scale y-axis on graphs and charts
Plot Previous x hours (or
minutes)
Plots previous number of hours for graphs and minutes for
strip charts,. If unchecked, graphs all of the data in your
database.
Plot Style
Customize different plotting styles for graphs and strip charts
(thin line, fat line, vertical fill, step)
Add second plot
Adds a second plot to the graph or strip chart.
Plot Color
Specify plot color for both plots
Grid Color
Specify grid color
Jpeg Filename
Each graphical element has a specific jpeg filename when this
option is activated. Provides a reference for each specific jpeg
-30-
09/20/02
Virtual Weather Station User's Guide
Attribute
Description
filename. For more information on jpeg files, reference Jpeg
Files.
X and Y Gridlines
Change the number of gridlines displayed on graphs and strip
charts.
Figure 13 - Display Attributes
6.11.2 Broadcast Display Settings
Menu Shortcut: Modify Display u Broadcast Display
The broadcast display can be customized with your own logo image and title. To view the
broadcast display settings, right- mouse-click on the broadcast panel.
-31-
09/20/02
Virtual Weather Station User's Guide
6.11.2.1
Displaying the Icon
The icon can be displayed on the Broadcast display. To specify the method for updating the icon,
select the Icon Settings Button.
6.11.2.2
Changing the Background Image
A custom image can be displayed in the broadcast display.
6.11.2.3
Changing the Logo Image
The default logo image is for Ambient. This can be customized to include your own personal
logo.
6.11.2.4
Web Cams, Weather Cams and Dynamic Images
WebCams or WeatherCams can be displayed in the broadcast panel. To display a WeatherCam
image, a software package such as WebCam32 or ISpy is required to generate jpeg images. The
images are then imported into Virtual Weather Station by defining the path to where the files are
located. The images can be viewed as a still frame or a time lapse, providing a summary of
weather over the course of the day.
6.11.2.4.1 Displaying the WeatherCam Image in the Broadcast Panel
To display the WeatherCam image in the Broadcast panel, launch WeatherCam32 or ISpy and
begin automatically generating the jpg image. Once this image is created and automatically
updated, browse to the location on your hard drive by selecting the Browse button in the
Broadcast Panel.
6.11.2.4.2 Sizing the Image
The image can be sized to fit inside the control, or the control can be resized to fit the image size.
Select the Size Control to Image pull down menu.
6.11.2.4.3 Image Time Stamp
To display the last update time of the WeatherCam image, select the Image Time Stamp
checkbox.
6.11.2.4.4 Daytime Update Only
Since nighttime WeatherCam images can be uneventful, select this checkbox to stop updating the
WeatherCam image at night.
6.11.2.4.5 Time Lapse
A time lapse of the WeatherCam image can be displayed. Select the Time Lapse checkbox, the
-32-
09/20/02
Virtual Weather Station User's Guide
lapse rate and the number of images in the time lapse. Note that the time lapse feature can only
be viewed on the computer and not over the Internet.
6.11.2.4.6 Reset Display at Midnight
Memory leaks may occur with some operating systems when updating images. To reset memory at
midnight, select the checkbox and the panel will be discarded and reloaded.
Figure 14 - Broadcast Display Attributes
6.12 General Display Settings
•
Menu Shortcut: Modify Display u General Display Settings
General display settings change all of the display settings at the same time. Reference Table 5 General Display Settings.
-33-
09/20/02
Virtual Weather Station User's Guide
Display Setting
Description
Time and Date Display
Specify date and 24-hour vs. 12 hour format
Background Color
Specify the display panel background color
Font Settings
Changes the font setting for all of the displays.
Display Colors
Changes all of the display colors at the same time.
Language Preference
Virtual Weather Station provides limited foreign
language support. To change the titles to the language of
choice, edit each individual display.
Scroll Display
Ideal for monitoring the display on a television or closed
circuit.
You can display weather images on the entire desktop
and automatically scroll.
Snap to Grid Pixels
Specify the grid resolution for aligning the weather
display images.
Average Display Preferences
Allows you to chose between a one hour filtered
average, the daily average, the monthly average or the
yearly average on the display.
Table 5 - General Display Settings
6.12.1 Full Screen Display
To use the full screen display, double click anywhere on the background of the desktop (other
than a weather element). To return to the normal display, hit any key.
-34-
09/20/02
Virtual Weather Station User's Guide
Figure 15 - General Display Settings
6.13 Database
Menu Shortcut: Settings u Database Settings
Virtual Weather Station generates a database for storing data for plotting and graphing. This data
is stored in a comma separated file located in the following directory path:
\VWS\data\dbase.csv
where csv stands for "comma separated value". This database can be viewed, edited and deleted.
6.13.1 Database Timer
A database timer allows you to customize how often data is written to the database. The
database is limited to 20,000 records, so the recommended minimum database timer is 10
minutes.
Once the database reaches 20,000 records, is automatically resized to 15,000 records. A backup
record of the database is stored in the following file:
\VWS\data\yyyydbase.csv
-35-
09/20/02
Virtual Weather Station User's Guide
where yyyy is the current year.
If the database is damaged or deleted, simply rename the backup database.
6.13.2 Database Format
The database format is outlined in Table 6 – Database Format.
-36-
09/20/02
Virtual Weather Station User's Guide
Column
Number
1
Parameter
Date, with the following
format:
Column
Number
Parameter
28
Vapor Pressure
29
Wind Direction Rate (per
hour)
YyyyMonthDayHourMinute
2
Wind Direction
30
Wind Speed Rate
3
Wind Speed
31
Wind Gust Rate
4
Wind Gust
32
Indoor Humidity Rate
5
Indoor Humidity
33
Outdoor Humidity Rate
6
Outdoor Humidity
34
Indoor Temperature Rate
7
Indoor Temperature
35
Outdoor Temperature
Rate
8
Outdoor Temperature
9
Barometric Pressure
36
Barometric Pressure Rate
37
Total Rain Rate
38
Channel 1 Temperature
Rate
Column
Number
Parameter
Scientific Only)
55
Rain Rate (Oregon
Scientific Only)
56
Wind Run Daily
57
Degree Days Heating
Daily
58
Degree Days Cooling
Daily
59
Moon phase
60
Monthly Rain
61
Degree Days Heating
Monthly
62
Degree Days Cooling
Monthly
63
Wind Run Monthly
64
Degree Days Heating
Yearly
10
Total Rain
11
Channel 1 Temperature
12
Channel 1 Humidity
39
Channel 1 Humidity Rate
13
Channel 2 Temperature
40
Channel 2 Temperature
Rate
65
Degree Days Cooling
Yearly
14
Channel 2 Humidity
41
Channel 2 Humidity Rate
66
Wind Run Yearly
15
Channel 3 Temperature
42
16
Channel 3 Humidity
Channel 3 Temperature
Rate
17
Evapotranspiration
43
Channel 3 Humidity Rate
18
UV Index
44
Evapotranspiration Rate
19
Solar Radiation
45
UV Index Rate
20
Wind Chill
46
Solar Radiation Rate
21
Indoor Heat Index
47
Wind Chill Rate
22
Outdoor Heat Index
48
Indoor Heat Index Rate
23
Dew Point
49
Outdoor Heat Index Rate
24
Sea-level Barometric
Pressure
50
Dew Point Rate
51
25
Cloud Base
Sea-level Barometric
Pressure Rate
26
Air Density
52
Rain Daily
27
Virtual Temperature
53
Rain Hourly
54
Yesterday Rain (Oregon
Scientific Only)
-37-
Table 6 – Database
Format
09/20/02
Virtual Weather Station User's Guide
6.13.3 Editing and Deleting Database Records
You can recall and edit any of the database records by date or record number. Once you retrieve
a database record, the data can be edited to correct errors.
6.13.4 Resizing the Database
To resize the database, select the Resize Database number. Decreasing the database size can
improve the operating speed of Virtual Weather Station.
Figure 16 - Database Settings
6.14 Jpeg Files
Menu Shortcut: Settings u Jpeg File Settings
Jpeg is a standard image format for web pages. Virtual Weather Station periodically creates jpeg
-38-
09/20/02
Virtual Weather Station User's Guide
images for inclusion in your web page, providing real time weather conditions which can be
viewed from a web browser.
You can only generate jpeg images for weather displays currently on your desktop.
6.14.1 Image Quality
You can adjust the image quality of the jpeg image. Increasing the quality increases the file size.
In general, the image quality is the same for 80 - 100%. The recommended quality is 80%.
6.14.2 Jpeg File Location
Specifies where the jpeg files are saved. For web server applications, save in the web server root
directory.
6.14.3 Jpeg File Naming Convention
To view the filename for the jpeg image, right-mouse-click on the weather display and the jpeg
filename will be displayed.
For example, the jpeg filename for the Outdoor Temperature Spectrum is wc007.jpg
Figure 17 - Jpeg File Settings
-39-
09/20/02
Virtual Weather Station User's Guide
6.15 Advanced Parameter Settings
Menu Shortcut: Settings u Advanced Parameter Settings
Virtual Weather Station provides the following advanced parameter settings.
6.15.1 Degree Days Heating and Cooling
Because temperature plays an important part in the rate of development of plants and many pests,
a measurement which takes into account the accumulation of heat with passing time is important
to predict maturation. Degree-days provide a measure for calculating the effects of temperature
on the development of plants or pests.
One degree-day is the amount of heat which accumulates when the temperature remains one
degree above the threshold for one day. One degree day is also the amount of heat which
accumulates when the temperature is 24 degrees above the threshold for one hour.
6.15.1.1
Heating Threshold
The threshold for calculating degree-days heating.
6.15.1.2
Cooling Threshold
The threshold for calculating degree-days cooling.
6.15.2 Wind Run
Wind run is the distance wind has traveled. For example, the wind run for a constant wind speed
of 20 mph for 2 hours is 40 miles, or:
Wind Run = Wind Speed * Time
6.15.3 Pressure Trend
Your station may not calculate the pressure trend. Virtual Weather Station will calculate the
pressure trend based on your own specified threshold. If the rate of change of pressure is above
this threshold, Virtual Weather Station will report rising pressure. If the rate of change of
pressure is below this threshold, Virtual Weather Station will report falling pressure.
6.15.4 Setting Daily and Monthly Rain
You can reset the daily and monthly rain. Note the Davis daily and monthly rain must be set
directly from the console.
6.15.5 Wind Gust Calculation
Each weather station uses a different method for calculating wind gust. You can override your
-40-
09/20/02
Virtual Weather Station User's Guide
station’s default method and select the maximum within a specified number of samples.
6.15.6 Filtered Average Time Constant
The time constant for the filtered average can be varied. The filter is based on a low pass filter
differential equation. The output value reaches 63% of the input value after one time constant
(the default time constant is 60 minutes or one hour), and will reach 95% of the input value after
five time constants (default = 300 minutes or five hours).
6.15.7 New Wind Chill Calculation
On November 1, 2001, the National Weather Service (NWS) implemented a replacement Wind
Chill Temperature (WCT) index for the 2001/2002 winter season. The reason for the change was
to improve upon the current WCT Index used by the NWS and the Meteorological Services of
Canada (MSC, the Canadian equivalent of the NWS), which was based on the 1945 Siple and
Passel Index.
The new formula made use of advances in science, technology, and computer modeling to
provide a more accurate, understandable, and useful for calculating the dangers from winter
winds and freezing temperatures. In addition, clinical trials have been conducted and the
results of those trials have been used to verify and improve the accuracy of the ne w formula.
Standardization of the WCT Index among the meteorological community is important, so that
an accurate and consistent measure is provided and public safety is ensured. Our goal was to
implement the new wind chill formula in Canada and the United States during the same time
frame in order to have a consistent WCT Index for North America.
Specifically, the new WCT index will:
•
use calculated wind speed at an average height of five feet (typical height of an adult
human face) based on readings from the national standard height of 33 feet (typical
height of an anemometer);
•
be based on a human face model;
•
incorporate modern heat transfer theory (heat loss from the body to its surroundings,
during cold and breezy/windy days);
•
lower the calm wind threshold to 3 mph;
•
use a consistent standard for skin tissue resistance; and
•
assume no impact from the sun (i.e. clear night sky).
Virtual Weather Station allows you to use the old or new wind chill models. For more
information, please reference the National Weather Service:
http://205.156.54.206/om/windchill/index.shtml
-41-
09/20/02
Virtual Weather Station User's Guide
6.15.8 Use Channel 1 As Outdoor Temperature
Some weather stations (example, Texas Weather Instruments, Columbia Weather Systems and
Oregon Scientific) exchange Channel 1 Temperature for Outdoor Temperature. In these special
cases, Virtual Weather Station allows you to swap or interchange these parameters.
Figure 18- Advanced Parameter Settings
6.15.9 Resetting Daily Minimum and Maximum Values
Menu Shortcut: Settings u Reset Min and Max
You can reset the daily minimums and maximums at any time by selecting the OK button.
-42-
09/20/02
Virtual Weather Station User's Guide
Figure 19 - Resetting Minimums and Maximums
6.16 Complete Parameter List
Menu Shortcut: Window u Complete Parameter List
Table 7 provides a complete list of the parameters (1) measured by your weather station, (2)
calculated by your weather station and retrieved by Virtual Weather Station, or (3) calc ulated by
Virtual Weather Station.
6.16.1 Daily Highs and Lows
Daily highs and lows are calculated by Virtual Weather Station. Note that Virtual Weather
Station must be running for the daily highs and lows to be recorded.
6.16.2 Average Values
Average values for all of the weather parameters are calculated by Virtual Weather Station based
on a one hour time period. Like the daily highs and lows, Virtual Weather Station must be
running for the daily highs and lows to be recorded (average values are not stored in the weather
station).
When Virtual Weather Station is restarted, the average values are reset to the current value.
6.17 Rate of Change Values
Rate of change values for all of the weather parameters are calculated by Virtual Weather Station
based on a one hour time period. Like the daily highs and lows, Virtual Weather Station must be
running for rate of change values to be recorded.
When Virtual Weather Station is restarted, the rate of change values are reset to zero.
NOTE - Available sensors vary based on your weather station. See your weather station manual
for more details.
-43-
09/20/02
Virtual Weather Station User's Guide
No.
1
Parameter Name
Measured Calculated by Calculated by
by Station
Station
VWS
1 Wind Direction
ü
2 Wind Speed1
ü
3 Wind Gust2
ü
4 Indoor Humidity
ü
5 Outdoor Humidity
ü
6 Indoor Temperature
ü
7 Outdoor Temperature
ü
8 Barometric Pressure
ü
9 Total Rain
ü
10 Channel 1 Temperature3
ü
11 Channel 1 Humidity3
ü
12 Channel 2 Temperature3
ü
13 Channel 2 Humidity3
ü
14 Channel 3 Temperature3
ü
15 Channel 3 Humidity3
ü
16 Evapotranspiration4
ü
17 UV Index4
ü
18 Solar Radiation4
ü
or
ü
Wind Speed is displayed as wind gust on the weather station. See Section 6.8, Real-time Data for more details.
2
Wind Gust is calculated from the wind gust displayed on the weather station. See Section 6.8, Real-time Data for
more details.
3
Optional Sensor
4
Davis Instruments only
-44-
09/20/02
Virtual Weather Station User's Guide
No.
Parameter Name
Measured Calculated by Calculated by
by Station
Station
VWS
19 Wind Chill
ü
20 Indoor Heat Index
ü
21 Outdoor Heat Index
ü
22 Dew Point
ü
23 Sea-level Barometric Pressure
ü
24 Pressure Altitude
ü
25 Cloud Base Height
ü
26 Density Altitude
ü
27 Virtual Temperature
ü
28 Vapor Pressure
ü
29 Wind Direction Rate
ü
30 Wind Speed Rate
ü
31 Wind Gust Rate
ü
32 Indoor Humidity Rate
ü
33 Outdoor Humidity Rate
ü
34 Indoor Temperature Rate
ü
35 Outdoor Temperature Rate
ü
36 Barometric Pressure Rate
ü
37 Total Rain Rate
ü
38 Channel 1 Temperature Rate 3
ü
39 Channel 1 Humidity Rate 3
ü
40 Channel 2 Temperature Rate 3
ü
41 Channel 2 Humidity Rate 3
ü
-45-
09/20/02
Virtual Weather Station User's Guide
No.
Parameter Name
Measured Calculated by Calculated by
by Station
Station
VWS
42 Channel 3 Temperature Rate 3
ü
43 Channel 3 Humidity Rate 3
ü
44 Evapotranspiration Rate 4
ü
45 UV Index Rate 4
ü
46 Solar Radiation Rate 4
ü
47 Wind Chill Rate
ü
48 Indoor Heat Index Rate
ü
49 Outdoor Heat Index Rate
ü
50 Dew Point Rate
ü
51 Sea-level Barometer Rate
ü
52 Wind Direction Avg.
ü
53 Wind Speed Avg.
ü
54 Wind Gust Avg.
ü
55 Indoor Humidity Avg.
ü
56 Outdoor Humidity Avg.
ü
57 Indoor Temperature Avg.
ü
58 Outdoor Temperature Avg.
ü
59 Barometric Pressure Avg.
ü
60 Total Rain Avg.
ü
61 Channel 1 Temperature Avg.3
ü
62 Channel 1 Humidity Avg.3
ü
63 Channel 2 Temperature Avg.3
ü
64 Channel 2 Humidity Avg.3
ü
-46-
09/20/02
Virtual Weather Station User's Guide
No.
Parameter Name
Measured Calculated by Calculated by
by Station
Station
VWS
65 Channel 3 Temperature Avg.3
ü
66 Channel 3 Humidity Avg.3
ü
67 Evapotranspiration Avg 4
ü
68 UV Index Avg 4
ü
69 Solar Radiation Avg 4
ü
70 Wind Chill Avg.
ü
71 Indoor Heat Index Avg.
ü
72 Outdoor Heat Index Avg.
ü
73 Dew Point Avg.
ü
74 Sea-level Barometer Avg.
ü
75 Wind Direction Daily High
ü
76 Wind Speed Daily High
ü
77 Wind Gust Daily High
ü
78 Indoor Humidity Daily High
ü
79 Outdoor Humidity Daily High
ü
80 Indoor Temperature Daily High
ü
81 Outdoor Temperature Daily High
ü
82 Barometric Pressure Daily High
ü
83 Total Rain Daily High
ü
84 Channel 1 Temperature High3
ü
85 Channel 1 Humidity High3
ü
86 Channel 2 Temperature High3
ü
87 Channel 2 Humidity High3
ü
-47-
09/20/02
Virtual Weather Station User's Guide
No.
Parameter Name
Measured Calculated by Calculated by
by Station
Station
VWS
88 Channel 3 Temperature High3
ü
89 Channel 3 Humidity High3
ü
90 Evapotranspiration High4
ü
91 UV Index High4
ü
92 Solar Radiation High4
ü
93 Wind Chill Daily High
ü
94 Indoor Heat Index Daily High
ü
95 Outdoor Heat Index Daily High
ü
96 Dew Point Daily High
ü
97 Sea-level Barometer High
ü
98 Wind Direction Daily Low
ü
99 Wind Speed Daily Low
ü
100 Wind Gust Daily Low
ü
101 Indoor Humidity Daily Low
ü
102 Outdoor Humidity Daily Low
ü
103 Indoor Temperature Daily Low
ü
104 Outdoor Temperature Daily Low
ü
105 Barometric Pressure Daily Low
ü
106 Total Rain Daily Low
ü
107 Channel 1 Temperature Low3
ü
108 Channel 1 Humidity Low3
ü
109 Channel 2 Temperature Low3
ü
110 Channel 2 Humidity Low3
ü
-48-
09/20/02
Virtual Weather Station User's Guide
No.
Parameter Name
Measured Calculated by Calculated by
by Station
Station
VWS
111 Channel 3 Temperature Low3
ü
112 Channel 3 Humidity Low3
ü
113 Evapotranspiration Low
ü
114 UV Index Low
ü
115 Solar Radiation Low
ü
116 Wind Chill Daily Low
ü
117 Indoor Heat Index Daily Low
ü
118 Outdoor Heat Index Daily Low
ü
119 Dew Point Daily Low
ü
120 Sea-level Barometer Low
ü
121 Daily Rain
ü
122 Hourly Rain
ü
123 Yesterday Rain
ü
124 Rain Rate
ü
125 Daily Wind Run
ü
126 Daily Degree Days Heating
ü
127 Daily Degree Days Cooling
ü
128 Moon Phase
ü
129 Monthly Rain
ü
130 Monthly Degree Days Heating
ü
131 Monthly Degree Days Cooling
ü
132 Monthly Wind Run
ü
133 Yearly Degree Days Heating
ü
-49-
09/20/02
Virtual Weather Station User's Guide
No.
Parameter Name
Measured Calculated by Calculated by
by Station
Station
VWS
134 Yearly Degree Days Cooling
ü
135 Yearly Wind Run
ü
136 Stress Index
ü
137 Comfort Index
ü
138 Forecast
ü
139 Pressure Condition (Rising/Falling)
ü5
140 Barometric Pressure Condition (Rising
/ Falling)
ü
141 Beaufort Scale
ü
142 Date
ü
143 Time
ü
144 Sunrise
ü
145 Sunset
ü
146 Moonrise
ü
147 Moonset
ü
Table 7 - Complete Parameter List
6.18 Daily, Monthly and Yearly Summary
Virtual Weather Station provides a daily, monthly and yearly summary. The high, low, averages
and integrated values are recorded as well as the time and date of the highs and lows. You can
edit the daily extremes. The summary data is independent of the database as described in Chapter
6.13 - Database.
6.18.1 Recalling the Daily, Monthly and Yearly Summary
Menu Shortcut: Settings u Recall Daily, Monthly and Yearly Archive
5
Reported by WM-918 and WX-200 weather stations only
-50-
09/20/02
Virtual Weather Station User's Guide
To recall the daily, you will be prompted for a file with the following format:
•
2001, which corresponds to the yearly extremes, averages and rates for the year 2001.
•
2001_10, which corresponds to the monthly extremes, averages and rates for October
2001.
•
2001_10_01, which corresponds to the daily extremes, averages and rates for October 1,
2001.
6.18.2 Daily Summary
Figure 20 - Daily Summary provides a daily summary of the high, low, average and integrated
(degree day and wind run) values for the day. The values can be changed by entering the new
number in the text field (with the exception of the predominant wind direction).
The display includes the number of samples for the day. This panel is updated every minute.
To review data from a previous date, enter the month, day and year in the Recall Archive
Record text field.
6.18.3 Monthly Summary
Provides a monthly summary of the high, low, average and integrated (degree day and wind run)
values for the month. The values can be changed by entering the new number in the text field
(with the exception of the predominant wind direction).
The display includes the number of samples for the month. This panel is updated hourly.
6.18.4 Yearly Summary
Provides a yearly summary of the high, low, average and integrated (degree day and wind run)
values for the year. The values can be changed by entering the new number in the text field (with
the exception of the predominant wind direction).
The display includes the number of samples for the year. This panel is updated hourly.
-51-
09/20/02
Virtual Weather Station User's Guide
Figure 20 - Daily Summary
6.18.5 Changing Daily, Monthly or Yearly Rain
The daily rain is calculated by subtracting the minimum daily rain from the maximum daily rain.
To change the daily, monthly or yearly rain, you must calculate the difference between the daily
maximum and minimum rain, and enter it in the minimum rain field.
The daily rain is stored by Virtual Weather Station as the difference between the maximum daily
rain and the minimum daily rain, or:
Daily Rain = Maximum Daily Rain - Minimum Daily Rain
To change the total rain, modify either the daily maximum rain or minimum rain field.
The same is true for monthly and yearly rain.
Note that changing the daily rain does not change the monthly or yearly rain automatically. You
must edit the monthly and yearly rain fields as well.
Your station is not capable of reporting daily rain, so Virtual Weather Station must be operating
24-hours per day to capture the total amount. Virtual Weather Station does calculate the total rain
-52-
09/20/02
Virtual Weather Station User's Guide
for yesterday, so this information can be entered on the next day.
6.19 Alarms and Memory (WM-918 and WX-200 only)
Menu Shortcut: Settings u Alarms and Memory
The WX-200 and WM-918 stations provide alarm and historical high and low data. The battery
status is also shown in this window.
Figure 21- Alarms and Memory (WM -918 and WX-200 only)
6.20 Alarms
Menu Shortcut: Settings u Alarms
NOTE: You must have a properly functioning sound card for this feature to work.
You can program Virtual Weather Station to play a wav sound, launch an executable or send an
EMail when a specific alarm condition occurs. For example, play a wind chime when the wind
speed limit is exceeded, a lightning sound when the rain rate is exceeded, or a bird chirp when
the temperature is high enough to open windows in the house. In addition, yo u can run an
executable or batch file when a condition is exceeded.
6.20.1 Alarm Settings
•
Parameter. Specify the alarm parameter
•
Condition. Specify the condition required for the alarm to sound.
-53-
09/20/02
Virtual Weather Station User's Guide
Example :
"Send an alarm when the Outside Temperature is less than 70.00"
Outside Temperature < 70.00
"Send an alarm when the Wind Speed is greater than 20.00"
Wind Speed > 20.00
•
Sound (Wav) or Exectutable (exe, com, bat) Filename . Specify the wav file to play or
the executable to run.
VWS includes sample wav files in the sounds sub-directory.
Reference Section 6.20.2 for details on launching executable or batch files.
•
Browse. Browse to the wav file location.
•
Alarm LED. LED Displays RED when the alarm condition is met. Otherwise, the
alarm LED will remain gray.
•
Alarm Timer. Specifies the frequency you wish to sound the alarm. The alarm is also
played at start-up.
6.20.2 Launching Executable or Batch Files
VWS starts running a program and returns without waiting for it to exit. The executable can be
either an MS DOS or MS Windows executable, including *.exe, *.com, *.bat and *.pif files.
If you need to execute a command built into command.com such as copy, dir, etc, you can call
"command.com /C DosCommand args",
where DosCommand is the shell command you want to be executed.
For example, "command.com /C copy c:\\temp\\file.tmp c:\\tmp" would copy file.tmp from the
temp directory to the tmp directory. Refer to your DOS documentation for further help with
command.com.
.exe, .com, and .bat DOS programs use the settings in default.pif (in your Windows directory)
when running. You can change their priority, display options, etc., by editing default.pif or by
creating another pif file. Refer to your Microsoft Windows documentation for help on creating
and editing pif files.
-54-
09/20/02
Virtual Weather Station User's Guide
Figure 22 - Alarm Sound Settings
6.21 Synchronize Date and Time
Menu Shortcut: Settings u Synchronize Date and Time
Your computer may lose time because of accuracy of the ROM BIOS. Virtual Weather Station
allows you to synchronize your computer clock to the Weather Station's clock automatically.
This is particularly useful because the WMR-918 and WMR-968 are equipped with the RF Clock
feature that synchronizes to the atomic clock (Europe only).
Check your WMR-918 / 968 Weather Station Instruction Manual for more details on this feature.
Note that you must be the Administrator for this function to work on an NT based machine.
Make
The WM-918 station does not report the year, so careful attention must be taken at the beginning
of each year.
6.22 Desktop Options
6.22.1 The Taskbar
Virtual Weather Station displays an icon on your taskbar. To hide Virtual Weather Station,
-55-
09/20/02
Virtual Weather Station User's Guide
double click the Virtual Weather Station icon on your taskbar. To display Virtual Weather
Station when hidden, double click on the Virtual Weather Station icon again.
6.22.2 The Toolbar
When minimized, Virtual Weather Station displays the following parameters on your toolbar:
Outdoor Temperature Outdoor Humidity Wind Direction @ Wind Speed
6.23 Rainwise Settings
The Rainwise Weather Station includes a programmable data logger. Reference Figure 23 Rainwise Settings. The following settings can be adjusted.
6.23.1 Sea-level Barometer Adjustment (418 MHz systems only)
The sea- level barometer setting can be adjusted in the Rainwise Computer Interface. In addition,
the barometer. You can also adjust the barometer in the calibration offset. See Section 6.2 for
more details.
6.23.2 Reset Barom to Absolute Pressure
Removes the sea-level offset adjustment
6.23.3 Reset Daily Min/Max Data
All minimum and maximum sensor values are set to the current sensor values and the current
time. Note that the minimum and maximum values are automatically logged to memory and
reset daily and midnight.
6.23.4 Reset Daily and Monthly Rainfall
Resets the daily and monthly rainfall in the logger's memory.
6.23.5 Reset Total Rainfall to Zero
Resets the total rainfall to zero in the logger's memory
6.23.6 Reset High Windspeed
Resets the high windspeed to zero in the logger's memory
6.23.7 Clear All Logged Data
Clears all of the data in the data logger's memory.
-56-
09/20/02
Virtual Weather Station User's Guide
6.23.8 No. Items Logged
The number of items logged (proceeded by the cursor prompt >).
6.23.9 Update Computer Interfaces Clock
Updates the computer interfaces clock, with the following format:
MMDDhhmmss
Where MM is month
DD is day
hh is hour (24 hour time)
mm is minute
ss is second
6.23.10
Increment Logging Interval
The computer interface switches to the next logging interval, and outputs the new value below.
1, 2, 5, 10, 15, 20, 30, or 60 minutes
6.23.11
Battery Voltage
Sensor package battery voltage
6.23.12
Version
EEPROM revision code for the interface and sensor package.
-57-
09/20/02
Virtual Weather Station User's Guide
Figure 23 - Rainwise Settings
6.24 Rainwise Data Logger
Your Rainwise Computer Interface is equipped with a Data Logger. Each time the program
starts, Virtual Weather Station downloads the data recorded since the last time the software
communicated to the Rainwise Computer Interface. Each recorded data point will be updated to
the display.
6.25 Vantage / Weather Link Settings
6.25.1 Vantage Pro Settings
Menu Shortcut: Settings u Vantage / WeatherLink Settings
The Davis weather station console can be programmed for calibration offsets, barometric
pressure sea- level correction, and setting date and time.
-58-
09/20/02
Virtual Weather Station User's Guide
Figure 24 – Vantage/WeatherLink Settings
6.25.2 Vantage / WeatherLink Highs and Lows
Menu Shortcut: Settings u Vantage Highs and Lows
The highs and lows are stored in the Davis weather station console. You can automatically reset
these highs and lows (Weather Monitor II and Weather Wizard III only) at a given time of day
based on the schedule.
-59-
09/20/02
Virtual Weather Station User's Guide
Figure 25 – Vantage / WeatherLink Recorded Highs and Lows
6.25.3 Vantage / WeatherLink Alarm Settings
Menu Shortcut: Settings u Vantage Alarm Settings
Davis weather station console audible alarms can be set and cleared.
-60-
09/20/02
Virtual Weather Station User's Guide
Figure 26 – Vantage / WeatherLink Alarms
6.26 CSV File Export
Real-time Data can be exported to a csv file for other programs to utilize. Two files are created:
•
data.csv – this file uses the native units as described in Figure 27 – CSV Output File
Format.
•
data2.csv – this file uses the converted units as specified by the user (example, °C for
temperature)
The data is formatted as follows:
1.00,2001,10,28,0,6,59,0,0,48,42,100,77,53,30,30.14,0.76,0.00,0,0,0,0,0,0,0,0
.00,0,0,53,77,53,53,0.000,52,0,0,0
Column
Identifier
Prototype
1
Csv File Version ID (XX.XX)
Floating Point
2
Year (yyyy format)
Integer
3
Month
Integer
4
Day
Integer
-61-
09/20/02
Virtual Weather Station User's Guide
Column
Identifier
Prototype
5
Hour (24-hour format)
Integer
6
Minute
Integer
7
Second
Integer
8
Wind speed (mph)
Floating Point
9
Wind Gust (mph)
Floating Point
10
Wind Direction (degrees)
Floating Point
11
Inside Humidity (%)
Floating Point
12
Outside Humidity (%)
Floating Point
13
Inside Temperature (°F)
Floating Point
14
Outside Temperature (°F)
Floating Point
15
Barometer (in)
Floating Point
16
Total Rain (in)
Floating Point
17
Daily Rain (in)
Floating Point
18
Hourly Rain (in)
Floating Point
19
Weather Condition, where:
Integer
0 = clear
1 = few clouds
2 = scattered clouds
3 = broken clouds
4 = overcast
5 = drizzle
6 = rain
7 = frozen rain
8 = showers
9 = mist
10 = tornado
11= fog
12 = smoke
13 = hail
14 = haze
15 = ice crystals
16 = sand
17 = snow grains
18 = snow
19 = snow showers
20 = lightning
21 = thundershowers
-62-
09/20/02
Virtual Weather Station User's Guide
Column
Identifier
Prototype
20
Channel 1 Temperature (WMR-968/WMR918 only)
Floating Point
21
Channel 1 Humidity (WMR-968/WMR-918
only)
Floating Point
22
Channel 2 Temperature (WMR-968/WMR918 only)
Floating Point
23
Channel 2 Humidity (WMR-968/WMR-918
only)
Floating Point
24
Channel 3 Temperature (WMR-968/WMR918 only)
Floating Point
25
Channel 3 Humidity (WMR-968/WMR-918
only)
Floating Point
26
Evapotranspiration (Vantage Pro Plus only)
Floating Point
27
UV Index (Vantage Pro Plus only)
Floating Point
28
Solar Radiation (Vantage Pro Plus only)
Floating Point
29
Wind Chill (° F)
Floating Point
30
Indoor Heat Index (° F)
Floating Point
31
Outdoor Heat Index (° F)
Floating Point
32
Dew Point (° F)
Floating Point
33
Rain Rate (in/hour)
Floating Point
34
Outdoor Temp Rate (° F/hr)
Floating Point
35
Indoor temp Rate (° F/hr)
Floating Point
36
Barometer Rate (in/hr)
Floating Point
37
Channel 1 Temp Rate (° F/hr)
Floating Point
38
Channel 2 Temp Rate (° F/hr)
Floating Point
39
Channel 3 Temp Rate (° F/hr)
Floating Point
Figure 27 – CSV Output File Format.
-63-
09/20/02
Virtual Weather Station User's Guide
6.27 Other Display Features
6.27.1 Minimizing the Program and Display
When the display is minimized, the title bar displays the outdoor temperature, humidity, wind
direction and windspeed on the taskbar.
Figure 28 – Minimized Taskbar Display
6.27.2 Hiding Virtual Weather Station
To hide Virtual Weather Station, double click on the Taskbar icon. To display after hiding,
double click on the taskbar.
Figure 29 – Virtual Weather Station Taskbar Icon
6.28 WeatherLink Automation (Davis Instruments only)
Menu Shortcut: Settings u WeatherLink / PCLink Automation
You can automatically download data to the WeatherLink program using Virtual Weather
Station. This assures that data is stored in both programs for users that wish to continue the
WeatherLink database.
Enter Your Station Directory, the location of the WeatherLink executable file, and select if you
want to automatically generate NOAA monthly and yearly summary reports within
WeatherLink.
Enter a scheduled time to automate the process.
-64-
09/20/02
Virtual Weather Station User's Guide
Figure 30 – WeatherLink Settings
6.29 WeatherVoice
Turn any PC into a Weather Report Telephone Call Center with Ambient’s WeatherVoice Plugin.
Anyone can keep up to date on your local weather, anywhere. Advertise your services, keep a
watchful eye on your home, cabin or business, indoors and out, with a simple phone line and
voice modem.
Ambient makes this possible with Virtual Weather Station’s Voice Generation System
http://www.weatherconnect.com/WeatherVoice
Virtual Weather Station’s WeatherVoice is a text to speech converter. WeatherVoice is
compatible with most text-to-speech voices.
-65-
09/20/02
Virtual Weather Station User's Guide
These text files can be automatically updated, inserting real- time weather conditions from your
weather station, or even forecasts and warnings from the National Weather Service.
With WeatherVoice, you can:
•
Use Virtual Weather Station’s File Tags to insert live weather conditions from your
weather station or your local METAR station into your outgoing answering message
•
Download from the Internet and insert any text file into the outgoing answering message
to provide weather forecasts and warnings
•
Use spoken audio files as background sounds on your website
•
Combine with a third party PC Auto Call Center to provide a complete PC-based phone
answering system. Keep up to date on your local weather, advertise your service, and stay
connected to the weather!
6.29.1 What you Need to Get Started
You need the following to create a sophisticated Weather Reporting Call Center:
•
A personal weather station, or Internet connection to over 7,000 METAR weather
stations around the world
•
Ambient’s Virtual Weather Station Base, Pro or Internet Edition
•
Ambient’s WeatherVoice Plug- in
•
A Voice Modem. Most modems provide Voice/Data/Fax
•
A third party Call Center Software. We recommend Advanced Call Center:
http://www.voicecallcentral.com/advancedcallcenter.htm
6.29.2 Configuring WeatherVoice
WeatherFlash converts text files with “tags” into actual weather data, and then converts these
files into wav files, which can be played back on your computer or voice modem. “File Tags”
can also be inserted into the text file.
An example text file is as follows:
-66-
09/20/02
Virtual Weather Station User's Guide
Figure 31 - WeatherVoice Set-up
7 Virtual Weather Station Pro Edition
7.1
File Settings (Data Logging)
Menu Shortcut: Settings u File Settings
Virtual Weather Station includes a data logger, which provides a permanent record of your
weather data.
The data is stored in several file formats:
•
Report Format. Provides formatted data for viewing (daily file)
•
Comma Separated Data (csv) format. This format is for export to Microsoft Excel or other
analysis programs.
•
Archive Format. This format provides the highs, lows and average for the day, month and
year.
-67-
09/20/02
Virtual Weather Station User's Guide
7.1.1 Daily File
The Daily File is a text file stored in the following location:
\VWS\data\daily\daily.txt
This file is recreated every day. The file is formatted with data organized into fixed column
widths. This format is ideal for display purposes.
Since the file name never changes (daily.txt), it can be statically linked from web pages or other
files.
7.1.2 Date Stamped File
To create a new date stamped file every day, select this checkbox, as shown in Figure 34 - File
Settings. The data is stored in the following location:
\VWS\data\daily\yyyymmdd.txt
where yyyy is the year, mm is the month and dd is the day.
For example, data stored on May 9, 2000 is designated by the filename:
\VWS\data\20000509.txt
The date stamped format is the same as the daily.txt format.
7.1.3 Csv File
A csv file (comma separated file) is a standard format for reading data into Excel (for example).
Excel recognizes csv format and parses the data into separate columns.
To create a csv file, select the checkbox as shown in Figure 34 - File Settings.
The data is stored in the following location:
\VWS\data\csv\yyyymmdd.csv
where yyyy is the ye ar, mm is the month and dd is the day.
For example, data stored on May 9, 2000 is designated by the filename:
\VWS\data\csv\20000509.csv
7.1.4 Archive File
The archive text files consist of highs, lows and averages for archived data on a daily, monthly
and yearly basis. An example of this file is shown in Figure 32 – Archived Data Text File.
-68-
09/20/02
Virtual Weather Station User's Guide
Parameter
Wind Direction
Wind Speed
Wind Gust
In Humidity
Humidity
In Temp
Out Temp
Barometer
Total Rain
Ch 1 Temp
Ch 1 Humidity
Ch 2 Temp
Ch2 Humidity
Ch 3 Temp
Ch 3 Humidity
Wind Chill
In Heat Ix
Out Heat Ix
Dew Point
SL Barometer
Max
353
5.1
6.5
42
42
74.7
76.3
29.03
1.02
0.0
0
0.0
0
0.0
0
76.3
74.7
75.7
46.7
29.03
Max Time
4:31pm
3:08pm
2:42pm
2:18pm
4:11pm
4:46pm
2:18pm
2:18pm
2:18pm
2:18pm
2:18pm
2:18pm
2:18pm
2:18pm
2:18pm
2:18pm
4:46pm
2:18pm
4:11pm
2:18pm
Min
140
0.0
0.0
30
30
50.0
70.0
29.00
0.00
0.0
0
0.0
0
0.0
0
60.0
65.2
66.2
39.0
29.00
Min Time
4:11pm
2:18pm
3:09pm
3:09pm
3:09pm
3:09pm
3:09pm
3:09pm
2:18pm
2:18pm
2:18pm
2:18pm
2:18pm
2:18pm
2:18pm
3:09pm
3:09pm
3:09pm
3:09pm
4:49pm
Average
250
1.4
2.3
34
34
59.6
73.5
29.01
0.82
0.0
0
0.0
0
0.0
0
63.4
69.2
69.1
40.2
29.01
Figure 32 – Archived Data Text File
7.1.4.1 Daily Archive Files
The daily archive files are stored in the following location:
\VWS\data\archive\daily\dailyarc.txt
7.1.4.1.1 Previous Daily Files
1-5 day old daily files are stored as follows:
•
\VWS\data\archive\daily\daily_2.txt . Yesterdays daily archive file
•
\VWS\data\archive\daily\daily_3.txt. Two days ago
•
\VWS\data\archive\daily\daily_4.txt. Three days ago.
7.1.4.2 Monthly Archive Files
The daily archive files are stored in the following location:
\VWS\data\archive\monthly\monthlyarc.txt
7.1.4.3 Yearly Archive Files
The daily archive files are stored in the following location:
\VWS\data\archive\yearly\yearlyarc.txt
-69-
09/20/02
Virtual Weather Station User's Guide
7.1.5 Date Stamped Archive File
Date stamped archive files are ideal for storing historical data.
To create a new date stamped archive file every day, select this checkbox, as shown in Figure 34
- File Settings.
7.1.5.1 Date Stamped Archive Daily Files
The data is stored in the following location:
\VWS\data\archive\daily\yyyymmdd.txt
where yyyy is the year, mm is the month and dd is the day.
For example, data stored on May 9, 2000 is designated by the filename:
\VWS\data\archive\20000509.txt
The date stamped format is the same as the daily.txt format.
7.1.5.1.1 Previous Daily Files
1-5 day old daily files are stored as follows:
•
\VWS\data\archive\daily\daily_2.txt . Yesterdays daily text file
•
\VWS\data\archive\daily\daily_3.txt. Two days ago
•
\VWS\data\archive\daily\daily_4.txt. Three days ago.
7.1.5.2 Date Stamped Archive Monthly Files
The data is stored in the following location:
\VWS\data\archive\monthly\yyyymm.txt
where yyyy is the year, mm is the month.
For example, data stored on May, 2000 is designated by the filename:
\VWS\data\archive\20000.txt
The monthly stamped format is the same as the monthly.txt format.
7.1.5.3 Date Stamped Archive Yearly Files
The data is stored in the following location:
-70-
09/20/02
Virtual Weather Station User's Guide
\VWS\data\archive\daily\yyyy.txt
where yyyy is the year.
For example, data stored for the year 2000 is designated by the filename:
\VWS\data\archive\yearly\2000.txt
The year stamped format is the same as the yearly.txt format.
7.1.6 Summary Files
This file provides a summary of the average, high and low values for each parameter specified in
the File Parameter List (reference Section 7.1.8).
The file is stored in the following location:
\vws\data\summary\daysum.txt
An example is shown in Figure 33 – Example Daily Summary File.
Date
10/11/2001
10/12/2001
10/13/2001
10/14/2001
10/15/2001
10/16/2001
10/17/2001
10/18/2001
10/19/2001
10/20/2001
Humidity
%
78
52
35
60
68
73
78
75
83
90
Hi
%
100
100
76
95
100
100
100
100
100
100
Lo
%
29
8
13
14
15
21
24
16
27
64
Temp
°F
63
68
70
66
67
66
62
62
62
61
Hi
°F
82
86
90
92
91
87
82
82
83
74
Lo
°F
49
51
53
49
50
52
47
47
49
52
Figure 33 – Example Daily Summary File
7.1.7 File Update Timer
Specify the update or record rate of the data to file.
7.1.8 Create / Modify File List
Virtual Weather Station allows you to record over 90 different parameters. Select the parameters
for recording from this list.
-71-
09/20/02
Virtual Weather Station User's Guide
Figure 34 - File Settings
7.2
Climate Reports
There are two types of climate reports - monthly and yearly.
7.3
Monthly Climate Report
Menu Shortcut: Reports u Monthly Report
The monthly report consists of the following data for each day of the month:
•
Day. Each row in the report shows information for a single day. The date for each row
appears at the left of the row.
•
Mean Temp. The mean temperature for the day. At the bottom, the mean temperature
for the month is shown.
•
High and Time . The high temperature for the day and the time at which it occurred.
At the bottom of the column, the highest temperature recorded during the month and
the day on which it occurred is displayed.
•
Low and Time . The low temperature for the day and the time at which it occurred. At
the bottom of the column, the lowest temperature recorded during the month and the
day on which it occurred is displayed.
•
Heat Deg-Days. The number of heating degree-days accumulated on each day. At the
bottom of the column, the total heating degree-days accumulated during the month is
displayed.
-72-
09/20/02
Virtual Weather Station User's Guide
•
Cool Deg-Days. The number of cooling degree-days accumulated on each day. At the
bottom of the column, the total cooling degree-days accumulated during the month is
displayed.
•
Rain. The rainfall accumulated on each day. At the bottom of the column, the total
rainfall accumulated during the month is displayed.
•
Average Wind Speed. The average wind speed for the day. At the bottom of the
column, the average wind speed for the month is displayed.
•
High (Wind Speed) and Time . The high wind speed for the day and the time at which
it occurred. At the bottom of the column, the highest wind speed recorded during the
month and the day in which it occurred is displayed.
•
Dom Dir. The dominant wind direction for the day. At the bottom of the column, the
dominant wind direction recorded during the month is displayed.
7.3.1 Modifying the Monthly Climate Report
Menu Shortcut: Settings u Monthly Archive
To modify the monthly climate report, enter the month and year, and modify the stored values.
7.4
Yearly Climate Report
Menu Shortcut: Reports u Yearly Report
The yearly report consists of the following data for each month of the year:
•
Mon. Each row in the report shows information for a month day. The month for each
row appears at the left of the row.
•
Mean Temp. The mean temperature for the month. At the bottom, the mean
temperature for the year is shown.
•
High and Date. The high temperature for the month and the date at which it occurred.
At the bottom of the column, the highest temperature recorded during the year and the
day on which it occurred is displayed.
•
Low and Date. The low temperature for the month and the date at which it occurred.
At the bottom of the column, the lowest temperature recorded during the year and the
day on which it occurred is displayed.
•
Heat Deg-Days. The number of heating degree-days accumulated for each month. At
the bottom of the column, the total heating degree-days accumulated during the year is
displayed.
-73-
09/20/02
Virtual Weather Station User's Guide
•
Cool Deg-Days. The number of cooling degree-days accumulated for each month. At
the bottom of the column, the total cooling degree-days accumulated during the year is
displayed.
•
Rain. The rainfall accumulated for each month. At the bottom of the column, the total
rainfall accumulated during the year is displayed.
•
Average Wind Speed. The average wind speed for the month. At the bottom of the
column, the average wind speed for the year is displayed.
•
High (Wind Speed) and Date. The high wind speed for the month and the time at
which it occurred. At the bottom of the column, the highest wind speed recorded
during the year and the day in which it occurred is displayed.
•
Dom Dir. The dominant wind direction for the month. At the bottom of the column,
the dominant wind direction recorded during the year is displayed.
7.4.1 Modifying the Yearly Climate Report
Menu Shortcut: Settings u Yearly Archive
To modify the yearly climate report, enter the year, and modify the stored values.
7.5
Climate Report Text File and Printing Climate Reports
A text file is generated once per day for both the monthly and yearly climate report (or whenever
the window is opened for viewing). You can print this text file to create a permanent record of
this report.
The monthly text file is located at the following location:
\VWS\data\noaa\yyyy_mm.txt
where yyyy is the year and mm is the month.
The yearly text file is located at the following location:
\VWS\data\noaa\yyyy.txt
where yyyy is the year.
8 Virtual Weather Station Internet Edition
Virtual Weather Station Internet Edition features Email, FTP File Transfer, and HTTP file transfer.
You can automatically send files to an FTP server or automatically send e-mail when alarm conditions
occur.
-74-
09/20/02
Virtual Weather Station User's Guide
The software automatically converts display panels into jpeg images that any client using a World Wide
Web (WWW or Web) browser can access. The software is compatible with standard Web browsers and
requires no additional networking software or configuration.
Figure 35- General Description
Referencing the figure above, the weather station (1) communicates to your PC (2) through the serial
port. Virtual Weather Station displays graphics on your PC. The graphics are converted to jpeg files for
insertion into your web page. Virtual Weather Station uploads these jpeg files and html text files to your
remote web server (3) automatically based on a schedule you define. Weather information can also be
downloaded from an anonymous ftp server (4) and incorporated into your web page.
METAR data throughout the world can be downloaded and instantly displayed on your local computer.
In addition, VWS will upload data to free weather servers, such as the Weather Underground and
Hamweather.
8.1
Weather Website Builder
A weather website can be created in three simple steps. Virtual Weather Station includes predefined templates that can be automatically sent to your remote server.
To build your website in three simple steps:
1. Browse to your remote server location. You will need to enter the account information
-75-
09/20/02
Virtual Weather Station User's Guide
provided by your Internet service provider (ISP).
2. Define a schedule you would like the software to connect to the remote server by
selecting the Update Schedule button.
3. View the finished web pages by selecting the Web Page Template.
Menu Shortcut: Internet u Weather Website Builder
Figure 36– Weather Website Builder
8.2
Internet Features and Operation
The following section describes methods for displaying your weather data on the Internet or Intranet.
There are two primary ways to operate and display your data using Internet standards and protocols.
1.
Remote Server. Your Web Site is located on a remote server, and you periodically transfer or ftp
files. This is the most common application for Virtual Weather Station.
-76-
09/20/02
Virtual Weather Station User's Guide
2.
Non Internet Protocols on Local Area Network. Your computer is located on the Intranet, and
you simply transfer jpeg files to another location on the network without using ftp or web server
options.
The following sections outline settings for your specific application.
8.3
Remote Server Applications
For remote server applications, you will use the automated ftp features.
Virtual Weather Station periodically updates jpeg files, which are snapshots of the gauges and graphs
displayed on Virtual Weather Station's panels. These files are linked to an html page resident on your
remote server, and periodically transferred automatically.
Figure 37- Remote Web Server Configuration
8.4
Connecting to the Internet
Most Internet service providers provide the following features:
3.
A direct connection to the Internet
4.
A remote World Wide Web Server
5.
A remote Ftp Server
6.
A remote E-Mail (SMTP) Server
NOTE: You must have direct access to the Internet for Virtual Weather Station's automated
features to work. Connecting through a Service Provider such as America On Line (AOL)
will limit Virtual Weather Station's automated features.
Network Connection
8.5
To access the Networking Settings including dial-up networking, select [Settings][Network Connection]
from the menubar. Reference Figure 38 - Networking Connection Setup Panel.
There are three primary ways to connect to the Internet:
1.
Never Dial a Connection. Typically used for routers.
-77-
09/20/02
Virtual Weather Station User's Guide
8.6
2.
Use Default Connection. Connects using the defined default connection to the Internet.
Typically used for LAN and Proxy servers.
3.
Use Dial-up Networking. Uses Virtual Weather Station’s Remote Access Service (RAS) utilities
for Dial-up Networking. Typically used for telephone, DSL or cable modems.
Dial-up Connection
If you specify Use Dial-up Networking, the following settings are available.
8.6.1 Number of Dial-up Attempts
Defines the number of unsuccessful dial- up attempts per session.
8.6.2 Number of Seconds to Wait Between Attempts
The number of seconds between dial-up attempts. Allows some modems extended time to hang
the phone line.
8.6.3 Use the Following Dial-up Networking Connection
Select one of the dial-up networking connections defined in the Windows Dial- up Networking.
8.6.4 Username, Password and Domain
Dial- up networking account information.
8.6.5 Dial-up Automation
1. Stay Connected after Dial-up. Stays connected to the remote server after dial-up.
2. Disconnect after Internet Operation Complete. Disconnects from the remote server
after all internet operations are complete. Note that if you are already connected to the
Internet when the dial-up session is opened, Virtual Weather Station will not disconnect
from the remote server.
-78-
09/20/02
Virtual Weather Station User's Guide
Menu Shortcut: Internet u Network Connection
Figure 38 - Networking Connection Setup Panel
8.7
General FTP Settings
The following general FTP Settings allow you to control each FTP session.
8.7.1 FTP Timeout
The timeout period for each FTP operation.
-79-
09/20/02
Virtual Weather Station User's Guide
8.7.2 Successive Login Attempts
Number of successive attempts to login to the FTP server.
8.7.3 Maximum Connect Time
The maximum time period to remain connected to the server. This prevents extended
connections due to slow internet connections or failed connections.
8.7.4 Time Delay Between Transfers
Some servers can not accept immediate FTP commands. If you commonly receive system socket
errors, increase this timer.
8.7.5 Display Connect Timer
Displays the time in seconds that Virtual Weather Station will remain connected to the Internet
before timeout.
8.7.6 Max CPU During FTP
To speed up the ftp transfers (which may be important for dial- up applications), VWS resources
will automatically increase to the maximum allowable. This feature is particularly useful if FTP
transfers timeout.
8.7.7 FTP Priority
Sets the priority of the FTP program. Set this value to High Priority if you are having persistent
problems with FTP timeouts.
-80-
09/20/02
Virtual Weather Station User's Guide
Menu Shortcut: Internet u Network Connection
Figure 39 – General FTP Settings
8.8
Virtual Weather Station jpeg Images
When you start Virtual Weather Station for the first time and Virtual Weather Station negotiates
communication with your Weather Station, jpeg files are automatically created. The files can be found in
c:\vws\root (or the installation directory you specified). The filenames are structured as follows:
vws#.jpg
where # is a unique number designated for a specific gauge, graph or display panel.
The files can be created or updated when you define a display panel.
8.9
Jpeg File Index
The following table provides a complete list of jpg files generated by Virtual Weather Station. Numbers
shown are proceeded by vws and followed by .jpg.
For example, the Wind Direction Color Spectrum file is vws001.jpg.
-81-
09/20/02
Virtual Weather Station User's Guide
Indoor Temperature
006
Outdoor Temperature
007
Barometer
008
Total Rain
009
Channel 1 Temperature (WMR968/WMR-918)
010
Channel 1 Humidity (WMR968/WMR-918)
011
Channel 2 Temperature (WMR968/WMR-918)
012
Channel 2 Humidity (WMR968/WMR-918)
013
Channel 3 Temperature (WMR968/WMR-918)
014
Channel 3 Humidity (WMR968/WMR-918)
015
Evapotranspiration (Davis only)
016
UV Index (Davis only)
017
Solar Radiation (Davis only)
018
Wind Chill
019
Heat Index In
020
Heat Index Out
021
Dewpoint
022
Sea-level Barometer
023
Altitude Barometer
---
152
153
154
155
156
157
158
159
160
161
162
163
164
165
166
167
168
169
170
171
-------------
---
---
---
---
---
-------------------
Tank
005
---
Meter
Outdoor Humidity
151
Strip Chart
004
---
Distribution
Indoor Humidity
150
Moon Phase
003
---
Alpha Numeric
Gust
149
Graph
002
295
Gauge
Wind Speed
148
Thermometer
001
Wind Direction
Wind Direction
High/Low
Color Spectrum
Parameter / Display
442 589 736 883
--- 1177 1324 1471 1618
443 590 737 884
--- 1178 1325 1472 1619
444 591 738 885
--- 1179 1326 1473 1620
445 592 739 886
--- 1180 1327 1474 1621
446 593 740 887
--- 1181 1328 1475 1622
447 594 741 888
--- 1182 1329 1476 1623
448 595 742 889
--- 1183 1330 1477 1624
449 596 743 890
--- 1184 1331 1478 1625
450 597 744 891
--- 1185 1332 1479 1626
451 598 745 892
--- 1186 1333 1480 1627
452 599 746 893
--- 1187 1334 1481 1628
453 600 747 894
--- 1188 1335 1482 1629
454 601 748 895
--- 1189 1336 1483 1630
455 602 749 896
--- 1190 1337 1484 1631
456 603 750 897
--- 1191 1338 1485 1632
457 604 751 898
--- 1192 1339 1486 1633
458 605 752 899
--- 1193 1340 1487 1634
459 606 753 900
--- 1194 1341 1488 1635
460 607 754 901
--- 1195 1342 1489 1636
461 608 755 902
--- 1196 1343 1490 1637
462 609 756 903
--- 1197 1344 1491 1638
463 610 757 904
--- 1198 1345 1492 1639
464 611 758 905
--- 1199 1346 1493 1640
465 612 759 906
--- 1200 1347 1494 1641
-82-
09/20/02
Virtual Weather Station User's Guide
Wind Speed Rate
030
Gust Rate
031
Indoor Humidity Rate
032
Outdoor Humidity Rate
033
Indoor Temperature Rate
034
Outdoor Temperature Rate
035
Barometer Rate
036
Total Rain Rate
037
Channel 1 Temperature Rate
(WMR-968/WMR-918)
038
Channel 1 Humidity Rate (WMR968/WMR-918)
039
Channel 2 Temperature Rate
(WMR-968/WMR-918)
040
Channel 2 Humidity Rate (WMR968/WMR-918)
041
Channel 3 Temperature Rate
(WMR-968/WMR-918)
042
Channel 3 Humidity Rate (WMR968/WMR-918)
043
Evapotranspiration Rate (Davis
only)
044
UV Index Rate (Davis only)
045
Solar Radiation Rate (Davis only)
046
176
177
178
179
180
181
182
183
184
185
186
187
188
189
190
191
192
193
---------------------
---
---
---
---
---
---
-----
Tank
029
---
Meter
Wind Direction Rate
175
Strip Chart
---
---
Distribution
Vapor Pressure
174
Moon Phase
---
---
Alpha Numeric
Virtual Temperature
173
Graph
---
---
Gauge
Air Density
172
Thermometer
---
Wind Direction
Cloud Base
High/Low
Color Spectrum
Parameter / Display
466 613 760 907
--- 1201 1348 1495 1642
467 614 761 908
--- 1202 1349 1496 1643
468 615 762 909
--- 1203 1350 1497 1644
469 616 763 910
--- 1204 1351 1498 1645
470 617 764 911
--- 1205 1352 1499 1646
471 618 765 912
--- 1206 1353 1500 1647
472 619 766 913
--- 1207 1354 1501 1648
473 620 767 914
--- 1208 1355 1502 1649
474 621 768 915
--- 1209 1356 1503 1650
475 622 769 916
--- 1210 1357 1504 1651
476 623 770 917
--- 1211 1358 1505 1652
477 624 771 918
--- 1212 1359 1506 1653
478 625 772 919
--- 1213 1360 1507 1654
479 626 773 920
--- 1214 1361 1508 1655
480 627 774 921
--- 1215 1362 1509 1656
481 628 775 922
--- 1216 1363 1510 1657
482 629 776 923
--- 1217 1364 1511 1658
483 630 777 924
--- 1218 1365 1512 1659
484 631 778 925
--- 1219 1366 1513 1660
485 632 779 926
--- 1220 1367 1514 1661
486 633 780 927
--- 1221 1368 1515 1662
487 634 781 928
--- 1222 1369 1516 1663
-83-
09/20/02
Virtual Weather Station User's Guide
Wind Direction High
052
Wind Speed Average
053
Gust Average
054
Indoor Humidity Average
055
Outdoor Humidity Average
056
Indoor Temperature Average
057
Outdoor Temperature Average
058
Barometer Average
059
Total Rain Average
060
Channel 1 Temperature Average
(WMR-968/WMR-918)
061
Channel 1 Humidity Average
(WMR-968/WMR-918)
063
Channel 2 Temperature Average
(WMR-968/WMR-918)
063
Channel 2 Humidity Average
(WMR-968/WMR-918)
064
Channel 3 Temperature Average
(WMR-968/WMR-918)
065
Channel 3 Humidity Average
(WMR-968/WMR-918)
066
Evapotranspiration Average
(Davis only)
067
UV Index Average (Davis only)
068
Solar Radiation Average (Davis
only)
069
198
199
200
201
202
203
204
205
206
207
208
209
210
211
212
213
214
215
216
-----------------------
---
---
---
---
---
---
-----
Tank
051
---
Meter
Sea-level Barometer Rate
197
Strip Chart
050
---
Distribution
Dewpoint Rate
196
Moon Phase
049
---
Alpha Numeric
Heat Index Out Rate
195
Graph
048
---
Gauge
Heat Index In Rate
194
Thermometer
047
Wind Direction
Wind Chill Rate
High/Low
Color Spectrum
Parameter / Display
488 635 782 929
--- 1223 1370 1517 1664
489 636 783 930
--- 1224 1371 1518 1665
490 637 784 931
--- 1225 1372 1519 1666
491 638 785 932
--- 1226 1373 1520 1667
492 639 786 933
--- 1227 1374 1521 1668
493 640 787 934
--- 1228 1375 1522 1669
494 641 788 935
--- 1229 1376 1523 1670
495 642 789 936
--- 1230 1377 1524 1671
496 643 790 937
--- 1231 1378 1525 1672
497 644 791 938
--- 1232 1379 1526 1673
498 645 792 939
--- 1233 1380 1527 1674
499 646 793 940
--- 1234 1381 1528 1675
500 647 794 941
--- 1235 1382 1529 1676
501 648 795 942
--- 1236 1383 1530 1677
502 649 796 943
--- 1237 1384 1531 1678
503 650 797 944
--- 1238 1385 1532 1679
504 651 798 945
--- 1239 1386 1533 1680
505 652 799 946
--- 1240 1387 1534 1681
506 653 800 947
--- 1241 1388 1535 1682
507 654 801 948
--- 1242 1389 1536 1683
508 655 802 949
--- 1243 1390 1537 1684
509 656 803 950
--- 1244 1391 1538 1685
510 657 804 951
--- 1245 1392 1539 1686
-84-
09/20/02
Virtual Weather Station User's Guide
221
---
Tank
074
---
Meter
Sea-level Barometer Average
220
Strip Chart
073
---
Distribution
Dewpoint Average
219
Moon Phase
072
---
Alpha Numeric
Heat Index Out Average
218
Graph
071
---
Gauge
Heat Index In Average
217
Thermometer
070
Wind Direction
Wind Chill Average
High/Low
Color Spectrum
Parameter / Display
511 658 805 952
--- 1246 1393 1540 1687
512 659 806 953
--- 1247 1394 1541 1688
513 660 807 954
--- 1248 1395 1542 1689
514 661 808 955
--- 1249 1396 1543 1690
515 662 809 956
--- 1250 1397 1544 1691
Wind Direction High
---
---
---
---
---
---
---
---
---
---
---
---
Wind Speed High
---
---
---
---
---
---
---
---
---
---
---
---
Gust High
---
---
---
---
---
---
---
---
---
---
---
---
Indoor Humidity High
---
---
---
---
---
---
---
---
---
---
---
---
Outdoor Humidity High
---
---
---
---
---
---
---
---
---
---
---
---
Indoor Temperature High
---
---
---
---
---
---
---
---
---
---
---
---
Outdoor Temperature High
---
---
---
---
---
---
---
---
---
---
---
---
Barometer High
---
---
---
---
---
---
---
---
---
---
---
---
Total Rain High
---
---
---
---
---
---
---
---
---
---
---
---
Channel 1 Temperature High
(WMR-968/WMR-918)
---
---
---
---
---
---
---
---
---
---
---
---
Channel 1 Humidity High (WMR968/WMR-918)
---
---
---
---
---
---
---
---
---
---
---
---
Channel 2 Temperature High
(WMR-968/WMR-918)
---
---
---
---
---
---
---
---
---
---
---
---
Channel 2 Humidity High (WMR968/WMR-918)
---
---
---
---
---
---
---
---
---
---
---
---
Channel 3 Temperature High
(WMR-968/WMR-918)
---
---
---
---
---
---
---
---
---
---
---
---
Channel 3 Humidity High (WMR968/WMR-918)
---
---
---
---
---
---
---
---
---
---
---
---
Evapotranspiration High (Davis
only)
---
---
---
---
---
---
---
---
---
---
---
---
UV Index High (Davis only)
---
---
---
---
---
---
---
---
---
---
---
---
Solar Radiation High (Davis only)
---
---
---
---
---
---
---
---
---
---
---
---
-85-
09/20/02
Virtual Weather Station User's Guide
---
---
Heat Index In High
---
---
---
---
---
---
Heat Index Out High
---
---
---
---
---
---
Dewpoint High
---
---
---
---
---
---
Sea-level Barometer High
---
---
---
---
---
---
Wind Direction Low
---
---
---
---
---
---
Wind Speed Low
---
---
---
---
---
---
Gust Low
---
---
---
---
---
---
Indoor Humidity Low
---
---
---
---
---
---
Outdoor Humidity Low
---
---
---
---
---
---
Indoor Temperature Low
---
---
---
---
---
---
Outdoor Temperature Low
---
---
---
---
---
---
Barometer Low
---
---
---
---
---
---
Total Rain Low
---
---
---
---
---
---
Channel 1 Temperature Low
(WMR-968/WMR-918)
---
---
---
---
---
---
Channel 1 Humidity Low (WMR968/WMR-918)
---
---
---
---
---
---
Channel 2 Temperature Low
(WMR-968/WMR-918)
---
---
---
---
---
---
Channel 2 Humidity Low (WMR968/WMR-918)
---
---
---
---
---
---
Channel 3 Temperature Low
(WMR-968/WMR-918)
---
---
---
---
---
---
Channel 3 Humidity Low (WMR968/WMR-918)
---
---
---
---
---
---
Evapotranspiration Low (Davis
only)
---
---
---
---
---
---
UV Index Low (Davis only)
---
---
---
---
---
---
Solar Radiation Low (Davis only)
---
---
---
---
---
---
-86-
Tank
---
Meter
---
Strip Chart
---
Distribution
---
Moon Phase
Wind Chill High
Alpha Numeric
Graph
Gauge
Thermometer
Wind Direction
High/Low
Color Spectrum
Parameter / Display
975
---
---
---
---
---
976
---
---
---
---
---
977
---
---
---
---
---
978
---
---
---
---
---
979
---
---
---
---
---
980
---
---
---
---
---
981
---
---
---
---
---
982
---
---
---
---
---
983
---
---
---
---
---
984
---
---
---
---
---
985
---
---
---
---
---
986
---
---
---
---
---
987
---
---
---
---
---
988
---
---
---
---
---
989
---
---
---
---
---
990
---
---
---
---
---
991
---
---
---
---
---
992
---
---
---
---
---
993
---
---
---
---
---
994
---
---
---
---
---
995
---
---
---
---
---
996
---
---
---
---
---
997
---
---
---
---
---
09/20/02
Virtual Weather Station User's Guide
---
---
Heat Index In Low
---
---
---
---
---
---
Heat Index Out Low
---
---
---
---
---
---
Dewpoint Low
---
---
---
---
---
---
Sea-level Barometer Low
---
---
---
---
---
---
Daily Rain
---
---
---
---
---
---
Hourly Rain
---
---
---
---
---
---
Yesterday Rain
---
---
---
---
---
---
Rain Rate
---
---
---
---
---
---
Wind Run
---
---
---
---
---
---
Degree Days Heating
---
---
---
---
---
---
Degree Days Cooling
---
---
---
---
---
---
Moon Phase
---
---
---
---
---
---
Monthly Rain
---
---
---
---
---
---
Deg Days Heating Month
---
---
---
---
---
---
Deg Days Cooling Month
---
---
---
---
---
---
Wind Run Month
---
---
---
---
---
---
Deg Days Heating Year
---
---
---
---
---
---
Deg Days Cooling Year
---
---
---
---
---
---
Wind Run Year
---
---
---
---
---
---
Heat Stress
---
---
---
---
---
---
Comfort Level
---
---
---
---
---
---
Forecast
---
---
---
---
---
---
Barom Trend
---
---
---
---
---
---
Pressure Trend
Beaufort Scale
-----
-----
-----
-----
-87-
-----
-----
Tank
---
Meter
---
Strip Chart
---
Distribution
---
Moon Phase
Wind Chill Low
Alpha Numeric
Graph
Gauge
Thermometer
Wind Direction
High/Low
Color Spectrum
Parameter / Display
998
---
---
---
---
---
999
---
---
---
---
---
1000
---
---
---
---
---
1001
---
---
---
---
---
1002
---
---
---
---
---
1003
---
---
---
---
---
1004
---
---
---
---
---
1005
---
---
---
---
---
1006
---
---
---
---
---
1007
---
---
---
---
---
1008
---
---
---
---
---
1009
---
---
---
---
---
---
---
---
---
1010 1151
1011
---
---
---
---
---
1012
---
---
---
---
---
1013
---
---
---
---
---
1014
---
---
---
---
---
1015
---
---
---
---
---
1016
---
---
---
---
---
1017
---
---
---
---
---
1018
---
---
---
---
---
1019
---
---
---
---
---
1020
---
---
---
---
---
1021
---
---
---
---
---
1022
---
---
---
---
---
---
---
---
---
1023 ---
09/20/02
Virtual Weather Station User's Guide
---
---
Time
---
---
---
---
---
---
Sunrise
---
---
---
---
---
---
Sunset
---
---
---
---
---
---
Moonrise
---
---
---
---
---
---
Moonset
---
---
---
---
---
---
Windspeed Verbose
1024
1025
1026
1027
1028
1029
Tank
---
Meter
---
Strip Chart
---
Distribution
---
Moon Phase
Date
Alpha Numeric
Graph
Gauge
Thermometer
Wind Direction
High/Low
Color Spectrum
Parameter / Display
---
---
---
---
---
---
---
---
---
---
---
---
---
---
---
---
---
---
---
---
---
---
---
---
---
---
---
---
---
---
Tags Only
Table 8– Jpg Display Settings File Index Numbers
8.10 Other Jpeg Filenames
In addition to the jpg filenames in the previous section, the following filenames describe other
jpg files created from the desktop weather images.
Description
Filename
Broadcast Panel Display
broadcast.jpg
Icon Display
icon.jpg
METAR Icons
icon1.jpg thru
icon30.jpg
Table 9– Other Jpg Filenames
8.11 Intranet and Local Area Network Applications
If your computer is on a Local Area Network or an Intranet, both the ftp and web server options will work.
Virtual Weather Station provides another method, which is direct jpg file transfer. This does not require
use of ftp or web server technology. Select the Jpeg Direct File Transfer option. The files will be
transferred to the Jpeg file location specified in the panel.
8.12 Web Page Templates
Your software was shipped with several HTML templates. To view these templates, select Weather
-88-
09/20/02
Virtual Weather Station User's Guide
Website Builder from the Help Menu, and select one of the Web Page Templates.
8.13 Creating Web Pages with Virtual Weather Station Tags
NOTE: It is highly recommended you start with the html templates provided with Virtual
Weather Station and edit these files to familiarize yourself with this feature. Run the Weather
Website Builder provided under the help menu, and then explore the file templates and HTML
files generated from the templates.
8.13.1 Description of HTML Tags
HTML Tags allow you to insert weather station data text into your web page. Virtual Weather
Station accomplishes this by searching for a known “Tag” in a “Template” file, replacing the tag
with weather data, and copying the template to an HTML file. The steps are provided in the
following sections.
8.13.2 Creating an HTML Template File (htx file)
HTX files or HTML template files can be created with most Web Page authoring tools.
Microsoft Frontpage is one of several commercially available web authoring packages, and there
are several shareware software packages available.
To create a template file, save the template with an htx file extension with any text editor or web
authoring tool.
8.13.3 Inserting HTML Tags Into the Templates
There are three types of File Tags:
1. Each weather parameter has a unique file tag. For example, the file tag for the outdoor
temperature can be inserted into your web page template as follows:
Outside Temperature: ^vxv007^°F
where the vxv006 is the HTML tag for outdoor temperature and ^ is the parsing character.
2. METAR data that you download has a unique file tag. For example:
Los Angeles International Airport (KLAX) Temperature: ^mtr004KLAX^°F
where the mtr004 is the METAR tag for outdoor temperature, KLAX is the METAR designator
for Los Angeles International Airport, and ^ is the parsing character.
3.
File Tags. You can specify the path of any file specified on the File Tags list. For example:
^c:\vws\data\daily.txt^
where c:\vws\data\daily.txt is the complete file path and ^ is the parsing character. For more
-89-
09/20/02
Virtual Weather Station User's Guide
information for adding a file path to the tag list, reference Section 8.14, HTML File Tags.
To view a complete list of the HTML tags, reference Figure 40 - HTML Tags. The HTML Tags window
allows you to easily cut and paste HTML tags into the template file.
To select and copy a Tag to the clipboard, double click on the selected parameter in the list. Next, paste
the Tag into your HTML template.
Menu Shortcut: Internet u HTML Tags
Figure 40 - HTML Tags
The following table provides an index of tag names:
Tag Name
Description
^vxv###^
vxv = Virtual Weather value, ### designates weather
parameter number.
Example: ^vxv006^
^vhi###^
vhi = Virtual Weather Daily High
^vht###^
vht = Virtual Weather Daily High Time
-90-
09/20/02
Virtual Weather Station User's Guide
Tag Name
Description
^vlo###^
vlo = Virtual Weather Daily Low
^vlt###^
vlt = Virtual Weather Daily Low Time
^vva###^
vva = Virtual Weather Daily Average Value
^vma###^
vma = Virtual Weather Monthly Average Value
^vya###^
vya = Virtual Weather Yearly Average Value
^vvr###^
vvr = Virtual Weather Rate
^vrh###^
vrh = Virtual Weather Rate High
^vrt###^
vrt = Virtual Weather Rate High Time
^vrl###^
vrl = Virtual Weather Rate Low
^vrs###^
vrs = Virtual Weather Rate Low Time
^vmh###^
vmh = Virtual Weather Monthly High
^vmd###^
vmd = Virtual Weather Monthly High Date
^vml###^
vml = Virtual Weather Monthly Low
^vme###^
vme = Virtual Weather Monthly Low Date
^vyh###^
vyh = Virtual Weather Yearly High
^vyd###^
vyd = Virtual Weather Yearly High Date
^vyl###^
vyl = Virtual Weather Yearly Low
^vye###^
vye = Virtual Weather Yearly Low Date
^vlt###^
vlt = Virtual Weather Daily Low Time
^mtr###ABCD^
ABCD = METAR identifier, ### specifies the parameter
number.
Example: ^mtrKLAX006^
^vervws^
Virtual Weather Station Version Number
Table 10 – Index of HTML Tag Names
Reference Figure 41: Example HTML Template with is an example of an HTML template with
HTML Tags inserted.
-91-
09/20/02
Virtual Weather Station User's Guide
Detailed Weather Conditions
Virtual Weather Station Version ^vervws^
Current Conditions
Last Updated: ^vst143^ on ^vst142^
Outside Temperature: ^vxv007^°F
Today's High: ^vhi007^°F at ^vht007^
Lo: ^vlo007^°F at ^vlt007^
Barometric Trend: ^vvr008^
Sunrise : ^vst144^ Sunset: ^vst145^
Moonrise: ^vst146^ Moonset: ^vst147^
Moon Phase: ^vxv128^
Figure 41: Example HTML Template with HTML Tags
8.13.4 Creating the HTML File from the HTML Template (htx) File
Reference Figure 42 - Creating Web Pages with Virtual Weather Station Tags.
To view HTML settings, select [Internet][HTML Settings] from the taskbar. This panel specifies the
template file location and the Web Page or HTML Filename. The following settings are available:
•
Update HTML Timer. Specifies how often to update the HTML panels.
•
On. Activates the parsing and saving of the html file
•
Template File. HTML template file (htx) contains the HTML tags
•
HTML Filename. File created by the template file.
•
Browse . Browse to the location of the file(s)
•
Preview. Previews the Web Page in your default browser.
To create the “finished” HTML file from the template,
•
Select one of the check boxes ON
•
Browse to the template file you created (left column of files)
•
Browse to define the final location of the HTML file (right column of files)
•
Select the UPDATE button
-92-
09/20/02
Virtual Weather Station User's Guide
•
Select the Preview Button to view the finished HTML file
•
To automatically update this process, select an HTML File Update Timer.
•
To upload the finished file to the Internet, select the Upload Files to Internet button and
Browse to the HTML file location created.
Menu Shortcut: Internet u HTML Settings
Figure 42 - Creating Web Pages with Virtual Weather Station Tags
8.14 HTML File Tags
File tags can be inserted into the HTML template (hx) to display data from a text file directly in
your web page.
Reference Figure 43 - File Tags. To specify a file HTML tag, browse to a file located on your
local network.
Once entered, the file will be listed in the HTML Tags window (reference Figure 40 - HTML
Tags).
For example, the tag for the daily text file generated by Virtual Weather Station is as follows:
-93-
09/20/02
Virtual Weather Station User's Guide
^c:\vws\data\daily.txt^
This tag can be directly cut and paste into your web page, and the entire file is displayed in the
same font size, color and format.
Files can be downloaded from the Internet, and then displayed in your web pages. This is
particularly useful for displaying forecasts and climate data ge nerated by the NOAA and
available on the NOAA weather server.
Menu Shortcut: Internet u HTML File Tags
Figure 43 - File Tags
8.15 Ftp Operation
The File Transfer Protocol (FTP) is part of the TCP/IP protocols for dat a transmission on the Internet and
is used mainly to transfer files between computers. FTP is a client-server protocol in which an FTP server
waits for FTP clients to connect to the server and issue requests.
Generally, FTP servers require clients to provide a username and password before processing any
requests. An FTP server administrator determines the user access policy for the server. Many FTP
servers allow anonymous access, with restrictions, to the server. To log onto an FTP server
anonymously, clients enter anonymous as the username and their e-mail address as the password.
-94-
09/20/02
Virtual Weather Station User's Guide
Virtual Weather Station provides FTP Client functions that connect to, and perform operations on, a
specified FTP server. Virtual Weather Station does not provide functions that let your program behave as
an FTP server. When your program calls the FTP Client functions, it connects to an FTP server which
typically is running on a remote computer.
8.15.1 Connecting to Your Remote Ftp Server
Verify you can connect to your Ftp Server. Select [Internet][Login] from the menubar.
Menu Shortcut: Internet u FTP Login
Figure 44 - Ftp Sever Panel
Enter the following information:
1.
Server Name (for example, ftp-www.earthlink.net)
2.
User Name
3.
Password
Select [OK].
The initial directory is optional.
-95-
09/20/02
Virtual Weather Station User's Guide
Menu Shortcut: Internet u FTP Login [Login]
Figure 45 - Ftp Login Panel
This information will be permanently saved for automatically transferring files from your PC to your Web
Server.
You should now see your default working directory (for example, \webdocs) and associated files.
You can now ftp the html template files provided with this software to your remote server. You must also
transfer the associated jpg files to the remote server. Now is a good time to use the automated FTP
features to transfer the jpg files.
If you are not able to see the directory listing, select the passive mode. Some servers operate in the
passive mode and do not require commands for listing directories.
Close the Ftp Server Panel.
8.15.2 Automatic Ftp Features
Virtual Weather Station allows you to automatically transfer files from your PC to the Internet
and from the Internet to your PC. There are three categories of FTP operation described in the
following sections.
-96-
09/20/02
Virtual Weather Station User's Guide
8.15.2.1
Sending Jpeg Files Displayed in Virtual Weather Station Desktop to
the Internet (Jpeg FTP Settings)
For each element on your desktop, a jpeg image is generated. The files are sent to the created and sent
to the Internet at the same time based on a schedule.
Reference
Figure 46 - Jpeg FTP Settings. The following sections describe the jpeg FTP settings.
8.15.2.1.1 Creating Temporary Jpg Files First On the Server
Broken links can occur if a web surfer views your web page while a file is in the process of
uploading. To avoid these broken links, select the Create Temporary File First on the Server.
This option creates a file tempfilename.jpg, and then copies tempfilename.jpg to filename.jpg.
The process of renaming a file on the server takes much less time than transferring the file to
your server, avoiding the broken links.
8.15.2.1.2 Send Files to this Location on Server
Browse to your server location to specify the location the jpeg files will be sent.
Menu Shortcut: Internet u Jpeg FTP Settings
Figure 46 - Jpeg FTP Settings
-97-
09/20/02
Virtual Weather Station User's Guide
8.15.2.2
Sending (Upload) User Selectable Files to the Internet (FTP Server)
Virtual Weather Station allows you to send up to 20 files to your remote Ftp server
automatically. You can send any file, such as weather cam images or HTML files generated from
the HTML templates.
Reference Figure 47 - Sending Files to the Internet (FTP server).
Menu Shortcut: Internet u FTP Upload File (Send)
Figure 47 - Sending Files to the Internet (FTP server)
8.15.2.3
Sending (Upload) the Entire Contents of a Folder to the Internet (FTP
Server)
Virtual Weather Station allows you to send all the files in a specific folder to a specific location
on your FTP server.
-98-
09/20/02
Virtual Weather Station User's Guide
Reference Figure 48 – Send the Entire Contents of a Folder to the Internet..
Menu Shortcut: Internet u FTP Upload Folder (Send)
Figure 48 – Send the Entire Contents of a Folder to the Internet
8.15.2.4
Retrieve (Download) Files from the Internet
Files can be automatically downloaded from the Internet based on a schedule. The files include any public file
addressable from the Internet, and must be in text format only.
The files are saved on your local drive and can be used for display in your web pages using file tags (see the section
on File Tags for more details).
FTP (ftp://) or HTTP (http://) files can be downloaded.
For more information on obtaining National Weather Service text data, please visit http://weather.noaa.gov/pub/data
-99-
09/20/02
Virtual Weather Station User's Guide
Menu Shortcut: Internet u FTP File Receive (Download)
Figure 49 - Downloading Files from the Internet
8.16 E Mail Weather Reports and Alarming
Virtual Weather Station allows you to automatically or manually send Internet e-mail messages. Your
Web server must send the message through a server that supports the Simple Mail Transfer Protocol
(SMTP) protocol. SMTP is the standard Internet mail transfer protocol. Ask your network administrator for
the name of a computer that your server can use as an SMTP server.
The parameters specify the SMTP server, sender, recipient, subject, message body, and file attachments
of the message. The file attachments can include any text or binary files. The SMTP standard does not
require a user name and password.
To get started, identify your E Mail server name (for example, mail.earthlink.net), and send an alarm to
yourself.
-100-
09/20/02
Virtual Weather Station User's Guide
8.16.1 Email Settings
Virtual Weather Station allows you to send E Mail messages and attachments when alarm limits are
exceeded. You can also send periodic weather reports. To view the E Mail settings, select
[Settings][Email] from the menubar.
Enter the following information:
4.
E-Mail (SMTP) Server. This is the name of the server established by your network administrator.
An example SMTP server is mail.earthlink.net.
5.
To: Recipient of your E Mail message. An example is [email protected]. Separate
Email addresses by semicolons. For example, if you are addressing the Email message to two
addresses (example):
[email protected];[email protected]
6.
From: Sender of E Mail message.
7.
Title: Title of the E Mail message.
8.
Text Message. If you want to include an optional text message, enter the message in the text
box.
9.
Attachments. Send attached weather data files.
-101-
09/20/02
Virtual Weather Station User's Guide
Menu Shortcut: Internet u Email Settings
Figure 50: Automatic E Mail Settings
8.16.2 Weather Reports
Periodic weather reports can be sent based complex user defined schedule. To view the schedule,
select the calender from the panel.
The weather report sends the parameters specified in the File Settings Panel. To view, this panel, select
the parameter icon from the panel. The names and units are based on the entries, providing foreign
language support.
The weather report data is appended to the Email message specified in the Email panel.
8.16.3 Email Alarms
Email alarms can be sent based on alarm conditions. See Alarms for more information. To view the alarms panel,
select the Alarm icon from the display panel.
-102-
09/20/02
Virtual Weather Station User's Guide
8.16.4 Reporting Alarm Codes Only
Instead of sending a message, a simple fault code can be sent. This is important for Email pagers
where message length and bandwidth are important.
Referencing the Email alarm panel, if condition 1 is met, the fault code “1” will be sent. If
conditions 1 and 2 are met, the fault code “12” will be sent.
8.17 METAR
8.17.1 General Description
Beginning 1 July 1996, the United States undertook the most significant change for observing, reporting,
and coding surface weather observations and terminal forecasts in the past forty years. Not since the
early 1950s, when the present airways code (commonly known as Surface Aviation Observation or SA
code), and Terminal Forecast (FT) codes were adopted, has there been such a major code change for
weather observations and forecasts.
On 1 July 1996, the international standard code for hourly and special surface weather observations,
METAR/SPECI, took effect.
The METAR acronym roughly translates from the French as Aviation Routine Weather Report . A special
report, SPECI, is merely a METAR formatted report which is issued on a non-routine basis as dictated by
changing meteorological conditions.
The SPECI acronym roughly translates as Aviation Selected Special Weather Report . Meanwhile, the
international standard code format for terminal forecasts issued for airports, TAF , also took effect. The
acronym translates to Aerodrome Forecast .
The Federal Aviation Administration (FAA), which determines aviation requirements in the United States,
has determined that the domestic transition to the METAR/TAF code is vital to the standardization of
these reports worldwide. The National Weather Service (NWS) and Department of Defense (DOD) are
complying with this requirement.
The benefits of having the U.S. standardize to these new code formats are as follows. Hourly and special
observations are used both as stand alone data for the sites and as inputs to global weather models for
both analysis and forecasting. It is this global use of each small bit of information which drives the need
for standardization.
Additionally, the increase in international flights between the U.S. and other nations from more U.S.
locations than ever before lends itself to developing a more "seamless" international standard for aviation.
Moreover, standardization becomes vital for the general aviation community for flights from the U.S. to
Canada, the Caribbean Area, and Mexico.
8.17.2 Finding METAR Reports
METAR reports worldwide can be found at the NOAA anonymous ftp server in the following text file
formats:
Individual Decoded Reports ftp://weather.noaa.gov/data/observations/metar/decoded/
Individual Coded Reports
-103-
09/20/02
Virtual Weather Station User's Guide
8.17.3 Locating a Station Near You
The NOAA provides a convenient map for locating a METAR station near your. Click on the following link
to go to the map:
http://www.faa.gov/asos/map/map.htm
8.17.4 METAR Station Setup
Reference Figure 51 – METAR Station Setup.
To display METAR data on your desktop and generate a history based on METAR reporting
stations, select Add New Station to List.
Each METAR station requires an identifier. To find a list of identifiers, select one of the
following buttons:
View Worldwide Station List. Provides a list of stations around the world
View USA Station Map. Find a station near you in the USA.
View Independent Station List. Provides a list of independent station owners (like yourself).
You can join the network of independent station owners by following the instructions at
www.weatherforyou.com.
-104-
09/20/02
Virtual Weather Station User's Guide
Menu Shortcut: METAR u Station Setup
Figure 51 – METAR Station Setup
-105-
09/20/02
Virtual Weather Station User's Guide
8.17.5 Displaying METAR Icons on the Desktop
After you have selected a specific METAR station for download, you can
display this data on your desktop.
Reference Figure 53 – METAR Icon Display Settings. Enter the Site
identifier and the title your wish to display on your desktop.
To display the icon, check the Display Checkbox. Create a jpg file if you
wish to display the image on your website. The files are named icon1.jpg
to icon30.jpg based on the display number.
Figure 52 –
METAR Icon
The jpg images are saved in the same file location as the other desktop
images unless you specify a different directory on the panel.
The icon background changes from day to night based on your local
sunset time. To adjust the day and nighttime text color, select the color
boxes.
Menu Shortcut: Modify Display u METAR Icons
-106-
09/20/02
Virtual Weather Station User's Guide
Figure 53 – METAR Icon Display Settings
8.17.6 METAR Settings
To define METAR settings, select [Modify Display][METAR Icons] from the Menubar.
The following METAR settings are adjustable.
Parameter
Description
Auto Update METAR Active
This checkbox must be selected to automatically fetch METAR
data from the server
Create METAR File
Creates a METAR text file summary report
Schedule
A schedule must be defined to automatically update METAR data
-107-
09/20/02
Virtual Weather Station User's Guide
Parameter
Description
Distance Units
METAR cloud height and visibility is expressed in km or kft and
miles
Server
There are two servers to obtain data. The NOAA server is the
official government server, but is slow and does not include
private weather station owners. The HamWeather Server is a
mirror server, is much faster, and provides access to the network
of personal weather station owners data
Table 11 – METAR Settings
Menu Shortcut: Modify Display u METAR Icons
Figure 54 – METAR Icon Settings
8.17.7 METAR Report Generator
Since METAR is the reporting standard for weather observations, VWS generates METAR reports so you
can share weather data. VWS also includes an interpreter, so you can interpret other METAR reports.
The main reason users put their information on the internet is to share data. VWS provides a conduit for
sharing weather information.
-108-
09/20/02
Virtual Weather Station User's Guide
Menu Shortcut: METAR u METAR Generator
Figure 55 – METAR Report Generator
8.17.8 METAR Text Reports
Three text reports are available from METAR generated data. The following section describes
the METAR reports and locations.
8.17.8.1
METAR Summary Text Report
The METAR summary text reports are located in the following file location:
\data\metar.txt
-109-
09/20/02
Virtual Weather Station User's Guide
Location
Last Update
Date and Time
Van Nuys
05/29/2001 09:51pm
Burbank
05/29/2001 08:53pm
Los Angeles 05/29/2001 09:50pm
Temp
°F
66
68
63
Dew
°F
61
55
59
HtIx Chill %Rh
°F
°F
%
71
66 83
70
63 64
68
60 88
Press
in
29.91
29.90
29.92
Rain
in
-------
Wind
Dir
ESE
ESE
WSW
Wind
Spd
4
9
6
Wind Visib Cloud Sky/Weather
Gust miles
kft
4
10
--- Clear/
9
10
--- Clear/
6
9
--- Clear/
Figure 56 – METAR Summary Reports
8.17.8.2
METAR Historical Text Report
The METAR historical text reports are located in the following file location:
\data\KABC.txt
where KABC is the METAR identifier
Date / Time
03/31/2001
03/31/2001
03/31/2001
03/31/2001
03/31/2001
03/31/2001
03/31/2001
03/31/2001
03/31/2001
03/31/2001
03/31/2001
03/31/2001
03/31/2001
03/31/2001
03/31/2001
03/31/2001
03/31/2001
03/31/2001
12:50pm
01:50pm
01:50pm
02:50pm
03:26pm
03:26pm
03:50pm
04:07pm
04:50pm
05:50pm
06:29pm
06:29pm
06:50pm
06:50pm
07:50pm
07:50pm
08:50pm
09:50pm
Temp
°F
Dew
°F
64.4
64.4
64.4
62.6
62.6
62.6
60.8
60.8
59.0
59.0
57.2
57.2
57.2
57.2
57.2
57.2
57.2
57.2
57
57
57
57
57
57
57
55
55
55
55
55
55
55
55
55
55
54
HtIx Chill %Rh Press
°F
°F
%
in
68.3
68.3
68.3
67.2
67.2
67.2
66.1
65.4
64.3
64.3
63.4
63.4
63.4
63.4
63.4
63.4
63.4
62.5
57
57
57
55
55
55
52
52
51
51
50
50
48
48
52
52
50
54
77
77
77
83
83
83
88
82
88
88
94
94
94
94
94
94
94
88
29.99
29.97
29.97
29.95
29.94
29.94
29.94
29.93
29.93
29.93
29.94
29.94
29.94
29.94
29.95
29.95
29.96
29.95
Rain
in
Wind
Dir
Wind
Spd
-------------------------------------
--WSW
--WSW
WSW
--WSW
WSW
WSW
SW
WSW
--W
--W
--WSW
WSW
11
12
12
11
12
12
12
12
10
10
9
9
11
11
8
8
9
6
Wind Visib Cloud Sky/Weather
Gust miles
kft ---/--11
12
12
11
12
12
12
12
10
10
9
9
11
11
8
8
9
6
3
3
3
4
4
4
4
3
0.50
0.50
3
3
3
3
3
3
3
3
2.0
2.0
2.0
2.0
1.1
1.1
1.1
1.1
0.9
0.9
0.9
0.9
0.9
0.9
0.9
0.9
0.9
0.9
Overcast/ Haze
Broken Clouds/
Broken Clouds/
Broken Clouds/
Broken Clouds/
Broken Clouds/
Overcast/ Mist
Overcast/ Mist
Overcast/ Mist
Ov ercast/ Mist
Overcast/ Mist
Overcast/ Mist
Overcast/ Mist
Overcast/ Mist
Overcast/ Mist
Overcast/ Mist
Overcast/ Mist
Overcast/ Mist
Figure 57 – METAR Historical Reports
8.17.8.3
METAR Raw Data
The raw METAR data is located in the following file location:
\metar\KABC.txt
where KABC is the METAR identifier
-110-
09/20/02
Haze
Haze
Haze
Haze
Haze
Virtual Weather Station User's Guide
2001/06/03 18:56
KPHX 031856Z 28010G15KT 10SM CLR 34/M01 A2967 RMK AO2 SLP025 T03391006 $
Figure 58 – Raw METAR Data
8.17.9 Learning More About METAR
To learn more about METAR, visit the United States Government National Oceanic and Atmospheric
Administration Website at http://www.nws.noaa.gov/oso/oso1/oso12/overview.htm.
8.18 Weather Servers
8.18.1 WxWatch.com
Menu Shortcut: Servers u Ambient’s WxWatch.com
You do not even need your own website to share your METAR data around the world.
Ambient’s www.WxWatch.com provides an internationally recognized weather site to post your
data live at no charge.
Anyone with a personal weather station supported by Virtual Weather Station, available from
Ambient will be able to post their data on the Web, anytime, and without incurring any fee.
All of the Personal Weather Stations are indexed, searchable, and completely accessible
to any site visitor.
Virtual Weather Station users that sign- up will automatically submit
data to the system a minimum of once each hour. Users may also manually select to send updates
as frequently as 15 minutes if they so desire.
Your weather conditions are displayed in the same format as NWS information, and also
includes the latest forecast information from the NWS below your stations display.
8.18.2 WxHost.com
Menu Shortcut: Servers u Ambient’s WxHost.com
Ambient is a pioneer in providing professional grade weather processing services to a wide
audience of professionals, associations, and hobbyists.
Ambient's servers are housed in a new, world-class data center, located in Anderson, California.
The center has 24x7 restricted access, physical security breach alarms, infrared and motion
detection sensors, video camera surveillance, 24x7 automatic police department notification,
seismically braced rack systems to zone 4 compliance, full open racks and shared open racks,
24x7 remote systems monitoring and notification, dedicated and fully redundant HVAC System,
temp maintained at 72° F (+/- 2° ) humidity at 45% (+/- 5%), state-of-the-art smoke and heat
-111-
09/20/02
Virtual Weather Station User's Guide
detection and a gas-based fire protection system, 24x7 automatic fire department notification,
parallel conditioned redundant ups system, and a Cisco powered network
Please visit www.WxHost.com for more details.
8.18.3 Other Servers
Weather Underground and Hamweather provide this service to you at no charge.
8.18.3.1
Weather Underground
Menu Shortcut: Servers u Weather Underground
To register your weather station as a private weather station, select the Sign-up Your Station
button and proceed by registering your weather station or select the following link:
http://www.wunderground.com/weatherstation/index.asp
8.18.3.2
Weatherforyou Weather Server
Menu Shortcut: Servers u Weatherforyou
Weatherforyou.com and Hamweather.com have teamed to provide a powerful networking
weather service for personal weather station owners.
To register your weather station as a private weather station, select the Sign-up Your Station
button and proceed by registering your weather station at Hamweather.
8.18.4 APRS
Menu Shortcut: Servers u APRS
APRS is a which uses amateur radio to transmit position reports, weather reports, and messages
between users.
Reference the links provided in Figure 59 – APRS Settings for more detailed information.
Ambient does not actively participate in the APRS service, but provides the text files for
generating APRS data in support of the network.
You can download the APRS utility program to post your data live on the Internet at
http://www.weatherconnect.com/AmbientForum/dl_info.asp?id=29
-112-
09/20/02
Virtual Weather Station User's Guide
Figure 59 – APRS Settings
8.19 Internet Status and Log
8.19.1 Turning Off the Internet Functions
To turn off all internet functions, select the Turn Off All Internet Features switch.
8.19.2 Error Messages and Log
Error messages for Internet and communication events can be viewed from the Error Messages panel. To
view the error messages panel, select [Help][Internet Error Messages and Log] from the menubar.
An Internet log captures events and errors during operation. To view this error log, select the open folder
button. It is recommended you view this error log prior to contacting Ambient Software. Attaching this
error log to an Email to Ambient Software is highly recommended to identifying problems. The error log is
stored in \data\log.txt.
You can configure the software to write to the file (1) when an Internet related event occurs or (2) an
Internet related error occurs.
•
NOTE: The Internet log file can get very large. It is recommended that the log file record fault
data only unless advanced troubleshooting is required, and the size of this file is monitored.
-113-
09/20/02
Virtual Weather Station User's Guide
Figure 60 – Internet Status Messages and Error Log
9 Virtual Weather Station Add on and Plug-ins
9.1
X10 Home Automation with Virtual Weather Station, HomeSeer (Base or Pro
Version of Virtual Weather Station Required)
9.1.1 General Description
You can connect your home automation system to your personal weather station, and create a
powerful environmental monitoring system.
Ambient makes this possible with Virtual Weather Station’s Home Automation System
(http://www.weatherconnect.com/x10). The combination of your weather station and automated
controls improves the comfort and efficiency of your home at a fraction of the cost of other
automated environmental systems.
With Virtual Weather Station’s home automation plug- in tools, you can:
•
Control the thermostat based on feedback signals from handheld temperature sensors
placed throughout your home, or a low cost zone control system.
•
Monitor and control the thermostat based on Comfort Index or change thermostat set
points based on rate of change of temperature.
•
Turn on the ceiling fan when the bedroom comfort index is exceeded.
•
Control whole house fans to draw in cool air from the outside when the outdoor
temperature is lower than the inside temperature
-114-
09/20/02
Virtual Weather Station User's Guide
•
Control sprinkler systems after a rain.
•
Control your irrigation system
•
Monitor and control your pool, spa or air conditioning systems.
•
Monitor your home automation and environmental conditions from anywhere in the
world over the Internet.
9.1.2 X10 Controls
Virtual Weather Station communicates to HomeSeer (www.homeseer.com) home automation
software to provide a complete environmental control and monitoring system using X10 Control
Technology.
X10 is a communications protocol based on Powerline Carrier (PLC) technology, which uses
your home’s existing electrical wiring to communicate with controls lights and appliances. X10
is easily installed into existing homes, and X10 control devices can be upgraded or changed
easily.
9.1.3 HomeSeer Automation Software Description
HomeSeer is home automation software that uses inexpensive X10 technology to control your
lights, appliances, and audio/video equipment. With a built- in web browser, access to your home
is only a click away. HomeSeer was designed to be easy to use, affordable, and extendable.
Novice users will find the clean Outlook like interface easy to understand, while power users will
welcome the ability to create sophisticated scripts to control just about anything.
9.1.4 How the Home Automation System Works
Virtual Weather Station communicates to HomeSeer using a Plug- in module provided with
Virtual Weather Station’s Home Automation Toolkit. HomeSeer can be programmed to
automatically control your home or business by communicating via RS232 or USB to a X10
Computer Interface Module.
-115-
09/20/02
Virtual Weather Station User's Guide
Figure 61 –Virtual Weather Parameter Listing in HomeSeer.
9.1.5 Configuring HomeSeer
After purchasing and installing HomeSeer and the HomeSeer Virtual Weather Station Plug- in,
configure HomeSeer as follows.
From Virtual Weather Station
1. Select Settings | Csv Export from the Virtual Weather Station main menu.
2. Select the Create csv output file checkbox and browse to a location on your hard
drive to store the csv file.
From HomeSeer
3. Select View | Options from the HomeSeer Main Menu, and select the Interfaces
Tab.
4. Under the RF, I/O, Custom Interface Field, Select device to add: VWS
Interface.
5. Select VWS Interface in the window and select the Setup button.
6. Browse to the csv file location specified in Step 2.
7. Select the Create Variables Button to list the 39 variables VWS imports to
HomeSeer. These variables will now be listed in the HomeSeer Main Menu.
9.1.6 Purchasing the Virtual Weather Station HomeSeer Plug -in
To purchase the HomeSeer plug-in, visit http://www.weatherconnect.com/x10.
-116-
09/20/02
Virtual Weather Station User's Guide
9.2
WeatherVoice (Internet Version of Virtual Weather Station)
Menu Shortcut: Settings u WeatherVoice
Turn any PC into a Weather Report Telephone Call Center with Ambient’s WeatherVoice addon.
Anyone can keep up to date on your local weather, anywhere. Advertise your services, keep a
watchful eye on your home, cabin or business, indoors and out, with a simple phone line and
voice modem.
Ambient makes this possible with Virtual Weather Station’s Voice Generation System. For more
information, visit http://www.weatherconnect.com/WeatherVoice
Virtual Weather Station’s WeatherVoice is a text to speech converter. WeatherVoice is
compatible with most text-to-speech voices.
These text files can be automatically updated, inserting real- time weather conditions from your
weather station, or even forecasts and warnings from the National Weather Service.
With WeatherVoice, you can:
•
Use Virtual Weather Station’s File Tags to insert live weather conditions from your
weather station or your local METAR station into your outgoing answering message
•
Download from the Internet and insert any text file into the outgoing answering message
to provide weather forecasts and warnings
•
Use spoken audio files as background sounds on your website
•
Combine with a third party PC Auto Call Center to provide a complete PC-based phone
answering system. Keep up to date on your local weather, advertise your service, and stay
connected to the weather!
9.2.1 What you Need to Get Started
You need the following to create a sophisticated Weather Reporting Call Center:
•
A personal weather station, or Internet connection to over 7,000 METAR weather
stations around the world
•
Ambient’s Virtual Weather Station Base, Pro or Internet Edition
•
Ambient’s WeatherVoice Add-on
•
A Voice Modem. Most modems provide Voice/Data/Fax
•
A third party Call Center Software. We recommend Advanced Call Center:
-117-
09/20/02
Virtual Weather Station User's Guide
http://www.voicecallcentral.com/advancedcallcenter.htm
9.2.2 WeatherVoice General Description
WeatherVoice converts text files with “tags” into actual weather data, and then converts these
files into wav files, which can be played back on your computer or voice modem. “File Tags”
can also be inserted into the text file.
An example text file is as follows:
Text File
Thank you for calling Ambient,
your Weather Superstore. The
current temperature is ^vxv007^
degrees. The high today was
^vhi007^ and the low today was
^vlo007^ The current wind speed
is ^vxv003^ miles per hour.
The current temperature at Los
Angeles Airport is ^mtr004KLAX^
degrees.
The forecast for the greater
Los Angeles area is as follows:
^c:\vws\data\forecast.txt^
Converted File
Thank you for calling Ambient, your Weather
Superstore. The current temperature is 74
degrees. The high today was 74 and the low
today was 53. The current wind speed is 12
miles per hour.
The current temperature at Los Angeles Airport
is 72 degrees.
The forecast for the greater Los Angeles area
is as follows:
TODAY...LOW CLOUDS AND FOG THROUGH MID
MORNING...OTHERWISE
MOSTLY SUNNY. HIGHS IN THE 80S TO LOWER 90S.
.TONIGHT THROUGH MONDAY...AREAS OF LATE NIGHT
THROUGH MID MORNING LOW
CLOUDS AND FOG...OTHERWISE MOSTLY CLEAR. LOWS IN
THE MID 50S TO MID
60S. HIGHS IN THE MID 80S TO MID 90S.
.MONDAY NIGHT THROUGH TUESDAY...MOSTLY CLEAR.
LOWS IN THE UPPER 50S
TO AROUND 70. HIGHS IN THE 90S TO 102.
.WEDNESDAY THROUGH SATURDAY...MOSTLY CLEAR.
LOWS IN THE UPPER 50S TO AROUND 70. HIGHS
IN THE 90S TO 104.
Table 12 – Text to Wav File Conversion takes tag information and converts it to text files.
For more information on obtaining National Weather Service text data, please visit http://weather.noaa.gov/pub/data
9.2.3 TTS Voices and Microsoft’s TTS Center
The Microsoft Text-to-Speech engine was included with your WeatherVoice distribution kit. The
text-to-speech engines can be found at the following link:
•
http://www.microsoft.com/products/msagent/downloads.htm#tts
Sample free TTS voices have been compiled below for your convenience.
Microsoft Text-to-Speech Engines
Mary, Mike, Sam and More (7.3MB)
-118-
09/20/02
Virtual Weather Station User's Guide
L&H TruVoice TTS Engines
American English (0.99MB)
British English (2.54MB)
Dutch (2.58MB)
French (2.24MB)
German (2.18MB)
Italian (1.97MB)
Japanese (3.00MB)
Korean (3.03MB)
Portuguese (2.39MB)
Russian (2.85MB)
Spanish (2.36MB)
The best TTS voices on the market are sold by AT&T Labs Natural Voices:
www.naturalvoices.att.com/
and are available for purchase at
www.WeatherConnect.com/WeatherVoice
9.2.4 WeatherVoice Set-up
“Tag Files” or templates placed in the directory \vws\voices\text are converted to the actual text
that will be spoken, and then converted again to wav files. You can place as many files as you
want into the file directory.
The file structure is as follows:
Templates (\vws\voices\text\*.txt) W
Temporary Files (\vws\voices\temp\*.txt) W
Temporary Files (\vws\voices\wav\*.wav)
For more information on Tags, please reference Section 8.13.1.
9.2.4.1 Open Text File
Browses to the template text files created by the user located in the directory \vws\voices\text.
9.2.4.2 Converted File
Browses to the directory location \vws\voices\temp where the converted files are located. These
files are then converted to wav format
9.2.4.3 Open Wav File
Browses to the directory location \vws\voices\wav where the wav files are located.
-119-
09/20/02
Virtual Weather Station User's Guide
9.2.4.4 Voices
Provides the list of voices loaded on your computer. To load more voices, please visit
www.WeatherConnect.com/WeatherVoice from the Download New Voices Link.
9.2.4.5 Text to Wav Conversion Timer
The timer schedule for automatically updating the text to wav files. The files can be converted
now by selecting the Convert It! Button.
9.2.4.6 Voice Speed
The voice speed in words per minute.
9.2.4.7 Volume
The voice volume in percent.
9.2.4.8 Pitch
The voice pitch or frequency in Hertz.
9.2.4.9 Sample Rate
The sample rate of the converted speech (wav) file. The output sampling rate is based on your
modem or application. Most modem output frequency is 8,000 Hz. Most computer applications
are recommended at 16,000 Hz.
-120-
09/20/02
Virtual Weather Station User's Guide
Figure 62 – WeatherVoice Set-up Panel
-121-
09/20/02
Virtual Weather Station User's Guide
9.3
WeatherFlash (Internet Version of Virtual Weather Station Required)
WeatherFlash is the first Web-based, real- time,
comprehensive monitoring and analysis interface that is
completely controlled by you! You pick the display options,
you pick the colors, you design the layout, you select the
update interval. With Ambient's WeatherFlash, you are in
control.
View WeatherFlash with the most popular browsers,
Netscape, Opera, Mozilla, IE and more
Quickly and easily configure WeatherFlash using your
favorite browser
Display only the information that you choose including
text, graphs, off-site graphics, and more
WeatherFlash is not limited like our competitors products
Color WeatherFlash your way, utilizing the complete
Web compatible color palette
WeatherFlash updates from 1 second to 1 minute, to once
daily... its up to you
Absolutely no programming knowledge is required to use
WeatherFlash
No need to run out and buy Macromedia Flash...
WeatherFlash is self-contained
WeatherFlash is not limited by your ISP's Web server... it
runs in your browser
WeatherFlash does not require any DLL's, special
hardware or software to be installed
WeatherFlash allows multiple-page displays
Virtual Weather Station brings your PC to life, but add-on Ambient's WeatherFlash, with it's
rich array of dynamic and colorful gauges, dials, graphs and charts, and now your Web site will
come alive for your visitors too! Using Ambient's WeatherFlash, you are in complete control of
everything.
The WeatherFlash interface is completely customizable - you can arrange the virtual
instruments based on your own personal preferences, select your colors, update interval, and
much more. WeatherFlash, and your imagination, you literally can choose from over 1,000
ways to display your weather data, in "real-time".
-122-
09/20/02
Virtual Weather Station User's Guide
WeatherFlash is keyed to your site, so multiple instances of WeatherFlash may be hosted on
the same Web server. Each installation only requires about 50Kb of storage, and the data files are
less than 2Kb in size. Data may be sent to WeatherFlash via HTTP post using Active Server
Pages or using your current FTP access.
To learn more about WeatherFlash, please visit http://www.weatherconnect.com/WxFlash/
10 Troubleshooting Tips
Problem
The program is not
communicating to the weather
station (the instrument panel is
not updating)
Solution
•
Verify you have selected a Weather Station.
•
Verify that you have the correct communication port
selected. If you are unsure which comport is correct, select
[Start][Settings][Control Panel] from the windows
menubar and select [System][Device Manager] and
Ports. If COM1 is designated, your comport is
Communication Port 1.
•
Verify you are using the proper cable. A standard 9-pin
serial cable is required. Do not use a NULL modem cable.
•
If another program is using the serial communication port,
quit the program. Two programs can not share the same
serial port.
•
If you own a Palm Pilot or similar device (such as a digital
camera), the software is often configured to open at startup
of your computer, and “steals” the serial comport, even if
the device is not connected. Select “Ctrl-Alt-Del” once,
and see if any external device software is running.
•
Verify your station is not running on batteries and is
connected to AC power.
•
Your communication port is locked-up. Cycle power to the
computer
•
Your weather station console's communication port is
locked up. Cycle power to the console.
•
You have a hardware device conflict. It is recommended
that you contact your PC vendor or PC technical support.
-123-
09/20/02
Virtual Weather Station User's Guide
Problem
Communication only occurs
while on the batteries and not
the AC.
Solution
•
Your serial port uses a non-standard IRQ line
•
Your serial port is defective
•
Your weather station serial port is defective. Unplug the
station's AC adapter from the utility and run the station on
battery power. If the LEDs display communication,
reconnect the station's AC adapter. If the unit stops
communicating again, contact Oregon Scientific.
•
See Advanced Communication Troubleshooting Tips
If RTS (request to send) control line is low, communications
will only occur when on batteries. This condition will occur if
you are using a 3-wire (pins 2,3,7) serial cable, or if for some
other reason, the computer serial port is not asserting RTS.
Use a standard 9-pin serial cable.
•
Close all programs before installation. If the problem
persists, reboot your computer and make sure no programs
are running.
•
Turn off the virus protection. This can interfere with the
installation process.
The program crashes or you
receive the following Windows
Message:
•
If your microprocessor is overheating, you may receive this
message from the operating system. Keep your computer
in a cool place to reduce crashes
"This Program Has Received
an Illegal Operation and Will
Shut Down"
•
Some low power mode or power savers will cause the
program to crash when communicating to the serial port.
Turn off the power saver by selecting Right Click on the
desktop, Properties, Screen Saver, Settings (Energy
Savings Features of Monitor), and Turn off monitor.
•
Your graphics or display card driver may be outdated or
incompatible. Virtual Weather Station uses high resolution
graphics that all display drivers must support. However,
display cards and their associated drivers are notorious for
incompatibilities with the Windows Operating System.
You can determine your graphics card manufacturer by
selecting Right Click on the desktop, then Display
Properties, Settings and Advanced Properties. You may be
A script error or fatal error
occurs during installation.
-124-
09/20/02
Virtual Weather Station User's Guide
Problem
Solution
able to
download the latest graphics driver from the manufacturer
by performing a search on the adapter part number and
chip type.
The mouse moves on it's own
or does not operate after
launching the software.
How do I find the longitude
and latitude for my location?
•
You have an IRQ conflict between the serial port and the
mouse.
•
The solution is to replace your serial mouse with a bus
mouse that resides on IRQ-12. This is not a problem with
the software but is a hardware conflict associated with your
computer. For more on IRQs, see Microsoft's
troubleshooting hints.
•
You can contact your local town hall or city administration,
but the best source of information is on the Internet.
MapBlast at www.mapblast.com provides this
information. Enter your address and the longitude and
latitude will be displayed in decimal form. Select this link
and the information will be converted to the degree format.
The Sunrise and Sunset Times
are Incorrect
•
Verify that the time zone is entered correctly.
•
Verify that the longitude and latitude are entered properly.
•
Make sure you do not have the latitude and longitude
switched
•
Verify that the hemisphere settings are correct.
•
The celestial calculator is a close approximation of the
sunrise and sunset in your location and may be inaccurate
by several minutes due to equation inaccuracy or your
altitude (the equations are based on sea-level).
You can account for this inaccuracy by entering a number
in the offset (-60 minutes to +60 minutes).
Sunrise and sunset are off by
one hour, or did not cha nge
with the Daylight Savings
Time Change.
•
This problem may be related to the operating system's
daylight savings time clock. The clock may not be
available on your system.
To account for this problem, enter an offset of +60 minutes
or -60 minutes.
-125-
09/20/02
Virtual Weather Station User's Guide
Problem
Solution
or -60 minutes.
The strip charts lose the data
Strip charts are intended for plotting data "real-time" and the
when the program is shut down data is not saved permanently to a file. Reference the section
on graphs vs. strip charts.
The minimum and maximum
daily values are not correct
Virtual Weather Station must be running to record daily highs
and lows (data not stored in your weather station's memory).
Rate of changes are not correct
Rate of change is set to zero when Virtual Weather Station is
started.
Virtual Weather Station calculates the rate of change by
calculating the derivative of a parameter, and then filtering it
over one hour. Thus, the rate of change equation factors all of
the measurements taken in the last hour, and may not exactly
match the change in one hour. Determining the actual change
in one hour would require every measurement within the hour
to be saved, which is not practical, and would require the
software to be operational for more than one hour. Instead,
Virtual Weather Station uses calculation techniques standard in
the engineering community for calculating rate of change.
Virtual Weather Station's rain rate may not agree with the rain
rate calculated by the weather station because different
techniques are used.
How do I display more decimal
points for a parameter?
Change the precision from the display's attributes panel. For
example, changing the precision to three will add three
numbers to the right of the decimal point (1/1000ths).
The jpeg images are distorted
Power save mode must be turned off to prevent distorted
images
Weather display image colors
are poor quality
Virtual Weather Station prefers to run at High Color or 16 bit.
Select [Start][Settings][Control Panel] from the windows
menubar and select [Display][Settings] and High Color.
The software is consuming too
much CPU resources
Reduce the number of displays
The graphical images are
missing
You may be low on memory. Reduce the number of graphical
images displayed.
The computer is low on
Reduce the number of displays. Too many displays may result
-126-
09/20/02
Virtual Weather Station User's Guide
Problem
Solution
memory
in insufficient memory.
The graphs update slow or the
program locks up when
displays are updated
Reduce the length of time in your graphs. Select Plot Last x
hours. Enter a number less than 240 hours (for example).
Plotting 20,000 points on multiple graphs can cause long
delays.
The font size is incorrect after
changing the font type
Changing font type can also change the font size due to font
size limitations. To restore default fonts, select the Default
button from the font settings window and restart the program.
The Moonrise (or Moonset) is
showing --- instead of the time
Approximately once a month, the moon does not rise (or set)
on a given day.
There is no data in my graph or
distribution chart when the
program is started.
The chart will be empty if (1) the database is empty (example,
when the program is first started, or (2) Data has not been
collected in the plot time frame specified in the attributes
window (the program was turned off).
The data in my graph is wrong.
How can I fix it?
•
This problem is generally a result of bad sensor data from
your station, but can be repaired in your database.
•
The data shown in graphs is stored in the database. To fix
this data, go to [Settings][Database Settings] and edit the
database.
•
This problem is generally a result of bad sensor data from
your station, but can be repaired in your archive memory.
•
The data shown in the NOAA reports is stored in the
archive memory.
The data in my NOAA reports
is wrong. How can I fix it?
To fix this data, go to [Settings][Daily Archive],
[Settings][Monthly Archive] or [Settings][Yearly
Archive] and edit the data.
The data looks overwritten
when opened from the file
folder in Virtual Weather
Station
•
The display image colors are
poor quality
Virtual Weather Station prefers high resolution or 16-bit color.
Some images may result in poor quality at lower resolution
settings.
Virtual Weather Station launches Notepad to vie w text
files. This is a problem with Notepad. Use another text
editor such as Microsoft Word or Wordpad to view the
data.
-127-
09/20/02
Virtual Weather Station User's Guide
Problem
Solution
The numerical markers on the
ribbon and temperature
displays are not evenly spaced
The software attempts to put a numerical marker at even
increments, but this is not always possible. To improve your
numerical marker increments, select a high and low range
value that results in a difference of a multiple of 10. For
example, a low of -40 and a high of 60 will provide a
difference of 100. This will produce better marker increments
then a low of -20 and a high of 100.
The Dew Point of the weather
station is reporting "LL" or
limited to 32°F (0°C) and
Virtual Weather Station is
reporting a value
The Oregon Scientific unit does not report dew points below
32°F (0°C) but Virtual Weather Station continues to report
these values.
The sea- level barometer does
not report what is entered in
the Station Settings window.
Virtual Weather Station only reports the sea- level barometer
from your station. Reference Section 6.7.3 for more details.
The software is reporting a
cloud base when there are no
clouds in sight.
This is only an estimate based on relative humidity and
temperature. Other weather parameters affect the cloud base,
and should only be used as an estimate.
A Virtual Weather Station
parameter displays a different
number than the station
console
Make sure that you have not entered a calibration (reference
Chapter 6.3). Changing the calibration of a sensor will not
change the value on the display.
The Daily Rain is not correct
The program must be running at midnight for today's daily
rainfall to be correct. The Weather Station does not store daily
rainfall. The station only stores "yesterday's rainfall".
The monthly rainfall reported
in the NOAA report does not
agree with the sum of the daily
rainfall.
This is due to the station total rainfall reset by the user, or the
values for minimum or maximum rain edited by the user.
Reference 6.18.2 for more details to correct this.
Yesterday's rain as reported by
the weather station is not the
same as yesterday's rain
recorded in the summary panel.
This is due to the unusual way the Oregon Scientific weather
stations report rain. The station does not store today's rainfall,
but only stores yesterday's rainfall. If the software is not
running 24 hours per day, it may record an incorrect total for
today's rain. When the day changes, the value reported by the
station may be in disagreement from the value calculated by
-128-
09/20/02
Virtual Weather Station User's Guide
Problem
Solution
the software.
How do I change my NOAA
report data?
This is done in the Archive Settings window, and not the
database. Reference Section 7.2 for more details.
When I update one of the fields
in the daily summary data, this
change is not updated in the
monthly or yearly summary
data.
You must edit each of these data fields. For example, if the
minimum temperature on January 9, 2000 is changed, and it is
the minimum for the month and year, you must change this
field in the monthly summary panel and the yearly summary
panel.
The Alarm Sound will not play
•
This feature requires a sound card.
•
This is not a problem with VWS, but with your sound card.
Contact your sound card manufacturer
Some of the check boxes on
the Parameters Display Panel
are dimmed
Not all parameters can be displayed with all of the weather
elements. For example, graphs require historical data, and it
does not make sense to plot sunrise.
The displays do not retain their
position when exiting the
program.
•
Make sure you have enough memory in your computer to
save the displays. The display positions are saved in the
file VWS\setup\position.bin. If this file is corrupted, close
VWS, delete this file and restart Virtual Weather Station.
You will need to reset the displays again.
•
Try a different drive. The drive you installed Virtual
Weather Station on may be read only.
After hiding Virtual Weather
Station with the taskbar icon,
and recalling the display by
double clicking on the taskbar,
the window does not refresh
This is a Windows problem. Minimize and maximize the
application again to refresh.
One of the sensors is not
updating, and VWS will not
begin executing (WMR-918 or
WMR-968 only).
Virtual Weather Station requires all of your sensors to operate
to properly obtain data. If one sensor is not functioning due to
batteries or interference, deselect this sensor. See Section
6.5.6, Sensor and Battery Status (WMR-918 and WMR-968
only) for more details.
My system clock is losing time
when I run Virtual Weather
Station.
•
Use the Synchronization feature in Virtual Weather
Station. Select Settings | Synchronize Date and Time from
the menubar. Note - you must be the administrator on an
NT machine for this to work.
-129-
09/20/02
Virtual Weather Station User's Guide
Problem
Solution
NT machine for this to work.
•
You may have a bad ROM BIOS chip.
•
You may need a new battery on the motherboard.
•
Power management software in Windows can cause clock
time loss.
•
It may be a Windows 95 and 98 problem. Windows NT
handles this better because of the operating system design.
When you connect your weather station to the communication
port, Windows must process interrupts to read this data. With
weather stations, this occurs every 3 seconds. This causes the
clock to slow down.
If your computer is running other utilities, the clock speed may
be affected even more.
Your computer may need a tune-up. Here are some useful
hints:
1) Don't run continuous virus checking. Have virus scanner
scan your files on a batch basis. Continuous virus checking
slows down your computer.
2) I've had excellent luck with two parts of Norton Utilities:
(a) Norton Optimization Wizard (gets your swap file to the
right size)
(b) WinDoctor.
Run both monthly and let them tune your computer.
3) If you have a number of programs running in the taskbar or
resident to your system, delete them. When you close all your
programs you should only see about 6-7 programs in your task
list.
4) Get enough memory (>64Mb).
5) Run as few real mode drivers as possible (take everything
out of your autoexec and config.sys).
-130-
09/20/02
Virtual Weather Station User's Guide
Problem
Solution
6) Its fun to load a lot of programs to try them out, but every
one of them leaves traces behind in the form of .vxd's, .dll's,
and registry entries that will
eventually slow up your system beyond repair. In the
meantime, they slow it down and cause odd functionality.
7) If all else fails, reinstall Win98. Don't just reinstall over your
existing windows directory, either. Wipe out c:\windows and
c:\program
files and start again. You may have to spend 4 hours
reinstalling your apps, but your computer will run faster, you
will use less disk space, and it will be more reliable.
•
Download a Clock Synchronization program, which
synchronizes with the atomic national clock. One example
is www.beaglesoft.com
The language does not change
when changed from English
Virtual Weather Station provides limited foreign language
support. To change the titles to the language of choice, edit
each individual display.
What are channels 1, 2 and 3?
Channels 1, 2 and 3 are designated channels for the optional
sensors described in the section Error! Reference source not
found.
I receive Invalid Page Faults
and General Protection Faults
in Kernel32.DLL
Invalid Page Faults and General Protection Faults in
Kernel32.DLL are generally caused by a lack of system
resources, out of date video drivers, or a corrupt swap/paging
file. If you encounter the problem on a regular basis, the
following instructions should help resolve the problem:
1. Windows 95 users ONLY. (Windows 98 users
proceed to step 2.)
If the kernel32.dll error occurs while you are browsing
and you are using Windows 95, this problem could be
occurring due to Windows 95 bug. The bug is present
in earlier versions of Windows 95 and Microsoft has
posted an update which resolves the problem. In order
to determine which updates you need, right-click on
the My Computer icon on your desktop and select
Properties from the menu. Click on the General tab to
make sure it is in front.
-131-
09/20/02
Virtual Weather Station User's Guide
Problem
Solution
If you have the version of Windows 95 on the left, you
should follow the instructions on the right:
4.00.950
Install Service Pack 1 first,
then install the Kernel 32
Update.
4.00.950a Install the Kernel 32 Update.
4.00.950B Service Pack 1 and Kernel
Update not needed.
4.00.950C Service Pack 1 and Kernel
Update not needed.
NOTE: The kernel update should only be applied if
you have already installed Service Pack 1 for Windows
95. If you have Windows 95 version 4.00.950 (with no
letters after the number), you should first visit the
following page for information on downloading and
installing Service Pack 1:
Windows 95 Service Pack 1
If you have Service Pack 1 installed, you will have
Windows 95 version 4.00.950a. In that case, you
should install only the Kernel 32 Update.
The kernel update can be found here:
Windows 95 Kernel 32 Update
Important: The location of Microsoft's updates may
change. If the links in this article do not bring you to
the Microsoft update pages, use the search page on
Microsoft's site in order to download the Service Pack
and Kernel updates. If you have any questions
regarding the Service Pack or Updates, please contact
Microsoft for assistance.
2.
Finally, make sure that Windows is configured to handle
virtual memory (unless you are an advanced users who has
configured a static swap file).
-132-
09/20/02
Virtual Weather Station User's Guide
Problem
Solution
1.
Click the Start button and select Settings, then
Control Panel.
2.
In the Control Panel window, double-click the
System icon.
3.
Click the Performance tab and then click the Virtual
Memory button.
4.
Click "Let Windows manage my virtual memory
settings (recommended)".
5. Click OK as prompted until you return to the Control
Panel window.
I am experiencing a memory leak.
Memory leaks are common with the Microsoft Operating
System if functions are repeated over and over again (for
example, When you run a program that uses Windows Sockets
in Windows 95, a gradual increase in the memory used by the
operating system may occur over time, especially if the
program opens and closes a large number of sockets).
It is a good practice to download the latest operating system
version and patches from the www.microsoft.com website. In
addition, the following link provides insight to operating
system memory leaks:
Microsoft Operating System Memory Leaks
System Socket Web Server Error
My modem connection will not hang
up.
Check to make sure you are connected to the Internet, or you are not
conflicting with another Web Server running on your PC.
•
Quit the Virtual Weather Station program and manually connect to
the World Wide Web.
•
Relaunch Virtual Weather Station.
•
Another application is dialing and taking over the modem when VWS
dials. These “subversive” applications wait until you establish a
connection to the Internet, and then download or upload data. Close all
applications except VWS to see if this is the problem. Select Ctrl-AltDelete once to identify hidden applications
•
If you selected “Use Default Internet Connection” under Network
Settings, The status = InternetAutodialHangup(0); function does not
work, and will not hang the phone. Check out Microsoft's
http://support.microsoft.com/support/kb/articles/Q235/6/66.ASP link
for more information.
-133-
09/20/02
Virtual Weather Station User's Guide
Problem
Solution
•
Low quality modems do not always respond properly to the Hang
Command from the operating system.
I commonly receive timeouts during
FTP
•
Increase the CPU usage during FTP operation by selecting Internet |
FTP General Settings | Max CPU During FTP
Why does "WINOLDAP" run
multiple times and not shutdown?
•
Virtual Weather Station accesses some applications through the
command line. This is because WINOLDAP is not being automatically
closed when it finishes. In order to remedy this you need to modify the
DOS box properties for CONAGENT.EXE, CONAGENT.PIF, or
_DEFAULT.PIF (probably in \ windows).
1. Start Explorer.
2. Locate one of the above files in the \windows\system directory.
3. When over the file click the right mouse button.
4. Choose 'Properties' from the speed menu.
5. Choose the 'Program' tab.
6. Turn on the 'Close on exit' option.
Table 13 - Troubleshooting Tips
10.1 Advanced Communication Troubleshooting Tips
If you followed the troubleshooting tips above and could not find a solution, you likely have a
problem with your station's communication port, the cable or your computer.
To verify that you are receiving data, launch Hyper Terminal, which is a terminal emulation
program distributed with most Windows operating systems.
1. Launch Hyper Terminal, Select [Start][Programs][Accessories][Hyper Terminal] from
your Windows Desktop.
2. Run Hyper Terminal by selecting the Hypertrm icon.
3. Enter a Name (any name is OK) for the connection description.
4. Select Connect Using and Direct to Com x, where x is the comport designation.
5. Select 9600 baud, 8 data bits, Parity None, 1 stop bit, Flow Control Hardware Control.
6. You should see binary data on the display every time your station sends data (example, !¤
P 3 ¼ Pyü ).
7. If you see data streaming on the display, contact Ambient, LLC
([email protected]).
8. If you do not see data streaming on the display, please contact Oregon Scientific, your PC
-134-
09/20/02
Virtual Weather Station User's Guide
Manufacturer, or the cable manufacturer.
10.2 Support
For tips and troubleshooting, select the following link:
http://www.weatherconnect.com/support/
11 Glossary of Terms
The following is a glossary of weather and instrument terms.
Term
Definition
AIR DENSITY
The ratio of the mass of a substance to the volume it occupies. In
oceanography, it is equivalent to specific gravity and represents the
ratio of the weight of a given volume of sea water to that of an
equal volume of distilled water at 4.0 degrees Celsius or 39.2
degrees Fahrenheit.
ATMOSPHERIC
PRESSURE
See barometric pressure
BAROMETRIC
PRESSURE
The pressure exerted by the atmosphere as a consequence of
gravitational attraction exerted upon the "column" of air lying
directly above the point in question. The measurement can be
expressed in several ways. One is in millibars. Another is in inches
or millimeters of mercury (Hg). Also known as atmospheric
pressure.
BEAUFORT WIND
SCALE
A system of estimating and reporting wind speeds. It is based on
the Beaufort Force or Number, which is composed of the wind
speed, a descriptive term, and the visible effects upon land objects
and/or sea surfaces. The scale was devised by Sir Francis Beaufort
(1777-1857), hydrographer to the British Royal Navy.
CALIBRATION ERROR
The inaccuracy that the manufacturer permits when the unit is
calibrated in the factory.
CLOUD BASE
For a given cloud or cloud layer. The lowest level in the atmosphere
at which the air contains a perceptible quantity of cloud particles.
Virtual Weather Station estimates the cloud base on temperature
and humidity readings, using the following equation:
Cloud Base (ft) = 250(Temperature - Dew Point)
COOLING DEGREE
A cooling degree day is given for each degree that the daily mean
-135-
09/20/02
Virtual Weather Station User's Guide
Term
Definition
DAY
temperature departs above the baseline of 75 degrees a given
temperature It is used to estimate the energy requirements, and is an
indication of fuel consumption for air conditioning or refrigeration.
Refer to degree day or heating degree day.
DEW POINT
The temperature to which a sample of air must be cooled, while the
mixing ratio and barometric pressure remain constant, in order to
attain saturation by water vapor. When this temperature is below
O°C, it is sometimes called the frost point.
GUST
A sudden significant increase in or rapid fluctuations of wind speed.
Peak wind must reach at least 16 knots (18 miles per hour) and the
variation between peaks and lulls is at least 10 knots (11.5 miles per
hour). The duration is usually less twenty seconds.
HEAT INDEX
The combination of air temperature and humidity that gives a
description of how the temperature feels. This is not the actual air
temperature.
HEATING DEGREE
DAY
One heating degree day is given for each degree that the daily mean
temperature is below 65 degrees a given temperature. It is used as
an indication of fuel consumption. Refer to degree day or cooling
degree day.
HUMIDITY
The amount of water vapor in the air. It is often confused with
relative humidity or dew point. Types of humidity include absolute
humidity, relative humidity, and specific humidity.
LATITUDE
The location north or south in reference to the equator, which is
designated at zero (0) degrees. Parallel lines that circle the globe
both north and south of the equator. The poles are at 90 degrees
North and South latitude.
LONGITUDE
The location east or west in reference to the Prime Meridian, which
is designated as zero (0) degrees longitude. The distance between
lines of longitude are greater at the equator and smaller at the
higher latitudes, intersecting at the earth's North and South Poles.
Time zones are correlated to longitude. See Greenwich Mean Time.
MOON PHASE
The moon phase is caused by sun rays reflecting off the moon's
surface while it moves around the earth. The sun illuminates half of
the moon at any time while the moon orbits around the earth. The
variation in the angle made by the earth- moon line with respect to
the earth-sun line causes changing phase of the moon.
-136-
09/20/02
Virtual Weather Station User's Guide
Term
Definition
The moon completes one revolution around the earth in 27.322 days
with respect to the background stars. This is called the SIDERIAL
period of the moon. During this same time the earth moves about 27
degrees along its orbit around the sun. As a result, the moon takes
about two extra days to complete the cycle with respect to the sunearth line. This longer cycle of the moon that takes about 29.57
days is called SYNDONIC period of the moon. The longer cycle is
considered as Lunar month.
PRESSURE ALTITUDE
Atmospheric or barometric pressure expressed in terms of altitude
which corresponds to that pressure in the standard atmosphere.
RATE OF CHANGE
The derivative or change in a parameters value with respect to time.
Virtual Weather Station calculates the rate of change by calculating
the derivative of a parameter, and then filtering it over one hour.
Thus, the rate of change equation factors all of the measurements
taken in the last hour, and may not exactly match the change in one
hour.
RELATIVE HUMIDITY
A type of humidity that considers the ratio of the actual vapor
pressure of the air to the saturation vapor pressure. It is usually
expressed in percentage.
SEA LEVEL PRESSURE
The atmospheric pressure at mean sea level either directly measured
by stations at sea level or empirically determined from the station
pressure and temperature by stations not at sea level. Used as a
common reference for analyses of surface pressure patterns.
SUNRISE
The daily appearance of the sun on the eastern horizon as a result of
the earth's rotation. In the United States, it is considered as that
instant when the upper edge of the sun appears on the sea level
horizon. In Great Britain, the center of the sun's disk is used
instead. Time of sunrise is calculated for mean sea level. See sunset
for comparison.
SUNSET
The daily disappearance of the sun below the western horizon as a
result of the earth's rotation. In the United States, it is considered as
that instant when the upper edge of the sun just disappears below
the sea level horizon. In Great Britain, the center of the sun's disk is
used instead. Time of sunset is calculated for mean sea level. See
sunrise for comparison.
VAPOR PRESSURE
The pressure exerted by water vapor molecules in a given volume
of air
-137-
09/20/02
Virtual Weather Station User's Guide
Term
Definition
of air
VIRTUAL
TEMPERATURE
Virtual temperature is a fictitious temperature that takes into
account moisture in the air. The formal definition of virtual
temperature is the temperature that dry air would have if its
pressure and specific volume were equal to those of a given sample
of moist air. Virtual temperature allows meteorologists to use the
equation of state for dry air even though moisture is present.
WIND CHILL INDEX
The calculation of temperature that takes into consideration the
effects of wind and temperature on the human body. Describes the
average loss of body heat and how the temperature feels. This is not
the actual air temperature.
WIND DIRECTION
The direction from which the wind is blowing. For example, an
easterly wind is blowing from the east, not toward the east. It is
reported with reference to true north, or 360 degrees on the
compass, and expressed to the nearest 10 degrees, or to one of the
16 points of the compass (N, NE, etc.).
WIND RUN
The distance or length of flow of the air past a point during a given
interval of time.
WIND SPEED
The rate of the motion of the air on a unit of time. It can be
measured in a number of ways. In observing, it is measured in
knots, or nautical miles per hour. The unit most often used in the
United States is miles per hour.
Table 14 - Glossary of Terms
11.1 Beaufort Scale
The Beaufort scale is a system of recording wind velocity (speed) devised in 1806 by Francis
Beaufort (1774–1857). It is a numerical scale ranging from 0 for calm to 12 for a hurricane.
Number and
description
Air speed
Features
kph
mph
0 calm
smoke rises vertically; water smooth
0–2
0–1
1 light air
smoke shows wind direction; water ruffled
2–5
1–3
2 light breeze
leaves rustle; wind felt on face
6–11
4–7
-138-
09/20/02
Virtual Weather Station User's Guide
Air speed
3 gentle breeze
loose paper blows around
12–19
8–12
4 moderate breeze
branches sway
20–29
13–18
5 fresh breeze
small trees sway, leaves blown off
30–39
19–24
6 strong breeze
whistling in telephone wires; sea spray from waves
40–50
25–31
7 near gale
large trees sway
51–61
32–38
8 gale
twigs break from trees
62–74
39–46
9 strong gale
branches break from trees
75–87
47–54
10 storm
trees uprooted; weak buildings collapse
88–101 55–63
11 violent storm
widespread damage
102–117 64–73
12 hurricane
widespread structural damage
above
118
above
74
Table 15 - Beaufort Scale
11.2 Heat Stress Index
The Heat Stress Index calculates the body's reaction to heat and humidity, or the Heat Index.
High temperatures and humidity stress the body's ability to cool itself, and heat illness becomes a
special concern during hot weather.
Do not base important decisions on this heat stress index! Everybody's reaction to heat is
different.
Scale
Condition
---
Heat Index < 80 °F
Caution
80 °F < Heat Index < 90 °F
Extreme Caution
90 °F < Heat Index < 105 °F
Danger
105 °F < Heat Index > 130 °F
Extreme Danger
Heat Index > 130 °F
Table 16 - Heat Stress Index
-139-
09/20/02
Virtual Weather Station User's Guide
11.3 Comfort Index
The comfort index calculates the body's reaction to heat, cold, humidity and wind chill. High
temperatures and humidity stress the body's ability to cool itself, and low temperature can stress
the body's ability to heat itself.
Do not base important decisions on this comfort index! Everybody's reaction to heat and cold is
different.
Scale
Condition
Extreme Cold
Wind chill < 0 °F
Uncomfortably Cold
0 °F < Wind chill < 30 °F
Cool
30 °F < Wind Chill < 60 °F
Comfortable
60 °F < Temperature < 80 °F
Warm
80 °F < Temperature < 90 °F
Uncomfortably Hot
Temperature > 90 °F and Heat Index < 100 °F
Extreme Hot
Heat Index > 100 °F
Table 17 - Comfort Index
-140-
09/20/02