1
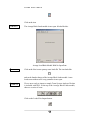
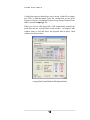
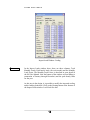
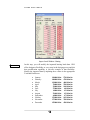
Getting Started with Ground Loop Design Premier Version5.0for Windows Powered By: www.gaiageo.com 中文版程式熱賣中 • 이 소프트웨어 프로그램은 한국어로 사용할 수 없습니다 Copyright Notice Ground Loop Design TM Premier Version 5.0 Getting Started Guide © 2007Celsia, LLC. All Rights Reserved. This guide, as well as the software described in it, is furnished for information purposes only to licensed users of the Ground Loop Design software product and is furnished on an “AS IS” basis without any warranties, whatsoever, express or implied. This may be used or copied only in accordance with the terms of the included EndUser License Agreement. The information in this manual is subject to change without notice, and should not be construed as a commitment by Gaia Geothermal. Gaia Geothermal assumes no responsibility or liability for errors or inaccuracies that may occur in this book. Except as permitted by such license, no part of this publication may be reproduced, stored in a retrieval system, or transmitted in any means, electronic, mechanical, recording, or otherwise, without the prior written consent of Gaia Geothermal. Other brand and product names are trademarks or registered trademarks of the respective holders. Microsoft Excel, Windows, Windows 95, Windows 98, Windows NT, Windows Explorer, Windows ME, Windows 2000, Windows XP, Windows Vista, Trane, and Trane System Analyzer are registered trademarks of Microsoft Corporation and Trane, respectively. Netscape Navigator is a registered trademark of Netscape Corporation. The Ground Loop Design Premier Version 5.0 Getting Started Guide Originally printed in October 2007 Printed in USA Part No. GGENG1006 Visit our Web site at http://www.gaiageo.com. Table of Contents CHAPTER 1 Step 1 CHAPTER 4 Welcome To GLD 1 Reports and Design Tips 44 GLD Features 1 Reports 44 Why This Guide? 2 Sharing Project Files 46 System Requirements 4 Design Tips 47 Installation Procedure 4 Concluding Remarks 49 Software License Dongle 5 CHAPTER 2 Loads and Pumps 7 Why Two Loads Modules? 7 What Loads Data Does GLD Need? 8 Where Can I Get The Loads Data? Step 2 Step 3 10 How Do I Get the Loads Data Into GLD? 10 How Do I Choose A Pump? 21 CHAPTER 3 Heat Exchanger Design Step 4 Step 5 26 What Is The Studio Link System? 26 How Do I Start Designing? 28 NOTE: To start designing immediately, begin at STEP 1 and continue through STEP 7. Step 6 and 7 W E L C O M E T O G R O U N D L O O P D E S I G N Chapter 1 Welcome To Ground Loop Design W elcome to Ground Loop Design (GLD) Premier Version 5.0, Gaia Geothermal’s comprehensive ground source heat pump system design software. GLD offers engineers and designers a suite of rapid, user friendly, customizable and accurate design optimization tools. With GLD, designers spend less time designing and more time offering competitive proposals, installing systems, and satisfying customers. As you progress through this Getting Started Guide in the next 25 minutes, you will create your first design and also will learn how GLD can help you design faster and more effectively. Thank you for your interest in GLD. We think you will enjoy the program. New in Version 5.0 Ground Loop Design Premier Version 5.0 adds a range of features to the program including: · fixed temperature and fixed length design modes in the borehole design module. In fixed temperature mode, designers specify inlet temperatures and the program calculates bore lengths. In fixed length mode, designers specify a loopfield length (borehole length x number of boreholes) and then have the program calculate heating and cooling inlet temperatures · monthbymonth inlet temperature calculations and reports so the designer can see how the fluid temperatures vary over the design lifecycle (borehole design module only) · automatic graphing of monthly temperature and power data (borehole design module only) · a boiler hybrid feature for even more advanced hybrid designs 1 W E L C O M E T O G R O U N D L O O P D E S I G N · a borehole field importer so that GLD can model nonrectangular loopfield designs · an enhanced user interface for faster design work · new professional reports GLD Features FULL POWER 3 Types of Heat Exchangers 2 Types of Loads Inputs Vertical • Horizontal • Surface Water ZonebyZone • Average Block The premier version of Ground Loop Design includes three design modules: one for vertical borehole, one for horizontal and one for surface water (pond, lake, etc.) installations. By combining designs and the builtin cooling tower/boiler sizer, users can quickly create hybrid systems. GLD also includes two loads modules, one for average block loads and one for detailed zonebyzone loads. Both can be used to manually or automatically select from hundreds of included watertoair and watertowater heat pumps. The loads data can be shared between modules using Ground Loop Design’s unique linking system. In addition, data from external loads programs (the Trane System Analyzer, for example) as well as from Excel files can be imported conveniently into the loads modules. COMPLETE CUSTOMIZATION Pumps • Data Sheets • Reports • Help Files Because of the extensive customization and override features included in the software, Ground Loop Design is suited ideally for both standard and non standard applications (which can involve significant variations in equipment, loads, and operational parameters for each zone in the design). The user, who may prefer to add his or her specific images or data sheets, has the freedom to customize the data reference files. EFFECTIVE COMMUNICATION English Units • Metric Units • Pro Reports • Multilingual With instant, direct metric/English unit conversions and foreign language capabilities, Ground Loop Design is a truly international program. With Ground Loop Design, communicating project parameters, equipment requirements and loads data with coworkers, partners, and vendors anywhere in the world is efficient and easy. Furthermore, after designing a project, it is effortless to email the small project and zone files to colleagues. 2 W E L C O M E T O G R O U N D L O O P D E S I G N Why This Guide? The primary purpose of this Getting Started Guide is to show you how to design quickly and effectively with GLD. To meet this goal, this guide will take you step bystep through the design of a vertical borehole heat exchanger for a commercial building. · In chapter 2, you will learn how to choose the appropriate loads module for the sample project. After choosing a module, you will discover how easy it is to import loads into GLD. Next, you will learn how to match the pumps to the loads using GLD’s automatic and manual pump selection options. · After mastering the loads side of the program, you will look at the heat exchanger side. In Chapter 3 you will design a sample vertical borehole system for the project using the loads data we import in Chapter 2. You can explore the horizontal design module and surface water module on your own. · In chapter 4, you will learn how to print out professional reports that are as impressive as your designs. The guide concludes with a series of tips that will help you take full advantage of the program. The secondary purpose of this guide is to introduce you to some of the more advanced features of the program. A complete description of the program can be found in the full User Manual. The following icons appear throughout the guide: STEP 1 i This icon appears in the left margin of this guide at the beginning of every major step in the design process. If you want to focus your time mainly on learning how to design, just follow these icons stepbystep through the sample design. This icon appears in the left margin when this guide offers more detailed information about GLD With no further ado, let’s get started. First, we will install the program. 3 W E L C O M E T O G R O U N D L O O P D E S I G N System Requirements A full installation has the following minimum hardware requirements: · 256 MB Ram · 65 MB hard disk space (130 MB recommended) Ground Loop Design has the following software requirements: · System running under Windows ® 9X/ME/NT/2000/XP/Vista · Netscape Navigator ® or Internet Explorer ® Installation Procedure This section describes the installation procedure for Ground Loop Design (from a CD or downloaded version). Step 1 Initial Installation STEP 1.0 The installation should start automatically when you put the CD into the computer. If it does not, explore the CD drive and click on the Setup.exe file included on the disk. For the downloaded version, click on GLDSetup.exe to start the installation procedure. The program is set to install in the folder: (Main Drive):\Program Files\Gaia Geothermal\Ground Loop Design Premier If desired, the user can specify a different location during the installation sequence. The full GLD user manual is installed on you computer when you install GLD. You can access it by going to START → Program Files → Ground Loop Design → Manual. The full manual contains extensive reference information and a full description of the entire program. Reinstallation demo continues on page 10 If the user reinstalls or replaces the software with a more recent version, the user either can uninstall the program (see Note below) or can just update a current version (versions subsequent to Version 2.0). To completely remove a version, go to the Windows Start Menu à Settings à Control Panel à 4 W E L C O M E T O G R O U N D L O O P D E S I G N Add/Remove Programs and choose to remove “Ground Loop Design”. After removing the program, please conduct the new installation as described above. As long as the user does not manually delete folders, existing work files, pumps, and zone files will not be affected. NOTE: The file “Pumplist.gld” in the \Ground Loop Design\pumps folder will be overwritten upon reinstallation. If the user has added pumps other than those originally included with the program, this file should be copied or moved to a backup directory prior to removal and reinstallation. After reinstallation, the Pumplist.gld file can be returned to the \Ground Loop Design\Pumps folder or the desired contents can be added to the contents of the new Pumplist.gld file using a simple text editor like Notepad.exe. Software License Dongle Your GLD software license is stored on the USB dongle that came with your program. This dongle enables you effortlessly to transfer GLD from one computer to another. Please be careful not to misplace this dongle. Lost dongles can not be replaced without the purchase of a new license. If the dongle is not attached to your computer, GLD will function as a trial version, which is fully functional except for a few design parameters that are locked at certain values. When you insert the dongle into a free USB port on your computer for the first time, your computer most likely will recognize the dongle and after a few seconds, the dongle light will turn on. When it turns on, your license will activate. However, if your computer indicates that the dongle is “new hardware” you have two options for installing the dongle driver: How to Install the Dongle Driver: Windows Vista, XP and Windows 2000 users with internet access: If your computer has access to the internet, your computer can automatically install the drivers. Follow along with the Windows new hardware wizard to install the drivers. The process takes a few minutes. When the installation is complete, the dongle light will turn on. All other users: Via Windows Explorer, navigate to: 5 W E L C O M E T O G R O U N D L O O P D E S I G N (Main Drive):\Program Files\Gaia Geothermal\Ground Loop Design Premier\Extras In the Extras folder you will find a HASPUserSetup.exe program. Run the program to install the dongle driver. When the installation is complete, the dongle light will turn on. After Dongle Installation is Complete: Now that the dongle is installed, you can access the full functionality of the GLD version that you purchased. If you remove the dongle, the program will revert to demo mode. If you reattach the dongle, the program will reactivate again. 6 L O A D S A N D P U M P S Chapter 2 Loads And Pumps i G round Loop Design is a commercialgrade heat exchanger design program and uses heat transfer models that takes longterm thermal effects into account. The program is ideally suited for commercial applications but can be used effectively for residential projects as well. Regardless of the project type, note that the results that GLD calculates are only as good as the information that the designer inputs. It is ultimately the designer’s responsibility to confirm that input values are reasonable. Why Does GLD Have Both Average Block And Zone Loads Screens (Modules)? i GLD offers two different loads input systems to match the widest possible range of users’ needs. The following summarizes the benefits of and the differences between the two loads modules. Average Block Loads Module The Average Block Loads module offers a rapid method of entering whole systems information for users who do not desire to input the loads data for a fully zonedivided installation. Rather than matching specific pumps to each zone, the Average Block Loads module uses a particular, userdefined style of pump (or COP) and matches it in an average way to the entire installation. Additionally, the module can now accept monthly total and peak loads for use in monthly inlet temperature calculations (in the borehole design module). 7 L O A D S A N D P U M P S Use The Average Block Loads Module When: · You want to design the heat exchanger quickly and/or · You intend to primarily use one type of pump for the entire installation and/or · You have total system loads data but not zonebyzone data and/or · You want to calculate monthly inlet temperatures for a vertical borehole heat exchanger system. Zone Manager Loads Module The Zone Manager Loads module is provided for designers who desire a full analysis capability. Loads are input as separate zones, and each zone is matched with a particular pump. This mode is more useful when users require thorough designs. Use The Zone Manager Loads Module When: · You intend to/need to match specific pumps to specific zones and/or · You intend to design systems with both watertowater and watertoair pumps and/or · You have loads data for each zone i What Loads Data Does GLD Need? GLD is capable of processing hourbyhour loads data for both the cooling and the heating sides for an entire year. However, to save time when inputting the data, designers only need the following minimum data to begin using the program. Note that the more detailed the loads data are, the more accurate the final design will be. Minimum Loads Data Requirements for the Average Block Module: · Total heating and cooling loads for each month of the year (in kBtu or kWh) · Peak hourly heating and cooling loads for each month of the year (in kBtu/hr or kW) 8 L O A D S A N D P U M P S Minimum Loads Data Requirements for the Zone Manager Module: · Total heating and cooling loads for each month of the year for each zone (in kBtu or kWh) · Peak hourly heating and cooling loads for each month of the year for each zone (in kBtu/hr or kW) GLD uses these data both to match pumps to loads and to determine the appropriate length of the heat exchanger. The mathematical models that GLD uses are described in detail in the User Manual. Briefly, GLD uses the loads data to determine hourly, monthly and annual heat pulses into the ground. The hourly heat pulse is based on the peak hourly heating/cooling loads. The monthly heat pulse is related to a “monthly load factor” which is calculated in the following method: Total heating or cooling loads for a given month Peak hourly heating/cooling load for a given month x number of hours in that month The annual heat pulse calculation is known as the “annual equivalent full load hours.” The “full load hours” is calculated in the following way: Total heating/cooling for the year Peak hourly heating/cooling load To put it in a less mathematical way, “full load hours” is the number of hours a system would have to run continuously at its peak hourly rate to reach its total annual heating/cooling loads. For example, if the peak hourly cooling load is 100kBtu/hr and the total annual cooling load is 1000KBtu, the “full load hours is (1000kBtu)/(100kBtu/hr) = 10 hours. The “full load hours” nomenclature is nothing more than a shortcut for representing total annual heating/cooling loads. The peak hourly loads, the monthly load factors and the full load hours are all used by the program. This nomenclature may seem a bit confusing initially but after designers become accustomed to it, they appreciate the time it saves them if and when they have to manually input loads data into GLD. It’s much faster than inputting hourbyhour loads for an entire year! 9 L O A D S A N D P U M P S For monthly inlet temperature calculations, GLD uses a line source theory that enables the program to generate monthly temperature profiles over time given monthly loads and peak data. i i Where Can I Get The Loads Data? GLD users oftentimes get their loads data from commercial loads calculation programs such as the Trane System Analyzer. This type of program outputs data that are both detailed and in a format that GLD can import automatically. On occasion, however, the output data needs to be manually manipulated in Excel prior to transferring it into GLD. This process will be explained below. Users with significant residential but limited commercial design experience should note that commercial applications require more detailed data than that with which they may be familiar. GLD only outputs good results when the user inputs good loads data. How Do I Get The Loads Data Into GLD? After calculating or receiving the appropriate loads data, there are three easy ways to get the data into GLD: · GLD can automatically import the output files from programs such as the Trane System Analyzer · GLD can import the loads data from an Excel spreadsheet provided that the loads data follows a prescribed format (more on this below) · GLD can accept input directly into the loads screen text boxes Each of the three methods is explained below. For the demonstration project, please follow the first method. Importing Loads Data From Commercial Loads Analysis Programs Step 2 STEP 2.0 STEP 2.1 For the demo project, we will import a Trane System Analyzer file into the Average Block loads screen. Open up the GLD program. You will see the program desktop (also known as the Design Studio). Near the top of the program you will see a row of icons. The icon for the Average Block Loads module looks like this: 10 L O A D S A N D P U M P S Click on the icon. STEP 2.2 The Average Block Loads module is now open. It looks like this: Average Load Block Module With No Open Zone STEP 2.3 Click on the New icon to open up a new loads file. The icon looks like: and can be found at the top of the Average Block Loads module. A new loads screen with zeros for every parameter is now open. STEP 2.4 We are now ready to import a sample Trane System Analyzer file that is included with GLD. At the top of the Average Block Loads module, there are a series of icons: Click on the Loads Files Import button: 11 L O A D S A N D P U M P S A dialog box opens up that allows you to choose a loads file to import into GLD. To find the sample Trane file, confirm that you are in the Program Files/Gaia Geothermal/Ground Loop Design Premier/Zones folder. Open the sample.gt1 file. When you select a valid import file, GLD automatically transfers the loads data into the Average Block Loads module. An Import Loads window opens as well and shows the imported data in detail. Both windows are shown below: Average Block Loads Module With Imported Data 12 L O A D S A N D P U M P S Import Loads Window: Cooling STEP 2.5 In the Import Loads window above there are three columns: Total Monthly Loads, Peak hourly loads (for each month) and the Monthly Load Factor. The Monthly Load Factor is described in great detail in the full User Manual. Near the bottom of the window are total kBtus (a summation of January through December) and the peak hourly kBtu for the year. At this step in the design, it is possible to modify the imported cooling and/or heating loads data. Click on the Heating button at the bottom of the Import Loads window. It will look like this: 13 L O A D S A N D P U M P S Import Loads Window: Heating STEP 2.6 In this step, you will modify the imported heating loads data. GLD offers designers flexibility at every step in the design process and this data modification capability is just one example of that flexibility. Modify the imported data by inputting these values in the appropriate Total and Peak boxes: · · · · · · · · · · · · January: February March April May June July August September October November December 190000 kBtu 188800 kBtu 154000 kBtu 70000 kBtu 39000 kBtu 27000 kBtu 14000 kBtu 22600 kBtu 44000 kBtu 123000 kBtu 137000 kBtu 155000 kBtu 14 570 kBtu/hr 470 kBtu/hr 400 kBtu/hr 250 kBtu/hr 140 kBtu/hr 60 kBtu/hr 43 kBtu/hr 42 kBtu/hr 67 kBtu/hr 145 kBtu/hr 350 kBtu/hr 450 kBtu/hr L O A D S A N D P U M P S After inputting this modified data, the heating side of the Import Loads window will look like this: Import Loads Window: Modified Heating Data Notice that the total annual KBtus and the Full Load Hours have increased accordingly. You also can calculate the Full Load Hours by clicking the Modify button. A new window, the Equivalent Hours Calculator, will open up: 15 L O A D S A N D P U M P S Equivalent Hours Calculator i STEP 2.7 The Equivalent Hours Calculator is a handy tool included with GLD to help you calculate the full load hours. Notice that the peak hourly load, the monthly total load and the full load hours are identical to those in the Import Loads window. In the future, as you design with GLD, use this tool when you want to quickly calculate full load hours. For the time being, please click the Close button to close the calculator. Now we are ready to take our first detailed look at the Average Block Loads module. On your screen, you should still have both the Import Loads and the Average Block Loads windows open. Take a look at the Average Block Loads data: Average Block Loads Data 16 L O A D S A N D P U M P S Notice that the Annual Equivalent FullLoad Hours are 1559 for cooling and 54 for heating. In the Import Loads window, however, the full load hours for heating are 2043. The heating value in the Import Loads window is higher because we modified the data. To transfer the modified data into the Average Block Loads module do the following: · Push the Transfer button in the Average Block Loads module. It is located right beneath “Days Occupied per Week.” The heating full load hours value should have increased to 2043, just as we wanted it to do. Your screen will look like this: Modified Average Block Loads Data i As the Average Block Loads image above indicates, the entire hourby hour loads for an entire year for both heating and cooling are distilled down to five key values. These values include four time periods (8am noon, noon4pm, 4pm8pm and 8pm8am) and the Annual Equivalent Full Load Hours. GLD calculates based on hourbyhour data. However, for simplification, average peak loads for the design day (the day of heaviest usage in the year) for both cooling (heat gains) and heating (heat losses) can be input for up to four separate times of the day. A detailed description of how GLD determines the loads for each time period can be found in Chapter 3 of the User Manual. Click on the Monthly Loads button to see the monthly loads that were imported into the Average Block Loads module. 17 L O A D S A N D P U M P S Monthly Loads Data Screen The loads data in the module are necessary for calculating monthly inlet temperatures in the Borehole Design Module. For information regarding hours at peak, see the user manual. Click the Update button to return to the design day loads screen. STEP 2.8 Finally, take a look at the days per week value, which represents the occupation of the installation. In the demo, the school is only occupied during weekdays. Input the following data: · Days Occupied Per Week: demo continues on page 21 5.0 SUMMARY: So far we have imported a Trane System Analyzer loads file into GLD. When we imported the file, the data were transferred automatically into both the Import Loads window and the Average Block Loads module. The Import Loads window opened so that we could examine the imported data and also so that we could have a chance to modify it if necessary. Since we did modify the data, we had to click the transfer button in the Average Block Loads module to transfer the data into the Loads Module. GLD does the pump matching and the heat exchanger 18 L O A D S A N D P U M P S design based only on the loads data in the Loads module and not on the data sitting in the Import Loads window. i Excel Data: How To Get ExcelBased Loads Data Easily Into GLD Designers oftentimes receive loads data in Excel spreadsheets. GLD has an Excel import function to handle this situation. In this section of the Getting Started Guide, we will explain the general procedure for importing Excel data and then work through an example. The easiest way to import data from an Excel file is by using the ‘Import Loads’ command found under the Loads menu which is located at the top of GLD. Select ‘Import Loads’ and a empty Import Loads window will appear: Empty Import Loads Window The next step is to prepare the data in the Excel file so that it matches the format that GLD expects. This is an important step. If the designer fails to follow this step, data will not be imported correctly. GLD expects the Excel data to be in the following column order and units (note that Ground Loop Design can accept a maximum of 12 data rows per column): 19 L O A D S A N D Month P U M P S Total Cooling 1000 BTU Peak Cooling 1000 BTU/hr Total Heating 1000 BTU Peak Heating 1000 BTU/hr January … December To import the Excel data, simply highlight the four columns in the Excel spreadsheet and copy them onto the clipboard (CtrlC). Note: highlight only the numeric data. DO NOT highlight the column and row descriptions. Then in the Import Loads window click on the green Excel icon found near the top of the Import Loads window. The data will be imported. Data can be modified (if necessary) and transferred into the loads modules following the method described in step 2.6 above. The data are simultaneously imported into the Loads Module (either Average Block or ZoneManager, depending on which one the designers has opened). Note that it is possible to import a single column of data. Following the column order listed above, put the single column of data in the correct position. Fill the remaining columns with zeros and then copy all four columns to the clipboard. Summary: We have learned how to easily import Excel data into GLD. Two key points to remember are the following: confirm that the Excel data are in the correct units and make sure the columns are in the appropriate order prior to copying the data onto the clipboard. i Manually Inputting Data Into The Average Block Loads Module Loads can be entered manually in one of the following ways: · through the individual loads data time slots · through the monthly data input screen in the Average Block Loads module. In the first case, if only one peak value during the day is provided to the designer, it can be entered into one or several of the time slots, depending on how the loads will be expected to change during the 20 L O A D S A N D P U M P S course of a day. Slightly reduced values can be added for offpeak hours if the building still will be in operation but not at full load. Insignificant time slots can be left at zero. In the second case, monthly total and peak loads can be entered and the program automatically distributes the data into the data time slots following an algorithm described in the User Manual. It is recommended that users that allow the program to automatic distribute the loads data familiarize themselves with this algorithm. If both cases, if only cooling or only heating loads data are to be used, all of the nonused slots should remain as zeroes. Only the side with the loads provided will be calculated. How Do I Choose A Pump? Step 3 STEP 3.0 With the Average Block Loads module, the user selects a single pump type from the GLD Heat Pump Database (information about the built in and fully modifiable Database can be found in the full User Manual) to approximate the average characteristics of the installation. For example, if the designer is planning to use the highest efficiency pumps, a pump in a series with a higher coefficient of performance (COP) might be chosen over a lower efficiency pump. If specific pump characteristics are required, they can be input directly, overriding the automatic functions. To choose a pump, look at the bottom half of the Average Block Loads module: Pump Characteristics in the Average Block Loads Module 21 L O A D S A N D P U M P S With no pump currently selected, the Custom Pump box is checked, and all pump performance values are at 0.0. To select a pump, click the Select button. This is what you will see: Pump Selection in the Average Block Loads Module STEP 3.1 In this screen, you can choose a manufacturer, pump series, and pump name and then click the Select Pump button. Note that performance specification data for all the heat pumps in the GLD heat pump database can be accessed through the Heat Pump Module. To access this module, click on the Edit/Add Heat Pumps choice under the Heat Pumps menu item that can be found at the top of the GLD program (above the main program icons). For this demonstration, please choose: · manufacturer: Florida Heat Pumps · pump series: EV Series · pump name: EV048 Click on the Select Pump button. The screen now looks like this: Selected Pump Performance Characteristics STEP 3.2 Click on the Details button to see details about the selected EV048 pump: 22 L O A D S A N D P U M P S Selected Pump Details This screen displays details about the selected pump. It also displays the load side Entering Air Temperature (EAT) for both cooling and heating. GLD employs an accurate system for modeling heat pump performance. Both source and loads side factors affect heat pump performance and GLD models these factors. Users can modify the EAT as necessary for specific design applications. In this demonstration, the EAT values will not be modified. More information about how GLD models heat pumps can be found in Chapter 2 of the User Manual. STEP 3.3 Click the Return button to go back to the original view: Selected Pump Performance Characteristics Users now have the opportunity to modify system flow rates, unit inlet temperatures and pump performance parameters, Note that when we design the vertical borehole heat exchanger in the next chapter, you will have the opportunity to modify the flow rate and unit inlet temperatures. For the time being, use the following values: · Flow Rate: 3.0 gpm/ton 23 L O A D S A N D P U M P S · Cooling Inlet Temp: 85 0 F · Heating Inlet Temp: 50 0 F Note that if you want to use metric units, just click on the English/Metric units conversion button: It can be found at the top of the GLD program at the very right end of the row of icons. STEP 3.4 In addition, users can manually override any performance values by simply clicking in the appropriate dialog box and typing in a new value. If you do this, the “custom pump” box will become checked automatically to remind you that you have modified the standard data. Modifying the standard pump data is useful when you intend to use a customized pump. Also, some designers modify the Partial Load Factor by dropping it down from the idealized value of 1.0. As a final step in optimizing the loads data, change the following input: · Heating Partial Load Factor: 0.93 When you do so, notice how the other performance characteristics on the cooling side are modified automatically. STEP 3.5 At the top of the Loads module, enter the following reference label: · Reference Label: STEP 3.6 demo continues on page 26 Vertical Demo Project Now save the loads data. Click on the floppy disk icon at the top of the Average Block Loads module. Save the file in Program Files/Gaia Geothermal/Ground Loop Design/Zones as Demo.zon. Summary: We have imported loads data into the Average Block Loads module, set the occupation level to 5.0 days a week, selected a pump, and modified the cooling partial load factor. This is what your Average Block Loads module should look like: 24 L O A D S A N D P U M P S Average Block Loads Module: Ready for Heat Exchanger Design 25 H E A T E X C H A N G E R D E S I G N Chapter 3 Heat Exchanger Design G Round Loop Design includes vertical, horizontal and surface water heat exchanger design modules. As you continue with the vertical heat exchanger design, you will begin to see how the modular nature of GLD offers so much flexibility (modular meaning the Average Block loads module is a separate and independent module, the Vertical Borehole design module is a separate and independent module, etc). Although each module is standalone and independent, the modules communicate and share data with each other via the Studio Link system. STEP 4 STEP 4.0 What Is the Studio Link System? The best way to describe the Studio Link system is to demonstrate it. Please open a new Vertical Borehole Design module. You can do this by clicking on the Vertical Borehole icon. It is the first icon to be found in the top left corner of GLD and looks like this: When you click it, a new window will open in GLD. This is the Vertical Borehole Design window (or module). It looks like this: 26 H E A T E X C H A N G E R D E S I G N New Vertical Borehole Design Module STEP 4.1 Push the Calculate button and see what happens. Nothing happens because there is no loads data that are linked to the Borehole module. We now have to connect the data we entered in the Average Block Loads module to the Borehole Design module. The Studio Link system will help us do this. At the top of GLD look for the following two icons: link unlink STEP 4.2 The icon on the left is the link icon and the icon on the right is the unlink icon. Click on the link icon and see what happens. Notice in the bottom left corner of both modules (the Borehole module and the Loads module) that there is a lighted box. It looks like this: This box indicates that the two modules are linked and have bidirectional communication. 27 H E A T STEP 4.3 STEP 4.4 Step 5 E X C H A N G E R D E S I G N Now click the unlink icon. You will notice that the position and color of the light has changed, indicating that the two modules are no longer communicating. It looks like this: Push the link button again to reestablish communications. Now That My Loads Data Are Linked To The Borehole Designer, How Do I Start Designing? The Borehole Design module allows the user to enter various parameters with respect to the desired vertical borehole system using a tabbed series of panels as seen below: Borehole Design Panel List i In the expanded user interface mode, which can be expanded by double clicking on any of the tabs, the most commonly modified parameters as well as calculation results are always visible, as seen below. 28 H E A T E X C H A N G E R D E S I G N Expanded User Interface Just as a reminder, we entered the loads into the Average Block Loads module. We chose to use the Average Block Loads module instead of the Zone Manager because the Average Block Loads module is ideally suited for situations in which you want to a) start designing quickly and/or b) use the same pump throughout most of the design. STEP 5.0 STEP 5.1 Click on the Information tab to open the Information panel. Any information you type in this panel will be included in all reports. Reports will be introduced in Chapter 4. In the Information panel, please enter the following data: · project name: Gaia Headquarters · client name: Your Choice · address: Your Choice STEP 5.2 Now click on the Extra kW panel that is directly to the left of the Information Panel. This is what you will see: 29 H E A T E X C H A N G E R D E S I G N Extra kW panel i The top entry box, “Circulation Pumps”, is for the energy required by the system circulation pumps. The middle entry box, “Optional Cooling Tower”, is for the energy required by a cooling tower (if used). The lower entry box, “Additional Power Requirements”, is for all other elements (besides the heat pump units) in the system that may require energy input. Generally, cooling tower inputs are left at zero initially, and then modified once the program suggests the cooling tower size and flow rate. Note: To make a kilowatt entry in the ‘Pump Power’ box, switch to metric units, enter the kilowatt value, and then return to English units. You can do this by clicking on the metric/English units conversion button: 30 H E A T E X C H A N G E R D E S I G N This button can be found near the top of the program at the far right end of the row of icons. Pump Power Calculator i Click on the Pump Power Calculator button to open the calculator. It looks like this: Pump Power Calculator If the pump efficiency, system flow rate and head loss are known, the Pump Power Calculator can be used to determine the pump power. Click on the Close button. STEP 5.3 For this demo, we will input the following values in the Extra kW Panel: · · · · Pump Power: Pump Motor Efficiency: Additional Power: Cooling Tower Inputs: 2hp 85% 1 Kw 0.0 for all After we finish the basic design, we can decide whether or not to use a cooling tower (we won’t since this is a heating dominated system). If we decide to use a cooling tower, we can come back and input the appropriate values later. STEP 5.4 Now click on the Pattern tab. This is what you will see: 31 H E A T E X C H A N G E R D E S I G N Pattern Panel i Information pertaining to the ground field arrangement is in the Pattern panel. This includes the vertical boreholes pattern, the borehole separation, the optional selection of external grid files, the number of boreholes per parallel loop, and the fixed borehole length design option. Pattern, borehole separation and external grid file data also are visible and adjustable in the expanded user interface. See the User Manual for information about grid files and the fixed length mode. Note: The separation between vertical bores value is the centerto center distance between adjacent bores. STEP 5.5 For this demo project, input the following values: · · · · Number of Rows Across: Number of Rows Down: Borehole Separation: Bores per Parallel Circuit: 10 2 20 ft 1 After we finish our initial design and determine what our total pipe and drilling requirements are, we will be able to modify these input values. 32 H E A T STEP 5.6 E X C H A N G E R D E S I G N Now click on the UTube tab. The screen will look like this: UTube Information i The UTube panel contains information related to the pipe and bore. The main purpose of the panel is to obtain a value for the borehole thermal resistance. The thermal resistance calculation takes into account the pipe parameters and positioning, the borehole diameter, and the grout thermal conductivity. If desired, an experimentally determined value of the borehole resistance also may be entered into the textbox, which then overrides all calculations. Note: By pressing the ‘Check Pipe Tables’ button, the ‘Pipe Properties’ tables will open. Note: The radial pipe placement can be one of the following: · Close together 1/8” average distance between the pipes · Average pipes are centered at a point halfway between the wall and the center of the bore 33 H E A T E X C H A N G E R D E S I G N · Along outer wall pipes are along the outer wall as is the case when Geoclips TM are used in the installation process STEP 5.7 Note:: The ‘Double’ Utube configuration at this stage is added more for reference than for practical use. Currently, the values Ground Loop Design uses are based on experimental data and a new theoretical model accounting for a lower pipe and convective resistance, and a larger displacement of the grout. Designers should be aware of this fact, and remember that a ‘single’ Utube is the standard option. In this demo, input the following values: · · · · · · · Pipe Size: Pipe Type: Flow Type: Radial Pipe Placement: Utube Configuration: Borehole Diameter: Thermal Conductivity: 1 in SDR11 Turbulent Average Single 5.00 in 1.0 Notice that the borehole thermal resistance changes automatically as you modify the pipe size and the thermal conductivity. After we complete the initial design we will return to this panel to modify other parameters. STEP 5.8 Now please click on the Soil tabbed panel. You should see the following screen: 34 H E A T E X C H A N G E R D E S I G N Soil Panel i Input parameters relating to the soil are located in the Soil panel, as shown above. These include the average ground temperature and the soil thermal properties. Since thermal conductivity has a particularly large effect on the bore length calculations, it should be determined with care through insitu tests or comparisons with other projects installed in the local vicinity. In addition, the modeling time period can be modified here. Note: For the modeling time period, ten years is used as a standard length of time for the ground temperature to stabilize, although longer time periods may be entered if desired. Diffusivity Calculator For the designer’s assistance, Ground Loop Design includes a Diffusivity Calculator that can be used to determine the actual diffusivity if all the soil parameters are known. To access the calculator, click on the Diffusivity Calculator button located near the bottom of the Soil tabbed panel. 35 H E A T STEP 5.9 E X C H A N G E R For this demo, input the following values into the Soil panel: · · · · STEP 5.10 D E S I G N Ground Temperature: Thermal Conductivity: Thermal Diffusivity: Prediction Time 58 0 F 1.22 0.75 10 years Now we are ready for the Fluid panel. Please click on the Fluid tab. Your screen will look like this: Fluid Panel The circulating fluid parameters may be entered in the Fluid panel. Note: The system flow rate per installed ton is included on the Fluid panel. This is the system flow rate per ton of peak load, not installed capacity (This is because it is assumed that all units will not be running at full load simultaneously, even in the peak load condition). Note: GLD is a modular program meaning that the program consists of several modules that work together to assist you with your designs. The fluids panel offers one of the most obvious examples of how the different modules communicate with one another. Take a look at the Average Block 36 H E A T E X C H A N G E R D E S I G N Loads module once again. Notice that the flow rate and the unit inlet temperatures at the bottom of the Average Block Loads Module match those of the Fluids panel. Change the cooling inlet temperature in the Fluids panel to 90 o F. Then, click your mouse pointer anywhere inside the Average Block Loads Module. The Average Block Loads module cooling inlet temperature automatically updates itself along with the pump performance characteristics. This connectivity saves designers much time. This feature is especially useful when designers are using the Zone Manager Loads module (Chapter 3 in the User Manual). While this feature is a tremendous timesaver, the new calculated equipment capacities can lead to changes in selected equipment so the designer must be aware of the changes. Customized pump values must be manually adjusted. The solution properties also may be entered in the Fluid panel. In automatic entry mode, the user first selects the fluid type and then selects the desired freezing point. Ground Loop Design automatically displays the specific heat and density for the fluid selection. In manual entry mode, the user manually selects and inputs the specific heat and density for the target solution. Note: Since solution properties vary considerably and nonlinearly with type and percentage of additive, Ground Loop Design does not include detailed automatic antifreeze information for all conditions. Generalized tables of data may be found in the ‘Fluid Properties’ tables. It is recommended that the designer manually enter the desired values in the input text boxes. STEP 5.11 For this demo, input the following values into the Fluid panel: · · · · · · STEP 5.12 Cooling Inlet Temperature: Heating Inlet Temperature: Fluid Type: Freezing Point: Specific Heat: Density: 90 o F 50 0 F Ethylene Glycol 25 0 F 0.98 (auto entry) 63.5 (auto entry) We are now ready to perform our initial calculation. Double click on any of the tabs to bring up the expanded user interface if it is not already open. 37 H E A T E X C H A N G E R D E S I G N Then, click on the Calculate button. Your screen should look something like this: The Initial Calculation i All results for both the heating and the cooling calculations can be viewed at any time on the Results panel. Summary results (lengths and temperatures) always are available at the top of the expanded user interface. After all data has been entered or any changes have been made, the user can calculate interim or final results using the Calculate button. The two columns on the Calculate panel are for heating and cooling. Although all of the numbers shown are valid and respond to changes, the side with the longer required length is printed in bold type so that it stands out. The “Optional Cooling Tower/Boiler” section is included to assist in the sizing of a cooling tower and/or boiler. This is a convenient tool 38 H E A T E X C H A N G E R D E S I G N for hybridtype designs, which may be desirable when the cooling length exceeds that of heating (cooling towers) or when the heating length exceeds that of cooling (boilers). STEP 5.13 In this demo, the heat exchanger is heating dominated (as expected from the loads data). Notice that there are 20 boreholes (in the Pattern panel we specified a 10x2 grid arrangement) and that each borehole is about 887 feet long. We now will quickly optimize the design. In this demo we do not want to drill deeper than 300 feet and we have access to a large drilling area. Change the grid arrangement by modifying the following data in the Grid Layout section of the expanded user interface: · Number of Rows Down: · Number of Rows Down: · Separation Between Boreholes: STEP 5.14 STEP 5.15 7 7 30 ft Click on the Calculate button again. The individual borehole length has dropped to about 370 feet. Since we increased the number of boreholes, we cut the individual borehole depth. Furthermore, by increasing the spacing between boreholes, we lower the longterm ground temperature change. Since we have not reached our 300 foot goal, more optimization is required. Click on the UTube panel. Change the following inputs: · Radial Pipe Placement: Along Outer Wall Hit the calculate button in the expanded user interface again. Each borehole should be down to approximately 329 feet in length. STEP 5.16 From here, there are a number of ways to continue optimizing the system. In the final step of this demonstration, we will assume the designer wants to add a boiler. The boiler must have a large enough capacity so that 39 H E A T E X C H A N G E R D E S I G N individual boreholes are no longer than 300 feet deep. With GLD, this calculation is straightforward. Find the cooling tower/boiler sliders in the lower left corner of the expanded user interface. Sizing a Boiler On the right side of the sliders notice that the Load Balance is at 0% for both cooling towers (in blue) and boilers (in red). Begin dragging the boiler slider (the lower one) to the right. As you do so, notice what happens to the heatingside length. Keep dragging the balance to the right until you reach an individual borehole length that is at about 300 feet. Your screen will look something like this: 40 H E A T E X C H A N G E R D E S I G N A Boiler Hybrid Design With a 6% load balance in the boiler slider and 49 boreholes, each borehole is now 300.4 feet long. The boiler capacity also can be found at the bottom of the screen. i STEP 5.17 In a perfectly balanced system, the lengths and ground temperature changes for cooling and heating are identical. This balance point represents the maximum boiler capacity that can be added (maximum reduction of pipe length required for heating) while still having enough installed pipe to fully satisfy the cooling requirement. In this example, the actual balance point occurs at a Load Balance of about 31%, with a long term temperature change prediction of about +1.2 degrees Fahrenheit. Play with the boiler slider to see if you can replicate this result. Since this borehole design module is linked to an average block loads module that has monthly loads data, we can calculate and review the monthbymonth inlet temperatures for the system. To do so, click on the 41 H E A T E X C H A N G E R D E S I G N Monthly Data button, which is located directly beneath the calculate button in the expanded user interface. Maximum entering and exiting fluid temperatures for both the heating and cooling sides are displayed in purple, right next to the unit inlet and outlet temperatures, as seen in the figure below. Note that the inlet temperatures from the monthly data calculations are not always equal to the initial temperatures selected in the fixed temperature mode or calculated in the fixed length mode. This is because the program is using the more detailed data set in a stepwise manner to calculate the temperature buildup over time. The differences that result are due to differences in the theoretical models methodology. See the User Manual for a description of the models. Calculated Maximum Inlet Temperatures Results STEP 5.18 This is the final step. To the right of the Monthly Data button, click the graph icon that looks like this: 42 H E A T E X C H A N G E R D E S I G N to see a graph of the monthly temperature data. A Graph of Monthly Temperature Data If you make modifications to the design, recalculate monthly data, and graph the data again to see the impact of the design change on the temperatures. demo continues on page 44 Summary: In this chapter, we learned how to link the loads and heat exchanger modules, how to input heat exchanger design parameters and how to optimize a design by modifying parameters (including hybrid cooling tower parameters). GLD also contains Horizontal and Surface Water Design modules (explained in Chapters 5 and 6 in the User Manual) which you can use in the same way as the Vertical Borehole module. In the next chapter we will show you how to print reports and email project files as well as how to begin taking advantage of some of the more powerful GLD features. 43 R E P O R T S A N D D E S I G N T I P S Chapter 4 Reports And Design Tips W hether you have finished your design and want to send customized reports to vendors, clients and colleagues or need to collaborate on a design with a coworker halfway around the world, GLD offers a variety of communication tools to help you work effectively. In this final chapter, we will show you how to choose and print reports, how to email project files so that colleagues can review, modify or approve designs, and how to take advantage of a few of the many other features that GLD offers. i Step 6 STEP 6.0 Reports At any step in the design process, you can choose to print out a variety of reports including five types of loads/zone reports and two types of heat exchanger reports. Zone Reports You should still have the Average Block Loads module open. At the top of the module you will see a print icon. Click on it and a dialog box will open that looks like this (equipment and names reports are available only in the Zone Manager Loads module. 44 R E P O R T S A N D D E S I G N T I P S Loads Report Choices Zone (or loads) reports include only the project information and data from the zones. Five different zone reports exist, containing complete or specific information about the zones. Zone reports are representative of the actual installation rather than the heat exchanger portion of the system. There five different zone report choices include: · Concise Form: Contains important info about loads and operational parameters of equipment · Detailed Form: Contains all info for every zone and a full explanation of the listed parameters · Equipment List: Contains the equipment for each zone. This report is ideal for engineers or contractors who require only equipment details · Loads List: Contains the loads at different times in the day for each zone. · Names List: Contains the full reference names of every zone, the zone number and pump information. This report is useful for when a project has many zones STEP 6.1 Explore the different reports and print one out. Notice that the project information you entered in the Information panel of the Borehole Design module appears in all the reports. Project Reports Step 7 STEP 7.0 Now look at the row of icons at the top of the GLD program. Find the print icon and press it (if you cannot click on the print icon, first click the mouse within the Borehole Design module window). You will see a screen that looks like: 45 R E P O R T S A N D D E S I G N T I P S Project Report Options The six different project reports include: · Concise Form: Contains essential project info while excluding comments · Detailed Form: Contains full project info · Input Data with Loads Form: Contains full project info and full loads data · Input Data with Loads and Temps Form: Contains full project data, loads data, and complete monthly temperature data · Detailed Temperatures Form Contains complete monthly temperature data · Temperatures Only Form: Contains monthly temperature data STEP 7.1 Choose to print a detailed form and take a look at it. Sharing Project Files With Colleagues GLD saves zone files (from the Loads modules) and project files (from the heat exchanger files) separately. Colleagues that use GLD can receive these files as email attachments and view/modify the project designs and/or the loads data. Below is a brief description of the two types of files. 46 R E P O R T S A N D D E S I G N T I P S Zone Files Zone (loads) files are stored as *.zon files in the Ground Loop Design ‘zones’ directory. They have a general format that can be read into any loads module, and they can be used simultaneously in different design modules. Project Files GLD saves project files as *.gld files in the Ground Loop Design ‘work files’ directory. Each project file type (vertical borehole, horizontal, surface water) has a specific format that GLD automatically recognizes. Sharing Files GLD expects to find the files in the following folders: Zone files: Program Files/Gaia Geothermal/Ground Loop Design/Zones Project Files: Program Files/Gaia Geothermal/Ground Loop Design/Work Files When you send or receive files, confirm that the files are in the appropriate directories before trying to open them within the program. Note: GLD is available in foreign languages (contact your distributor for more information). If you are working with clients or coworkers in other countries, you can just email your files to them and they will be able to read the files in their native language. Geoexchange designs can be complex. In our increasingly interconnected world, you can use GLD to minimize the risk of communication problems while working in multiple languages. Design Tips Congratulations! You now know enough about GLD to begin designing worldclass projects with efficiency and ease. Below you will find a list of suggestions for further exploration and design success: 1. After inputting loads and selecting pumps in a loads module, open up two new heat exchanger design modules. Click on one design module to activate it and then click on the link button. Then, click on the other design module to activate it and once again click on the link button. Now, both design modules are 47 R E P O R T S A N D D E S I G N T I P S linked to the same loads data. Now you can compare two designs at the same time. 2. If you have data in only metric units, but want to work in English units (or vice versa), click the English/metric units conversion button. Enter the data in the units you have and when you are done, click the conversion button again. Now all your data is in the format with which you want to work. You can also print out reports in different units following the same procedure. 3. With the Zone Manager Loads module (see the User Manual, chapter 3) you choose heat pumps in several different ways: a) select a manufacturer and let GLD do the sizing work for every zone; b) select different manufacturers for each zone and let GLD size them; c) manually select manufacturers and pumps for nonstandard applications; d) combine methods a, b and c. 4. Compare and contrast different manufacturers and heat pumps. Finish a complete design, print out a report, and then change which manufacturer(s)/pump(s) you are using. Print out another report and compare. 5. Using the Heat Pump Module (User Manual, chapter 2), input data for a brand new heat pump, confirm that you input the data properly via the test function and then create a design with the new pump. 6. In the Zone Manager Loads module there is a summary view button that allows users to quickly look at all the zone data simultaneously. The summary button looks like this: and can be found in the middle of the row of icons at the top of the Zone Manager. This is useful when you want to quickly review all the work you have done on a multizone installation. 7. GLD comes complete with a full set of reference files including Fluid Properties, Soil Properties, Pipe Properties and Unit Conversions. These files can be accessed from the Tables dropdown menu found at the top of GLD. These files are HTMLbased and can be modified, customized or added to by the user using a text editor or HTML editor. More information 48 R E P O R T S A N D D E S I G N T I P S about customizing these files can be found in Chapter 7 of the User Manual. 8. GLD contains a searchable database of information about the program. Click on the Help dropdown menu and choose help. 9. GLD stores and models heat pump information in the Heat Pumps module. This can be accessed via the HeatPumps drop down menu found at the top of the program. GLD stores individual heat pump data in *.hpd files. If you enter data for a new heat pump, it will be saved in the Ground Loop Design ‘pumps’ directory. You can email these small *.hpd files to coworkers or other users of GLD. They can then put the file in their ‘pumps’ folder and begin using the pumps. More information can be found in the Preface and Chapter 2 of the User Manual. 10. Try designing in fixed length mode. First specify the number of boreholes and each borehole length and then calculate the entering water temperatures for the design. 11. If you need to design a nonrectangular loopfield, read Chapter 4 of the User Manual about how to import grid data files so that you can model other loopfield shapes. Concluding Remarks If you have questions about or suggestions for the program, please contact your distributor. Do you need a particular design feature that GLD does not currently offer? Let us know and we will do our best to include it in future versions. Thank you for choosing Ground Loop Design. 49