1
Pandora FMS 5.0 Advanced Usage Documentation
OpenOffice/PDF Version
1º Edición (España), 22 oct 2013. Written by different authors. More info at http://pandorafms.com
2
Índice
Part 6. Metaconsole
1
2
3
4
5
6
Introduction ............................................................................................................................... 15
1.1. Interface ................................................................................................................................ 16
Comparative ............................................................................................................................. 18
2.1. Before Version 5.0 ................................................................................................................19
2.1.1. Communication .............................................................................................................19
2.1.2. Synchronization ............................................................................................................ 19
2.1.3. Problems.........................................................................................................................20
2.2. From Version 5.0 .................................................................................................................. 20
2.2.1. Communication .............................................................................................................20
2.2.2. Synchronization ............................................................................................................ 21
2.2.3. Improvements.................................................................................................................22
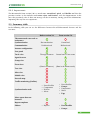
2.3. Summary table ...................................................................................................................... 22
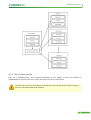
Architecture .............................................................................................................................. 24
3.1. Where are stored the data? ....................................................................................................25
3.2. How Information is got and modified? .................................................................................25
Synchronization ........................................................................................................................ 27
4.1. Synchronization utilities ....................................................................................................... 28
4.1.1. User Synchronization ....................................................................................................28
4.1.2. Group Synchronization.................................................................................................. 29
4.1.3. Alert Synchronization.................................................................................................... 30
4.1.4. Tag Synachronization ................................................................................................... 31
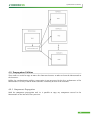
4.2. Propagation Utilities ............................................................................................................. 32
4.2.1. Components Propagation .............................................................................................. 32
4.2.2. Agent Movement ...........................................................................................................33
User Permissions ...................................................................................................................... 35
5.1. ACLs .....................................................................................................................................36
5.2. Tags .......................................................................................................................................36
5.3. Wizard Access Control.......................................................................................................... 36
5.3.1. Visibility ........................................................................................................................36
5.3.1.1. Basic Access ..........................................................................................................36
5.3.1.2. Advanced Access .................................................................................................. 36
5.3.2. Configuration ................................................................................................................ 36
Installation and Configuration .................................................................................................. 37
6.1. Installation ............................................................................................................................ 38
6.1.1. Instances.........................................................................................................................38
6.1.2. Metaconsole .................................................................................................................. 38
6.1.3. Metaconsole Additional Configuration .........................................................................38
6.2. Configuration ........................................................................................................................39
6.2.1. Instances ........................................................................................................................39
6.2.1.1. Giving access to the Metaconsole ......................................................................... 39
6.2.1.2. Auto-authentication ...............................................................................................40
6.2.1.3. Event Replication .................................................................................................. 40
6.2.2. Metaconsole .................................................................................................................. 41
6.2.2.1. Giving access to the Instances ...............................................................................41
6.2.2.2. Instances Configuration .........................................................................................42
3
6.2.2.3. Index Scaling .........................................................................................................43
Visualization ............................................................................................................................. 44
7.1. Monitoring ............................................................................................................................ 45
7.1.1. Tree View.......................................................................................................................45
7.1.1.1. Kinds of trees..........................................................................................................45
7.1.1.2. Levels .................................................................................................................... 46
7.1.2. Tactical View ................................................................................................................ 47
7.1.2.1. Information about Agents and Modules ................................................................47
7.1.2.2. Last Events ............................................................................................................ 48
7.1.3. Group View ...................................................................................................................48
7.1.4. Monitor View ................................................................................................................49
7.1.5. Assistant/Wizard ........................................................................................................... 50
7.2. Events ....................................................................................................................................50
7.2.1. Replication of Instance events to the metaconsole........................................................ 50
7.2.2. Event Management ....................................................................................................... 50
7.2.2.1. See Events ............................................................................................................. 50
7.2.2.2. Configure Events....................................................................................................57
7.2.2.3. Managing Event Filters ......................................................................................... 57
7.3. Reports ..................................................................................................................................61
7.4. Screens ..................................................................................................................................61
7.4.1. Network Map ................................................................................................................ 62
7.4.2. Visual Console .............................................................................................................. 63
7.5. Netflow ................................................................................................................................. 65
8 Operation .................................................................................................................................. 66
8.1. Assistant / Wizard..................................................................................................................67
8.1.1. Access ........................................................................................................................... 69
8.1.2. Action Flow ...................................................................................................................70
8.1.3. Modules..........................................................................................................................71
8.1.3.1. Creation ................................................................................................................. 72
8.1.3.2. Administration .......................................................................................................83
8.1.4. Alerts .............................................................................................................................85
8.1.4.1. Creation.................................................................................................................. 86
8.1.4.2. Administration........................................................................................................88
8.1.5. Agents............................................................................................................................ 91
8.1.5.1. Creation ................................................................................................................. 92
8.1.5.2. Administration .......................................................................................................95
8.2. Differences Depending on Access Level ..............................................................................97
8.2.1. Monitors ........................................................................................................................97
8.2.2. WEB Checks .................................................................................................................97
8.2.3. Alerts .............................................................................................................................98
8.2.4. Agents ........................................................................................................................... 98
9 Administration .......................................................................................................................... 99
9.1. Instance Configuration ........................................................................................................100
9.2. Metaconsole Configuration .................................................................................................100
9.2.1. General Configuration .................................................................................................100
9.2.2. Password Policy .......................................................................................................... 101
9.2.3. Visual Configuration ...................................................................................................102
9.2.4. Performance ................................................................................................................ 103
9.2.5. File Management .........................................................................................................104
9.2.6. String Translation ........................................................................................................104
7
4
9.3. Synchronization Tools ........................................................................................................ 105
9.3.1. User Synchronization...................................................................................................105
9.3.2. Group Synchronization................................................................................................ 107
9.3.3. Alert Synchronization.................................................................................................. 107
9.3.4. Components Synchronization ..................................................................................... 108
9.3.5. Tags Synchronization...................................................................................................108
9.4. Data Management ...............................................................................................................109
9.4.1. Users ............................................................................................................................109
9.4.1.1. User Management.................................................................................................109
9.4.1.2. Profile Management............................................................................................. 113
9.4.1.3. Edit my user..........................................................................................................115
9.4.2. Agents.......................................................................................................................... 116
9.4.2.1. Agent Movement..................................................................................................116
9.4.2.2. Group Management..............................................................................................117
9.4.3. Modules .......................................................................................................................120
9.4.3.1. Components..........................................................................................................120
9.4.3.2. Plugins .................................................................................................................128
9.4.4. Alerts ...........................................................................................................................130
9.4.4.1. Commands............................................................................................................130
9.4.4.2. Action................................................................................................................... 131
9.4.4.3. Alert template.......................................................................................................132
9.4.5. Tags .............................................................................................................................133
9.4.5.1. Creating Tags....................................................................................................... 134
9.4.5.2. Modify/Delete Tags..............................................................................................135
9.4.6. Policies ........................................................................................................................135
9.4.6.1. Policy apply..........................................................................................................135
9.4.6.2. Policy management queue....................................................................................136
9.4.7. Categories ....................................................................................................................137
9.4.7.1. Create categories ................................................................................................. 137
9.4.7.2. Modify/Delete category........................................................................................138
10 Glossary of Metaconsola Terms ........................................................................................... 139
10.1. Basic and Advanced Accesses ..........................................................................................140
10.2. Component ........................................................................................................................140
10.3. Instance ............................................................................................................................. 140
10.4. Metaconsole ......................................................................................................................140
10.5. Wizard ...............................................................................................................................141
11 Metaconsole FAQ (Frequently Asked Questions) ............................................................... 142
11.1. I can't see the agents of one group to which I have access to ...........................................143
11.2. I change the permissions to one user and it doesn't work .................................................143
11.3. When I try to configure one Instance, it fails ................................................................... 143
Part 7. Technical annexes
12
Appliance CD ....................................................................................................................... 144
12.1. Minimum Requirements ................................................................................................... 145
12.2. Recording image to disk.................................................................................................... 145
12.3. Installation ........................................................................................................................ 145
12.3.1. Graphical installation ................................................................................................ 147
12.3.2. Installation from the Live CD ................................................................................... 158
12.3.3. Text mode installation ...............................................................................................159
12.4. First boot ...........................................................................................................................163
5
12.4.1. Server Reconfiguration ............................................................................................. 167
12.4.2. YUM packages Management ....................................................................................168
12.4.3. Technical Notes on Appliance .................................................................................. 169
13 SSH Configuration to Get Data in Pandora FMS ................................................................. 170
13.1. SSH Server Securization....................................................................................................172
13.1.1. What is Scponly? ...................................................................................................... 172
14 Configuration to receive data in the server through FTP ..................................................... 174
14.1. Securizing the FTP (proftpd) Server .................................................................................175
14.2. Vsftpd Securization............................................................................................................176
15 Pandora FMS Integration with HP Network Node Manager (SNMP) ................................. 177
15.1. Configuring NNM .............................................................................................................178
15.2. Creating Specific Alerts of Pandora FMS ........................................................................ 179
15.3. SNMP Traps Generation Script......................................................................................... 179
15.4. Use of the Alert on a Module.............................................................................................182
15.5. Visualizing Data in NNM .................................................................................................183
16 Installation and Configuration of Pandora FMS and SMS Gateway .................................... 184
16.1. About the GSM device ..................................................................................................... 185
16.2. Installing the Device ......................................................................................................... 185
16.3. Configure SMSTools to Use the New Device ..................................................................187
16.3.1. Debian / Ubuntu ........................................................................................................188
16.3.2. RPM based system (SUSE, Redhat) ......................................................................... 188
16.3.3. Configure SMStools ..................................................................................................188
16.4. Configure Pandora FMS Alert ..........................................................................................190
16.5. Gateway to Send SMS using a generic hardware and Gnokii .......................................... 192
16.5.1. SMS Gateway Implementation ................................................................................. 192
16.5.1.1. SMS....................................................................................................................192
16.5.1.2. SMS Gateway ....................................................................................................193
16.5.1.3. SMS Gateway Launcher ....................................................................................193
16.5.1.4. Copy_Sms ......................................................................................................... 195
17 HA in Pandora FMS with DRBD ......................................................................................... 196
17.1. Introduction to DRDB ...................................................................................................... 197
17.2. Initial enviroment ..............................................................................................................197
17.3. Install packages .................................................................................................................198
17.4. DRDB setup ......................................................................................................................198
17.4.1. Initial DRDB setup ....................................................................................................198
17.4.2. Setup DRDB nodes ................................................................................................... 199
17.4.3. Initial disk (Primary node) ........................................................................................ 199
17.4.4. Create the partition on primary node ........................................................................ 200
17.4.5. Getting information about system status ...................................................................200
17.4.6. Setting up the mysql in the DRDB disk ....................................................................201
17.4.7. Create the Pandora FMS database ............................................................................ 201
17.4.8. Manual split brain recovery ...................................................................................... 202
17.4.9. Manual switchover ....................................................................................................203
17.5. Setup Hearbeat ..................................................................................................................203
17.5.1. Configuring heartbeat ............................................................................................... 203
17.5.2. Main Heartbeat file: /etc/ha.d/ha.cf ...........................................................................204
17.5.3. HA resources file ...................................................................................................... 204
17.5.4. Settingup authentication ............................................................................................204
17.5.5. First start of heartbeat ............................................................................................... 205
17.6. Testing the HA: Total failure test ..................................................................................... 205
6
18
HA in Pandora FMS with MySQL Cluster ........................................................................... 206
18.1. Introduction........................................................................................................................207
18.1.1. Cluster related terms used in Pandora FMS documentation......................................207
18.1.2. Cluster Architecture to use with Pandora FMS......................................................... 207
18.2. Installation and Configuration........................................................................................... 209
18.2.1. Configuring SQL Node and Data ..............................................................................209
18.2.2. Manager Configuration .............................................................................................210
18.2.2.1. Parameters of the common configuration of the management nodes................211
18.2.2.2. Parameters of individual configuration of the two management nodes ............211
18.2.2.3. Common Configuration Parameters for the Storage Nodes ..............................211
18.2.2.4. Individual Configuration Parameters for each Data node .................................216
18.2.2.5. Common Parameters to API or SQL .................................................................216
18.2.2.6. Individual Configuration Parameters for each API or SQL node ..................... 216
18.3. Starting the Cluster ........................................................................................................... 217
18.3.1. Starting the Manager .................................................................................................217
18.3.2. Start of the Cluster Data Nodes (ONLY INSTALATION!) .....................................217
18.3.3. Starting SQL Nodes................................................................................................... 218
18.3.4. Visualizing the Cluster Status ...................................................................................218
18.3.5. Start and Stop of Nodes from the Manager ...............................................................219
18.4. Cluster Backups ................................................................................................................ 219
18.4.1. Restoring Security Copies .........................................................................................220
18.4.1.1. Previous Steps ................................................................................................... 220
18.4.1.2. Order of the Restoring Process ..........................................................................220
18.4.2. Restoring Process ......................................................................................................220
18.5. Cluster Logs.......................................................................................................................221
18.5.1. The Cluster log ..........................................................................................................221
18.5.2. Logs of the Nodes ..................................................................................................... 221
18.5.2.1. ndb_X_out.log ...................................................................................................221
18.5.2.2. ndb_X_error.log ................................................................................................ 222
18.6. General Procedures............................................................................................................223
18.6.1. Cluster Manager Process Management .....................................................................223
18.6.2. Nodes Management from the Manager .....................................................................223
18.6.3. Data Node Management with the start scripts .......................................................... 224
18.6.4. SQL Nodes Management with Starting Scripts......................................................... 224
18.6.5. Creating Backups from the Command Line ............................................................. 225
18.6.6. Restoring Backups from the Command Line ............................................................225
18.6.7. Procedure of Total Stop of the Cluster ......................................................................225
18.6.8. Procedure to Start the Cluster ................................................................................... 226
18.7. Appendix. Examples of Configuration Files .................................................................... 227
18.7.1. /etc/mysql/ndb_mgmd.cnf .........................................................................................227
18.7.2. /etc/mysql/my.cf ........................................................................................................238
18.7.3. /etc/cron.daily/backup_cluster .................................................................................. 241
18.7.4. /etc/init.d/cluster_mgmt ............................................................................................ 242
18.7.5. /etc/init.d/cluster_node ..............................................................................................244
19 MySQL Binary Replication model for HA .......................................................................... 247
19.1. Introduction .......................................................................................................................248
19.2. Comparison versus other MySQL HA models .................................................................248
19.3. Initial enviroment ..............................................................................................................248
19.3.1. Setting up the Mysql Server ......................................................................................248
19.3.1.1. Master node (Castor) .........................................................................................248
7
19.3.1.2. Slave node (Pollux) ........................................................................................... 249
19.3.1.3. Creating a User for Replication .........................................................................249
19.3.1.4. Install your pandora DB .................................................................................... 249
19.3.1.5. Setting Up Replication with Existing Data ....................................................... 249
19.4. Setting up the SQL server to serve Pandora server .......................................................... 251
19.4.1. Start Pandora Server ..................................................................................................251
19.5. Switchover ........................................................................................................................ 251
19.6. Setting up the load balancing mechanism .........................................................................253
19.6.1. Castor / Master ..........................................................................................................253
19.6.2. Pollux / Slave ............................................................................................................ 253
19.6.2.1. Contents of scripts .............................................................................................253
19.6.2.2. Some proposed scripts .......................................................................................253
20 Capacity study ...................................................................................................................... 255
20.1. Introduction .......................................................................................................................256
20.1.1. Data Storage and Compaction....................................................................................256
20.1.2. Specific Terminology ................................................................................................257
20.2. Example of Capacity Study............................................................................................... 257
20.2.1. Definition of the Scope.............................................................................................. 257
20.2.2. Capacity Study .......................................................................................................... 258
20.3. Methodology in detail........................................................................................................260
20.3.1. Data Server ................................................................................................................260
20.3.1.1. Evaluation of the Alert Impact .......................................................................... 262
20.3.1.2. Evaluating the Purging/Transfer of Data............................................................263
20.3.1.3. Evaluation of the Alert Impact .......................................................................... 263
20.3.1.4. Evaluating the Purging/Transfer of Data............................................................263
20.3.2. ICMP Server(Enterprise) .......................................................................................... 264
20.3.3. Servidor de SNMP (Enterprise) ................................................................................ 265
20.3.4. Servidor de Plugins, Red (open) y HTTP ................................................................. 266
20.3.5. Recepción de traps .................................................................................................... 266
20.3.6. Eventos ......................................................................................................................266
20.3.7. Concurrencia de usuarios ..........................................................................................267
21 Advises for using Oracle DB ................................................................................................ 268
21.1. General Advises for using Oracle .....................................................................................269
22 HWg-STE Temperature Sensor Configuration ..................................................................... 270
22.1. Introduction .......................................................................................................................271
22.2. Installation and configuration ........................................................................................... 271
22.2.1. Step #1. Pandora installation .....................................................................................271
22.2.2. Step #2. Sensor installation .......................................................................................271
22.2.3. Step #3. Configuring the sensor in Pandora ..............................................................273
22.2.4. Step #4. Configuring an alert .................................................................................... 276
22.2.5. Step #5. Creating a basic report................................................................................. 278
23 Energy Efficiency with Pandora FMS .................................................................................. 281
23.1. IPMI plugin for Pandora FMS ..........................................................................................282
23.1.1. Working of the IPMI plugin.......................................................................................282
23.1.2. Installing the Plugin and the Recon task....................................................................282
23.1.2.1. Prerequisites ...................................................................................................... 282
23.1.2.2. Register of the IPMI plugin ...............................................................................283
23.1.2.3. Registration of the Recon Script ....................................................................... 284
23.1.3. Monitoring with the IPMI plugin ..............................................................................284
24 Network monitoring with IPTraf .......................................................................................... 287
8
24.1. Introduction .......................................................................................................................288
24.2. How it works .....................................................................................................................288
24.3. Configuration ....................................................................................................................288
24.4. Filtering rules ....................................................................................................................289
24.4.1. IPTraf logfile structure ..............................................................................................289
24.4.2. Collector filtering rules ............................................................................................. 289
24.4.2.1. Examples ........................................................................................................... 290
24.5. Data generated .................................................................................................................. 290
25 Backup procedure .................................................................................................................. 292
25.1. Purpose...............................................................................................................................293
25.2. Database backup................................................................................................................ 293
25.3. Configuration files backup.................................................................................................293
25.4. Agent backup..................................................................................................................... 293
25.5. Server backup.................................................................................................................... 293
25.5.1. Server plugins............................................................................................................ 293
25.5.2. Remote configuration.................................................................................................293
25.6. Console backup..................................................................................................................294
26 Restore procedure .................................................................................................................. 295
26.1. Install the 4.1 appliance..................................................................................................... 296
26.2. Database restore.................................................................................................................296
26.3. Configuration files restore................................................................................................. 297
26.4. Agent restore......................................................................................................................297
26.5. Server restore..................................................................................................................... 297
26.5.1. Server plugins............................................................................................................ 297
26.5.2. Remote configuration.................................................................................................297
26.6. Console restore.................................................................................................................. 297
26.7. Starting Pandora FMS server and agent............................................................................ 297
27 Development in Pandora FMS ............................................................................................. 299
27.1. Pandora FMS Code architecture .......................................................................................300
27.1.1. How to make compatible links ..................................................................................300
27.1.2. The entry points of execution in Pandora Console.................................................... 301
27.1.2.1. Installation..........................................................................................................301
27.1.2.2. Normal execution............................................................................................... 301
27.1.2.3. AJAX requests....................................................................................................301
27.1.2.4. Mobile console................................................................................................... 302
27.1.2.5. API......................................................................................................................302
27.1.2.6. Special cases.......................................................................................................302
27.2. Basic functions for agent, module and group status ......................................................... 304
27.2.1. Status criteria and DB encoding ................................................................................304
27.2.2. Agents ....................................................................................................................... 304
27.2.2.1. Status functions ................................................................................................. 304
27.2.2.2. Auxiliar functions ..............................................................................................305
27.2.3. Groups .......................................................................................................................305
27.2.3.1. Server functions .................................................................................................305
27.2.3.2. Console functions ..............................................................................................305
27.2.4. Modules .....................................................................................................................306
27.2.5. Policies ......................................................................................................................306
27.2.6. OS ..............................................................................................................................307
27.3. Development .....................................................................................................................307
27.3.1. Cooperating with Pandora FMS project ....................................................................307
9
27.3.2. Subversion (SVN) .....................................................................................................307
27.3.3. Bugs / Failures .......................................................................................................... 307
27.3.4. Mailing Lists ............................................................................................................. 307
27.4. Compiling Windows agent from source ........................................................................... 308
27.4.1. Get the latest source .................................................................................................. 308
27.4.2. Windows ................................................................................................................... 308
27.4.3. Cross-compiling from Linux .....................................................................................308
27.4.3.1. Installing MinGW for Linux.............................................................................. 308
27.4.3.2. Installing the extra libraries needed by the agent...............................................308
27.4.3.3. Compiling and linking........................................................................................309
27.5. External API ..................................................................................................................... 309
27.6. Pandora FMS XML data file format .................................................................................309
Part 8. Technical reference
28
Pandora FMS External API .................................................................................................. 312
28.1. Security.............................................................................................................................. 313
28.1.1. Return ........................................................................................................................315
28.1.2. Examples ...................................................................................................................315
28.1.3. Security Workflow ....................................................................................................315
28.2. New Calls Extension in the API ....................................................................................... 316
28.2.1. New Calls in the API from the Pandora FMS extensions .........................................317
28.2.1.1. Function example .............................................................................................. 317
28.2.1.2. Call example ......................................................................................................317
28.2.2. API Functions............................................................................................................ 318
28.2.3. Example..................................................................................................................... 318
28.3. API Calls............................................................................................................................318
28.3.1. GET............................................................................................................................319
28.3.1.1. get test.................................................................................................................319
28.3.1.2. get all_agents......................................................................................................319
28.3.1.3. get module_last_value........................................................................................319
28.3.1.4. get agent_module_name_last_value...................................................................320
28.3.1.5. get module_value_all_agents............................................................................. 320
28.3.1.6. get agent_modules..............................................................................................321
28.3.1.7. get policies..........................................................................................................321
28.3.1.8. Get tree_agents...................................................................................................322
28.3.1.9. get module_data................................................................................................. 325
28.3.1.10. get graph_module_data.................................................................................... 325
28.3.1.11. get events..........................................................................................................326
28.3.1.12. get all_alert_templates......................................................................................328
28.3.1.13. get module_groups........................................................................................... 328
28.3.1.14. get plugins........................................................................................................ 328
28.3.1.15. get tags..............................................................................................................328
28.3.1.16. get module_from_conf..................................................................................... 329
28.3.1.17. get total_modules............................................................................................. 329
28.3.1.18. get total_agents.................................................................................................329
28.3.1.19. get agent_name.................................................................................................330
28.3.1.20. get module_name............................................................................................. 330
28.3.1.21. get alert_action_by_group................................................................................330
28.3.1.22. get event_info...................................................................................................331
28.3.1.23. get tactical_view...............................................................................................331
10
28.3.1.24. get pandora_servers..........................................................................................332
28.3.1.25. get custom_field_id.......................................................................................... 332
28.3.1.26. get gis_agent.....................................................................................................333
28.3.2. SET.............................................................................................................................333
28.3.2.1. Set new_agent.....................................................................................................333
28.3.2.2. Set update_agent.................................................................................................334
28.3.2.3. Set delete_agent..................................................................................................334
28.3.2.4. set create_module_template............................................................................... 335
28.3.2.5. set create_network_module................................................................................335
28.3.2.6. set create_plugin_module...................................................................................336
28.3.2.7. set create_data_module...................................................................................... 337
28.3.2.8. set create_SNMP_module.................................................................................. 338
28.3.2.9. set update_network_module...............................................................................339
28.3.2.10. set update_plugin_module................................................................................340
28.3.2.11. set update_data_module................................................................................... 341
28.3.2.12. set update_SNMP_module...............................................................................342
28.3.2.13. set apply_policy................................................................................................343
28.3.2.14. set apply_all_policies....................................................................................... 343
28.3.2.15. set add_network_module_policy......................................................................343
28.3.2.16. set add_plugin_module_policy.........................................................................344
28.3.2.17. set add_data_module_policy............................................................................ 345
28.3.2.18. set add_SNMP_module_policy........................................................................346
28.3.2.19. set add_agent_policy........................................................................................ 347
28.3.2.20. set new_network_component...........................................................................347
28.3.2.21. set new_plugin_component..............................................................................348
28.3.2.22. set new_snmp_component............................................................................... 349
28.3.2.23. set new_local_component................................................................................ 350
28.3.2.24. set create_alert_template.................................................................................. 350
28.3.2.25. set update_alert_template.................................................................................352
28.3.2.26. set delete_alert_template.................................................................................. 353
28.3.2.27. set delete_module_template............................................................................. 353
28.3.2.28. set stop_downtime............................................................................................353
28.3.2.29. set new_user..................................................................................................... 354
28.3.2.30. Set update_user.................................................................................................354
28.3.2.31. Set delete_user..................................................................................................355
28.3.2.32. set enable_disable_user.................................................................................... 355
28.3.2.33. set create_group................................................................................................356
28.3.2.34. Set add_user_profile.........................................................................................356
28.3.2.35. set delete_user_profile......................................................................................357
28.3.2.36. set new_incident...............................................................................................357
28.3.2.37. Set new_note_incident..................................................................................... 358
28.3.2.38. set validate_all_alerts....................................................................................... 358
28.3.2.39. set validate_all_policy_alerts........................................................................... 358
28.3.2.40. set event_validate_filter................................................................................... 358
28.3.2.41. set event_validate_filter_pro............................................................................ 359
28.3.2.42. set new_alert_template.....................................................................................359
28.3.2.43. set alert_actions................................................................................................ 360
28.3.2.44. set new_module................................................................................................360
28.3.2.45. set delete_module.............................................................................................361
28.3.2.46. set enable_alert.................................................................................................362
11
28.3.2.47. set disable_alert................................................................................................ 362
28.3.2.48. set enable_module_alerts................................................................................. 362
28.3.2.49. set disable_module_alerts.................................................................................363
28.3.2.50. set enable_module............................................................................................ 363
28.3.2.51. set disable_module........................................................................................... 363
28.3.2.52. set create_network_module_from_component................................................ 364
28.3.2.53. set module_data................................................................................................364
28.3.2.54. set add_module_in_conf...................................................................................364
28.3.2.55. set delete_module_in_conf...............................................................................365
28.3.2.56. set update_module_in_conf..............................................................................365
28.3.2.57. set create_event................................................................................................ 366
28.3.2.58. set create_netflow_filter...................................................................................366
28.3.2.59. set create_custom_field.................................................................................... 367
28.3.2.60. set create_tag.................................................................................................... 367
28.3.2.61. set enable_disable_agent.................................................................................. 368
28.3.2.62. set gis_agent_only_position............................................................................. 368
28.3.2.63. set gis_agent..................................................................................................... 369
28.4. Examples ...........................................................................................................................369
28.4.1. PHP ........................................................................................................................... 369
28.4.2. Python ....................................................................................................................... 371
28.4.3. Perl ............................................................................................................................ 372
28.4.4. Ruby ..........................................................................................................................373
28.4.5. Lua ............................................................................................................................ 374
28.4.6. Brainfuck ...................................................................................................................375
28.4.7. Java (Android) ...........................................................................................................376
28.5. Future of API.php.............................................................................................................. 377
29 Pandora FMS CLI ................................................................................................................. 378
29.1.1. Agents........................................................................................................................ 380
29.1.1.1. Create_agent.......................................................................................................380
29.1.1.2. Update_agent......................................................................................................381
29.1.1.3. Delete_agent.......................................................................................................381
29.1.1.4. Disable_group.................................................................................................... 381
29.1.1.5. Enable_group......................................................................................................381
29.1.1.6. Create_group...................................................................................................... 382
29.1.1.7. Stop_downtime...................................................................................................382
29.1.1.8. Get_agent_group................................................................................................ 382
29.1.1.9. Get_agent_modules............................................................................................382
29.1.1.10. Get_agents........................................................................................................382
29.1.1.11. Delete_conf_file............................................................................................... 383
29.1.1.12. Clean_conf_file................................................................................................ 383
29.1.1.13. Get_bad_conf_files.......................................................................................... 383
29.1.2. Modules......................................................................................................................384
29.1.2.1. Create_data_module...........................................................................................384
29.1.2.2. Create_network_module.................................................................................... 384
29.1.2.3. Create_snmp_module.........................................................................................385
29.1.2.4. Create_plugin_module....................................................................................... 385
29.1.2.5. Delete_module....................................................................................................386
29.1.2.6. Data_module...................................................................................................... 386
29.1.2.7. Get_module_data................................................................................................386
29.1.2.8. Delete_data.........................................................................................................386
12
29.1.2.9. Update_module.................................................................................................. 387
29.1.2.10. Get_agents_module_current_data....................................................................387
29.1.2.11. Create_network_module_from_component.....................................................387
29.1.3. Alerts..........................................................................................................................388
29.1.3.1. Create_template_module....................................................................................388
29.1.3.2. Delete_template_module....................................................................................388
29.1.3.3. Create_template_action......................................................................................388
29.1.3.4. Delete_template_action......................................................................................388
29.1.3.5. Disable_alerts..................................................................................................... 389
29.1.3.6. Enable_alerts...................................................................................................... 389
29.1.3.7. Create_alert_template.........................................................................................389
29.1.3.8. Delete_alert_template.........................................................................................390
29.1.3.9. Update_alert_template........................................................................................391
29.1.3.10. Validate_all_alerts............................................................................................391
29.1.4. Users...........................................................................................................................391
29.1.4.1. Create_user.........................................................................................................391
29.1.4.2. Delete_user.........................................................................................................391
29.1.4.3. Update_user........................................................................................................392
29.1.4.4. Enable_user........................................................................................................ 392
29.1.4.5. Disable_user....................................................................................................... 392
29.1.4.6. Create_profile.....................................................................................................392
29.1.4.7. Delete_profile.....................................................................................................393
29.1.4.8. Add_profile_to_user...........................................................................................393
29.1.4.9. Disable_aecl....................................................................................................... 393
29.1.4.10. Enable_aecl...................................................................................................... 393
29.1.5. Events.........................................................................................................................394
29.1.5.1. Create_event.......................................................................................................394
29.1.5.2. Validate_event....................................................................................................394
29.1.5.3. Validate_event_id...............................................................................................395
29.1.5.4. Get_event_info................................................................................................... 395
29.1.6. Incidents.....................................................................................................................395
29.1.6.1. Create_incident...................................................................................................395
29.1.7. Policies.......................................................................................................................396
29.1.7.1. Apply_policy......................................................................................................396
29.1.7.2. Apply_all_policies..............................................................................................396
29.1.7.3. Add_agent_to_policy......................................................................................... 396
29.1.7.4. Delete_not_policy_modules...............................................................................396
29.1.7.5. Disable_policy_alerts......................................................................................... 397
29.1.7.6. Create_policy_data_module...............................................................................397
29.1.7.7. Create_policy_network_module........................................................................ 397
29.1.7.8. Create_policy_snmp_module.............................................................................397
29.1.7.9. Create_policy_plugin_module........................................................................... 398
29.1.7.10. Validate_policy_alerts......................................................................................398
29.1.7.11. Get_policy_modules.........................................................................................398
29.1.7.12. Get_policies......................................................................................................399
29.1.8. Netflow.......................................................................................................................399
29.1.8.1. Create_netflow_filter..........................................................................................399
29.1.9. Tools...........................................................................................................................399
29.1.9.1. Exec_from_file...................................................................................................399
29.1.9.2. create_snmp_trap................................................................................................400
13
29.2. Help....................................................................................................................................400
Considerations on Plugin Development ................................................................................ 401
30.1. Introduction........................................................................................................................402
30.2. Differences in Implementation and Performance ............................................................. 402
30.3. Recon Tasks ......................................................................................................................402
30.4. Server Plugin or Agent Plugin? ........................................................................................ 402
31 Servers Plugin Development ................................................................................................ 404
31.1. Pandora Server Plugin Zipfile (.pspz) ...............................................................................405
31.2. Package File ......................................................................................................................405
31.3. Structure of plugin_definition.ini ..................................................................................... 405
31.3.1. Header/Definition ......................................................................................................405
31.3.2. Module definition / Network components ................................................................ 406
31.4. Versión 2 ...........................................................................................................................407
31.4.1. Example of the plugin definition version 2 ...............................................................407
32 Agent Plugins Development .................................................................................................. 408
32.1. Example of Agent Plugin Development............................................................................ 409
32.2. Troubleshooting.................................................................................................................411
32.2.1. Check the pandora_agent.conf document.................................................................. 411
32.2.2. Reboot the pandora_agent_daemon...........................................................................412
32.2.3. Check the plugin permissions.................................................................................... 412
32.2.4. Validate the output.....................................................................................................412
32.2.5. Validate the resulting XML....................................................................................... 412
32.2.6. Debug mode............................................................................................................... 412
32.2.7. Forum.........................................................................................................................413
33 Console Extensions ............................................................................................................... 414
33.1. Kinds of Extensions...........................................................................................................415
33.2. Directory of Extensions..................................................................................................... 415
33.3. Extension Skeleton............................................................................................................ 415
33.4. API for Extensions.............................................................................................................416
33.4.1. extensions_add_operation_menu_option...................................................................416
33.4.2. extensions_add_godmode_menu_option...................................................................416
33.4.3. extensions_add_main_function..................................................................................416
33.4.4. extensions_add_godmode_function...........................................................................416
33.4.5. extensions_add_login_function................................................................................. 416
33.4.6. extensions_add_godmode_tab_agent.........................................................................416
33.4.7. extensions_add_opemode_tab_agent.........................................................................416
33.4.8. Father IDs in menu.....................................................................................................417
33.4.8.1. Operation............................................................................................................417
33.4.8.2. Administration....................................................................................................417
33.5. Example ............................................................................................................................ 417
33.6. Source code........................................................................................................................418
33.7. Explain...............................................................................................................................421
33.7.1. Source code of extension........................................................................................... 421
33.7.2. API calls functions.....................................................................................................422
33.7.3. Directory organization............................................................................................... 423
33.7.4. Subdirectory...............................................................................................................423
30
14
Introduction
1 INTRODUCTION
15
Introduction
The Metaconsole is a Web portal where you can visualize, synchronize and manage in an unified way different Pandora FMS monitoring systems, called Instances from now. You can also read other similar terms like "nodes". This way, the data management of different monitoring environments will be done in a transparent way for the user. We divide the Metaconsole interaction possibilities on the Instances in three different categories: • Visualization: There are different ways to visualize data:Lists, tree views, reports, graphs, etc. • Operation: The creation, edition and deleting of the Instance data through the Assistant/Wizard. • Administration: The configuration of the Metaconsole parameters and also the synchronization of data between Metaconsole and Instances. 1.1. Interface Through a simplified interface (compared with Pandora FMS) the actions availables in the Metaconsole are distributed in 6 groups: • Monitoring •
•
•
•
•
•
Tree view
Tactic view
Group view
Alert view
Monitor view
Wizard
• Events • Reports •
•
•
•
Create new reports
Reports
Templates
Template wizard
• Screens • Network map
• Visual console
• Netflow • Advanced •
•
•
•
•
•
•
•
Synchronization
User management
Agent management
Module management
Alert management
Tag management
Policy management
Category management
16
Interface • Metasetup
17
Interface 2 COMPARATIVE 18
Comparative If you knew Pandora FMS before version 5.0, then you know that the Metaconsole concept already exist In this section, we are going to analyze the differences between the current Metaconsole and the old one,and also the problems solved and the improvements proposed. 2.1. Before Version 5.0 Before version 5.0, a normal installation (Console+Server) of Pandora FMS could also work, as Metaconsole. 2.1.1. Communication The communication between the Metaconsole and the instances was unidirectional. The Metaconsole connected with the instance data base and Managed all the data in memory. It did not store almost nothing in its own database. 2.1.2. Synchronization Synchronization was done between the instances. For example: Lets suppose that we want to configure some alert templates so as all the instances would have them. We should enter in one of the instances, configure them, go back to the Metaconsole and synchronize the templates of that instance with the other ones. 19
Before Version 5.0 2.1.3. Problems
The Metaconsole was very inefficient because of its not centralized architecture. A lot of connections were done to different databases and the user experience was poor. The available options were insufficient to get the wanted control of the instance environments without exit from the Metaconsole. Summarizing, the Metaconsole was slow in case it had a bit of load and the user was very limited by its options. 2.2. From Version 5.0 The Metaconsole from version 5.0 is an special environment completely independent and incompatible with the console. 2.2.1. Communication The communication between the Metaconsole and the instances is bidirectional. The Metaconsole connect with the instance database and the instances replicate part of their data to the Metaconsole database. Other data, such as groups, alert templates, tags... are stored in the Metaconsole. 20
From Version 5.0 2.2.2. Synchronization The synchronization is done in a one way: From the Metaconsole to the instances. For example: Lets suppose that we want to configure some alert templates for the ones that have several or all instances. Without exit from the metaconsole we could configure the templates and synchronize them with the instances that we want. 21
From Version 5.0 2.2.3. Improvements
The Metaconsole from version 5.0 is a much more centralized, quick, and flexible tool than the previous version. It also includes much more views and features, and also improvements in the ones that previously exist. It does not manage all data in memory, storing part of the information, improving this way the user experience. 2.3. Summary table In the following table you can see the differences between the old Metaconsole features and the new ones. Before version 5.0
From version 5.0
Synchronization
Decentralization
Centralized
Communication
Unidirectional
Bidirectional
Through instances
General and 15 last events
(Data in Instances)
(Data in the Metaconsole)
The metaconsole can work as
an instance
Instance configuration
User panel
Tactic view
Agent browser
Group view
Event visor
Tree view
Alert view
Module view
Network map
Traffic monitoring (Netflow)
Synchronization tools
•
•
•
•
Users/Profiles
Components
Policies
Alerts
•
•
•
•
•
Users/Profiles
Groups
Components
Alerts
Tags
Move agents between
instances
Report templates
Editors
• Reports
• Users/Profiles
• Groups
22
Summary table • Visual console
•
•
•
•
•
•
Components
Reports
Visual console
Alerts
Tags
Categories
Apply/Policy queue
23
Summary table 3 ARCHITECTURE 24
Architecture The Metaconsole architecture consist of one central node: The Metaconsole and of so many server nodes as you want: The Instances. The Instances are Pandora FMS normal installations. They consist on a web console in the front end and of one server in the back end that processes the data that it gets, it does remote checks,etc. The Metaconsole has not its own server. It is only a web console. 3.1. Where are stored the data? Some data are in the Instances, others in the Metaconsole and others in both places. They need to be synchronized to work properly. In Instances: •
•
•
•
Agents Modules Alerts Policies In the Metaconsole: •
•
•
•
•
•
The Metaconsole configuration: Components Reports* and the template reports Network maps* Visual maps* Netflow filters In both: •
•
•
•
•
Users and profilesThe userLos usuarios y perfiles Groups Templates, actions and alert commands Tags Categories * Though these items are stored in the metaconsole, they are configurations that are used to visualize the Instace data, so they don't have any utility by themselves. 3.2. How Information is got and modified? The Metaconsole gets and modifies the Instances information in two different ways: • Active: Access to the Database or API of the Instances in a remote way from the Metaconsole (it's the case with agents,modules, alerts, etc). 25
How Information is got and modified? • Passive: Data replication from the Instances to the Database of the Metaconsole (it is the case of events). 26
How Information is got and modified? 4 SYNCHRONIZATION 27
Synchronization There are two different types in the Metaconsole synchronization tools: • Synchronization utilities: •
•
•
•
Users
Groups
Alerts
Tags
• Propagation Utilities: • Component Propagation (from the Metaconsole to the Instances)
• Agent movements (From one instance to the other)
If you want to synchronize the module categories, you should do it manually going into
each Instance
4.1. Synchronization utilities The synchronization tools match the content between the Metaconsole and Instances to make sure its correct working. After modifying these dat in the metaconsole will be necessary to synchronize them
with the Instances to avoid unusual behaviors.
Most of the synchronization is done by name. In order to not having any problems withe
the exceptions we should follow the instructions from Index scaling in the Metaconsole
configuration section.
4.1.1. User Synchronization In order an user could operate in the Metaconsole, this user should exist both in the Metaconsole and in the Instance. But their passwords don't have necessarily to be the same one
Users should have the same permissions(ACLs, Tags and Wizard access) in the
Metaconsole and Instances for its correct working
28
Synchronization utilities We will see later the tool to synchronize users and their profiles in the section Synchronization administration. 4.1.2. Group Synchronization
Groups should be synchronized in order to warranty the access to the data they have. The ACLs that an user has in each group in the Metaconsole should correspond with the
accesses of the user with the same name in the instance.
We will see later the tool to synchronize the groups in the section. 29
Synchronization utilities 4.1.3. Alert Synchronization
The alert synchronization refers to the synchronization between the Metaconsole and the Instances of the templates, actions and alert commands. This synchronization is necessary because one alert is the association of a template, with a number of actions, to one module. Besides, each action has synchronized one command. Alerts are configured and assigned from the Metaconsole with the templates, actions and commands of the Metaconsole itself. In order that this configuration would be possible and coherent, the instance where the module to which an alert will be assigned would be placed should has the same templates, actions and commands. There is one tool to synchronize the alerts that we will see later in the section. The tool only synchronize the data structures.The commands are associated to one
script. The synchronization of that script should be done in a manual way entering into
the Instances..
30
Synchronization utilities 4.1.4. Tag Synachronization Tags are a complementary access control mechanism to the groups, so they also should be synchronized to warranty the access to the data that they have associated to. Tags that an user has in each group in the Metaconsole should match withe the tags of
the user with same name in the instance.
31
Synchronization utilities 4.2. Propagation Utilities These tools are useful to copy or move data from one Instance to other or from the Metaconsole to the Instances. Unlike the synchronization utilities, propagation is not necessary for the best performance of the Metaconsole. It is only a tool to make easier the availability of data in the Instances. 4.2.1. Components Propagation With the component propagation tool, its is possible to copy any component created in the Metaconsole to the Instances that you want. 32
Propagation Utilities 4.2.2. Agent Movement This tool allows to move agents between Instances. To avoid involuntary errors, what is actually done is to copy the agents to the
destination Instances and deactivate them in the origin ones.
33
Propagation Utilities 34
Propagation Utilities 5 USER PERMISSIONS 35
User Permissions There are several permission systems that restrict what an user could see or administrate. 5.1. ACLs The ACLs system controls which elements an user could see or administrate depending on the group they belong to. For example: • An user could have reading permissions on the alert templates of the Applications group and those of Administration on the Server group. • You will be able to see and assign templates to both groups, but you only have the option to edit or delete the ones of the Server group. 5.2. Tags One tag is a label that you can assign to a module. An user could have the ACLs in some specific group restricted by Tags. If so, only these ACLs will be applied to the modules that contains those Tags. For example: • An user could have reading or administration permission in the Server group restricted to the Systems Tag. • It will only have these permissions on the modules, that even belonging to an agent of the Server groups, will have assigned the System Tag. 5.3. Wizard Access Control
Users have assigned an access level regarding to the Metaconsole Wizard. This level could be Basic or Advanced. Besides, the alert templates and the module components (local and network) will also have this access level. 5.3.1. Visibility 5.3.1.1. Basic Access The Basic access users will only could see in the Wizard the alerts that correspond to the alert templates with Basic level and the modules created from Basic level components. 5.3.1.2. Advanced Access Users of Advanced access level will see in the Wizard the alerts and modules from both Basic and Advanced levels. 5.3.2. Configuration Besides the visibility, the access level affects also to the configuration of modules and their alerts. In the section Operation (Monitoring Wizard) we will explain in detail the difference between the configuration of a Basic and an Advanced monitor. 36
Wizard Access Control
6 INSTALLATION AND CONFIGURATION 37
Installation and Configuration In this section will be included all the aspects needed in order to install and configure a Metaconsole and their Instances. 6.1. Installation The installations of the Instances and the Metaconsole requires to be hosted in servers that are communicated in both ways. In order to do these we should verify that: • The Metaconsole can contact with the Instances • The Instances can contact with the Metaconsole The Instances don't need to be communicated between them at any moment
To understand better this requirement you can take a look to Metaconsole architecture. The timezone setting should see the same. The more synchronized would be the Instances and Metaconsole would be, more exact will be the visualized data. For example: If an Instance has 5 minutes of difference with the Metaconsole, the visualization of the time that have passed since their events were generated when these data are shown in the Metaconsole they will be false. 6.1.1. Instances
One Instance is a Pandora FMS Enterprise typical installation: One instance is composed of one Server and one Web Console. All details about how to install the Instances will be found in the documentation section Pandora FMS Installation. 6.1.2. Metaconsole A Metaconsole is a Pandora FMS Enterprise installation with a metaconsole license. It is not possible to use at the same license the Pandora FMS console and the
Metaconsole
The Metaconsole is only the Web Console It doesn't use server so it will not host agent neither monitors In some cases it could be necessary the server libraries to execute the database maintenance script in the Metaconsole. To simplify it, this is done installing the server but without firing it. 6.1.3. Metaconsole Additional Configuration The Metaconsole, if the node events replication has been activated, store event data in its own database. For their maintenance these data can be deleted and/or move to the metaconsole history 38
Installation event ddb. THis is done, as in a pandora instance, through the execution of the ddbb maintenance script that is at/usr/share/pandora_server/util/pandora_db.pl. Usually, to launch it the server file is used, only that as it is a metaconsole, there is no server. To do this, get a copy o fhe file /etc/pandora/pandora_server.conf from one of the nodes, edit it, and modify the data related to the DDBB (hostname, DDBB name, user and password) and save the file, for example as: /etc/pandora/pandora_meta.conf
Create an script at /etc/cron.daily/pandora_meta_db with the following content: /usr/share/pandora_server/util/pandora_db.pl /etc/pandora/pandora_meta.conf
And modify the permissions of it through chmod: chmod 755 /etc/cron.daily/pandora_meta_db
In order to could execute it, it is necessary that you have installed the necessary packages to execute (even if it doesn't) the Pandora FMS server and its Enterprise part. Execute it manually to check that it works and it doesn't report errors: /etc/cron.daily/pandora_meta_db
6.2. Configuration In order that Instances could communicate with the Metaconsole and vice versa, you should configure both sides correctly. 6.2.1. Instances In Instances, there are a serial of parameters to ensure the access of your data with the Metaconsole. 6.2.1.1. Giving access to the Metaconsole The Metaconsole could have access to one Instance in two different ways: • Remote access to the Data Base to see and edit the data stored in the instances. • Access to the to the API for some actions like the edition of configuration files or the NetFlow monitoring The Instance should be configured to guarantee both accesses to the Metaconsole. Database
It will be necessary to know the database credentials to configure later the Instance in the Metaconsole (Host, Database, Users and Password). Other important thing is to give permissions to the user so he could have remote access to the database. It is done with the MySQL GRANT command: 39
Configuration GRANT ALL PRIVILEGES on <MetaconsoleDatabaseName>.* to <UserName>@<HostAddress>
IDENTIFIED BY <UserPass>;
API
The access to the Instance API will be guaranteed with the following parameters: • User and password: It should be necessary to know a valid user and password in the Instance. • API password: It should be necessary to know the access password to the API that is configured in the Instance. • IPs List with access to the API: In the Instance configuration, there is an IPs list that could have access to the API. It is possible to use '*' as wildcart to give access to all IPs or to one subnet 6.2.1.2. Autoauthentication In some parts of the metaconsole there are accesses to the Instance Web Console. For example, in the event visor, when you click on the Agent that is associated to one event (if there is one) it will take us to the view of this agent in the console of the Instance to which it belongs to. For this access the Autoauthentication is used. This authentication is done with a hash for which is necessary one string that is configured in the Instance: The autoidentification password. This configuration is not necessary to configure the Instance in the Metaconsole, but without it, if you click on one of the links that take us to the Instance, we should have to authenticate 6.2.1.3. Event Replication In order that in the Metaconsole could be seen the Instance events, these should have access to the Metaconsole database. The Instances will replicate from time to time their events saving the date and hour of the last replicated to continue from there the next time Besides the event replication, they will do effective the Metaconsole autovalidation. This is, for the events that are associated to one module, when they will replicate the event to the Metaconsole, they will validate all the previous events that are assigned to the same module. To configure the event replication, in the Instance Enterprise Configuration section be should activate the Event Replication. This will be configured: • Intervale: Every how many seconds the server will replicate the events generated from the last replication to the Metaconsole database. If is configured, for example 60 seconds, the first replication will happen 60 seconds
after the server has been started.
• Replication Mode: If all events will be replicated or only the ones that are validated. 40
Configuration • Show list of events in the local console (only reading): When the event replication is activated, the event management will be done in the metaconsole and in the instance there is not access to them.With this option you will have access to a view of events in only reading mode. • Metaconsole Database Credentials : Host, Database, Users,Password and Port (Is the port is not indicted the port by default will be used). The event replication is done by the server. In the configuration file should be an enabled token: To do effective any configuration change in the event replication it will be necessary to
restart the server.
6.2.2. Metaconsole 6.2.2.1. Giving access to the Instances Same way as the Instances give access to the Metaconsole to have a remote access to the database, the Metaconsole should do the same, so the Instances could replicate their events. 41
Configuration 6.2.2.2. Instances Configuration In the Metasetup section, it will be possible to configure the Instances with which the Metaconsole will be linked. The configuration of one instance has a serial of parameters that we should configure and retrieve from the Instances: In the view of the configured Instances, we will see that the Instances can be edited, disabled and deleted. Besides, there are some indicators that checks some information of the configuration of each Instance. These checks are done when loading this view, but the can also be done individually clicking on them. The indicators are these: • Database:If we haven't configured right the Instance database we won't have the necessary permission, the indicator will be red and it will give us information about the problem. • API: This indicator will do a test to the Instance API. If it fails it will report information 42
Configuration about the failure to us • Compatibility:This indicator will do a check of some requirements that should be between the Instance and the Metaconsole. The Instance server name, for example, should match with the name that we give to it in its configuration in the metaconsola. • Event Replication: This indicator shows if the Instance has activated the event replication and if the events from the Instance have been alredy received and how long ago was the last replication. The three first indicators should be in green color so the Instance should be correctly linked and we start viewing their data.However, the event Replication events will give us only information about this feature. One Instance could be configured correctly but with their events not
replicated
6.2.2.3. Index Scaling Most part of the synchronization between the Metaconsole and Instacnes is done by name, regardless of the internal ID of the items. One exception of this are the groups, whose IDs it's very important that are synchronized. In order to make sure that the group IDs that are synchronized from the Metaconsole don't exist in the instances, we significantly increase the value AUTO_INCREMENT from the tgrupo table. To do this, we should execute in the Metaconsole database the following query: ALTER TABLE tgrupo AUTO_INCREMENT = 3000;
If we suspect that the number of groups of one instances created in an external way to
the Metaconsole could exceed the 3000, it is possible to configure a higher value.
43
Configuration 7 VISUALIZATION 44
Visualization In this section we will explain the Metaconsole options that refer to the navigation/visualization of the agent data, and the Instance modules and alerts from the Metaconsole. There are different ways to visualize data: •
•
•
•
•
•
•
Data tables Tree views Hierarchical network maps Visual maps Reports Graphs File exportation(PDF, XML, CSV...) 7.1. Monitoring 7.1.1. Tree View
This view allows the visualization of the agent monitors in a tree view. You could have access through Monitoring > Tree view. It is possible to filter by module status (Critical, Normal, Warning and Unknown) and to search by agent name. In each level, it is shown a recount of the number of items of its branch in normal status (green color), critical (red color), warning (yellow color) and unknown (grey color) The first level is loaded first. Clicking on the items of each level the branch with the items contained it it will be displayed. Items shown in the group are restricted by the ACLs permissions and by the the
permissions for Tags that the user has
. 7.1.1.1. Kinds of trees
There are two different kinds of trees: • Group tree: Modules are shown filtered by the group to which the agent where they are located belongs to. 45
Monitoring • Tag Tree: Modules are shown filtered by the Tags they have associated to. In the Tree by Tags, one module could be shown several timers if it has assigned
several Tags
7.1.1.2. Levels Groups
This is the first level of the Group Tree Displaying the branch of one Group it shows the agents contained in the Group. The recount that is next to the group name refers to the number of Agents contained in it that are in each status. Only the not disabled agents that have at least one module not disabled and which is not
in status Not initiated status will be shown.
Tags
This is the first level of the tag Tree. If you display the branch of one Tag, it will show the agents that have at least one module associate to the Tag. The recount that is next to the name of the Tags refers to the number of Agents contained in it that are in each status. Only the tags that are associated to some module are shown.
Agents
If you display the branch of one Agent the modules that are contained in the agent will be shown. The recount that is next to the name of the Agent refers to the number of Modules contained in it that are in each status. Clicking on the agent name, it will show information about it on the right: Name, IP, date of last update, operative system... and also an event graph and other of accesses. Modules
The module is the last branch of the tree. 46
Monitoring Next to the name of each module, in this branch will be shown several buttons: • Module Graph: One popup will be opened with the module graph. • Information In Raw state: You could have access to the module view where are shown the received data in one table. • If the module has alerts, it will show an alert icon: Clicking on the icon, it will show information about the module alerts at the right side: The templates to which they correspond and their actions... Clicking on the module name, it will show at the right side information about it: Name, Type, module group, description... 7.1.2. Tactical View The tactical view of the Metaconsole is composed of: • Table with a summary of the agents and modules status. • Table with the last events. 7.1.2.1. Information about Agents and Modules The number of agents, modules and alerts of each status is shown in a summary table: 47
Monitoring •
•
•
•
•
•
•
Agents/Modules Normal Agents/Modules Warning Agents/Modules Critical Agents/Modules Unknown Agents/Modules Not started Alerts defined Alerts fired 7.1.2.2. Last Events The last 10 events are shown. This view is only informative, it is not possible to validate events neither see their information extended. The events from this list are strictly of monitoring, so the system events are omitted. Below the table there is one button to get access to the full event visor. 7.1.3. Group View The group view is a table with the groups of each Instance and the following information about each one: •
•
•
•
•
•
•
•
•
Name of the server of the instance to which it belongs to Status of this group (the worst status from their agents) Group name Agent total number Number of agents at Unknown status Number of modules in Normal status Number of modules in Warning status Number of modules in Critical status Number of alerts fired 48
Monitoring 7.1.4. Monitor View The monitor view is a table with information about the Instance monitors. The modules that are shown are restricted by the ACLs permissions and by the
permissions by Tags that the user would have.
It could be filtered by: •
•
•
•
•
•
Group Module status Module group Module name Tags Free search In this view not all the modules form the Instances are shown, because it would be not possible if they were big environments. A configurable number of modules is got from each instance. By default: 100. This parameter is Metaconsole Items from the Visual Styles Administration Section For example, if Metaconsole Items is 200, it will get a maximum of 200 modules from each Instance and they will be shown in the list. 49
Monitoring 7.1.5. Assistant/Wizard The Assistant or Wizard is not part of the data Visualization, but of the operation.There is much more available information at section Operation on this manual. 7.2. Events Pandora FMS uses an event system to "report" about all thing that have been happening in the monitored systems. In an event visor is shown when a monitor is down, an alert has been fired, or when the Pandora FMS system itself has some problem. The Metaconsole has its own event visor where the events from the associated instances are centralized. It is possible to centralize the events of all instances or only part of them. When the events of one instance are replicated in the metaconsole, its management becomes centralized in the metaconsole, so its visualization in the instance will be restricted to only reading. 7.2.1. Replication of Instance events to the metaconsole
In order that the instances replicate their events to the metaconsole it would be necessary to configure them one by one. To get more information about its configuration go to the section Setup and configuration of metaconsole in this manual. 7.2.2. Event Management To visualize the event management, it is divided in the view and in its configuration. 7.2.2.1. See Events The events that are received from the Pandora nodes are viewed from two views. In a first view we could see all the events that are form less than n days and in a second view you could see the events without validation from more days. Event view
You can go to the normal event view or to the all event view from less than n days, clicking on the Event icon from the metaconsole main page. 50
Events Event History
It is possible to activate the event history. With this feature, the oldest events from some time (configurable) , that does not have been validated, will be go automatically to a secondary view : The event history view. This view is like the normal event view, and you can have access to it from a tab in the event view. 51
Events The activation and configuration of the event history is shown in the section Metconsole administration in this manual. Event Filter
The event views have available a range of filtering options to could meet the user needs If you have available the ACLs in order to manage filters, at the bottom left side we will find the options to save the current filter or to load anyone of the already stored ones. Event Statistics
There is also available a graph of event generated by agent. To see this graph, click on the button on the upper right side. 52
Events Event Details
In the event list (normal or from history) it is possible to see the details of one event clicking on the event name or in the 'Show more' icon from the action field. The fields of one event are shown in a a new window with several tabs. 7.2.2.1.1.1. General
53
Events The first tab shows the following fields: Event ID: It is an unique identifier for each event. Event Name: It is the event name. It includes a description of it. Date and Hour : Date and Hour when the event is created in the event console. Owner: Name of the user owner of the event Type:Type of event. There can be the following types: • Ended Alert: Event that happens when an alert is recovered. • Fired Alert: Event that happens when an alert is launched. • Retrieved Alert: Event that happens when an alert is retrieved. • Configuration change • Unknown • Network system recognized by the recon. • Error • Monitor in Critical status • Monitor in Warning status • Monitor in Unknown status • Not normal • System • Manual validation of one alert • Repeated: It defines if the event is repeated or not. • Severity: It shows the severity of the event. There are the following levels: • Maintenance • Informative • Normal • Minor • Warning • Major • Critical • Status:It shows the status of the event. There are the following status: •
•
•
•
•
54
Events • New • Validated • In process • Validated by: In case that the event have been validated it shows the user who validated it, and the date and hour when it did. • Group: In case that the event comes from an agent module, it shows the group to which the agent belongs to. • Tags: In case that the event comes from an agent module, it shows the module tags. 7.2.2.1.1.2. Details
The second tab shows details of the agent and of the module that created the event. It is also possible to have access to the module graph. As last data it will show the origin of the even that could be a Pandora server or any origin when the API is used to create the event. 7.2.2.1.1.3. Agent Fields
55
Events The third flap shows the Agent customized fields. 7.2.2.1.1.4. Comments
The fourth tab shows the comments that have been added to the event and the changes that have been produced with the change of owner or the event validation. 56
Events 7.2.2.1.1.5. Event Responses
The fifth tab shows actions or responses that could be done on the event. The actions to do are the following: •
•
•
•
•
To change the owner To change the status To add a commentar To delete the event To execute a customized response: It would be possible to execute all actions that the user has configured. 7.2.2.2. Configure Events
Users with ACLs EW bits, will have available a tab to have access to the event configuration panel. 7.2.2.3. Managing Event Filters Filters on events allow to parametrize the events that you want to see in the event console. With Pandora it is possible to create predefined filters so one or several users could use them. Filters could be edited clicking on the filter name. 57
Events In order to create a new filter click on the button "create filters". There it will show a page where the filter values are configured. The fields through the filter is done are these: 58
Events • Group: Combo where you can select the Pandora group. • Event Type: Combo where you can select the event type. There are the following types: • Alert Ceased • Alert fired • Alert Manual Validation • Alert Recovered • Error • Monitor Down • Monitor up • Recon host Detected • System • Unknown • Severity: Combo where you can select by the event severity.The following options are available: • Critical • Informational • Maintenance • Normal • Warning • Event Status: Combo where you can select by the event status.There are the following options: • All event • Only in process • Only new • Only not validated • Only validated • Free search: Field the allows a free search of one text • Agent Search: Combo where you can select the agent origin of the event. • Max hour old: Combo where the hours are shown • User Ack: Combo where you can select between the users that have validated an event. • Repeated: Combo where you can select between show the events that are repeated or to show all events Besides the search fields in the Event Control filter menu, it shows the option Block size for pagination,where you can select between the number of event that will be in each page when paginating. Managing Responses
In events you can configure responses or actions to do in some specific event. For example, to do a ping to the agent IP which generated the event, to connect through SSH with this agent, etc. 59
Events The configuration of the responses allows to configure both a command and a URL. To do this you can use both internal macros of the event and _agent_address_, _agent_id_ or _event_id_. And there is also possible to define a parameter list separated by commas that will be filled in by the user when executing the response. Customizing Fields in the Event View
With Pandora FMS it is possible to add or delete columns in the event view.Each column is a field for the event information, so it is possible to customize that view. From this screen it will be possible to add fields in the event view, passing them from the box on the right, available fields to the box at the right, fields selected. To delete fields from the event view, they will be go from the box on the right to the box on the left. 60
Events 7.3. Reports In the Metaconsole, it is possible to do all kinds of reports on Instance data. The configuration of one report is stored in the Metaconsole, but when it is visualized, it gets data connecting to the instances. For the report editor, the origin of the agents and monitors is transparent. The user will
not know from which Instance they come from.
Reports can be created in two different ways: • Manually • With report templates For more information, please go to the documentation section Reports 7.4. Screens 61
Screens 7.4.1. Network Map The network map shows a Hierarchical view of the Instance agents and modules filtered by an specific criteria. In the normal console, there are 3 different network maps: By topology, by groups and by policies. In the Metaconsole, there is only one type: A variation of the Map by groups. In this case there could be found configuration options in common with the map by groups: •
•
•
•
Group (Except that you can't select the group All by performance) Free search Layout Font size 62
Screens • Regenerate • No overlap • Simple And other new options: • Show agent in detail: To show the map of one agent in particular. • Show modules: To show or not the modules (In the normal console you could select between showing only the groups, the groups and agents or all. Like in the network map of the Metaconsole, it is not possible to show more that one group, so only this option makes sense). • Show sons: To show or not the Instances to which the agents belong to. • Show module groups: It adds to the hierarchy the groups of modules from which the modules are pending There are two buttons in the configuration, one to apply it and see the result and another to save the map. 7.4.2. Visual Console It is possible to configure a visual console in the Metaconsole, that is a panel composed by a background and items put on it. These items can be: • Icons that represent an agent or module and that have a color depending on its status: Red for critical, yellow for Warning, Green for normal and Grey for unknown. • A Percent value or bubble item. • A monitor graph. • A monitor value. • A tag with rich text. • An static icon that could be linked to other maps. 63
Screens The configuration and presentation of data is exactly the same as in the normal console visual maps, only that data are got from the Instances in a transparent way for the user. 64
Screens For more information, please go to this section Visual maps 7.5. Netflow The Metaconsole has available an option to monitor the Instances IP traffic (NetFlow). In the Metaconsole are configured the NetFlow monitoring parameters, included the Instance in which it will be used. When it is executed, a request via API is done to the Instance. It will be return the result already processed. The configuration is done in the Metaconsole, but all the monitoring work and data
interpretation is done in the Instance
To have more information, please go to the section Network management with Netflow 65
Netflow 8 OPERATION 66
Operation This section will explain how to operate (create, edit, delete) data from the instances from the metaconsole. This operation is done from a single editor, we call it "Wizard" or monitoring assistant. 8.1. Assistant / Wizard
Monitoring Wizard or Wizard is used to configure the agents and modules from the Metaconsole alerts, it's an exclusive component of the metaconsole, and it's not present in the regular console. Issues to consider • The operation of modules will be implemented as components of both local network. This is not intended to create modules "from scratch" • You can create agents from scratch, with a simplified configuration, setting up the remaining fields by default. • Modules created in the agent (manually or outside the metaconsole wizard) cannot be edited in the Wizard. • Modules created in the Wizard will be indistinguishable from those created in the agent by other means. These modules can be edited and deleted from both the Wizard and from the agent setup directly. Sample: We have a metaconsole and two pandora instances, in which we have full access (read and administration rights) The instances have two agents with three modules each one: The first time we enter in the metaconsole wizard, you will see the agents, but not the modules: 67
Assistant / Wizard
We create from the metaconsole, a module to monitor the harddisk in each agent. Now, from the wizard, we can see the module, and edit the created module: And from each Pandora FMS instance we can see the modules and edit them. 68
Assistant / Wizard
From the instances, is indistinguishable if a module has been created from the metaconsole or not. A different case happen in the metaconsole three view, where you can see all modules,
where you will see all modules that have access regardless of the actions of the Wizard.
We can also view and delete (but not edit) the modules created from the Instance, when
you edit an agent from the wizard.
8.1.1. Access There are two ways to access the wizard: • Direct access to the Wizard from the main page of the metaconsole. 69
Assistant / Wizard
• From the top menu, in the monitoring section. All users with wizard access will be able to access to module configuration and alerts. Agent configuration must be activated "per user", on demand. 8.1.2. Action Flow In the following graph is showed the complete flow of actions that are possible to do in the Metaconsole Wizard: 70
Assistant / Wizard
8.1.3. Modules
In the module option we can create one module or edit one that is already created. 71
Assistant / Wizard
8.1.3.1. Creation In the module creation the first step will be select one agent where to create it. It could be filtered by group or search by name between the available agents. The agents available will be those of each Instance where our user has creation
permissions (AW)
72
Assistant / Wizard
After selecting the agent, we should click in Create module. Now we should select the type of module that we will create: • Monitor • Web Check 73
Assistant / Wizard
Monitor Creation
Monitor creation is done using the module templates/components.These components are classified by groups: The nature of the module (local or remote) will be transparent for the user, and in the selection combos, the components of both types will be mixed. If we select the component, the description of it will be shown. 74
Assistant / Wizard
To configure the monitor we click on Create. The configuration of one monitor will be done in 4 steps: • General Configuration: The monitor more general data (name,description,Ip,etc.) 75
Assistant / Wizard
• Advanced Configuration: Monitor advanced data (Thresholds, interval, etc). 76
Assistant / Wizard
• Alerts: An alert editor where to configure in the module alerts of the template alerts of whom we have permissions • Previsualization:' Data introduced in only one scree before finishing the process. 77
Assistant / Wizard
Data to fill in depends on the component we use. Depending if it is a network or a local
component and if it is basic or advanced .
Creating Web Check
The web checks can have two different kinds: • Step by step:The web checks are configured with an assistant without the need to know its syntax • Advanced: The web checks are configured in raw in a box text. It is only for users with advanced permissions. 78
Assistant / Wizard
If the user doesn't have advanced permissions,it won't have option to configure an
advanced check. It will directly pass to configure a check Step by step.
Once you have selected the modality, we click on Create. The web check configuration will be done, same as with monitors in 4 steps: • General Configuration: The monitor more general data (name, description, type.. and the check according to their modality) • Modality Step by Step:
79
Assistant / Wizard
• Advanced Modality:
80
Assistant / Wizard
The kind of check can be:
• Latency: In this check is obtained the total time that pass from the first petition until
that the last one is checked. If there are several checks the average will be get.
• Response: In this check is obtained a 1 (OK) or a 0 (failed) as result when checking all
the transaction. If there are several attempts and some of them fails, then it is
considered that the whole test fails also.
• Advanced Configuration:Monitor advanced data (Thresholds, interval, proxy configuration, etc) 81
Assistant / Wizard
• Alerts: An alert editor where to configure in the module alerts of the alert templates on which we have permissions. Same as in the monitor creation. • Previsualization' Data introduced on a single screen before finishing the process. Same as with the monitor creation. Module Creation Flow
82
Assistant / Wizard
8.1.3.2. Administration The modules created from the Metaconsole Wizard will can be managed (edit and delete them). The modules created in the Instance will not be visible in the Wizard
The first step is to select the module that we want to manage. We can filter by group and search by agent to find it quickly. 83
Assistant / Wizard
Once it has been selected, we can do click on Delete to delete it or on Edit to edit it. When editing it we will have access to a screen very similar to the creation one with the same 4 steps: •
•
•
•
General Configuration: Edition of the monitor more general data. Advanced Configuration: Edition of the monitor advanced data. Alerts: Monitor alert edition Preview:' The data modified in a single screen before finishing the process. The management of local and remote modules and web checks is transparent for the
user.The fields to edit change but the editing/deleting process is the same
Module Administration Flow
84
Assistant / Wizard
8.1.4. Alerts The alert editor is a direct link to the alert step in the module edition. This is done to make its access and management easier. In the alert options we could create an alert or edit one that is already created. Alerts could be only added ore created in modules to which we have access from the Wizard. Or, what is the same, those modules created from the Wizard and on which we have ACL permissions. 85
Assistant / Wizard
8.1.4.1. Creation
In the alert creation we will select a module where we want create the alert. 86
Assistant / Wizard
After selecting the alert, we will click on Create alert. The following screen will be the edition of the module associated to the alert in the alert edition step. Alert Creation Flow
87
Assistant / Wizard
8.1.4.2. Administration
The alerts created from the Metaconsole Wizard can be managed (edited and deleted). The alerts created in the Instance won't be visible in the Wizard
The first step is to select the alert that we want manage. We can filter by group and search by agent to find it faster. 88
Assistant / Wizard
Once it has been selected, we can click on Delete to delete it or on Edit to edit it. If we click on Edit we will go, same as when we create an alert, to the edition of the associated module in the alert edition step. 89
Assistant / Wizard
Alert Management Flow
90
Assistant / Wizard
8.1.5. Agents
In the option of agents we can create an agent or edit an already created one. 91
Assistant / Wizard
8.1.5.1. Creation The creation of one agent is done in one of the configured Instances. The administrator users can select in one of them create it. However, the standard users will have assigned one Instance where they will create the agents in a transparent way. This assignment is done at User management The agent configuration will be done in three steps: • General Configuration: The monitor more general data (name, description, IP, etc). and in case of being administrator, also the Instance where it will be created. 92
Assistant / Wizard
• Modules: A module editor, where we select from a combo the network components that are available and we add them to the agent. 93
Assistant / Wizard
• Preview: Data introduced in a single screen before finishing the process. Agent Creation Workflow
94
Assistant / Wizard
8.1.5.2. Administration Those agents which user can modify its configuration (due ACL setup), can be administer (edit and delete). First step, is select the agent you want to administer. You can filter by group and/or search for a text substring, to find it easily. 95
Assistant / Wizard
Once you selected the agent, you can click on Delete to remove it, or in Edit to edit it. Edition screen is similar to the creation screen, with the same three steps: • General configuration: Edit here the general information about the agent. • Modules: Edit the agent modules • Previsualization:' Just a preview to be sure everything it's ok. Unlike management modules in an agent's edition will also see the modules that have
been created with the Wizard
Agent administration workflow
96
Assistant / Wizard
8.2. Differences Depending on Access Level The modules and alerts have configuration differences depending on the access level, based on how was created in the Wizard and templates and the user's access level that you set. Setting agents have fewer restrictions but also depends on the level of access. 8.2.1. Monitors Configuration of a monitor will change depending of the access level on the component used: basic or advanced. When the access level is "Advanced", you will have some additional fields: • The name (in the "basic" level, it takes the name of the component, in advaned, you can redefine it). • Units. • Macros (when are local modules or remote plugin modules). In the basic level, it will be crated with the default values. 8.2.2. WEB Checks When setting up a "webcheck", user with "advanced" user level, can choose between the "step by step" configuration or use the detailed, low level mode. 97
Differences Depending on Access Level Users with "basic" level, only can use the "step by step" configuration mode. WEB monitoring wizard (step by step configuration), uses a guided tour to setup up the different options, without showing the underlaying syntax. Advanced mode editor, allow user to write the fullsintax WEB monitoring module, which is more powerful and flexible, but also more complex. 8.2.3. Alerts In the alerts, the access level: Basic or advanced in the associated template, only affects to it's visibility: Alerts at "basic" level, can be seen by anybody which access to the wizard, and the "advanced" level, only by the users which have "advanced" level access. Is the component level which defines the "level" of the alerts in that module. A module can be associated with any of the alerts visible for the user. If it is a Basic component or a WEB Check styepbystep,the alerts will be created with a default action assigned, and cannot be changed. If it is an Advanced component or a complex/advanced WEB Check, the default action can be changed. 8.2.4. Agents Agent management will give access to all agents accessible to the user, depending on it's ACL configuration. Doesn't depend on wizard access level of the user (advanced, basic), and neither if the modules were created with the wizard or from the node. The only restriction about this, comes in the step to add modules in the edit/create view. This setup is done only by using network components and with "basic" level. The reason for this behaviour is because this kind of modules doesn't have any configuration, and the advanced wizard level modules, should need extra configuration. 98
Differences Depending on Access Level 9 ADMINISTRATION 99
Administration The Advanced section contains the Metaconsole administration options, between them: • The data synchronization between the Metaconsole and the Instances • The data management classified in: •
•
•
•
•
•
•
Users
Agents
Modules
Alerts
Tags
Policies
Categories
• The Metasetup where there are: • The Instances configuration
• The Metaconsole configuration options
9.1. Instance Configuration In the Metasetup section, besides all the options of the console configuration, there is a tab for the console Setup. In this tab, we will select the instances. All the configuration process is available at the manual section Install and Configure 9.2. Metaconsole Configuration In the Metasetup section we find tabs with the Metaconsole configuration different options: 9.2.1. General Configuration In this section we find general data of the Metaconsole, such as the language, the date/hour configuration, information about the license or customization about some sections, among others. It is possible to customize if we want that the Netflow section would be enabled or disabled, the tree view classified by tags, the visual console and the possibility of web checks creation from the Wizard. 100
Metaconsole Configuration 9.2.2. Password Policy It is possible to set a password policy with limitations in the password number of characters, expiration, temporary blocking of one user. To know more about the password policy go to the manual section Password policy 101
Metaconsole Configuration 9.2.3. Visual Configuration All configuration related to the data representation. Colors and graph resolution, number of items in the view pagination,etc. 102
Metaconsole Configuration 9.2.4. Performance Visualization options, historic and event purging. 103
Metaconsole Configuration 9.2.5. File Management File manager where it is possible to upload and delete the files from the images folder from the Metaconsole installation. The Metaconsole code re-uses some images from the normal console code. These
images will be not accessible form this manager and it will be necessary to get to the
installation manually to manage them.
9.2.6. String Translation With the string translation feature it is possible to customize translations. We do a search of the string in the language that we want to customize. The original string will be shown, the translation to that language and a third column to writte the customized translation. 104
Metaconsole Configuration 9.3. Synchronization Tools 9.3.1. User Synchronization
This option allows to the user synchronize the Metaconsole users, and also their profiles with the Instances. The profiles that are not in the Instance will be created.
There are two options: • To copy the profiles configured in the user. 105
Synchronization Tools • With this option we can configure profiles that are different from the user profiles. 106
Synchronization Tools In doubt of which one of these two options use, you should Copy the user profiles.
9.3.2. Group Synchronization
This option allows to the user to synchronize the Metaconsole groups with the Instances. To avoid problems with the synchronization of groups, we shoud have done the
recommended steps regarding Index scaling in the section of Install and Configure the
Metaconsole.
9.3.3. Alert Synchronization
This option allows to the user synchronize the alerts already created in the Metaconsole with the Instances. 107
Synchronization Tools 9.3.4. Components Synchronization This option allows to the user to synchronize the module components already created in the Metaconsole with the Instances. 9.3.5. Tags Synchronization
This option allows to the user synchronize the tags already created in the Metaconsole with the Instances. 108
Synchronization Tools 9.4. Data Management 9.4.1. Users It is possible to do the following actions in the user management section: • User Management • Profiles Management • Edit my user 9.4.1.1. User Management
In the section Advanced>User Management>User Management, we can see the list of the already created users and modify their configuration and also create new users: 109
Data Management Create an User
To add an user click on Create user Next the following form is shown: The more remarkable parameters are these: •
•
•
•
•
•
•
•
•
User ID: identifier that the user will use to authenticate in the application. Full Display Name: Field to write the complete name. Password: Field to put the password Password confirmation: Field to confirm the password Global Profile: you should choose between Administrator and Standard User. The Administrator will have absolute permissions on application over the groups where it is defined.The standar user will have permissions defined in the profile that they have assigned. Email: Field to write the user mail address. Phone Number: Field to write the user telephone. Comments: Fields where comments are written Interactive charts:Allows that the user could or not see the Interactive graphs and at last option to base on the option configured in the global configuration. 110
Data Management • Metaconsole access: Sets the user access permissions to the Metaconsole, being these: • Basic: With this access the user could user in the Wizard only the components whose Wizard level would be Basic as long as it has ACLs permissions on the group to which they belong to • Advanced: With this access the user could use in the Wizard any of the components, regardless what their Wizard level are. As long as it has ACLs permissions on the group to which they belong to. • Not Login: If this option is selected, the user could have access to the API • Enable agents management: This options is to enable the agent administration in the Wizard. If it is disabled only the module and alert Wizard will be available. • Enable node access: This option is to enable the access to the instances. If it is enabled, it will be possible to have access through the name of agents and modules in many places to the Instance consoles. For example, from the network map or the event view. Modify/Deactivate/Delete an user
In the user list are available options to: •
•
•
•
Activate/Deactivate the user Edit the user Delete the user from the Metaconsole Delete the user from the Metaconsole an from all Instances The edition form for an user is the same to the creation one but including the profile editor. 111
Data Management In the profile editor it is possible to assign to the user profiles in specific groups and besides, limit those privileges to the selected Tags. It tags are not selecte, the user will have access to all modules, have the associated Tags or not. 112
Data Management 9.4.1.2. Profile Management
In the profiles are defined the permissions that an user can have. There is a serial of ACLs flags that will give access to the different Pandora FMS functionalities. It is possible to see a profile list created by default: In order to know which function enables each ACLs flag from the profiles, go to user manual section Profiles in Pandora FMS Adding a profile
Clicking on Create, it will be possible to add profiles to the ones that comes by default to customize the user access. 113
Data Management Then select the profile name and select the permissions that you want to assign to it. Some of these bits doesn't makes any sense in the Metaconsole.However, we may want
to use the Metaconsole to synchronize profiles to the Instances, where they could be
useful.
Modify/Edit a profile
In the profile list there are available options to modify a profile and delete it. 114
Data Management 9.4.1.3. Edit my user
In this section could be edited the data of the user that is authenticated in the Metaconsole. The profiles assigned to the user are shown in this screen with informative character.Its edition is done from the user administrator. 115
Data Management This will be the only section available for users without administration permissions. 9.4.2. Agents
In the agent management is included: • Agent movement between instances • Group management 9.4.2.1. Agent Movement
This option allows to the user to move the agents already created between the Pandora FMS instances. 116
Data Management Then, you select the origin server and the agents that you want to copy, being possible to filter by group to make the search easier. Next, select the destination server to which all the created agent will be copied By security reasons, what is done is to copy the agent an deactivate it in the origin
instance
9.4.2.2. Group Management
We can manage the groups defined in the Metaconsole 117
Data Management After creating or updating one group, it should be synchronized with the Instances for a
correct work
Adding one Group
To add one group click on "Create Group". The following form will be shown: 118
Data Management Next are detailed the form fields: • Name: Group name • Icon: combo where you can select the icon that the group will have. • Parent: combo where it is possible to define another group as parent of the group that is being created. • Alerts: If you select the agents that belongs to the group, they can send alerts, if not they can't send alerts. • Custom ID:Groups have an ID in the Database. In this field it's possible to put an other customized ID that could be used from an external program to do an integration (i.e: CMDB's). • Propagate ACL:Allows to propagate the ACLs to the child subgroups. • Description:Group description. • Contact:Information of the contact accesible from the macro group_contact_macro • Other:Available Information from macro group_other_macro Once the groups have been selected click on "Create" button. Modify/Delete one Group
In the group list are available some options to modify the group or to delete it. 119
Data Management 9.4.3. Modules In the module management we find options to configure the Metaconsole components and also the Plugins. 9.4.3.1. Components
A component is a "generic module" that could be applied several times on one agent, as if it was a "master copy" of one module, generating a modules associated to one agent. This way, having a database of the components that we use more in our company, when monitoring new agents, it's very easy, so we have our own components adapted to the technologies that we generally use and we only have to apply these components to the new agents. There are two kinds of components:Network components, that groups all the remote type modules (wmi, tcp, snmp, icmp, plugin, web, etc), and local components, that are the definition of the modules that are defined in the software agents configuration, defined as text "pieces" that could be cut and pasted in the agent configuration. From the component management section the following actions can be done: • Component Groups Management • Local Components Management • Network Components Management Component Groups Management
In the view you can see the list of component groups already created. 120
Data Management 9.4.3.1.1.1. Create Component Group
To create a Component Group you only need to click on "Create " It will show the following form: Once it is filled in, click on "Create" 9.4.3.1.1.2. Modify/Delete Component Group
In the category list are available some options to modify a category and delete it. 121
Data Management Local Components Management
The local components refers to the local modules templates that can be applied to create modules in the software agents through the Wizard In the view, you can see the list of the local components already created. 122
Data Management 9.4.3.1.1.3. Create Local Component
To create a new local component, click on "Create" button. It shows the following form: The configuration items are these: • Name:Component name. This name will be visible when you select the component when you create a module for one agent. • OS: Operative system for which the component is • Group: The group in which the module will be. It is useful to filter and order by monitoring technologies. • Description:Module description. In a predefined way a description already exists which could be changed. • Configuration: Component configuration,same as the module configuration for the software agents. • Wizard level: The Wizard level is fixed. It can be basic or advanced. • Type:Type of data that the module returns • Module group:Group to which the module will belongs to. • Interval: Module execution intervale. • Warning/Critical status:Minimum and Maximum range for the warning and critical status. • FF threshold:Number of times that a value should be return for it could be considered right • Unit:Field to show the value unity. • Post proccess:Value which the value that the module will return will be multiplied by • Critical/warning/unknown instructions:Instructions that will be executed when the module goes to a critical, warning or unknown status. • Category:Category to which the module will belongs to • Tags:Tags association to the policy 9.4.3.1.1.4. Macros
It is possible to define macros in the local components. These macros will be used in the parameter module_exec and will have the structure _field1_ , _field2_ ... _fieldN_. Each macro will have three fields:Description, Default value and Help. • Description:It will be the tag next to the field in the module form. • Default value:Optional value to load by default in the module form field. • Help:Optional field to add additional information to the field. If it is defined, a tip will be shown next to the field with this string. 123
Data Management If the component Wizard level is basic, the macros couldn't be configured in the module creation process. They will have as value the one that will be assigned to them by default in the component. Instead, if it is advanced, they will be shown in the module edition form (Wizard) as normal fields, in a transparent way for the user. 9.4.3.1.1.5. Modify/Delete/Duplicate Local Components
To modify a local component, we click on its name. In the local components list are available options to duplicate the component and delete it. 124
Data Management It is possible to delete them one by one, or to select several ones and delete them in one step. Network Components Management
Network components refers to the templatesof network modules, plugins of WMI that could be applied to create modules in the agents through the Wizard. In the view, you can see the list of network components already created. 125
Data Management 9.4.3.1.1.6. Creating Network Components
It is possible to create three different kinds of network components: • Network (from Network). • Plugin (from server plugin). • WMI. To create a new network component in the dropdown menu, select a network component from the three possible ones (WMI, Red o Plugin): and press the button Create. Depending on the type of module there will be some field that could change,like the selection of the plugin in the type plugin or the WMI query or in the WMI type. In the view it is possible to see the creation form from one of them: 126
Data Management 9.4.3.1.1.7. Modify/Delete/Duplicate Network Components
To modify a network component we click on its name. In the network components list are available some options to duplicate the component and delete it. 127
Data Management It is possible to delete them one by one or select several of them and delete them in one step. 9.4.3.2. Plugins From this section is possible to create and modify the plugins that the Network components type plugin will use. Create Plugin
It is possible to create new tags clicking on "Add".The following form will be shown: 128
Data Management In plugins, same as in the local components, it's possible to use macros that will be replaced, in this case in their parameters. These macros will be shown as normal fields in the plugin type Network Component definition.This way they won't be differenced by an user with other one more field of the Component 129
Data Management Modify/Delete Plugins
In the plugin list some options are available to modify one plugin and delete it. 9.4.4. Alerts In the Metaconsole, alerts could be created. Alerts, same as in a Pandora FMS normal Instance are composed by Commands, Actions, and Templates. In this section there will be an introduction for each one of the sections where they are managed. To know more about their performance and configuration, you can see the Pandora FMS manual section Alerts System After creating or updating one alert, you should synchronize it with the Instances for a
correct performance
9.4.4.1. Commands
Commands are the alerts lowest level. It could be the execution of one script or any other type of reaction to the alert firing 130
Data Management We can manage the Metaconsole commands in an identical way to as it is done in the Pandora FMS instances. 9.4.4.2. Action
Actions are a higher level to the commands in the alerts. A command and its configuration is assigned to an action. For example their parameters. 131
Data Management We could manage the Metaconsole actions in an identical way as it is done in the Pandora FMS instances. 9.4.4.3. Alert template
Alert templates are the highest layer of alerts and which will be allocated directly to the modules. On the templates it is specified that trigger actions, under what conditions (fall in a given state of the module, overcoming certain values ...) and when (certain days of the week, when the condition several times in a row ... ) We manage templates metaconsole alerts in an almost identical as in the instances of Pandora FMS. The only difference is the field "Wizard level". 132
Data Management This field defines which users can use this template to create alerts from the Wizard. • No Wizard: This template will not be available in the wizard. • Basic: Any user with wizard access can use this template to create alerts. • Advanced: Only users with advanced level access can use this template. 9.4.5. Tags From this section it is possible to create and modify tags. 133
Data Management 9.4.5.1. Creating Tags
It is possible to create new tags clicking on the "Create tag" button. The following form will be shown: 134
Data Management Parameters definition: •
•
•
•
Name:Tag name Description:Tag description Url:Hyperlink to help information that should have been previously created EMail:Email that will be associated in the alerts that belongs to the tag 9.4.5.2. Modify/Delete Tags
In the tag list there are available options to modify one tag and to delete it. 9.4.6. Policies In Metaconsole there is no policy system, but you can manage policies instances. 9.4.6.1. Policy apply
From Metaconsole policies can be applied in the instances where they come from. 135
Data Management Policies are selected that are to apply in the box on the left and on the right is selected instances in which they apply. Confirm the operation clicking on the 'apply' button. 9.4.6.2. Policy management queue
You can also control the application queue policy of the instances. In this queue you will see all policies merged, coming from all instances in order to have an overview of the status of implementation of policies and their history. You can apply a filter according to the policy, type of operation and status 136
Data Management 9.4.7. Categories In this section, we can manage the "categories". Later we will use this in module components. 9.4.7.1. Create categories Click on button "Create category". 137
Data Management 9.4.7.2. Modify/Delete category
On the list, you can click on edit button or delete to delete it. 138
Data Management 10 GLOSSARY OF METACONSOLA TERMS 139
Basic and Advanced Accesses 10.1. Basic and Advanced Accesses Accesses that are given to users, to the module components and the alerts. Users with basic access will only could use the components and alerts of this level. Users with advanced access will could use the components and alerts of any level. On the other hand, the Advanced components type will be more configurable than the Basic type. • It will be possible to change the name • More fields will be shown in its edition • Advanced fields, as for example, unities • Fields that correspond to the macros in case of the local components or from network type plugin • etc. • Showing the configuration of the actions in the alerts. In the basic type, the alerts will be created with the actions by default. 10.2. Component A component is a template to create one module It can be: • Local • From Network • Network type • Plugin type • WMI type 10.3. Instance Pandora FMS normal installation, configured to it could be accessed through the Metaconsole and optionally, to replicate its events to the Metaconsole. 10.4. Metaconsole Pandora FMS special installation that is made up of agents, modules and alerts from the Instances The Metaconsola also store their own data: • Some of them are configurations that are used to visualize data that it gets from the Instances. • Reports • Network Maps • Netflow • Others are data that is created and stored in the Metaconsole, but they should be synchronized with the Instances: • Users • Groups • Components • Alerts 140
Wizard 10.5. Wizard Assistant to create modules. Using the module components and the alert templates, it will be possible to create modules of different types in the Instances in an easy and transparent way. In the wizard the different instances are not distinguished. All agents and modules will be shown mixed as if they come from the same source. 141
Wizard 11 METACONSOLE FAQ (FREQUENTLY ASKED QUESTIONS) 142
I can't see the agents of one group to which I have access to 11.1. I can't see the agents of one group to which I have access to The user should have the same permissions in the Metaconsole and in the node. Check it. The correct creation flow is to create and assign permissions to the user from the Metaconsole and synchronize them. 11.2. I change the permissions to one user and it doesn't work To change the permissions of one user we should do it from the Metaconsole and we will synchronize this user from the Synchronization section. The profile synchronization is based on creating new profiles in the node user.This way, it won't be possible to touch accidentally profiles that are configured in the node. 11.3. When I try to configure one Instance, it fails We should make sure that: • The machine where the Metaconsole is can see the instance machines • The Metaconsole machine has permissions on the Instance database. • We have defined the authentication parameters (auth) and the Api password in the instances and configured correctly in the Metaconsole • We should have configured the list of IPs that can have access to its API (including the one of the Metaconsole) in the Instances. 143
When I try to configure one Instance, it fails 12 APPLIANCE CD 144
Appliance CD Since releasing the 4.1 version, we have been using an Appliance installation system to install the operating system and Pandora FMS from the CD with all the required dependencies. In older versions, we used to use SUSE as Base System. However, since the 4.1. version, the base system is CentOs, RedHat Enterprise Linux's brother. The installation CD can be used to install Pandora FMS on a dedicated physical system or in a virtual machine. The installation of the CD uses the Redhat installation system (Anaconda) itself, allowing a graphical or text installation. The CD comes with all the software required to accomplish the installation, so that Internet connection is not necessary to complete a full installation of Pandora FMS. Since the "normal installation" of Pandora from packages usually need Internet connection to solve dependencies, etc., we can consider this last improvement as a big advantage. The basic credentials to access the machine when you have set up your application, are the following ones: SSH Access root / (defined in the initial installation)
MySQL access root / pandora
Pandora FMS Web Console admin / pandora
12.1. Minimum Requirements The installation CD has been conceived to preinstall Pandora FMS in mediumsized environments. However, if it is parameterized, you can adjust it so it will preinstall Pandora FMS in any kind of environment. Nonetheless, the following things are required to instal the system. • 1024 MB RAM, 2GB recommended. • Disk 2GB, 8GB recommended. • 2.4Ghz CPU, Dual Core recommended. 12.2. Recording image to disk
1.
2.
3.
4.
5.
6.
Linux: Use a disc burning application (brasero, k3b, wodim). (brasero, k3b, wodim). Windows: Use a disc burning application (nero, freeisoburner). Mac: Use the System Disk tool to burn the ISO. You will get a bootable CD with the installation system Pandora FMS You can also burn the ISO to a USB stick to boot the system from there. Check in your BIOS if your system does not boot using the CD as a source 12.3. Installation This screen will show up when starting. If you do not press any key, the Live CD will be automatically loaded. You can use the live CD to "explore" Pandora FMS, but we do not recommend 145
Installation it. If you press a key in the boot screen, the boot menu will be displayed with the options you can see in the screenshot below. If you select "Install (Text mode) the installation will be performed in text mode. However, if you choose the Install option, the graphical installation will start (recommended). 146
Installation 12.3.1. Graphical installation The graphical installer will be guiding you throughout the whole installation process. This installer is available in several languages. It is a standard installation process used by Redhat / CentOS. 147
Installation The graphic installer starts with a screen like this one. 148
Installation Pick the installation language, which will be used for the base operating system. 149
Installation Select the appropriate keyboard for the system. 150
Installation If you have a special hardware disk, you can use an external CD with drivers. It's usual to use the default option (using default drivers). 151
Installation Configure the machine hostname. 152
Installation Select the time zone 153
Installation Choose the password of the "root" user (super user) 154
Installation Choose the partitioning. Unless you know what you are doing, use the "Use the entire disk" option.
155
Installation Confirmation to create the filesystem. After that, the target disk will be erased.
156
Installation The system starts copying data to the disk. 157
Installation Pandora FMS has been successfully installed. Remove the CD from the drive and press the button to restart the system 12.3.2. Installation from the Live CD 158
Installation If you have chosen the live cd or you have not had time to choose an option, after the boot, this screen with some icons will appear, including the Installation disk icon. From this step on, the installation will be identical to the (Graphical) installation explained in the previous section. 12.3.3. Text mode installation After selecting the "text mode installation", a welcome screen will appear. 159
Installation Now it's time to select the language. After selecting the language, an error may occur when finding the disk. In that case, please, restart the unit. 160
Installation In this step you can choose your system time zone. Here, you must introduce the root password. 161
Installation One of the last steps is to select the type of partitioning. You will have thee options: use the entire disk, replace the installed system or use the free disk space. 162
Installation Once all the steps have been completed, the files must be copied to the disk and the installation will be over. 12.4. First boot 163
First boot This is how the screen would look when booting the system. Desktop after booting and logging in (automatically). If you prefer to manually log in, remember that the account "artica" does not have any password. You can set one from the system 164
First boot configuration. From these options you can configure the base system. You do not need to do anything from the command console, everything can be managed easily from here. 165
First boot If you click on the icon of Pandora in the desktop, you will access directly the Pandora Web Console with the browser. Keep in mind that the "pandora" account of MySQL has been created with a fixed password. Go to / etc / pandora / pandora_server.conf to see the default password. Other fixed users have been created too. Both users, artica and root, have the same fixed password than the "pandora" MySQL user. Please, change this password as soon as possible with the following commands: passwd root
passwd artica
To find the IP address assigned automatically to your system by the network, run the command below from a shell: ifconfig
You can change the IP from the administration menus (Graphic mode) or though the command line with the Cent0s command: system-config-network
Just for advanced users: If you wish to set the system to NOT start in graphical mode,
you can change the system runlevel by editing / etc / inittab and changing the level 5 for
166
First boot Level 3.
12.4.1. Server Reconfiguration If you ever wish to change any parameter of the system network or anything else in the system, you can do it by using the system GUI menu or with the command 'setup' from the command line: From these options you can configure the base system. Everything can be managed easily from here. 167
First boot "setup" screen , through the shell. To make changes to the server from the command line, you need to execute commands as "root" or superuser account. To do this, you must obtain certain permissions by using the command: su -
It will request the root password. If you enter it well, it should give you a shell like the following one, ending with "#". It means you have root permissions: linux-9pg0:/home/user #
Beware when running commands as root. A misused command could disable the
whole system
12.4.2. YUM packages Management YUM is a package manager for CentOS command line similar to APT / GET of SUSE Zypper or Debian. To search for a package, use the line below: 168
First boot yum search <nombre_paquete>
To install a package: yum install <nombre-paquete>
To install packages, you must do it like a root. 12.4.3. Technical Notes on Appliance Note that the preconfigured system has the features below that you can change to increase safety: •
•
•
•
•
•
•
•
SSH access as root enabled. SELinux enforcement disabled. Firewall disabled. Automatic access to the "artica" account via sudo. The artica account with password "pandora" is enabled by default. Automatic Login System in the graphical console (X). Pandora Web Console Default password (admin / pandora). MySQL user "root" default password (different from OS user). These parameters should be modified in a production system. 169
First boot 13 SSH CONFIGURATION TO GET DATA IN PANDORA FMS 170
SSH Configuration to Get Data in Pandora FMS Sometimes, we can't use the standard transfer method in Pandora FMS to pass files (Tentacle) because we could be using a Unix system that has not Perl (as Sistems ESX for example) and we have to use the old agent in shellscript. When this happens the options are to use FTP or SSH to transfer the file. Pandora FMS can use the SSH protocol to copy the XML data packages that are generated by the agents, to the server. For it, you have to follow these steps: 1. Create a "pandora" user in the host where is your Pandora FMS server, that is going to receive the data through SSH. If you have already installed a Pandora server, then you should have this user already created. Fix a strong password for this user with the command: passwd pandora
2. At the server, create /home/pandora/.ssh directory with permissions 750 and user pandora:root 3. Create, in each system where you have an agent that wants to use SSH, a pair of keys. For it, execute the following command with the same user that will be used to execute the Pandora's agent: # ssh-keygen
There will be a group of questions that you should answer by simply clicking Enter. A public/private key for this user has been created in the system. Now you should copy it to the destiny system, that is the Pandora's server where you want to send the data. 4. To copy the public key to the Pandora's server. The public key that has just been created could be copied in two ways: Manually, including the content of the public key file that is on the system where the agent is, on the remote keys file that is in Pandora server, located at /home/pandora/.ssh/authorized_keys (that should have ownership pandora:root and permissions 600). The public key file generated in the sustem where is the agent is /root/.ssh/id_rsa.pub. This file will have a content similar to this one: ssh-rsa
AAAAB3NzaC1yc2EAAAABIwAAAQEAzqyZwhAge5LvRgC8uSm3tWaFV9O6fHQek7PjxmbBUxTWfvNbbswbFsF0
esD3COavziQAUl3rP8DC28vtdWHFRHq+RS8fmJbU/VpFpN597hGeLPCbDzr2WlMvctZwia7pP4tX9tJI7oyC
vDxZ7ubUUi/bvY7tfgi7b1hJHYyWPa8ik3kGhPbcffbEX/PaWbZ6TM8aOxwcHSi/4mtjCdowRwdOJ4dQPkZp
+aok3Wubm5dlZCNLOZJzd9+9haGtqNoAY/hkgSe2BKs+IcrOAf6A16yiOZE/GXuk2zsaQv1iL28rOxvJuY7S
4/JUvAxySI7V6ySJSljg5iDesuWoRSRdGw== root@dragoon
In an automatic way with the following command: ssh-copy-id pandora@ip_del_host_del_servidor
It will ask you the password of the server "pandora" user, and once this has been confirmed, it will show you a message like this: Now try logging into the machine, with "ssh 'pandora@ip_del_host_del_servidor'", and
check in:
.ssh/authorized_keys
171
SSH Configuration to Get Data in Pandora FMS to make sure we haven't added extra keys that you weren't expecting.
Do this test to verify that the automatic connection to the pandora server with the user "pandora" from the agent's machine, with the root user is possible. Until it would be possible, the agent will not send data through SSH. This method will be used by the agents to copy data to the /var/spool/pandora/data_in. Pandora FMS server directory Make sure also that the directory /var/spool/pandora/data_in directory already exists and that the user «pandora» has writing permissions, or otherwise it will not work. At last, modify the agent configuration to specify to it that the copy method is ssh and not tentacle. This should be modified in the /etc/pandora/pandora_agent.conf' file and in the transfer_mode configuration token. 13.1. SSH Server Securization
Pandora FMS uses, among others, sftp/ssh2 (scp), to copy data files from the agents to the server. Due to this, you will need at least one data server with a SSH2 server that listen the «pandora» user. This could be an important risk for a network that needs to bee strictelly securized. Open SSH2 is very secure, but regarding Computer Security, there is nothing that is absolutely secure, so you should take measures in order to make it «more» secure. To use SSH, it is recommended to use scponly, an small tool that forbidden that the remote start sessions use SSH for specific uses.This way it is possible to forbid access through SSH for «pandora» users and allow only sftp/s in this system. 13.1.1. What is Scponly? Scponly is an alternative 'shell' for system administrators that want to give access to remote users to read and write files without giving any remote privilege for execution. It could be also described as an intermediate system between the system and the SSH system applications. A typical use of Scponly is to create a semipublic account that is not similar to the concept of anonymous session start for FTP. This allows that an administrator could share files in the same way that a FTP would do it, but it should use all the protection that SSH gives. This is specially relevant if you consider that the FTP authentications cross public networks in a flat text format. Using scponly to securize the «pandora» user is very easy: Install scponly (for systems based on Debian): apt-get install scponly
Or use yum install scponly with suitable repositories, or install manually with rpm i scponly. Replace the shell of «pandora» user for scponly: usermod -s /usr/bin/scponly pandora
172
SSH Server Securization
It is done. With this, you could use the «pandora» user to copy files with scp, but you will not have access to the server with the «pandora» user. More information at scponly web site. 173
SSH Server Securization
14 CONFIGURATION TO RECEIVE DATA IN THE SERVER THROUGH FTP 174
Configuration to receive data in the server through FTP Please, read the previous section regarding to SSH. The configuration on client to send data through FTP allows to specify the user and the password that is going to be send, so it's easy to implement the copy through FTP to the agent, instead to Tentacle. The problem is that the sending of data through FTP is less safe, so as there is a FTP working with Pandora's server, this makes it more vulnerable to failures that comes with the FTP system security design. See the sections that come after to know how "securize" a little more your server. Besides configuring the Pandora's agents for sending data with FTP, you will have to configure a FTP server into the Pandora server, fix a password for the user "pandora" (that will be the one you will use in the Pandora's agents) and allow the writing access to the "pandora" user to the /var/spool/pandora/data_in directory and to other lower ones. This implies that you should configure the FTP server to adecuate it to these needs. In the following sections, you could see how to do it for the ProFTPD and VsFTP servers, two of the most used in Linux. 14.1. Securizing the FTP (proftpd) Server From its version 1.3,Pandora FMS also support all the platforms of its agent, the FTP usage to transfer XML data files. For all of this, you will need, at least, a dataserver with a FTP server ready for the «pandora» user. This could be an important risk in a network that needs to be strictly securized. These small recommendations to do a secure FTP, are for the demon proftpd, a FTP server sofware with GPL license highly configurable, that includes several options to limit the access. It is recommended to configure these parameters in proftpd.conf Umask
077 077
MaxInstances
30
DefaultRoot /var/spool/pandora/data_in pandora
The DefaultRoot directive uses pandora as group, so you should create the «pandora» group that would include the «pandora» user. Other file that controls the access at user level is /etc/ftpusers.This file contains all users that have not permission to connect with this server. [root@myserver]# cat /etc/ftpusers
root
bin
daemon
adm
lp
sync
shutdown
halt
mail
news
uucp
175
Securizing the FTP (proftpd) Server operator
games
guest
anonymous
nobody
Try to start session with «pandora» user in the FTP and to access to other different directories from /var/spool/pandora/data_in(this should be the only visible directory for this user under the alias). 14.2. Vsftpd Securization
Vsftpd has different parameters to securize a FTP account, but this could come into conflict with scponly. It is recommended to implement some changes to reinforce the security in the «pandora» account, to could use the FTP and SSH transfer systems in a simultaneous way: 1. Change the home directory of «pandora» user by /var/spool/pandora/data_in 2. Keep scponly as shell by default. 3. Copy or move the directory /home/pandora/.ssh to /var/spool/pandora/data_in.Do not forget to check the the directory /.ssh has the «pandora» use as owner and that it has the right permissions. 4. Modify the vsftpd configuration file: /etc/vsftpd.conf and add the following parameters: check_shell=NO
dirlist_enable=NO
download_enable=NO
deny_file=authorized_keys
deny_file=.ssh
chroot_local_user=YES
This configuration fix the home directory of «pandora» user as /var/spool/pandora/data_in, and does not allow to the «pandora» user to connect remotely to establish an interactive command session. It also allows FTP transfers with the same user, «pandora», to send &mdash files; but only allows to have access to the &mdash data entry directory; and does not allow neither to have access to other directories nor list the content of any file. 176
Vsftpd Securization
15 PANDORA FMS INTEGRATION WITH HP NETWORK NODE MANAGER (SNMP) 177
Pandora FMS Integration with HP Network Node Manager (SNMP) It is possible to use Pandora FMS at the same time with HP Network Node Manager (NNM) to inform about all important events that has been collected by Pandora FMS to a global system managed with HP OpenView Network Node Manager. This is useful, so it allows to monitor some environments with Pandora FMS and send only those important events to another monitoring system such as NNM. The Pandora FMS way of firing alerts makes it very flexible when exporting some specific data through SNMP traps. This will be the mechanism chosen to do the integration. We are going to create an script that will allow, through the analysis of some arguments, to generate some specific traps that Network Node Manager will be able to manage. 15.1. Configuring NNM First of all, we should fix a "classification" list based in the critical nature of the events generated from Pandora FMS. We will do it based on five criticity levels (Normal, Warning, Minor, Major and Critical. We will define these five kinds of events associated to an specific OID of user, that in this case will be from 1.3.6.1.4.1.24800.251 to 1.3.6.1.4.1.24800.255).These are the OID associated to the events of these five categories: 178
Creating Specific Alerts of Pandora FMS 15.2. Creating Specific Alerts of Pandora FMS From an only alert with different parameters, we will able to export the alerts to NNM. For this, we should create an alert in the following way: 15.3. SNMP Traps Generation Script
This alert has associated an script that is detailed next, and that should be called by each server that process and execute the exported module: #!/bin/bash
HOST=`hostname`
ESPECIFIC_OID=$1
# _field1_ pandora
ERROR=$2
# _field2_ pandora
DESCRIPCION=$3
# _field3_ pandora
HOST_DESTINO=nnm
COMMUNITY=public
ENTERPRISE_OID=.1.3.6.1.4.1.24800
WARNING=0
MINOR=1
MAJOR=2
CRITICAL=3
NORMAL=4
MAXL=2000
DIR=`dirname $0`
LOGFILE="$DIR/`basename $0 | awk -F'.' '{print $1}'`.log"
CONF="$DIR/`basename $0 | awk -F'.' '{print $1}'`.conf"
truncate_log()
{
typeset
LOG=$1
typeset
LINES=$2
typeset
TMP1=/tmp/$PRG.tmp1
if [[ -z "$LINES" || -z "$LOG" ]] ; then
echo "$PRG: truncate_log(): Parametros incorrectos -> [$LOG] [$LINES]"
179
SNMP Traps Generation Script
return
fi
if [ ${LINES%[kK]} != $LINES ] ; then # Log binario, truncamos con dd
LOGSIZ=$(du -k $LOG | awk '{print $1}')
MAXSIZ=${LINES%[kK]}
# Eliminamos caracter 'k' final
typeset -i SKIP
# Nm. de bloques de 1K a obviar
# Ver comando 'dd' abajo
if [[ $LOGSIZ -gt $MAXSIZ ]] ; then
echo -n "$LOG : Truncando a $MAXSIZ Kbytes ..."
(( SKIP = LOGSIZ - MAXSIZ ))
dd if=$LOG of=$TMP1 bs=1040 skip=$SKIP
if [[ $? -eq 0 ]] ; then
#
# Vaciado de $LOG
#
>$LOG
if [[ $? != 0 ]] ; then
echo "$PRG : Error vaciando fichero $LOG"
return
else
cat $TMP1 >>$LOG
if [[ $? != 0 ]] ; then
echo "Error rellenando $LOG"
return
fi
echo 'OK!'
>$TMP1
fi
else
echo "Error en comando 'dd if=$LOG of=$TMP1 bs=1024 skip=$SKIP'"
fi
fi
else
# Log ASCII, truncamos con tail
NUMLIN=$(wc -l <$LOG)
if [[ $NUMLIN -gt $LINES ]] ; then
echo -n "$LOG : Truncando a $LINES lineas ..."
(( NUMLIN -= LINES - 1 ))
tail +$NUMLIN $LOG >$TMP1
if [[ $? -eq 0 ]] ; then
#
# Vaciado de $LOG
#
>$LOG
if [[ $? != 0 ]] ; then
echo "$PRG : Error vaciando fichero $LOG"
return
else
cat $TMP1 >>$LOG
if [[ $? != 0 ]] ; then
echo "Error rellenando $LOG"
return
fi
echo 'OK!'
>$TMP1
fi
else
echo "Error en comando 'tail +$NUMLIN $LOG >$TMP1'"
fi
fi
fi
rm -f $TMP1
}
# truncate_log()
#
180
SNMP Traps Generation Script
# MAIN
#
#
# Crea log si no existe
#
[ ! -f $LOGFILE ] && touch $LOGFILE
for linea in `cat $CONF | grep -v "^#"`
do
if [ ! -z `echo $linea | grep "HOST"` ]
then
HOST_DESTINO=`echo $linea | grep "HOST" | awk -F'=' '{print $2}'`
elif [ ! -z `echo $linea | grep "COMMUNITY"` ]
then
COMMUNITY=`echo $linea | grep "COMMUNITY" | awk -F'=' '{print $2}'`
elif [ ! -z `echo $linea | grep "ENTERPRISE_OID"` ]
then
ENTERPRISE_OID=`echo $linea | grep "ENTERPRISE_OID" | awk -F'=' '{print $2}'`
elif [ ! -z `echo $linea | grep "WARNING"` ]
then
WARNING=`echo $linea | grep "WARNING" | awk -F'=' '{print $2}'`
elif [ ! -z `echo $linea | grep "MINOR"` ]
then
MINOR=`echo $linea | grep "MINOR" | awk -F'=' '{print $2}'`
elif [ ! -z `echo $linea | grep "MAJOR"` ]
then
MAJOR=`echo $linea | grep "MAJOR" | awk -F'=' '{print $2}'`
elif [ ! -z `echo $linea | grep "CRITICAL"` ]
then
CRITICAL=`echo $linea | grep "CRITICAL" | awk -F'=' '{print $2}'`
elif [ ! -z `echo $linea | grep "NORMAL"` ]
then
NORMAL=`echo $linea | grep "NORMAL" | awk -F'=' '{print $2}'`
elif [ ! -z `echo $linea | grep "LOG"` ]
then
LOG=`echo $linea | grep "LOG" | awk -F'=' '{print $2}'`
else
LINEA=`echo $linea`
fi
done
if [ "$ERROR" = "WARNING" ]
then
ESPECIFIC_OID=`expr $ESPECIFIC_OID + $WARNING`
elif [ "$ERROR" = "MINOR" ]
then
ESPECIFIC_OID=`expr $ESPECIFIC_OID + $MINOR`
elif [ "$ERROR" = "MAJOR" ]
then
ESPECIFIC_OID=`expr $ESPECIFIC_OID + $MAJOR`
elif [ "$ERROR" = "CRITICAL" ]
then
ESPECIFIC_OID=`expr $ESPECIFIC_OID + $CRITICAL`
elif [ "$ERROR" = "NORMAL" ]
then
ESPECIFIC_OID=`expr $ESPECIFIC_OID + $NORMAL`
else
if [ $LOG ]
then
echo ""
echo " ---- Error. Nivel de error $ERROR no especificado ---- "
exit 1
fi
fi
#echo "$WARNING $MINOR $MAJOR $CRITICAL $NORMAL"
181
SNMP Traps Generation Script
#echo "$COMMUNITY $HOST_DESTINO $ENTERPRISE_OID $HOST $ESPECIFIC_OID $DESCRIPCION"
if [ $LOG ]
then
echo ""
echo ""
echo "COMMUNITY=$COMMUNITY ENTERPRISE_OID=$ENTERPRISE_OID
ESPECFIC_OID=$ESPECIFIC_OID DESCRIPCION=$DESCRIPCION" >> $LOGFILE
echo "/usr/bin/snmptrap -v1 -c $COMMUNITY $HOST_DESTINO $ENTERPRISE_OID $HOST 6
$ESPECIFIC_OID '' $ENTERPRISE_OID.0 s '$DESCRIPCION'" >> $LOGFILE
fi
/usr/bin/snmptrap -v1 -c $COMMUNITY $HOST_DESTINO $ENTERPRISE_OID $HOST 6
$ESPECIFIC_OID '' $ENTERPRISE_OID.0 s "$DESCRIPCION"
if [ $? -eq 0 ]
then
echo "Ejecucion correcta" >> $LOGFILE
echo ""
else
echo "No se ha ejecutado correctamente" >> $LOGFILE
echo ""
fi
#
# Trunca el fichero de log si supera MAXL lineas
#
truncate_log $LOGFILE $MAXL
15.4. Use of the Alert on a Module
This is an screen shoot of how to use the alert, defining an alert over a module. The field field1 is used for the OID and to know at which group of alarms it refers to (in this case you should always put the «251» defined in the NNM for Pandora).In the field field2 is the criticity level that has been defined (MAJOR when sending the trap is a name that is added to the 251 to make the oid). The field field3 is the alarm description. 182
Use of the Alert on a Module
15.5. Visualizing Data in NNM And this is the final view of the Network Node Manager Console, getting events from Pandora FMS: 183
Visualizing Data in NNM 16 INSTALLATION AND CONFIGURATION OF PANDORA FMS AND SMS GATEWAY
184
About the GSM device 16.1. About the GSM device We are using an special device to send SMS through a serial port (usb). You can use a generic GSM module accesible using USB/Serial Cable, or a GSM Phone with a USB/Serial connector supported by your hardware, this is not really important. Device used here, is the MTX 65 v3. And could be adquired for about 100$ in several websites like: • http://matrix.es • http://www.tdc.co.uk/index.php?key=gsm_ter_gprs • http://www.youtube.com/watch?v=OxcKAarS2M0 As you can see in Youtube, it's a pretty small and compatible device, with several optional components, like a GSM antenna (very useful if your datacenter is underground, for example). Using a GSM mobile phone is also a good option, currently most modern mobile phones are supported on linux. 16.2. Installing the Device The first step is to install the hardware device. This device is composed of several parts: • Standard USB cable, with small connector and an end. • Power supply (in this sample is European 220v, if you live in USA, please be sure that power supply supports 110v). • SIM card. • Pandora FMS SMS gateway device. Open the Pandora FMS SMS gateway device and put the SMS card inside. 185
Installing the Device Plug to network in the "power" input, plug the USB cable in the SMS Gateway device and connect the other end to the Pandora FMS server using a standard USB port. 186
Installing the Device When you connect the device to the server, wait a few seconds and run "dmesg" command from the command line, you should see something like this screenshot. This means device has been recognized by the kernel and it's ready to accept commands on a device, like /dev/ttyACM0 If you're here, the hardware setup is done. If not, please review all steps and be sure that: • Device is connected and led is blinking in a green color. • Device is connected to the USB port, both sides of wire, one side to the SMS device, and other side to the Pandora FMS server host. • Device has a SIM card inside, and it's placed properly. 16.3. Configure SMSTools to Use the New Device This device is managed by a software package called SMSTools. You can install smstools using the package provided by your Linux Distribution or use RPM package provided by Artica (only for RPM distributions). 187
Configure SMSTools to Use the New Device 16.3.1. Debian / Ubuntu In Debian/Ubuntu, you need to "customize" the sendsms script that will use Pandora FMS First, install the package from APT repositories $ sudo apt-get install smstools
And then, you need to use a provided sample script to send sms from command line, and "customize" it: cp /usr/share/doc/smstools/examples/scripts/sendsms /usr/bin
chmod 750 /usr/bin/sendsms
Edit /usr/bin/sendsms and add the following line to the end of script: chmod 666 $FILE
16.3.2. RPM based system (SUSE, Redhat) Using our RPM is easier, just install it: # rpm -i smstools*.rpm
16.3.3. Configure SMStools Edit base configuration file: # vi /etc/smsd.conf
Put this contents. If your dmesg output is not ttyACM0, use the tty device detected by your system. # Example smsd.conf. Read the manual for a description
devices = GSM1
logfile = /var/log/smsd.log
loglevel = 10
[GSM1]
device = /dev/ttyACM0
incoming = no
pin = 2920
Use the PIN assigned to your SIM, in this example, PIN is "2920". Then, start manually smstools: # /usr/bin/smstools start
Send an SMS test. BEWARE: Phone numbers must have full (int.) preffix. In this sample, +34 is Spanish preffix, and my phone number is 627934648: 188
Configure SMSTools to Use the New Device $ sendsms 34627934648 "Pandora FMS rocks"
Wait a minute and watch your logs to check that everything is correct. You should receive the SMS in a few seconds. Depending on the network, the first SMS can timeout every 1020 seconds, after that, wait. The next SMS should be almost immediate. SMSTools uses a queue to send messages, so you can send as many as you want, and they will be out as soon as your mobile network could manage. To see the logs: # cat /var/log/smsd.log
2009-11-12 11:30:12,2, smsd: Smsd v2.2.20 started.
2009-11-12 11:30:12,6, smsd: outgoing file checker has started.
2009-11-12 11:30:12,6, GSM1: Modem handler 0 has started.
2009-11-12 11:30:13,6, smsd: Moved file /var/spool/sms/outgoing/send_mNZxHa to
/var/spool/sms/checked
2009-11-12 11:30:13,6, smsd: I have to send 1 short message for
/var/spool/sms/checked/send_iUegPD
2009-11-12 11:30:13,6, GSM1: Sending SMS from to 627934648
2009-11-12 11:30:13,6, GSM1: Checking if modem is ready
2009-11-12 11:30:13,7, GSM1: -> AT
2009-11-12 11:30:13,7, GSM1: Command is sent, waiting for the answer
2009-11-12 11:30:14,7, GSM1: <- AT
OK
2009-11-12 11:30:14,6, GSM1: Checking if modem needs PIN
2009-11-12 11:30:14,7, GSM1: -> AT+CPIN?
2009-11-12 11:30:14,7, GSM1: Command is sent, waiting for the answer
2009-11-12 11:30:14,7, GSM1: <- AT+CPIN?
+CPIN: SIM PIN
OK
2009-11-12 11:30:14,5, GSM1: Modem needs PIN, entering PIN...
2009-11-12 11:30:14,7, GSM1: -> AT+CPIN="2920"
2009-11-12 11:30:14,7, GSM1: Command is sent, waiting for the answer
2009-11-12 11:30:15,7, GSM1: <- AT+CPIN="2920"
OK
2009-11-12 11:30:15,7, GSM1: -> AT+CPIN?
2009-11-12 11:30:15,7, GSM1: Command is sent, waiting for the answer
2009-11-12 11:30:15,7, GSM1: <- AT+CPIN?
+CPIN: READY
OK
2009-11-12 11:30:15,6, GSM1: PIN Ready
2009-11-12 11:30:15,6, GSM1: Checking if Modem is registered to the network
2009-11-12 11:30:15,7, GSM1: -> AT+CREG?
2009-11-12 11:30:15,7, GSM1: Command is sent, waiting for the answer
2009-11-12 11:30:16,7, GSM1: <- AT+CREG?
+CREG: 0,2
OK
2009-11-12 11:30:16,5, GSM1: Modem is not registered, waiting 10 sec. before
retrying
2009-11-12
2009-11-12
2009-11-12
+CREG: 0,5
OK
2009-11-12
2009-11-12
2009-11-12
2009-11-12
2009-11-12
OK
2009-11-12
11:30:26,7, GSM1: -> AT+CREG?
11:30:26,7, GSM1: Command is sent, waiting for the answer
11:30:26,7, GSM1: <- AT+CREG?
11:30:26,6,
11:30:26,6,
11:30:26,7,
11:30:26,7,
11:30:26,7,
GSM1:
GSM1:
GSM1:
GSM1:
GSM1:
Modem is registered to a roaming partner network
Selecting PDU mode
-> AT+CMGF=0
Command is sent, waiting for the answer
<- AT+CMGF=0
11:30:26,7, GSM1: -> AT+CMGS=94
189
Configure SMSTools to Use the New Device 2009-11-12 11:30:26,7, GSM1: Command is sent, waiting for the answer
2009-11-12 11:30:27,7, GSM1: <- AT+CMGS=94
>
2009-11-12 11:30:27,7, GSM1: ->
001100099126974346F900F1FF5CC8373BCC0295E7F437A83C07D5DDA076D93D0FABCBA069730A229741
7079BD2C0EBB406779789C0ECF41F0B71C44AF83C66FB7391D76EBC32C503B3C46BFE96516081E7693DF
F230C8D89C82E4EFF17A0E�
2009-11-12 11:30:27,7, GSM1: Command is sent, waiting for the answer
2009-11-12 11:30:31,7, GSM1: <001100099126974346F900F1FF5CC8373BCC0295E7F437A83C07D5DDA076D93D0FABCBA069730A229741
7079BD2C0EBB406779789C0ECF41F0B71C44AF83C66FB7391D76EBC32C503B3C46BFE96516081E7693DF
F230C8D89C82E4EFF17A0E�
+CMGS: 0
OK
2009-11-12 11:30:31,5, GSM1: SMS sent, To: 627934648
2009-11-12 11:30:31,6, smsd: Deleted file /var/spool/sms/checked/send_iUegPD
2009-11-12 11:30:32,6, smsd: I have to send 1 short message for
/var/spool/sms/checked/send_mNZxHa
2009-11-12 11:30:32,6, GSM1: Sending SMS from to 34627934648
2009-11-12 11:30:32,7, GSM1: -> AT+CMGS=29
2009-11-12 11:30:32,7, GSM1: Command is sent, waiting for the answer
2009-11-12 11:30:33,7, GSM1: <- AT+CMGS=29
>
2009-11-12 11:30:33,7, GSM1: ->
0011000B914326974346F900F1FF11D0B09BFC968741C6E614247F8FD773�
2009-11-12 11:30:33,7, GSM1: Command is sent, waiting for the answer
2009-11-12 11:30:36,7, GSM1: <0011000B914326974346F900F1FF11D0B09BFC968741C6E614247F8FD773�
+CMGS: 1
OK
2009-11-12 11:30:36,5, GSM1: SMS sent, To: 34627934648
2009-11-12 11:30:36,6, smsd: Deleted file /var/spool/sms/checked/send_mNZxHa
Finally, some tasks to could do to ensure the operation for the future: 1. Set 1 to loglevel in /etc/smsd.conf to avoid a very big, nonnecessary log file. 2. Be sure that smsd is set to start automatically when system restart (this means a link to /etc/init.d/sms to /etc/rc2.d/S90sms or /etc/rc.d/rc2.d/S90sms). If you have installed it from a package, probably they exist already in your system, just checkit. 16.4. Configure Pandora FMS Alert This steps reproduce the basic steps to create SMS alerts in Pandora FMS 3.x Create the command: 190
Configure Pandora FMS Alert Create the action: Associate the action to a module using a previous alert template. In this case, alert template will be fired when the module status would be CRITICAL. 191
Configure Pandora FMS Alert 16.5. Gateway to Send SMS using a generic hardware and Gnokii This method describe an alternative way to send SMS instead using smstools, using gnokii. This was the "old" method proposed for pandora 1.x and 2.x and it's written here only to have a second option. smstools method provided above is preferred. This section describes how to build a SMS sending gateway based in a sending queue. This way, it is possible to implement a SMS sending server, connected with a mobile and sending the SMS through the software of the Gnokii project, and different remote servers can send its messages in order the SMS sending server could process them. This allow that different Pandora FMS servers (or another machines that want to use the gateway) could send messages in a centralized way, without having to have a mobile for each server. In first place, you should create an «sms» user in the machine where you want to install it in the SMS sending gateway. After this, create the directories home/sms y /home/sms/incoming. If you want to use the SMS sending gateway from another machines, you will need to make accessible the directory /home/sms/incoming for other servers through any file sending system or file systems partition:NFS, SMB, SSH (scp), TCP or Tentacle. The SMS sending gateway mechanism is very easy: for each file that is at the directory /home/sms/incoming, an SMS will be processed, deleted and sent, with the file content. This file should have an specific format, which is detailed here: Phonenumber|SMSText 16.5.1. SMS Gateway Implementation You should create four scripts: SMS: Script that sends the SMS using Gnokii through an USB data cable.This script is only in the system where the sending gateway is (the system that has the data cable connected to a GSM mobile). SMS_GATEWAY: Script that process in a periodical way the entry directory (/home/sms/incoming), processing files that are waiting to be send. This script is only in the system that is used as sending gateway. SMS_GATEWAY_LAUNCHER: launcherScript for the SMS_GATEWAY script(start and stop daemon). This script is only in the system that does the sending gateway. COPY_SMS: copies an SMS using the scpcommand from a client system to a gateway system. Uses the TELEPHONE as first parameter, and the second as text to send (using ""for specifying each parameter).The script trust in the SSH automatic autentication and in the «sms» user for the transfer. In the local system you can remplace the «scp» for the «cp» command or use a system like Tentacle to transfer the file. 16.5.1.1. SMS
This is the script that sends SMS using Gnokii. You should have Gnokii well configured (using the file /etc/gnokii.confor similar). Probably should be the user root to could launch the script, or establish the SETUIDO in the gnokii binary. #!/bin/bash
texto=$1
192
Gateway to Send SMS using a generic hardware and Gnokii number=$2
if [ $# != 2 ]; then
echo "I need more parameters"
exit 1;
fi
/bin/echo $1 | /usr/local/bin/gnokii --sendsms $2
16.5.1.2. SMS Gateway This is the gateway daemon script: #!/bin/bash
INCOMING_DIR=/home/sms/incoming
HOME_DIR=/home/sms
while [ 1 ]
do
for a in `ls $INCOMING_DIR`
do
if [ ! -z "$a" ]
then
NUMBER=`cat $INCOMING_DIR/$a | cut -d "|" -f 1`
MESSAGE=`cat $INCOMING_DIR/$a | cut -d "|" -f 2`
TIMESTAMP=`date +"%Y/%m/%d %H:%M:%S"`
echo "$TIMESTAMP Sending to $NUMBER the message $MESSAGE" >>
$HOME_DIR/sms_gateway.log
$HOME_DIR/sms "$MESSAGE" "$NUMBER"
echo "$TIMESTAMP Deleting $a" >> $HOME_DIR/sms_gateway.log
rm -Rf $INCOMING_DIR/$a
sleep 1
fi
done
sleep 5
done
16.5.1.3. SMS Gateway Launcher This is the launching script form the sms_gateway: #!/bin/bash
# SMS Gateway, startup script
# Sancho Lerena, <[email protected]>
# Linux Version (generic)
# Configurable path and filenames
SMS_GATEWAY_HOME=/home/sms
SMS_PID_DIR=/var/run
SMS_PID=/var/run/sms.pid
# Main script
if [ ! -d "$SMS_PID_DIR" ]
then
echo "SMS Gateway cannot write it's PID file in $SMS_PID_DIR. Please create
directory or assign appropiate perms"
exit
193
Gateway to Send SMS using a generic hardware and Gnokii fi
if [ ! -f $SMS_GATEWAY_HOME/sms_gateway ]
then
echo "SMS Gateway not found, please check setup and read manual"
exit
fi
case "$1" in
start)
OLD_PATH="`pwd`"
if [ -f $SMS_PID ]
then
CHECK_PID=`cat $SMS_PID`
CHECK_PID_RESULT=`ps aux | grep -v grep | grep "$CHECK_PID" | grep
"sms_gateway" | wc -l`
if [ $CHECK_PID_RESULT == 1 ]
then
echo "SMS Gateway is currently running on this machine with
PID ($CHECK_PID). Aborting now..."
exit
fi
fi
nohup $SMS_GATEWAY_HOME/sms_gateway > /dev/null 2> /dev/null & 2> /dev/null
> /dev/null
sleep 1
MYPID=`ps aux | grep "$SMS_GATEWAY_HOME/sms_gateway" | grep -v grep | tail
-1 | awk '{ print $2 }'`
if [ ! -z "$MYPID" ]
then
echo $MYPID > $SMS_PID
echo "SMS Gateway is now running with PID $MYPID"
else
echo "Cannot start SMS Gateway. Aborted."
fi
cd "$OLD_PATH"
;;
stop)
if [ -f $SMS_PID ]
then
echo "Stopping SMS Gateway"
PID_2=`cat $SMS_PID`
if [ ! -z "`ps -F -p $PID_2 | grep -v grep | grep 'sms_gateway' `" ]
then
kill `cat $SMS_PID` 2> /dev/null > /dev/null
else
echo "SMS Gateway is not executing with PID $PID_2, skip Killing
step"
fi
rm -f $SMS_PID
else
echo "SMS Gateway is not running, cannot stop it."
fi
;;
force-reload|restart)
$0 stop
$0 start
;;
*)
echo "Usage: sms_gateway {start|stop|restart}"
exit 1
esac
194
Gateway to Send SMS using a generic hardware and Gnokii 16.5.1.4. Copy_Sms This small script creates a SMS sending file in a client machine and copies it to the SMS gateway using scp: #!/bin/bash
SERIAL=`date +"%j%M%s"`
SERIAL=`hostname`_$SERIAL
TEL=$1
TEXT=$2
echo $TEL\|$TEXT >> /tmp/$SERIAL
scp /tmp/$SERIAL [email protected]:/home/sms/incoming
rm -Rf /tmp/$SERIAL1
195
Gateway to Send SMS using a generic hardware and Gnokii 17 HA IN PANDORA FMS WITH DRBD 196
Introduction to DRDB 17.1. Introduction to DRDB The Distributed Replicated Block Device (DRBD) is a softwarebased, sharednothing, replicated storage solution mirroring the content of block devices (hard disks, partitions, logical volumes etc.) between servers. DRBD mirrors data: • In real time. Replication occurs continuously, while applications modify the data on the device. • Transparently. The applications that store their data on the mirrored device are oblivious of the fact that the data is in fact stored on several computers. • Synchronously or asynchronously. With synchronous mirroring, a writing application is notified of write completion only after the write has been carried out on both computer systems. Asynchronous mirroring means the writing application is notified of write completion when the write has completed locally, but before the write has propagated to the peer system. Over DRDB you can provide a cluster on almost everything you can replicate in disk. In our specific case when want to "clusterize" only the database, but we also could replicate a entire Pandora FMS setup, including server, local agents and of course database. DRDB is a RAID1/TCP based kernel module, very easy to setup and really fast and errorproof. You can get more information about DRBD in their website at http://www.drbd.org DRDB is OpenSource. 17.2. Initial enviroment We want to have a MySQL cluster in a HA configuration based on a master (active) and slave (passive). Several Pandora FMS servers and console will use a virtual IP address to connect with the running node which contains a MySQL server. This is the network configuration for the two nodes running the MySQL cluster: 192.168.10.101 (castor) > Master 192.168.10.102 (pollux) > Slave 192.168.10.100 virtualip 197
Initial enviroment In our scenario, the only Pandora FMS server is running here: 192.168.10.1 pandora > mysql app Each node, has two harddisks: /dev/sda with the standard linux system. /dev/sdb with an empty, unformatted disk, ready to have the RAID1 setup with DRBD. We assume you have time synchonized between all nodes, this is extremely IMPORTANT, if not, please synchronize it before continue, using ntp or equivalent mechanism. 17.3. Install packages Install following packages (debian) apt-get install heartbeat drbd8-utils drbd8-modules-2.6-686 mysql
Install following packages (suse) drbd heartbeat hearbeat-resources resource-agents mysql-server
17.4. DRDB setup 17.4.1. Initial DRDB setup Edit /etc/drdb.conf global {
usage-count no;
}
common {
protocol C;
}
resource mysql {
on castor {
device /dev/drbd1;
disk /dev/sdb1;
address 192.168.10.101:7789;
meta-disk internal;
}
on pollux {
device /dev/drbd1;
disk /dev/sdb1;
address 192.168.10.102:7789;
meta-disk internal;
}
disk {
on-io-error detach; # Desconectamos el disco en caso de error de bajo nivel.
}
net {
max-buffers 2048; #Bloques de datos en memoria antes de escribir a disco.
198
DRDB setup ko-count 4; # Maximos intentos antes de desconectar.
}
syncer {
rate 10M; # Valor recomendado de sincronización para redes de 100 Mb´s..
al-extents 257;
}
startup {
wfc-timeout 0; # drbd init script esperará ilimitadamente los recursos.
degr-wfc-timeout 120; # 2 minuteos
}
}
17.4.2. Setup DRDB nodes You need to have a completelly empty disk on /dev/sdb (even without partitioning). Do a partition in /dev/sdb1 (linux type). fdisk /dev/sdb
Delete all information on it dd if=/dev/zero of=/dev/sdb1 bs=1M count=128
(Do it in both nodes) And create the internal structure in disk for drbd with following commands in both nodes: drbdadm create-md mysql
drbdadm up mysql
(Again, do it in both nodes) 17.4.3. Initial disk (Primary node) The last command to setup DRBD, and only on the primary node, it's to initialize the resource and set as primary: drbdadm -- --overwrite-data-of-peer primary mysql
After issuing this command, the initial full synchronization will commence. You will be able to monitor its progress via /proc/drbd. It may take some time depending on the size of the device. By now, your DRBD device is fully operational, even before the initial synchronization has completed (albeit with slightly reduced performance). You may now create a filesystem on the device, use it as a raw block device, mount it, and perform any other operation you would with an accessible block device. 199
DRDB setup castor:/etc# cat /proc/drbd
version: 8.0.14 (api:86/proto:86)
GIT-hash: bb447522fc9a87d0069b7e14f0234911ebdab0f7 build by phil@fat-tyre, 2008-1112 16:40:33
1: cs:SyncSource st:Primary/Secondary ds:UpToDate/Inconsistent C r--ns:44032 nr:0 dw:0 dr:44032 al:0 bm:2 lo:0 pe:0 ua:0 ap:0
[>....................] sync'ed: 2.2% (2052316/2096348)K
finish: 0:03:04 speed: 11,008 (11,008) K/sec
resync: used:0/61 hits:2749 misses:3 starving:0 dirty:0 changed:3
act_log: used:0/257 hits:0 misses:0 starving:0 dirty:0 changed:0
17.4.4. Create the partition on primary node Do it ONLY in the primary node, will be replicated to the other nodes automatically. You operate with the DRBD block device, forget to use physical device. castor:~# mkfs.ext3 /dev/drbd1
Use is like a standard partition from now, and mount to your disk in primary NODE as follow: castor# mkdir /drbd_mysql
castor# mount /dev/drbd1 /drbd_mysql/
You cannot do this (mount) in the secondary, to do it, you before need to promote to primary, and previously, need to degrade primary to secondary: In primary (castor): castor# drbdadm secondary mysql
In secondary (pollux): pollux# drbdadm primary mysql
17.4.5. Getting information about system status Executed from current master node (castor) : castor:/# drbdadm state mysql
Primary/Secondary
castor:/# drbdadm dstate mysql
UpToDate/UpToDate
And from pollux (backup, replicating disk): pollux:~# drbdadm state mysql
Secondary/Primary
200
DRDB setup pollux:~# drbdadm dstate mysql
UpToDate/UpToDate
17.4.6. Setting up the mysql in the DRDB disk We suppose you have all the information about mysql in following directories (may differ depending on Linux distro): /etc/mysql/my.cnf
/var/lib/mysql/
First, stop the mysql in the primary and secondary nodes. In the primary node: Move all data to mounted partition in the primary nodes and delete all the relevant mysql information in the secondary node: mv /etc/mysql/my.cnf /drbd_mysql/
mv /var/lib/mysql /drbd_mysql/mysql
mv /etc/mysql/debian.cnf /drbd_mysql/
Link new location to original ubication: ln -s /drbd_mysql/mysql/ /var/lib/mysql
ln -s /drbd_mysql/my.cnf /etc/mysql/my.cnf
ln -s /etc/mysql/debian.cnf /drbd_mysql/debian.cnf
Restart mysql. In the secondary node: rm -Rf /etc/mysql/my.cnf
rm -Rf /var/lib/mysql
ln -s /drbd_mysql/mysql/ /var/lib/mysql
ln -s /drbd_mysql/my.cnf /etc/mysql/my.cnf
17.4.7. Create the Pandora FMS database We assume you have the default SQL files to create the Pandora FMS database files at /tmp mysql -u root -p
mysql> create database pandora;
mysql> use pandora;
mysql> source /tmp/pandoradb.sql;
mysql> source /tmp/pandoradb_data.sql;
Set permissions: 201
DRDB setup mysql> grant all privileges on pandora.* to [email protected] identified by
'pandora';
mysql> flush privileges;
17.4.8. Manual split brain recovery DRBD detects split brain at the time connectivity becomes available again and the peer nodes exchange the initial DRBD protocol handshake. If DRBD detects that both nodes are (or were at some point, while disconnected) in the primary role, it immediately tears down the replication connection. The telltale sign of this is a message like the following appearing in the system log: Split-Brain detected, dropping connection!
After split brain has been detected, one node will always have the resource in a StandAlone connection state. The other might either also be in the StandAlone state (if both nodes detected the split brain simultaneously), or in WFConnection (if the peer tore down the connection before the other node had a chance to detect split brain). In this case, our secondary node (castor) is alone: castor:~# cat /proc/drbd
version: 8.0.14 (api:86/proto:86)
GIT-hash: bb447522fc9a87d0069b7e14f0234911ebdab0f7 build by phil@fat-tyre, 2008-1112 16:40:33
1: cs:WFConnection st:Secondary/Unknown ds:UpToDate/DUnknown C r--ns:0 nr:0 dw:0 dr:0 al:0 bm:7 lo:0 pe:0 ua:0 ap:0
resync: used:0/61 hits:0 misses:0 starving:0 dirty:0 changed:0
act_log: used:0/257 hits:0 misses:0 starving:0 dirty:0 changed:0
At this point, unless you configured DRBD to automatically recover from split brain, you must manually intervene by selecting one node whose modifications will be discarded (this node is referred to as the split brain victim). This intervention is made with the following commands: drbdadm secondary mysql
drbdadm -- --discard-my-data connect mysql
On the other node (the split brain survivor), if its connection state is also StandAlone, you would enter: drbdadm connect mysql
See the status: pollux:/# cat /proc/drbd
version: 8.0.14 (api:86/proto:86)
GIT-hash: bb447522fc9a87d0069b7e14f0234911ebdab0f7 build by phil@fat-tyre, 2008-1112 16:40:33
1: cs:SyncSource st:Primary/Secondary ds:UpToDate/Inconsistent C r--ns:34204 nr:0 dw:190916 dr:46649 al:12 bm:24 lo:0 pe:4 ua:20 ap:0
[============>.......] sync'ed: 66.7% (23268/57348)K
202
DRDB setup finish: 0:00:02 speed: 11,360 (11,360) K/sec
resync: used:1/61 hits:2149 misses:4 starving:0 dirty:0 changed:4
act_log: used:0/257 hits:118 misses:12 starving:0 dirty:0 changed:12
17.4.9. Manual switchover In the current primary 1. Stop mysql /etc/init.d/mysql stop
2. Umount partition umount /dev/drbd1
3. Degrade to secondary drbdadm secondary mysql
In the current secondary 4. Promote to primary drbdadm primary mysql
5. Mount partition mount /dev/drbd1 /drbd_mysql
6. Start MySQL /etc/init.d/mysql start
17.5. Setup Hearbeat 17.5.1. Configuring heartbeat We suppose you have installed hearbeat packages and the drbd utils, which includes a heartbeat resource file in /etc/ha.d/resource.d/drbddisk First, you need to enable ip_forwarding. In DEBIAN systems, edit /etc/sysctl.conf and modify following line: net.ipv4.ip_forward = 1
203
Setup Hearbeat In SUSE systems, just use YAST and set forwarding active in the interface for heartbeat (in this documentation is eth1). Setup the ip address /etc/hosts in both hosts: 192.168.10.101
192.168.10.102
castor
pollux
17.5.2. Main Heartbeat file: /etc/ha.d/ha.cf Edit /etc/ha.d/ha.cf file as follows in both nodes: # Sample file for /etc/ha.d/ha.cf
# (c) Artica ST 2010
debugfile /var/log/ha-debug
logfile /var/log/ha-log
logfacility local0
keepalive 2
deadtime 30
warntime 10
initdead 120
udpport 694
bcast eth1
auto_failback on
# auto_failback on Make the cluster go back to master when master onde gets up.
# auto_failback off Let the master node to secondary when it gets up after a
failure.
ping 192.168.10.1 # Gateway de nuestra red que debe responder al ping
apiauth ipfail gid=haclient uid=hacluster #o los que corresponda
node castor
node pollux
17.5.3. HA resources file Edit /etc/ha.d/haresources in both hosts: castor drbddisk Filesystem::/dev/drbd1::/drbd_mysql::ext3 mysql 192.168.10.100
This defines the default "master" node. In that lines you defines the default node name, it's resource script to start/stop the node, the filesystem and mount point, the drbd resource (mysql) and the virtual IP address (192.168.10.100). 17.5.4. Settingup authentication Edit /etc/ha.d/authkeys in both hosts: auth 2
2 sha1 09c16b57cf08c966768a17417d524cb681a05549
The number "2" means you have two nodes, and the hash is a sha1 HASH. 204
Setup Hearbeat Do a chmod of /etc/ha.d/authkeys chmod 600 /etc/ha.d/authkeys
Deativate the automatic mysql daemon startup, from now, should be managed by heartbeat. rm /etc/rc2.d/S??mysql
17.5.5. First start of heartbeat First at all, be sure DRDB is ok and running fine, MySQL is working and database is created. Start heartbeat in both systems, but FIRST in the primary node: In castor: /etc/init.d/heartbeat start
In pollux: /etc/init.d/heartbeat start
Logs in /var/log/halog should be enought to know if everything is OK. Master node (castor) should have the virtual IP address. Change pandora configuration files on console and server to use the Virtual IP and restart the Pandora FMS server. You need to have a Pandora FMS server watchdog, to detect when the connection is down or use the restart option in pandora_server.conf: restart 1
restart_delay 60
17.6. Testing the HA: Total failure test 1. Start a web browser and open a session. Put the server view in autorefresh mode with 5 secs of interval: 2. Shutdown the primary node: Push the poweoff button. or Execute 'halt' on root console 3. Put a tail f /var/log/halog in secondary node to watch how is working the switchover. 4. Switchover can take 35 seconds.
205
Testing the HA: Total failure test 18 HA IN PANDORA FMS WITH MYSQL CLUSTER
206
Introduction
18.1. Introduction
MySQL Cluster allows the database clustering in a non sharing scenario. This reduces the number of single points of failure as it's possible to use inexpensive hardware with few requirements while still having redundancy of hardware. MySQL Cluster mixes the MySQL database server with an in memory clustered storage engine called NDB. In our documentation when we talk about NDB we talk about the storage engine, meanwhile when we talk about MySQL Cluster we talk about the combination of the database server technology and the NDB storage engine. A MySQL Cluster is a set of servers each one running several processes including MySQL servers, data nodes for the NDB storage engine, management severs, and (probably) specific programs to access the data. All data stored in a MySQL Cluster can be replicated so it can handle the failure of a single node without any more impact than a few transactions aborted as their status was lost with the node. As transactional applications are supposed to handle transaction errors this shouldn't be a problem. 18.1.1. Cluster related terms used in Pandora FMS documentation
Data Node
This kind of node stores the cluster data. There are as much data nodes as replicas times the
number of fragments (at least). For example, with tow replicas, each with two fragments, four
data nodes are needed. There is no need of having more than one replica. A data node is
started with the command ndbd (or ndbmtd if the multithreaded version is started).
SQL Node (or API Node)
This is the node that access the data stored in the cluster. For MySQL Cluster this is a
traditional MySQL server using NDB Cluster engine. A SQL node is started by the command
mysqld with the option ndbcluster added in the my.cnf configuration file.
Manager or MGM
This is the cluster administration node. The role of this node is to manage all the other nodes
in the cluster, allowing tasks like give configuration parameters, start and stop nodes, create
backups, and in general all the management tasks of the cluster. As this is the node that
manages the cluster configuration one of this kind of nodes should be started the first one,
before any other one. The management node is started with the command ndb_mgmd.
18.1.2. Cluster Architecture to use with Pandora FMS
The sample architecture used in this documentation has two servers that will run data nodes, and SQL nodes, also it has two management servers used to manage the cluster. 207
Introduction
The sample architecture has Pandoradb1 and Pandoradb2 as data and SQL nodes, Pandoradbhis and Pandora2 as managers, and finally Pandora1, Pandor2 and Pandora3 running pandora servers and pandora consoles. There is also some assumptions in this architecture: • There is a load balancer in the frontend, balancing the tentacle and SNMP traffic to the three Pandora FMS servers with a RR (RoundRobin) type of algorithm. • There is a load balancer in the backend to balance the queries done by the pandora servers and pandora consoles to the SQL nodes. Those load balancers are external to pandora and can be either software or hardware. To use a software load balancer there is documentation in Pandora FMS about how to setup a keepalievd. The purpose of the database cluster is to share the workload of the database when monitoring a high number of machines and parameters. For the cluster to work properly it's very important that the load balancer is well designed and works properly. The database cluster characteristics are the following: •
•
•
•
•
Works on memory, dumping to disk logs of the transactions. Needs a manager to operate the recovery process. Needs fast disks and fast network. It has strict memory requirements. It has to store all the database in memory to work fast. 208
Introduction
To improve the performance of the cluster, more RAM can be added. In this example it's supposed that the requirement of RAM is 16 GiB for each server involved in the database. 18.2. Installation and Configuration
The documentation is based on a SUSE installation where the installation of MySQL Cluster implies the rpms with the MySQL cluster software, in this case the rpms are the following files: •
•
•
•
•
•
•
•
MySQLClustergplclient7.0.60.sles10.x86_64.rpm MySQLClustergplextra7.0.60.sles10.x86_64.rpm MySQLClustergplmanagement7.0.60.sles10.x86_64.rpm MySQLClustergplserver7.0.60.sles10.x86_64.rpm MySQLClustergplshared7.0.60.sles10.x86_64.rpm MySQLClustergplstorage7.0.60.sles10.x86_64.rpm MySQLClustergpltest7.0.60.sles10.x86_64.rpm MySQLClustergpltools7.0.60.sles10.x86_64.rpmlibmysqlclient16 18.2.1. Configuring SQL Node and Data In each data node or SQL node we should modify the /etc/my.cnf configuration file, that besides the current MySQL configuration should also contain some extra parameters of the cluster configuration. Next these parameters are described, and also the values we should give to them (the complete final configuration is at the end of this annex). The cluster configuration parameters in the my.cnf file are applied two two sections: mysqld and mysql_cluster.In the mysqld section the following parameters should be added: • ndbcluster: order to the mysql motor that it have to star the NDB motor for databases in cluster. • ndbconnectstring="10.1.1.215:1186;10.1.1.216:1186":contains the connection string to the /node/s of management. It is a string of characters with th host format: port,host:port. • ndbclusterconnectionpool=10: connexion number in the connexion reserve, the cluster config.ini file should also define at least one MySQL node or an API node) for each connection • ndbforcesend=1: force the buffers to be sent inmediately without waiting for other threads. • ndbuseexactcount=0:deactivate the NDB forced to count the registers while the consulting SELECT COUNT (*) planning to make the queries quicker. • ndbautoincrementprefetchsz=256:determines the possibility of leaving blanks in an self incremented column. With a value of 1 the blanks, higher values speed the insertions, but reduce the possibilities that the consecutives numbers would be used in group insertions. In the mysql_cluster section, the following parameters should be added: • ndbconnectstring="10.1.1.230:1186;10.1.1.220:1186": has the connection string to it/ the management node/s. It consist of a string of characters with the host format:port,host:port. Here we can see an extract of the file: [mysqld]
# Run NDB storage engine
ndbcluster
# Location of management servers
ndb-connectstring="10.1.1.215:1186;10.1.1.216:1186"
# Number of connections in the connection pool, the config.ini file of the
# cluster have to define also [API] nodes at least for each connection.
209
Installation and Configuration
ndb-cluster-connection-pool=10
# Forces sending of buffers to NDB immediately, without waiting
# for other threads. Defaults to ON.
ndb-force-send=1
# Forces NDB to use a count of records during SELECT COUNT(*) query planning
# to speed up this type of query. The default value is ON. For faster queries
# overall, disable this feature by setting the value of ndb_use_exact_count
# to OFF.
ndb-use-exact-count=0
# Determines the probability of gaps in an autoincremented column.
# Set it to 1 to minimize this. Setting it to a high value for
# optimization — makes inserts faster, but decreases the likelihood
# that consecutive autoincrement numbers will be used in a batch
# of inserts. Default value: 32. Minimum value: 1.
ndb-autoincrement-prefetch-sz=256
# Options for ndbd process:
[mysql_cluster]
# Location of management servers (list of host:port separated by ;)
ndb-connectstring="10.1.1.230:1186;10.1.1.220:1186"
The final version of this file is on Annex 1
18.2.2. Manager Configuration First we should create the directory where the information of the cluster (/var/lib/mysqlcluster/) will be kept and in this directory will be created the cluster configuration file from which we are going to give a summary with the most relevant parameters: #
#
#
#
MySQL Cluster Configuration file
By Pablo de la Concepción Sanz <[email protected]>
This file must be present on ALL the management nodes
in the directory /var/lib/mysql-cluster/
##########################################################
# MANAGEMENT NODES
#
# This nodes are the ones running the management console #
##########################################################
# Common configuration for all management nodes:
[ndb_mgmd default]
ArbitrationRank=1
# Directory for management node log files
datadir=/var/lib/mysql-cluster
[ndb_mgmd]
id=1
# Hostname or IP address of management node
hostname=<hostname_nodo_de_gestion_1>
210
Installation and Configuration
[ndb_mgmd]
id=2
# Hostname or IP address of management node
hostname=<hostname_nodo_de_gestion_2>
.
.
.
The final version of this file is at the end of this document. The config.ini file is divided in the following options: •
•
•
•
•
•
•
[ndb_mgmd default]: common configuration for all the management nodes. [ndb_mgmd]:individual configuration of each management node. [ndbd default]: common configuration of the data nodes. [ndbd]: Configuración individual de cada nodo de datos [mysqld default]: common configuration of all API or SQL nodes [mysqld]: individual configuration of each API or SQL node [tcp default]: Connection buffers configuration 18.2.2.1. Parameters of the common configuration of the management nodes
Arbitration Rank: This parameter is useful to define which node will be the arbitrator (the management nodes and SQL nodes can arbitrate, it is recommended that there would be the management nodes will be the ones that have high priority), could have values from 0 to 2: • 0: The node will be never be used as arbitrator • 1: The node will have high priority, it will have priority over the nodes of low priority • 2: The node will have low priority and will only used as arbitratos if there are not other nodes of higher priority availables Datadir: Directory where are kept the logs of the management node 18.2.2.2. Parameters of individual configuration of the two management nodes There should be a section [ndb_mgmd] for each management node. id: node identificator. It should be the only one in all the configuration file. Hostname:host name or IP adress of the management node 18.2.2.3. Common Configuration Parameters for the Storage Nodes NoOfReplicas: Redundancy, number of replies for each table kept in the cluster. This parameter also specifies the size of the node groups. A group of nodes is a set of nodes that keeps all the same information. It is recommended to stablish the number of replies to 2 that allow to have high availability. Datadir: Directory where are kept the files related with the data node (logs, trace files,error files, files with the pid) DataMemory: This parameter fix the space (in bytes) that is available to keep registers of the database, all the space that is shown is reserved in memory, so it is extremely important that there should be enough physical memory to reserve without the necesity of using the exchange memory. 211
Installation and Configuration
IndexMemory: This parameter monitors the storage quantity used by hash index in MySQL Cluster. The hash index are always used by index with primary key, unique index and unique restrictions. StringMemory: This parameter shows how much memory is reserved for strings of characters ( such as tht names of the tables), a value between 0 and 100 is taken as a percentage of the maximum value( that changes according to a big number of factors) while a value higher to 100 is interpreted as the number of bytes. (25% should be enough). MaxNoOfConcurrentTransactions:This parameter shows the maximum number of transactions in a node. It should be the same for all data nodes. This is due to that if a node fails, the older node of the ones that are left, start again to create all the transactions of the fallen node (change the value of this parameter implies a complete stop of the cluster). MaxNoOfConcurrentOperations: Shows the maximum number of registers that could be simultaneously in updating phase or bloqued MaxNoOfLocalOperations: It is recommended to stablish this parameter with a value of the 110% of MaxNoOfConcurrentOperations. MaxNoOfConcurrentIndexOperations: This parameter has a default value of 8192 and only in cases of extremely high parallelism that use unique hash index, it should be necessary to increase its value. It is posible to reduce its value if the Database administrator considers that there is not much parallelism and with it saving some memory. MaxNoOfFiredTriggers: This parameter has by default a value of 4000, and it should be enough in the majority of cases. Some times it would be even posible to reduce its value if the Database administrator considers that there is not much parallelism. TransactionBufferMemory: This temporal memory storage is used while the update of the index tables and of reading of unique index for keeping the key and the column in this operations, and usually, we should not modify the 1M default value. MaxNoOfConcurrentScans: This parameter shows the maximum number of parallel scanning that the cluster could do, that could be able to support so many scans as the selected ones for this parameter in each node. MaxNoOfLocalScans: This parameter shows the number of registers scanned locally if several scans are not made completely in parallel. If it is not specified, it is calculated as the product of MaxNoOfConcurrentScans by the number of data nodes. BatchSizePerLocalScan:Shows the number of bloqued registers that are used to deal with concurrent scanning operations LongMessagesBuffer: This parameter determines the size of a temporary internal storage for the information exchange between nodes. NoOfFragmentLogFiles: This parameter shows how many redo log blocks will be generated and together with FragmentLogFileSize allows to determine the total size of the redo log. FragmentLogFileSize: Size of the redo log extracts makes a redo log and it is the size with wich is reserved the space of redo log. A bigger size of the 16M of FragmentLogSize allows a bigger performance when there is much writting. In this case it is very recommended to increase the value of this parameter. InitFragmentLogFiles: this parameter can have two values: SPARSE or FULL • SPARSE: this is the default value. The log fragments are created in a separated way. • FULL: forces to that all the bytes of the log fragments are written in disk. MaxNoOfOpenfiles: This parameter limits the number of threads for the file opening. Any situation that requires to change this parameter could be reported as a bug. 212
Installation and Configuration
InitialNoOfOpenFiles: Initial number of threads for the file opening. MaxNoOfSavedMessages: Maximum number of trace files that are kept before to start overwriting the old ones. MaxNoOfAttributes: Defines the maximum number of features that could be defined in the cluster. Each feature takes up about 200 bytes of storage for each node due to that all the metadata are replied in the servers. MaxNoOfTables: Defines the total maximum of objects (table, unique hash index and ordered index) in the cluster. MaxNoOfOrderedIndexes: For each ordered index in this cluster, an object is reserved that describes what is indexed and its storage segments. By default, each defined index defined an ordered index too. Each unique index and primary key has an ordered index and a hash index. MaxNoOfTriggers: Defines the maximum number of triggers in the cluster. LockPagesOnMainMemory: Lock the data node processes in the memory avoiding that they become swap. The possible values of the parameter are: • 0: Disables the lockout (default value). • 1: does the lockout after reserving the process memory. • 2: does the lockout before reserving the process memory. StopOnError: Shows if the data node processes ends after an error or if they are restarted automatically. Diskless: Force to all the cluster to work without disk, in memory. This way the online backups are deactivated and it is not possible to start the cluster partially. ODirect: Activating this parameter we use O_DIRECT writing in local checkpoints and redo logs, reducing the CPU load. It is recommended to activate it for systems on a Linux with a kernel 2.6 or higher. CompressedBackup: When it is activated (1), it does a compression similar to gzip fast saving up to 50% space in the backup files. CompressedLCP: when it is activated (1), it does a compression similar to gzip fast saving up to 50% space in the Checkpoint files. TimeBetweenWatchDogCheck: Number of miliseconds of the WatchDog checking interval (thread that checks that the main thread is not lockout) if after 3 checks the main thread is in the same state in the watchdog will end the main thread. TimeBeweenWatchDogCheckInitial:Has the same function that TimeBetweenWachdogCheck, but this value is applied in the initial phase of the cluster start, when the memory reserve is done. StartPartialTimeout: Shows how long you have to wait from the cluster launching process is started until all the data node will be up. This parameter is ignored if it is a cluster starting. Its function is that the cluster would not be half launched. StartPartitionedTimeout: If the cluster is ready to start without waiting Start PartialTimeout,but it is in a partitioned state, the cluster also wait to this timeout pass. This parameter is ignored if it is a cluster starting. StartFailureTimeout: If a node has not finished its starting time and when this timeout ends the start fails, a 0 value shows that is indefinitely waited.If the node has much information (several data gigabytes), the this parameters should be increased ( the start with big amount of data could take 10 or 15 minutes). HeartbeatIntervalDbDb: Shows how often are sent the pulse signals and how often we can expect to receive pulse signals. If we do not receive pulse signals from a node for 3 consecutive intervales, the node will be considered as down, so the maximum time for discovering a fail through the pulse 213
Installation and Configuration
sending process 4 times the value of this parameter. This parameter should not be changed very often and it should have the same value for all modes. HeartbeatIntervalDbApi:Each node sends pulse signals to each MySQL or API node in order to make sure that the contact is kept. If a MySQL node can not send the pulse in time (following the criteria of the 3 pulses explained in HeartbeatIntervalDbDb), the it will be considered as down and all current transactions are finished and the resources will be released. A node can not reconnect until the resources of the previous instance would be released. TimeBetweenLocalCheckpoints: is useful to avoid that in a cluster with low load will be done local checkpoints (if there is much load usually we start a new one inmediately after ending with the previous one). It is a value given as a logarithm in base 2 with the size to store in any checkpoint. TimeBetweenGlobalCheckpoints: Shows how often the transactions are dumped into disk. TimeBetweenEpochs: Shows the interval of the replication times of the cluster.Defines a timeout for the synchronization times of the cluster reply, if a module is not able to participate in a global checkpoint in the period fixed for this parameter, the node will be switched off. TransactionDeadlockDetectionTimeout: Shows how long the transaction coordinator will wait for another mode will complete a query before aborting the transaction. This parameter is important for the deadlocks management and the nodes fail. DiskSyncSize: Maximum size stored before dumping data to a local checkpoint file. DiskCheckpointSpeed: transfer velocity in bytes by second of data sent to disk during a local checkpoint. DiskCheckpointSpeedInRestart: transfer velocity in bytes by second of data sent to disk during a local checkpoint that is part of a Restart operation. ArbitrationTimeout: times that a node waits for an arbitrator message. If this time is out, then it will be assumed that the network is divided. UndoIndexBuffer: is used during the local checkpoints to registry the activities during the local checkpoints writting. It is not safe to reduce the value of this parameter
UndoDataBuffer: has the same function that the previous one, except that in this case it refers to the data memory instead of that of the index. It is not safe to reduce the value of this parameter
RedoBuffer: registry the update activities in order they could be executed again in case of the system restart and leave the cluster in a consistent state. log levels comes from 0(nothing is reported to the log) to 15 (all related activity is reported to the log). 214
Installation and Configuration
LogLevelStartup: log level of activity during the starting process. LogLevelShutdown: log level of activity during the stopping process. LogLevelStatistic:log level of statistic events activity (reading of primary keys, updates, insertions, etc...) LogLevelCheckpoint: log level of activity during local and global checkpoints. LogLevelNodeRestart: log level of activity during the restart of a Node. LogLevelConnection: log level of activity of events generated through connections between nodes. LogLevelError: log level of warning and error activity. LogLevelCongestion: Log level of cluster congestion activity. LogLevelInfo: Log level of the cluster general information activity. MemReportFrequency:Number of seconds between registers of memory use of the data nodes. The data and index memory is recorded either in percentage as in 32KB pages number. StartupStatusReportFrequency: Shows the reports when the redologs are started because a data node has been fired. The redologs start process could be large if the size of these are big, and this parameter allow to register the evolution of this start. BackupReportFrequency: Shows the frecuency with witch the backup evolution is registered in the log during the process of creating a security copy. BackupDataBufferSize: During the Backup process there are two buffers that are used to send data to the disk, when the buffer is full to the BackupWriteSize size and the Backup process could continue filling this buffer while it has space. The size of this parameter should be at least that of the BackupWriteSize + 188 KB BackupLogBufferSize: Register the writing in tables during the Backup process. If it has no space in the backup log buffer, then the backup will fail. The size of this parameter should be at least the one of BackupWriteSize + 16 KB. BackupMemory: Simply the sum of BackupDataBufferSize and BackupLogBufferSize. BackupWriteSize: Tamaño por defecto de los mensajes almacenados en disco por el backup log buffer y el backup data buffer. BackupMaxWriteSize:Size by default of the messages stored in the disk by the backup log buffer and the backup data buffer. The size of this parameter should be at least the one of BackupWriteSize. BackupDataDir: Directory where the security copies are kept, in this directory is created a subdirectory called BACKUPS an in it one for each security copy that is called BACKUPX (where X is the number of the security copy). LockExecuteThreadToCPU:String with the CPUs identifiers in which the data node threads (ndbmtd) will be executed. It should be as many identifiers as the MaxNoOfExecutionThreads parameters say. RealTimeScheduler: Fix this parameter to 1 activates the real time scheduler of the threads. SchedulerExecutionTimer: Time in microseconds of thread execution in the scheduler before they be sent. SchedulerSpinTimer: Time of execution in microseconds of the threads before sleeping. MaxNoOfExecutionThreads: Number of execution threads (for 8 or more cores it is recommended to fix this parameter with an 8 value). 215
Installation and Configuration
18.2.2.4. Individual Configuration Parameters for each Data node It should be a section [ndbd] for each data node. id: node identifier, it should be unique in all the configuration file. Hostname: host name or IP address of the data node. 18.2.2.5. Common Parameters to API or SQL ArbitrationRank: this parameter is useful to define which node works as arbitrator(the management nodes and the SQL nodes could work as arbitrators, it is recommended that the management nodes would have high priority(), you can take values from 0 to 2: • 0:The node will never be used as arbitrator. • 1: the node has high priority.It will have priority on nodes of low priority. • 2: the node has low priority, and will be only used as arbitrator if there are no other priority nodes. In case of API or SQL nodes, it is recommended to fix the ArbitrationRank value to 2, allowing that it would be the manager nodes (that should have ArbitrationRank to 1) which have the rule of arbitrator BatchByteSize: limits the process blocks by batchs that are used when we do complete scans of the tables or scans by ranks on indexes. BatchSize: limits the process blocks by batchs that are used when we do complete scans of the tables or scans by ranks on indexes. MaxScanBatchSize: total limit for all the cluster of the size of process blocks by batchs that are used when we do complete scans of the tables or scans by ranks on index. This parameter avoid that too many data would be sent from many nodes in parallel. Total limit for all the cluster of the size of process blocks by batchs that are used when complete scans of tables are done or scans by ranks on indexes. This parameter avoids that too many data will be sent from many nodes in parallel. 18.2.2.6. Individual Configuration Parameters for each API or SQL node It should be a section [mysqld] for each API or SQL node, there should be also extra sections [mysqld] to allow check or backup connections. For it, it is recommended to define these extra connections giving them a node identifier, but not a hostname, so any host could connect through the extra connections. id: node identifier.It should be unique in all the configuration file. Hostname: host name or Ip adress of the data node. In our example documentation an architecture, we have done that the API/SQL nodes
and the NDB data node would be phisically in the same system. This has not to be like
this
216
Starting the Cluster 18.3. Starting the Cluster 18.3.1. Starting the Manager We have configured the servers for the automatic stop/launch of the cluster management
demons.The procedures that we detail here are to do the manual stops and starts and to
know the functioning of them. We have developed an script for the stop and start and we
have scheduled the default start level of the systems (level 3)
Once we have done the installing and configuring procedures of the Manager system, we should start the service. To start the administration node, we should execute the following command of the console: (as root) Administration node 1: ndb_mgmd --config-file=/var/lib/mysql-cluster/config.ini
--configdir=/var/lib/mysql-cluster
In the same way, through the script that has been developped for this at: /etc/init.d/cluster_mgmt start
Administration node 2: ndb_mgmd -c 10.1.1.221:1186 –-ndb-nodeid=2
In the same way, through the script that has been developed for this at: /etc/init.d/cluster_mgmt start
If you want also load a new version of the configuration file, you should pass to both nodes start the –initial parameter. The control script of the service (etc/init/cluster_mgmt) could be used to start the node (start) and to stop it (stop) or restart it (restart) and also to know its status (status). 18.3.2. Start of the Cluster Data Nodes (ONLY INSTALATION!) Once that the Manager has been launched, we start to launch the nodes with the following command in the console (as root): ndbmtd -–initial
This fix the initial configuration of the nodes (that obtain from the manager) and keep the redo log space. "Normal" start of the cluster data nodes. In case of the restart of one of the nodes, due to fall or to some kind of technical stop, the nodes will be started using only ndbmtd, sin el initial, so this parameter does that the configuration loads from zero and it restart the node data files and the redo logs (making necessary to restore data from 217
Starting the Cluster a Backup). ndbmtd
You could use the script developed for the control of the demon of the cluster storage node: /etc/init.d/cluster_node start
This script could be used to start the node (start) and to stop it (stop) or to restart it (restart), and also to know its status (status). Due to the importance of the starting process of the cluster data nodes, this process
WILL BE NOT AUTOMATED.This is, you have to do it manually after a restart
the starting process of nodes is very delicate (if you have done a messy stop, or if the cluster has been left in a non synchronized status, then you should check the logs and the manufacturer documentation (MySQL) to know how solving the problem before firing the nodes. The start process of a data node could be an SLOW process. It could take between 10 and 20 minutes.To check the status, in the starting proccess, use the "SHOW" command in the MySQL cluster manager console, such as we are going to show later. 18.3.3. Starting SQL Nodes
The SQL Nodes are started using the command: /etc/init.d/mysql start
And they are stopped with /etc/init.d/mysql stop
As if it were a normal Mysql server.This does that all the threads defined in the /etc/my.cnf would be connectoed to the cluster, finishing this way the complete start of the cluster. 18.3.4. Visualizing the Cluster Status Once we have all the elements started, es can see if they have been correctly connected to the cluster. For it, in the Manager console we should writte: ndb_mgm And we enter in the cluster administration interface, once in it, we write: show And we will obtain something like this: Connected to Management Server at: 10.1.1.221:1186
Cluster Configuration
218
Starting the Cluster --------------------[ndbd(NDB)]
2 node(s)
id=3
@10.1.1.215 (mysql-5.1.34 ndb-7.0.6, Nodegroup: 0, Master)
id=4
@10.1.1.216 (mysql-5.1.34 ndb-7.0.6, Nodegroup: 0)
[ndb_mgmd(MGM)] 2 node(s)
id=1
@10.1.1.221 (mysql-5.1.34 ndb-7.0.6)
id=2
@10.1.1.216 (mysql-5.1.34 ndb-7.0.6)
[mysqld(API)]
29 node(s)
id=11
@10.1.1.215 (mysql-5.1.34
id=12
@10.1.1.216 (mysql-5.1.34
id=13
@10.1.1.216 (mysql-5.1.34
id=14
@10.1.1.216 (mysql-5.1.34
id=15
@10.1.1.216 (mysql-5.1.34
id=16
@10.1.1.216 (mysql-5.1.34
.
ndb-7.0.6)
ndb-7.0.6)
ndb-7.0.6)
ndb-7.0.6)
ndb-7.0.6)
ndb-7.0.6)
As we can see in this exit, we have the management nodes, the Data nodes and the SQL or API nodes connected to the cluster. There are also a serial of SQL or API nodes that are free, without connections, that accept connections from any host, and that are used to status checks, backup creation, etc... If we have just started the data nodes, we could see a message as the following: [ndbd(NDB)] 2 node(s) id=3 @10.1.1.215 (mysql5.1.34 ndb7.0.6, starting, Nodegroup: 0, Master) id=4 @10.1.1.216 (mysql5.1.34 ndb7.0.6, starting, Nodegroup: 0) This shows that the system is still starting the data nodes. 18.3.5. Start and Stop of Nodes from the Manager It is possible to start and stop the nodes in the cluster from the Manager, this is, without having to go to the console of each node. To stop a node, we will use the order: <id> stop Being the <id> the number that is shown when you do a show. 2 stop To start the node that we have stopped, we use the order: <id> start Being the <id> the number that is shown when we do a show.Example: 2 start 18.4. Cluster Backups It is recommended to do a security copy of the cluster data and structures. For it, you have to follow these instructions: 1. .Start the administration server (ndb_mgm). 2. .Execute the START BACKUP command. 3. .We will get an exit like this: 219
Cluster Backups ndb_mgm> START BACKUP
Waiting for completed, this may take several minutes
Node 2: Backup 6 started from node 1
Node 2: Backup 6 started from node 1 completed
StartGCP: 267411 StopGCP: 267414
#Records: 2050 #LogRecords: 0
Data: 32880 bytes Log: 0 bytes
It is possible to start the shell security copy of the system using: ndb_mgm -e "START BACKUP"
These backups will create a serial of files in the directory: /var/lib/mysqlcluster/BACKUP/BACKUP
X of each node of the cluster, where the x is the backup number. In this directory are kept a serial of files with the following extensions: • Data: cluster data • .ctl: cluster metadata • .log: cluster LOG files. 18.4.1. Restoring Security Copies Each node keeps "one part" of the DDBB in the backups, so to recompose the "complete balance" yo should do a restore of all the elements of the cluster, in order and one by one. 18.4.1.1. Previous Steps To restore a backup, you have previously to "restart" the nodes and eliminate their content. This is, to start them with the –initial parameter. ndbmtd –initial
18.4.1.2. Order of the Restoring Process To restore a backup, you have to do it first with the node selected as "master". The first restoring will create the metadata, the rest only the data. 18.4.2. Restoring Process The order to restore a backup is this (we take as example the restore of the backup #5 on the node id #3): In the first node, we execute this in the Linux console: ndb_restore -b 5 -n 3 -m -r /var/lib/mysql-cluster/BACKUP/BACKUP-5
And we get the following exit: Backup Id = 5
Nodeid = 3
220
Cluster Backups backup path = /var/lib/mysql-cluster/BACKUP/BACKUP-5
Ndb version in backup files: Version 5.0.51
In the second and consecutive nodes, it will be similar, but without the “m” parameter. ndb_restore -b 5 -n 4 -r /var/lib/mysql-cluster/BACKUP/BACKUP-5
The options that will be given to it are detailed next: •
•
•
•
b: Shows the backup number. n: shows the specific node (that could be seen in the manager with a "show"). m: shows that the cluster meta data should be restored. r: shows that data should be restored in the cluster. After this, you should put the path to the directory ( put the path in the backup we have put in the b) 18.5. Cluster Logs
The MySQL cluster provides two kinds of logs. 18.5.1. The Cluster log Includes the events generated by each node of the cluster. It is the most recommended log to see if something fails, so it includes the information of the whole cluster. By default this log is at the directory /var/lib/mysqlcluster/ndb_1_cluster.log An example of this kind of logs is this: 2009-05-26 11:56:59 [MgmSrvr] INFO
-- Node 5: mysqld --server-id=0
2009-05-26 12:14:32 [MgmSrvr] INFO
-- Mgmt server state: nodeid 6 reserved for
ip 10.1.1.220, m_reserved_nodes 0000000000000062.
2009-05-26 12:14:32 [MgmSrvr] INFO
-- Node 6: mysqld --server-id=0
2009-05-26 13:35:47 [MgmSrvr] INFO
-- Mgmt server state: nodeid 6 freed,
m_reserved_nodes 0000000000000022.
2009-05-26 13:46:44 [MgmSrvr] INFO
-- Mgmt server state: nodeid 6 reserved for
ip 10.1.1.220, m_reserved_nodes 0000000000000062.
2009-05-26 13:46:44 [MgmSrvr] INFO
-- Node 6: mysqld --server-id=0
2009-05-26 13:46:44 [MgmSrvr] INFO
-- Node 2: Node 6 Connected
2009-05-26 13:46:45 [MgmSrvr] INFO
-- Node 3: Node 6 Connected
2009-05-26 13:46:45 [MgmSrvr] INFO
-- Node 3: Node 6: API version 5.0.51
2009-05-26 13:46:45 [MgmSrvr] INFO
-- Node 2: Node 6: API version 5.0.51
The useful information is identified with the words WARNING, ERROR y CRITICAL. 18.5.2. Logs of the Nodes Each node of the cluster has its own logs, that are divided in two sublogs. (all logs are at the directory/var/lib/mysqlcluster/). 18.5.2.1. ndb_X_out.log The first and most general log is: ndb_X_out.log (being X the node id).This log has the cluster 221
Cluster Logs
general information and it is like this: 2009-09-29 13:15:51 [ndbd] INFO
-- Angel pid: 30514 ndb pid: 30515
NDBMT: MaxNoOfExecutionThreads=8
NDBMT: workers=4 threads=4
2009-09-29 13:15:51 [ndbd] INFO
-- NDB Cluster -- DB node 3
2009-09-29 13:15:51 [ndbd] INFO
-- mysql-5.1.34 ndb-7.0.6 -2009-09-29 13:15:51 [ndbd] INFO
-- WatchDog timer is set to 40000 ms
2009-09-29 13:15:51 [ndbd] INFO
-- Ndbd_mem_manager::init(1) min: 4266Mb
initial: 4286Mb
Adding 4286Mb to ZONE_LO (1,137151)
NDBMT: num_threads=7
thr: 1 tid: 30520 cpu: 1 OK BACKUP(0) DBLQH(0) DBACC(0) DBTUP(0) SUMA(0) DBTUX(0)
TSMAN(0) LGMAN(0) PGMAN(0) RESTORE(0) DBINFO(0) PGMAN(5)
thr: 0 tid: 30519 cpu: 0 OK DBTC(0) DBDIH(0) DBDICT(0) NDBCNTR(0) QMGR(0) NDBFS(0)
TRIX(0) DBUTIL(0)
thr: 2 tid: 30521 cpu: 2 OK PGMAN(1) DBACC(1) DBLQH(1) DBTUP(1) BACKUP(1) DBTUX(1)
RESTORE(1)
thr: 3 tid: 30522 cpu: 3 OK PGMAN(2) DBACC(2) DBLQH(2) DBTUP(2) BACKUP(2) DBTUX(2)
RESTORE(2)
thr: 4 tid: 30523 cpu: 4 OK PGMAN(3) DBACC(3) DBLQH(3) DBTUP(3) BACKUP(3) DBTUX(3)
RESTORE(3)
thr: 6 tid: 30515 cpu: 6 OK CMVMI(0)
thr: 5 tid: 30524 cpu: 5 OK PGMAN(4) DBACC(4) DBLQH(4) DBTUP(4) BACKUP(4) DBTUX(4)
RESTORE(4)
saving 0x7f6161d38000 at 0x994538 (0)
2009-09-29 13:15:53 [ndbd] INFO
-- Start initiated (mysql-5.1.34 ndb-7.0.6)
saving 0x7f61621e8000 at 0x9ab2d8 (0)
NDBFS/AsyncFile: Allocating 310392 for In/Deflate buffer
18.5.2.2. ndb_X_error.log The second kind of log is the cluster error log that is named: ndb_X_error.log (being X the node id). In this log we have the errors that are made in the cluster and that link us to another log created at a higher leve of debug. Here we see the exit of a error log file linked to another trace log: Current byte-offset of file-pointer is: 1067
Time: Friday 9 October 2009 - 12:57:13
Status: Temporary error, restart node
Message: Node lost connection to other nodes and can not form a unpartitioned
cluster, please investigate if there are error(s) on other node(s) (Arbitration
error)
Error: 2305
Error data: Arbitrator decided to shutdown this node
Error object: QMGR (Line: 5300) 0x0000000e
Program: ndbmtd
Pid: 30515
Trace: /var/lib/mysql-cluster/ndb_3_trace.log.1 /var/lib/mysqlcluster/ndb_3_trace.log.1_t1 /var/lib/mysql-cluster/ndb_3_
Time: Tuesday 24 November 2009 - 12:01:59
Status: Temporary error, restart node
Message: Node lost connection to other nodes and can not form a unpartitioned
cluster, please investigate if there are error(s) on other node(s) (Arbitration
error)
Error: 2305
Error data: Arbitrator decided to shutdown this node
Error object: QMGR (Line: 5300) 0x0000000a
Program: /usr/sbin/ndbmtd
222
Cluster Logs
Pid: 10348
Trace: /var/lib/mysql-cluster/ndb_3_trace.log.2 /var/lib/mysqlcluster/ndb_3_trace.log.2_t1 /var/lib/mysql-c
As we can see it leaves a trace in the following files: /var/lib/mysqlcluster/ndb_3_trace.log.2, /var/lib/mysqlcluster/ndb_3_trace.log.2_t1, ... We can see a piece of one of these files and see how it is: --------------- Signal ---------------r.bn: 252 "QMGR", r.proc: 3, r.sigId: -411879481 gsn: 164 "CONTINUEB" prio: 0
s.bn: 252 "QMGR", s.proc: 3, s.sigId: -411879485 length: 3 trace: 0 #sec: 0 fragInf:
0
H'00000005 H'00000002 H'00000007
--------------- Signal ---------------r.bn: 253 "NDBFS", r.proc: 3, r.sigId: -411879482 gsn: 164 "CONTINUEB" prio: 0
s.bn: 253 "NDBFS", s.proc: 3, s.sigId: -411879492 length: 1 trace: 0 #sec: 0
fragInf: 0
Scanning the memory channel every 10ms
It is easy to monitor these logs with Pandora itself doing searches of the words WARNING y CRITICAL. 18.6. General Procedures
The management individual procedures of each kind module are given in the first place, and later the start and stop procedure for the cluster. 18.6.1. Cluster Manager Process Management As root: To start the cluster manager: /etc/init.d/cluster_mgmt start
To check that it is running: /etc/init.d/cluster_mgmt status
To stop the Manager process: /etc/init.d/cluster_mgmt stop
18.6.2. Nodes Management from the Manager We enter in the shell of the cluster Manager with: ndb_mgm
223
General Procedures
We stop the node that we want with: 2 stop
Being the "2" the ID of the node to stop. To start a node we will use the order: 2 start
18.6.3. Data Node Management with the start scripts As root: To start a data node /etc/init.d/cluster_node start to stop a data node: /etc/init.d/cluster_node stop To start a data node: This operation delete the node data of the cluster and restart the redologs and could
require a recovery from the backup
/etc/init.d/ndbmtd initial 18.6.4. SQL Nodes Management with Starting Scripts
The SQL nodes are managed in the same way that a MySQL server that is not in cluster, through the starting script /etc/init.d/mysql To start as many SQL nodes as the /etc/my.cnf file indicates. /etc/init.d/mysql start
To stop as many SQL nodes as the /etc/my.cnf indicates. /etc/init.d/mysql stop
Launching of a node manually if it is down. If a node downs we should start it manually from the command line following this sequence: First we need to be sure that there is no instance of the Node running: ps -fea | grep -v grep | grep ndbmtd
Or also: 224
General Procedures
/etc/init.d/cluster_node status
If the command shows any ndbmtd process running, we should check the losgs to see why even with the process running it has been considered as down. To start the node we use: /etc/init.d/cluster_node start
18.6.5. Creating Backups from the Command Line This is the method for creating a backup manually from the command line: ndb_mgm -e "START BACKUP”
The backups are kept in: /var/lib/mysql-cluster/BACKUP
The script of the daily backup is in the Annex 1. 18.6.6. Restoring Backups from the Command Line Once in the Node of which we want to restore the backup: ndb_restore -b X -n Y -m -r /var/lib/mysql-cluster/BACKUP/BACKUP-X
The “X” should be replaced by the number of the backup that you want to change and the "Y" by the number of the Node in which we are. 18.6.7. Procedure of Total Stop of the Cluster Before stopping the cluster, you should do a backup of it, following the procedure previously defined or using the backup script described in the Annex 1. Once we have finish the backup, it is also recommended to stop the Pandora FMS servers before stopping the cluster. With all the necessary preparations done, the cluster will be stopped from the manager with the order SHUTDOWN.From the console: ndb_mgm
ndbm_mgm> SHUTDOWN
Or also from the command line: 225
General Procedures
ndb_mgm -e SHUTDOWN
This will stop the management nodes and the cluster data ones, and the SQL (ore API) nodes stop separately, as we have said before. 18.6.8. Procedure to Start the Cluster The start of the complete cluster is an operation that should be checked and while it is being done you should check the cluster main log and check that all has worked right. When all the nodes are stopped, we should start first the main manager (the one of pandoradbhis), showing it the cluster configuration file. Using the starting script. /etc/init.d/cluster_mgmt start
Or also from the command line. /usr/sbin/ndb_mgmd –config-file=/var/lib/mysql-cluster/config.ini
--configdir=/var/lib/mysql-cluster
Next we start the secondary manager of the cluster ( the one of pandora2) giving the connection string and its node id the main manager. Using the starting script. /etc/init.d/cluster_mgmt start
Or also from the command line /usr/sbin/ndb_mgmd -c pandoradbhis –-ndb-nodeid=2 –configdir=/var/lib/mysql-cluster
At this point it is possible to connect to any of the two managers and show the status with a SHOW, but it is important to show that at this moment of the process the starting, the manager nodes do not see each other so they communicate through the data nodes and because of this any of them will show a different exit in which the only connected node of the cluster is the manager node itself. Once the 2 manager nodes have been started, we can start launching the 2 data nodes (both in pandoradb1 and in pandoradb2) as it has been shown before, for example with the starting script: /etc/init.d/cluster_node start
The process for starting the data nodes is slow and has several stages that could be followed in the cluster log. While doing this you should start the SQL and API nodes (both in pandoradb1 as inpandoradb2)as we have said before. 226
General Procedures
/etc/init.d/mysql start
Once all the starting orders have been given, you should check in the cluster log that the starting is completed without any error. At the end you could see that all the servers are connected form the manager with the SHOW command. ndb_mgm -e SHOW
And seeing that all the started nodes are connected. 18.7. Appendix. Examples of Configuration Files 18.7.1. /etc/mysql/ndb_mgmd.cnf File of the Cluster Manager. The secondary manager gets the configuration from the primary one (that should be active when the secondary is started),but this file should be in both nodes. #
#
#
#
#
#
#
#
MySQL Cluster Configuration file
By Pablo de la Concepcion Sanz <[email protected]>
This file must be present on ALL the management nodes
in the directory /var/lib/mysql-cluster/
For some of the parameters there is an explanation of the
possible values that the parameter can take following this
format:
ParameterName (MinValue, MaxValue) [DefaultValue]
##########################################################
# MANAGEMENT NODES
#
# This nodes are the ones running the management console #
##########################################################
# More info at:
# http://dev.mysql.com/doc/refman/5.1/en/mysql-cluster-ndbd-definition.html
# Common configuration for all management nodes:
[ndb_mgmd default]
# This parameter is used to define which nodes can act as arbitrators.
# Only management nodes and SQL nodes can be arbitrators.
# ArbitrationRank can take one of the following values:
#
* 0: The node will never be used as an arbitrator.
#
* 1: The node has high priority; that is, it will be preferred
#
as an arbitrator over low-priority nodes.
#
* 2: Indicates a low-priority node which be used as an arbitrator
#
only if a node with a higher priority is not available
#
for that purpose.
#
# Normally, the management server should be configured as an
# arbitrator by setting its ArbitrationRank to 1 (the default for
# management nodes) and those for all SQL nodes to 0 (the default
# for SQL nodes).
ArbitrationRank=1
# Directory for management node log files
datadir=/var/lib/mysql-cluster
# Using 2 management servers helps guarantee that there is always an
# arbitrator in the event of network partitioning, and so is
# recommended for high availability. Each management server must be
227
Appendix. Examples of Configuration Files #
#
#
#
#
identified by a HostName. You may for the sake of convenience specify
a node ID for any management server, although one will be allocated
for it automatically; if you do so, it must be in the range 1-255
inclusive and must be unique among all IDs specified for cluster
nodes.
[ndb_mgmd]
id=1
# Hostname or IP address of management node
hostname=10.1.1.230
[ndb_mgmd]
id=2
# Hostname or IP address of management node
hostname=10.1.1.220
#################
# STORAGE NODES #
#################
# More info at:
# http://dev.mysql.com/doc/refman/5.1/en/mysql-cluster-ndbd-definition.html
# Options affecting ndbd processes on all data nodes:
[ndbd default]
#
#
#
#
#
#
#
Redundancy (number of replicas):
Using 2 replicas is recommended to guarantee availability of data;
using only 1 replica does not provide any redundancy, which means
that the failure of a single data node causes the entire cluster to
shut down. We do not recommend using more than 2 replicas, since 2 is
sufficient to provide high availability, and we do not currently test
with greater values for this parameter.
NoOfReplicas=2
# Directory for storage node trace files, log files, pid files and error logs.
datadir=/var/lib/mysql-cluster
### Data Memory, Index Memory, and String Memory ###
# This parameter defines the amount of space (in bytes) available for storing
# database records. The entire amount specified by this value is allocated in
# memory, so it is extremely important that the machine has sufficient
# physical memory to accommodate it.
# DataMemory (memory for records and ordered indexes) (recomended 70% of RAM)
# DataMemory antes 22938MB (recomended 70% of RAM)
DataMemory=4096MB
# IndexMemory (memory for Primary key hash index and unique hash index)
# Usually between 1/6 or 1/8 of the DataMemory is enough, but depends on the
# number of unique hash indexes (UNIQUE in table def)
# Also can be calculated as 15% of RAM
# IndexMemory antes 4915MB
IndexMemory= 512MB
# This parameter determines how much memory is allocated for strings
# such as table names
# * A value between 0 and 100 inclusive is interpreted as a percent of the
#
maximum default value (wich depends on a number of factors)
# * A value greater than 100 is interpreted as a number of bytes.
StringMemory=25
228
Appendix. Examples of Configuration Files ### Transaction Parameters ###
# MaxNoOfConcurrentTransactions (32,4G) [4096]
# Sets the number of parallel transactions possible in a node
#
# This parameter must be set to the same value for all cluster data nodes.
# This is due to the fact that, when a data node fails, the oldest surviving
# node re-creates the transaction state of all transactions that were ongoing
# in the failed node.
#
# Changing the value of MaxNoOfConcurrentTransactions requires a complete
# shutdown and restart of the cluster.
# MaxNoOfConcurrentTransactions antes 4096
MaxNoOfConcurrentTransactions=8192
# MaxNoOfConcurrentOperations (32,4G) [32k]
# Sets the number of records that can be in update phase or locked
# simultaneously.
MaxNoOfConcurrentOperations=10000000
# MaxNoOfLocalOperations (32,4G)
# Recomentded to set (110% of MaxNoOfConcurrentOperations)
MaxNoOfLocalOperations=11000000
### Transaction Temporary Storage ###
# MaxNoOfConcurrentIndexOperations (0,4G) [8k]
# For queries using a unique hash index, another temporary set of operation
# records is used during a query's execution phase. This parameter sets the
# size of that pool of records. Thus, this record is allocated only while
# executing a part of a query. As soon as this part has been executed, the
# record is released. The state needed to handle aborts and commits is handled
# by the normal operation records, where the pool size is set by the parameter
# MaxNoOfConcurrentOperations.
#
# The default value of this parameter is 8192. Only in rare cases of extremely
# high parallelism using unique hash indexes should it be necessary to increase
# this value. Using a smaller value is possible and can save memory if the DBA
# is certain that a high degree of parallelism is not required for the cluster.
MaxNoOfConcurrentIndexOperations=8192
# MaxNoOfFiredTriggers (0,4G) [4000]
# The default value is sufficient for most situations. In some cases it can
# even be decreased if the DBA feels certain the need for parallelism in the
# cluster is not high.
MaxNoOfFiredTriggers=4000
# TransactionBufferMemory (1k,4G) [1M]
# The memory affected by this parameter is used for tracking operations
# when updating index tables and reading unique indexes. This memory is
# store the key and column information for these operations. It is only
# rarely that the value for this parameter needs to be altered from the
TransactionBufferMemory=1M
fired
used to
very
default.
### Scans and Buffering ###
# MaxNoOfConcurrentScans (2,500) [256]
# This parameter is used to control the number of parallel scans that can be
# performed in the cluster. Each transaction coordinator can handle the number
# of parallel scans defined for this parameter. Each scan query is performed
# by scanning all partitions in parallel. Each partition scan uses a scan
# record in the node where the partition is located, the number of records
# being the value of this parameter times the number of nodes. The cluster
# should be able to sustain MaxNoOfConcurrentScans scans concurrently from all
# nodes in the cluster.
MaxNoOfConcurrentScans=400
229
Appendix. Examples of Configuration Files # MaxNoOfLocalScans (32,4G)
# Specifies the number of local scan records if many scans are not fully
# parallelized. If the number of local scan records is not provided, it is
# calculated as the product of MaxNoOfConcurrentScans and the number of data
# nodes in the system. The minimum value is 32.
# MaxNoOfLocalScans antes 32
MaxNoOfLocalScans=6400
# BatchSizePerLocalScan (1,992) [64]
# This parameter is used to calculate the number of lock records used to
# handle concurrent scan operations.
#
# The default value is 64; this value has a strong connection to the
# ScanBatchSize defined in the SQL nodes.
BatchSizePerLocalScan=512
# LongMessageBuffer (512k,4G) (4M)
# This is an internal buffer used for passing messages within individual nodes
# and between nodes. Although it is highly unlikely that this would need to be
# changed, it is configurable. In MySQL Cluster NDB 6.4.3 and earlier, the
# default is 1MB; beginning with MySQL Cluster NDB 7.0.4, it is 4MB.
# LongMessageBuffer antes 32M
LongMessageBuffer=4M
### Logging and Checkpointing ###
# Redolog
# Set NoOfFragmentLogFiles to 6xDataMemory [in MB]/(4 *FragmentLogFileSize [in MB]
# The "6xDataMemory" is a good heuristic and is STRONGLY recommended.
# NoOfFragmentLogFiles=135
NoOfFragmentLogFiles=300
# FragmentLogFileSize (3,4G) [16M]
# Size of each redo log fragment, 4 redo log fragment makes up on fragment log
# file. A bigger Fragment log file size thatn the default 16M works better with
# high write load and is strongly recommended!!
# FragmentLogFileSize=256M
FragmentLogFileSize=16M
#
#
#
#
#
#
#
By default, fragment log files are created sparsely when performing an
initial start of a data node â that is, depending on the operating system
and file system in use, not all bytes are necessarily written to disk.
Beginning with MySQL Cluster NDB 6.3.19, it is possible to override this
behavior and force all bytes to be written regardless of the platform
and file system type being used by mean of this parameter.
InitFragmentLogFiles takes one of two values:
#
* SPARSE. Fragment log files are created sparsely. This is the default value
#
* FULL. Force all bytes of the fragment log file to be written to disk.
# InitFragmentLogFiles (SPARSE,FULL) [SPARSE]
InitFragmentLogFiles=FULL
# This parameter sets a ceiling on how many internal threads to allocate for
# open files. Any situation requiring a change in this parameter should be
# reported as a bug.
MaxNoOfOpenFiles=80
# This parameter sets the initial number of internal threads to allocate for
# open files.
InitialNoOfOpenFiles=37
230
Appendix. Examples of Configuration Files # MaxNoOfSavedMessages [25]
# This parameter sets the maximum number of trace files that are kept before
# overwriting old ones. Trace files are generated when, for whatever reason,
# the node crashes.
MaxNoOfSavedMessages=25
### Metadata Objects ###
# MaxNoOfAttributes (32, 4294967039) [1000]
# Defines the number of attributes that can be defined in the cluster.
#MaxNoOfAttributes antes 25000
MaxNoOfAttributes=4096
# MaxNoOfTables (8, 4G) [128]
# A table object is allocated for each table and for each unique hash
# index in the cluster. This parameter sets the maximum number of table
# objects for the cluster as a whole.
MaxNoOfTables=8192
# MaxNoOfOrderedIndexes (0, 4G) [128]
# Sets the total number of hash indexes that can be in use in the system
# at any one time
#MaxNoOfOrderedIndexes antes 27000
MaxNoOfOrderedIndexes=2048
#MaxNoOfUniqueHashIndexes: Default value 64 Each Index 15 KB per node
#MaxNoOfUniqueHashIndexes antes 2500
MaxNoOfUniqueHashIndexes=1024
# MaxNoOfTriggers (0, 4G) [768]
# This parameter sets the maximum number of trigger objects in the cluster.
#MaxNoOfTriggers antes 770
MaxNoOfTriggers=4096
### Boolean Parameters ###
# Most of this parameters can be set to true (1 or Y) or false (0 or N)
# LockPagesInMainMemory (0,2) [0]
# On Linux and Solaris systems, setting this parameter locks data node
# processes into memory. Doing so prevents them from swapping to disk,
# which can severely degrade cluster performance.
# Possible values:
#
* 0: Disables locking. This is the default value.
#
* 1: Performs the lock after allocating memory for the process.
#
* 2: Performs the lock before memory for the process is allocated.
LockPagesInMainMemory=1
# This parameter specifies whether an ndbd process should exit or perform
# an automatic restart when an error condition is encountered.
StopOnError=1
# This feature causes the entire cluster to operate in diskless mode.
# When this feature is enabled, Cluster online backup is disabled. In
# addition, a partial start of the cluster is not possible.
Diskless=0
# Enabling this parameter causes NDBCLUSTER to try using O_DIRECT
# writes for local checkpoints and redo logs; this can reduce load on
# CPUs. We recommend doing so when using MySQL Cluster NDB 6.2.3 or
# newer on systems running Linux kernel 2.6 or later.
ODirect=1
# Setting this parameter to 1 causes backup files to be compressed. The
# compression used is equivalent to gzip --fast, and can save 50% or more
# of the space required on the data node to store uncompressed backup files
CompressedBackup=1
# Setting this parameter to 1 causes local checkpoint files to be compressed.
# The compression used is equivalent to gzip --fast, and can save 50% or
# more of the space required on the data node to store uncompressed
231
Appendix. Examples of Configuration Files # checkpoint files
CompressedLCP=1
### Controlling Timeouts, Intervals, and Disk Paging ###
#
#
#
#
#
Most of the timeout values are specified in milliseconds. Any exceptions
to this are mentioned where applicable.
TimeBetweenWatchDogCheck (70,4G) [6000]
To prevent the main thread from getting stuck in an endless loop at some
point, a âwatchdogâ
# the number of milliseconds between checks. If the process
remains in the
# same state after three checks, the watchdog thread terminates it.
TimeBetweenWatchDogCheck=40000
# TimeBetweenWatchDogCheckInitial (70,4G) [6000]
# This is similar to the TimeBetweenWatchDogCheck parameter, except that
# TimeBetweenWatchDogCheckInitial controls the amount of time that passes
# between execution checks inside a database node in the early start phases
# during which memory is allocated.
TimeBetweenWatchDogCheckInitial=60000
# StartPartialTimeout (0,4G) [30000]
# This parameter specifies how long the Cluster waits for all data nodes to
# come up before the cluster initialization routine is invoked. This timeout
# is used to avoid a partial Cluster startup whenever possible.
#
# This parameter is overridden when performing an initial start or initial
# restart of the cluster.
#
# The default value is 30000 milliseconds (30 seconds). 0 disables the timeout,
# in which case the cluster may start only if all nodes are available.
StartPartialTimeout=30000
# StartPartitionedTimeout (0, 4G) [60000]
# If the cluster is ready to start after waiting for StartPartialTimeout
# milliseconds but is still possibly in a partitioned state, the cluster waits
# until this timeout has also passed. If StartPartitionedTimeout is set to 0,
# the cluster waits indefinitely.
#
# This parameter is overridden when performing an initial start or initial
# restart of the cluster.
StartPartitionedTimeout=60000
# StartFailureTimeout (0, 4G) [0]
# If a data node has not completed its startup sequence within the time
# specified by this parameter, the node startup fails. Setting this
# parameter to 0 (the default value) means that no data node timeout
# is applied.
StartFailureTimeout=1000000
# HeartbeatIntervalDbDb (10,4G)[1500]
# One of the primary methods of discovering failed nodes is by the use of
# heartbeats. This parameter states how often heartbeat signals are sent
# and how often to expect to receive them. After missing three heartbeat
# intervals in a row, the node is declared dead. Thus, the maximum time
# for discovering a failure through the heartbeat mechanism is four times
# the heartbeat interval.
# This parameter must not be changed drastically
HeartbeatIntervalDbDb=2000
# HeartbeatIntervalDbApi (100,4G)[1500]
# Each data node sends heartbeat signals to each MySQL server (SQL node)
# to ensure that it remains in contact. If a MySQL server fails to send
# a heartbeat in time it is declared âdead,â
# transactions are completed and all
resources released. The SQL node
# cannot reconnect until all activities initiated by the previous MySQL
# instance have been completed. The three-heartbeat criteria for this
# determination are the same as described for HeartbeatIntervalDbDb.
HeartbeatIntervalDbApi=3000
# TimeBetweenLocalCheckpoints (0,31)[20] Base-2 Logarithm
232
Appendix. Examples of Configuration Files # This parameter is an exception in that it does not specify a time to
# wait before starting a new local checkpoint; rather, it is used to
# ensure that local checkpoints are not performed in a cluster where
# relatively few updates are taking place. In most clusters with high
# update rates, it is likely that a new local checkpoint is started
# immediately after the previous one has been completed.
#
# The size of all write operations executed since the start of the
# previous local checkpoints is added. This parameter is also exceptional
# in that it is specified as the base-2 logarithm of the number of 4-byte
# words, so that the default value 20 means 4MB (4 Ã 220) of write
# operations, 21 would mean 8MB, and so on up to a maximum value of 31,
# which equates to 8GB of write operations.
# All the write operations in the cluster are added together.
TimeBetweenLocalCheckpoints=20
# TimeBetweenGlobalCheckpoints (10,32000)[2000]
# When a transaction is committed, it is committed in main memory in all
# nodes on which the data is mirrored. However, transaction log records
# are not flushed to disk as part of the commit. The reasoning behind this
# behavior is that having the transaction safely committed on at least two
# autonomous host machines should meet reasonable standards for durability.
#
# It is also important to ensure that even the worst of cases â a complete
# crash of the cluster â is handled properly. To guarantee that this happens,
# all transactions taking place within a given interval are put into a global
# checkpoint, which can be thought of as a set of committed transactions that
# has been flushed to disk. In other words, as part of the commit process, a
# transaction is placed in a global checkpoint group. Later, this group's log
# records are flushed to disk, and then the entire group of transactions is
# safely committed to disk on all computers in the cluster.
TimeBetweenGlobalCheckpoints=2000
# TimeBetweenEpochs (0,32000)[100]
# This parameter defines the interval between synchronisation epochs for MySQL
# Cluster Replication.
TimeBetweenEpochs=100
# TransactionInactiveTimeout (0,32000)[4000]
# This parameter defines a timeout for synchronisation epochs for MySQL Cluster
# Replication. If a node fails to participate in a global checkpoint within
# the time determined by this parameter, the node is shut down.
TransactionInactiveTimeout=30000
# TransactionDeadlockDetectionTimeout (50,4G)[1200]
# When a node executes a query involving a transaction, the node waits for
# the other nodes in the cluster to respond before continuing. A failure to
# respond can occur for any of the following reasons:
#
* The node is âdeadâ
#
* The node requested to perform the action could be heavily overloaded.
# This timeout parameter states how long the transaction coordinator waits
# for query execution by another node before aborting the transaction, and
# is important for both node failure handling and deadlock detection.
TransactionDeadlockDetectionTimeout=1200
# DiskSyncSize (32k,4G)[4M]
# This is the maximum number of bytes to store before flushing data to a
# local checkpoint file. This is done in order to prevent write buffering,
# which can impede performance significantly. This parameter is NOT
# intended to take the place of TimeBetweenLocalCheckpoints.
DiskSyncSize=4M
# DiskCheckpointSpeed (1M,4G)[10M]
# The amount of data,in bytes per second, that is sent to disk during a
# local checkpoint.
DiskCheckpointSpeed=10M
# DiskCheckpointSpeedInRestart (1M,4G)[100M]
# The amount of data,in bytes per second, that is sent to disk during a
# local checkpoint as part of a restart operation.
DiskCheckpointSpeedInRestart=100M
233
Appendix. Examples of Configuration Files # ArbitrationTimeout (10,4G)[1000]
# This parameter specifies how long data nodes wait for a response from
# the arbitrator to an arbitration message. If this is exceeded, the
# network is assumed to have split.
ArbitrationTimeout=10
### Buffering and Logging ###
#
#
#
#
#
#
UndoIndexBuffer (1M,4G)[2M]
The UNDO index buffer, is used during local checkpoints. The NDB storage
engine uses a recovery scheme based on checkpoint consistency in
conjunction with an operational REDO log. To produce a consistent
checkpoint without blocking the entire system for writes, UNDO logging
is done while performing the local checkpoint.
# This buffer is 2MB by default. The minimum value is 1MB, which is
# sufficient for most applications. For applications doing extremely
# large or numerous inserts and deletes together with large
# transactions and large primary keys, it may be necessary to
# increase the size of this buffer. If this buffer is too small,
# the NDB storage engine issues internal error code 677 (Index UNDO
# buffers overloaded).
# IMPORTANT: It is not safe to decrease the value of this parameter
# during a rolling restart.
UndoIndexBuffer=2M
# UndoDataBuffer (1M,4G)[16M]
# This parameter sets the size of the UNDO data buffer, which performs
# a function similar to that of the UNDO index buffer, except the UNDO
# data buffer is used with regard to data memory rather than index memory
# If this buffer is too small and gets congested, the NDB storage
# engine issues internal error code 891 (Data UNDO buffers overloaded).
# IMPORTANT: It is not safe to decrease the value of this parameter
# during a rolling restart.
UndoDataBuffer=16M
# RedoBuffer (1M,4G)[32M]
# All update activities also need to be logged. The REDO log makes it
# possible to replay these updates whenever the system is restarted.
# The NDB recovery algorithm uses a âfuzzyâ
# together with the UNDO log, and then
applies the REDO log to play
# back all changes up to the restoration point.
# If this buffer is too small, the NDB storage engine issues error
# code 1221 (REDO log buffers overloaded).
# IMPORTANT: It is not safe to decrease the value of this parameter
# during a rolling restart.
RedoBuffer=32M
#
## Logging ##
#
# In managing the cluster, it is very important to be able to control
# the number of log messages sent for various event types to stdout.
# For each event category, there are 16 possible event levels (numbered
# 0 through 15). Setting event reporting for a given event category to
# level 15 means all event reports in that category are sent to stdout;
# setting it to 0 means that there will be no event reports made in
# that category.
# More info at:
# http://dev.mysql.com/doc/refman/5.1/en/mysql-cluster-log-events.html
#
# LogLevelStartup (0,15)[1]
# The reporting level for events generated during startup of the process.
LogLevelStartup=15
# LogLevelShutdown (0,15)[0]
234
Appendix. Examples of Configuration Files # The reporting level for events generated as part of graceful shutdown
# of a node.
LogLevelShutdown=15
# LogLevelStatistic (0,15)[0]
# The reporting level for statistical events such as number of primary
# key reads, number of updates, number of inserts, information relating
# to buffer usage, and so on.
LogLevelStatistic=15
# LogLevelCheckpoint (0,15)[0]
# The reporting level for events generated by local and global checkpoints.
LogLevelCheckpoint=8
# LogLevelNodeRestart (0,15)[0]
# The reporting level for events generated during node restart.
LogLevelNodeRestart=15
# LogLevelConnection (0,15)[0]
# The reporting level for events generated by connections between cluster
# nodes.
LogLevelConnection=0
# LogLevelError (0,15)[0]
# The reporting level for events generated by errors and warnings by the
# cluster as a whole. These errors do not cause any node failure but are
# still considered worth reporting.
LogLevelError=15
# LogLevelCongestion (0,15)[0]
# The reporting level for events generated by congestion. These errors do
# not cause node failure but are still considered worth reporting.
LogLevelCongestion=0
# LogLevelInfo (0,15)[0]
# The reporting level for events generated for information about the general
# state of the cluster.
LogLevelInfo=3
# MemReportFrequency (0,4G)[0]
# This parameter controls how often data node memory usage reports are recorded
# in the cluster log; it is an integer value representing the number of seconds
# between reports.
# Each data node's data memory and index memory usage is logged as both a
# percentage and a number of 32 KB pages of the DataMemory and IndexMemory.
# The minimum value in which case memory reports are logged only when memory
# usage reaches certain percentages (80%, 90%, and 100%)
MemReportFrequency=900
# When a data node is started with the --initial, it initializes the redo log
# file during Start Phase 4. When very large values are set for
# NoOfFragmentLogFiles, FragmentLogFileSize, or both, this initialization can
# take a long time. StartupStatusReportFrequency configuration parameter
# make reports on the progress of this process to be logged periodically.
StartupStatusReportFrequency=30
### Backup Parameters ###
#
#
#
#
#
#
#
#
#
#
#
This section define memory buffers set aside for execution of
online backups.
IMPORTANT: When specifying these parameters, the following relationships
must hold true. Otherwise, the data node will be unable to start:
* BackupDataBufferSize >= BackupWriteSize + 188KB
* BackupLogBufferSize >= BackupWriteSize + 16KB
* BackupMaxWriteSize >= BackupWriteSize
BackupReportFrequency (0,4G)[0]
This parameter controls how often backup status reports are issued in
the management client during a backup, as well as how often such reports
235
Appendix. Examples of Configuration Files # are written to the cluster log. BackupReportFrequency represents the time
# in seconds between backup status reports.
BackupReportFrequency=10
# BackupDataBufferSize (0,4G)[16M]
# In creating a backup, there are two buffers used for sending data to the
# disk. The backup data buffer is used to fill in data recorded by scanning
# a node's tables. Once this buffer has been filled to the level specified
# as BackupWriteSize (see below), the pages are sent to disk. While
# flushing data to disk, the backup process can continue filling this
# buffer until it runs out of space. When this happens, the backup process
# pauses the scan and waits until some disk writes have completed freed up
# memory so that scanning may continue.
BackupDataBufferSize=16M
#
#
#
#
#
#
#
#
#
#
#
#
#
BackupLogBufferSize (0,4G)[16M]
The backup log buffer fulfills a role similar to that played by the backup
data buffer, except that it is used for generating a log of all table
writes made during execution of the backup. The same principles apply for
writing these pages as with the backup data buffer, except that when
there is no more space in the backup log buffer, the backup fails.
The default value for this parameter should be sufficient for most
applications. In fact, it is more likely for a backup failure to be
caused by insufficient disk write speed than it is for the backup
log buffer to become full.
It is preferable to configure cluster nodes in such a manner that the
processor becomes the bottleneck rather than the disks or the network
connections.
BackupLogBufferSize=16M
# BackupMemory (0,4G)[32]
# This parameter is simply the sum of BackupDataBufferSize and
# BackupLogBufferSize.
BackupMemory=64M
# BackupWriteSize (2k,4G)[256k]
# This parameter specifies the default size of messages written to disk
# by the backup log and backup data buffers.
BackupWriteSize=256K
# BackupMaxWriteSize (2k,4G)[1M]
# This parameter specifies the maximum size of messages written to disk
# by the backup log and backup data buffers.
BackupMaxWriteSize=1M
# This parameter specifies the directory in which backups are placed
# (The backups are stored in a subdirectory called BACKUPS)
BackupDataDir=/var/lib/mysql-cluster/
### Realtime Performance Parameters ###
#
#
#
#
#
#
#
This parameters are used in scheduling and locking of threads to specific
CPUs on multiprocessor data node hosts.
NOTE: To make use of these parameters, the data node process must be run as
system root.
Setting these parameters allows you to take advantage of real-time scheduling
of NDBCLUSTER threads (introduced in MySQL Cluster NDB 6.3.4) to get higher
throughput.
#
#
#
#
#
On systems with multiple CPUs, these parameters can be used to lock
NDBCLUSTER
threads to specific CPUs
LockExecuteThreadToCPU (0,64k)
When used with ndbd, this parameter (now a string) specifies the ID of the
236
Appendix. Examples of Configuration Files # CPU assigned to handle the NDBCLUSTER execution thread. When used with
# ndbmtd, the value of this parameter is a comma-separated list of CPU IDs
# assigned to handle execution threads. Each CPU ID in the list should be
# an integer in the range 0 to 65535 (inclusive)
# The number of IDs specified should match the number of execution threads
# determined by MaxNoOfExecutionThreads
LockExecuteThreadToCPU=0,1,2,3,4,5,6,7
# RealTimeScheduler (0,1)[0]
# Setting this parameter to 1 enables real-time scheduling of NDBCLUSTER
# threads
RealTimeScheduler=1
# SchedulerExecutionTimer (0,110000)[50]
# This parameter specifies the time in microseconds for threads to be
# executed in the scheduler before being sent. Setting it to 0 minimizes
# the response time; to achieve higher throughput, you can increase the
# value at the expense of longer response times.
# The default is 50 ÎŒsec, which our testing shows to increase throughput
# slightly in high-load cases without materially delaying requests.
SchedulerExecutionTimer=100
# SchedulerSpinTimer (0,500)[0]
# This parameter specifies the time in microseconds for threads to be executed
# in the scheduler before sleeping.
SchedulerSpinTimer=400
#Threads
# MaxNoOfExecutionThreads (2,8)
# For 8 or more cores the recomended value is 8
MaxNoOfExecutionThreads=8
# Options for data node "A":
[ndbd]
id=3
hostname=10.1.1.215
# Hostname or IP address
# Options for data node "B":
[ndbd]
id=4
hostname=10.1.1.216
# Hostname or IP address
#######################################
# SQL NODES (also known as API NODES) #
#######################################
# Common SQL Nodes Parameters
[mysqld default]
# This parameter is used to define which nodes can act as arbitrators.
# Only management nodes and SQL nodes can be arbitrators.
# ArbitrationRank can take one of the following values:
#
* 0: The node will never be used as an arbitrator.
#
* 1: The node has high priority; that is, it will be preferred
#
as an arbitrator over low-priority nodes.
#
* 2: Indicates a low-priority node which be used as an arbitrator
#
only if a node with a higher priority is not available
#
for that purpose.
#
# Normally, the management server should be configured as an
# arbitrator by setting its ArbitrationRank to 1 (the default for
# management nodes) and those for all SQL nodes to 0 (the default
# for SQL nodes).
ArbitrationRank=2
# BatchByteSize (1024,1M) [32k]
237
Appendix. Examples of Configuration Files # For queries that are translated into full table scans or range scans on
# indexes, it is important for best performance to fetch records in properly
# sized batches. It is possible to set the proper size both in terms of number
# of records (BatchSize) and in terms of bytes (BatchByteSize). The actual
# batch size is limited by both parameters.
# The speed at which queries are performed can vary by more than 40% depending
# upon how this parameter is set
# This parameter is measured in bytes and by default is equal to 32KB.
BatchByteSize=32k
# BatchSize (1,992) [64]
# This parameter is measured in number of records.
BatchSize=512
# MaxScanBatchSize (32k,16M) [256k]
# The batch size is the size of each batch sent from each data node.
# Most scans are performed in parallel to protect the MySQL Server from
# receiving too much data from many nodes in parallel; this parameter sets
# a limit to the total batch size over all nodes.
MaxScanBatchSize=8MB
# SQL node options:
[mysqld]
id=11
# Hostname or IP address
hostname=10.1.1.215
[mysqld]
id=12
# Hostname or IP address
hostname=10.1.1.216
# Extra SQL nodes (also used for backup & checks)
[mysqld]
id=13
[mysqld]
id=14
[mysqld]
id=15
[mysqld]
id=16
[mysqld]
id=17
[mysqld]
id=18
##################
# TCP PARAMETERS #
##################
[tcp default]
# Increasing the sizes of these 2 buffers beyond the default values
# helps prevent bottlenecks due to slow disk I/O.
SendBufferMemory=3M
ReceiveBufferMemory=3M
18.7.2. /etc/mysql/my.cf Configuration file of the SQL Nodes (that are also the NDB nodes). 238
Appendix. Examples of Configuration Files # MySQL SQL node config
# =====================
# Written by Pablo de la Concepcion, [email protected]
#
# The following options will be passed to all MySQL clients
[client]
#password
= your_password
port
= 3306
socket
= /var/lib/mysql/mysql.sock
# Here follows entries for some specific programs
# The MySQL server
[mysqld]
port
= 3306
socket
= /var/lib/mysql/mysql.sock
datadir = /var/lib/mysql
skip-locking
key_buffer_size = 4000M
table_open_cache = 5100
sort_buffer_size = 64M
net_buffer_length = 512K
read_buffer_size = 128M
read_rnd_buffer_size = 256M
myisam_sort_buffer_size = 64M
query_cache_size = 256M
query_cache_limit = 92M
#slow_query_log = /var/log/mysql/mysql-slow.log
max_connections = 500
table_cache = 9060
# Thread parameters
thread_cache_size = 1024
thread_concurrency = 64
thread_stack = 256k
# Point the following paths to different dedicated disks
#tmpdir
= /tmp/
#log-update
= /path-to-dedicated-directory/hostname
# Uncomment the following if you are using InnoDB tables
#innodb_data_home_dir = /var/lib/mysql/
#innodb_data_file_path = ibdata1:10M:autoextend
#innodb_log_group_home_dir = /var/lib/mysql/
# You can set .._buffer_pool_size up to 50 - 80 %
# of RAM but beware of setting memory usage too high
#innodb_buffer_pool_size = 16M
#innodb_additional_mem_pool_size = 2M
# Set .._log_file_size to 25 % of buffer pool size
#innodb_log_file_size = 5M
#innodb_log_buffer_size = 8M
#innodb_flush_log_at_trx_commit = 1
#innodb_lock_wait_timeout = 50
# The safe_mysqld script
[safe_mysqld]
log-error
= /var/log/mysql/mysqld.log
socket
= /var/lib/mysql/mysql.sock
[mysqldump]
socket
= /var/lib/mysql/mysql.sock
quick
max_allowed_packet = 64M
239
Appendix. Examples of Configuration Files [mysql]
no-auto-rehash
# Remove the next comment character if you are not familiar with SQL
#safe-updates
[myisamchk]
key_buffer_size = 10000M
sort_buffer_size = 20M
read_buffer = 10M
write_buffer = 10M
[mysqld_multi]
mysqld
= /usr/bin/mysqld_safe
mysqladmin = /usr/bin/mysqladmin
#log
# user
# password
= /var/log/mysqld_multi.log
= multi_admin
= secret
# If you want to use mysqld_multi uncomment 1 or more mysqld sections
# below or add your own ones.
#
#
#
#
#
#
#
WARNING
-------If you uncomment mysqld1 than make absolutely sure, that database mysql,
configured above, is not started. This may result in corrupted data!
[mysqld1]
port
= 3306
datadir
= /var/lib/mysql
pid-file
= /var/lib/mysql/mysqld.pid
# socket
= /var/lib/mysql/mysql.sock
# user
= mysql
# Cluster configuration
#
by Pablo de la Concepcion <[email protected]>
# Options for mysqld process:
[mysqld]
# Run NDB storage engine
ndbcluster
# Location of management servers
ndb-connectstring="10.1.1.215:1186;10.1.1.216:1186"
# Number of connections in the connection pool, the config.ini file of the
# cluster have to define also [API] nodes at least for each connection.
ndb-cluster-connection-pool=3
# Forces sending of buffers to NDB immediately, without waiting
# for other threads. Defaults to ON.
ndb-force-send=1
# Forces NDB to use a count of records during SELECT COUNT(*) query planning
# to speed up this type of query. The default value is ON. For faster queries
# overall, disable this feature by setting the value of ndb_use_exact_count
# to OFF.
ndb-use-exact-count=0
# This variable can be used to enable recording in the MySQL error log
# of information specific to the NDB storage engine. It is normally of
# interest only when debugging NDB storage engine code.
# The default value is 0, which means that the only NDB-specific
240
Appendix. Examples of Configuration Files #
#
#
#
#
#
#
information written to the MySQL error log relates to transaction
handling. If the value is greater than 0 but less than 10, NDB table
schema and connection events are also logged, as well as whether or
not conflict resolution is in use, and other NDB errors and information.
If the value is set to 10 or more, information about NDB internals, such
as the progress of data distribution among cluster nodes, is also
written to the MySQL error log.
ndb-extra-logging=00
#
#
#
#
#
Determines the probability of gaps in an autoincremented column.
Set it to 1 to minimize this. Setting it to a high value for
optimization â makes inserts faster, but decreases the likelihood
that consecutive autoincrement numbers will be used in a batch
of inserts. Default value: 32. Minimum value: 1.
ndb-autoincrement-prefetch-sz=256
engine-condition-pushdown=1
# Options for ndbd process:
[mysql_cluster]
# Location of management servers (list of host:port separated by ;)
ndb-connectstring="10.1.1.230:1186;10.1.1.220:1186"
18.7.3. /etc/cron.daily/backup_cluster NOTE: as it is a cluster, the mysldump is not reliable because the writting is distributed and the coherence could not be warranted. Though it is not recommended, and it is preferable to do a complete backup of the cluster (see the following section), you could try to get a valid backup if you limit the writting in the cluster (stopping the pandora servers) and in the mode single user (ver http://dev.mysql.com/doc/refman/5.1/en/mysqlclustersingleusermode.html ). This backup script does the backup through the "secure" system (command START BACKUP) from the cluster management console. #!/bin/bash
LOG_TEMPORAL=/tmp/mysql_cluster_backup_script.log
#Directorios de los Backups
DIR_NODO3=/var/lib/mysql-cluster/BACKUPS/Nodo_03
DIR_NODO4=/var/lib/mysql-cluster/BACKUPS/Nodo_04
# Se lanza el backup y se espera a que se complete
/usr/bin/ndb_mgm -e "START BACKUP WAIT COMPLETED" > $LOG_TEMPORAL
echo "Procesando Log $LOG_TEMPORAL"
NUM_BACKUP=`grep Backup $LOG_TEMPORAL | grep completed | awk '{print $4}'`
echo "Procesando backup $NUM_BACKUP"
# Se copian por scp los backups
scp -i /root/.ssh/backup_key_rsa -r [email protected]:/var/lib/mysqlcluster/BACKUP/BACKUP-$NUM_BACKUP/ $DIR_NODO3 >>$LOG_TEMPORAL 2>> /var/lib/mysqlcluster/BACKUPS/logs/backup_$NUM_BACKUP.err
scp -i /root/.ssh/backup_key_rsa -r [email protected]:/var/lib/mysqlcluster/BACKUP/BACKUP-$NUM_BACKUP/ $DIR_NODO4 >>$LOG_TEMPORAL 2>> /var/lib/mysql-
241
Appendix. Examples of Configuration Files cluster/BACKUPS/logs/backup_$NUM_BACKUP.err
#Se almacena el log
mv $LOG_TEMPORAL /var/lib/mysql-cluster/BACKUPS/logs/backup_$NUM_BACKUP.log
Para programar este script diariamente debemos poner la siguiente linea en
el fichero
/etc/crontab (Esto hará un backup diario a las 5 de la mañana)
00 5
* * *
root
/tmp/backup_cluster
18.7.4. /etc/init.d/cluster_mgmt This script is slightly different in the secondary cluster management console (different
parameters in DAEMON_PARAMETERS)
#!/bin/bash
# Copyright (c) 2005-2009 Artica ST
#
# Author: Sancho Lerena <[email protected]> 2006-2009
#
# /etc/init.d/cluster_mgmt
#
# System startup script for MYSQL Cluster Manager
#
### BEGIN INIT INFO
# Provides:
cluster_mgmt
# Required-Start: $syslog cron
# Should-Start:
$network cron
# Required-Stop: $syslog
# Should-Stop:
$network
# Default-Start: 2 3 5
# Default-Stop:
0 1 6
# Short-Description: MySQL Cluster Management console startup script
# Description:
See short description
### END INIT INFO
export PROCESS_DAEMON=ndb_mgmd
export PROCESS_PARAMETERS="--config-file=/var/lib/mysql-cluster/config.ini
--configdir=/var/lib/mysql-cluster"
# Uses a wait limit before sending a KILL signal, before trying to stop
# Pandora FMS server nicely. Some big systems need some time before close
# all pending tasks / threads.
export MAXWAIT=300
# Check for SUSE status scripts
if [ -f /etc/rc.status ]
then
. /etc/rc.status
rc_reset
else
# Define rc functions for non-suse systems, "void" functions.
function rc_status () (VOID=1;)
function rc_exit () (exit;)
function rc_failed () (VOID=1;)
242
Appendix. Examples of Configuration Files fi
# This function replace pidof, not working in the same way in different linux
distros
function pidof_process () (
# This sets COLUMNS to XXX chars, because if command is run
# in a "strech" term, ps aux don't report more than COLUMNS
# characters and this will not work.
COLUMNS=400
PROCESS_PID=`ps aux | grep "$PROCESS_DAEMON $PROCESS_PARAMETERS" | grep -v
grep | tail -1 | awk '{ print $2 }'`
echo $PROCESS_PID
)
# Main script
if [ `which $PROCESS_DAEMON | wc -l` == 0 ]
then
echo "Server not found, please check setup and read manual"
rc_status -s
rc_exit
fi
case "$1" in
start)
PROCESS_PID=`pidof_process`
if [ ! -z "$PROCESS_PID" ]
then
echo "Server is currently running on this machine with PID
($PROCESS_PID). Aborting now..."
rc_failed 1
rc_exit
fi
$PROCESS_DAEMON $PROCESS_PARAMETERS
sleep 1
PANDORA_PID=`pidof_process`
if [ ! -z "$PANDORA_PID" ]
then
echo "Server is now running with PID $PANDORA_PID"
rc_status -v
else
echo "Cannot start Server. Aborted."
rc_status -s
fi
;;
stop)
PANDORA_PID=`pidof_process`
if [ -z "$PANDORA_PID" ]
then
echo "Server is not running, cannot stop it."
rc_failed
else
echo "Stopping Server"
kill $PANDORA_PID
COUNTER=0
while [
do
$COUNTER -lt $MAXWAIT ]
PANDORA_PID=`pidof_process`
if [ -z "$PANDORA_PID" ]
then
243
Appendix. Examples of Configuration Files COUNTER=$MAXWAIT
fi
COUNTER=`expr $COUNTER + 1`
sleep 1
done
# Send a KILL -9 signal to process, if it's alive after
60secs, we need
# to be sure is really dead, and not pretending...
if [ ! -z "$PANDORA_PID" ]
then
kill -9 $PANDORA_PID
fi
rc_status -v
fi
;;
status)
PANDORA_PID=`pidof_process`
if [ -z "$PANDORA_PID" ]
then
echo "Server is not running."
rc_status
else
echo "Server is running with PID $PANDORA_PID."
rc_status
fi
;;
force-reload|restart)
$0 stop
$0 start
;;
*)
echo "Usage: server { start | stop | restart | status }"
exit 1
esac
rc_exit
18.7.5. /etc/init.d/cluster_node #!/bin/bash
# Copyright (c) 2005-2009 Artica ST
#
# Author: Sancho Lerena <[email protected]> 2006-2009
#
# /etc/init.d/cluster_node
#
# System startup script for MYSQL Cluster Node storage
#
### BEGIN INIT INFO
# Provides:
cluster_node
# Required-Start: $syslog cron
# Should-Start:
$network cron
# Required-Stop: $syslog
# Should-Stop:
$network
# Default-Start: 2 3 5
# Default-Stop:
0 1 6
# Short-Description: MySQL Cluster Node startup script
# Description:
See short description
### END INIT INFO
export PROCESS_DAEMON=ndb_ndb
export PROCESS_PARAMETERS="-d"
244
Appendix. Examples of Configuration Files # Uses a wait limit before sending a KILL signal, before trying to stop
# Pandora FMS server nicely. Some big systems need some time before close
# all pending tasks / threads.
export MAXWAIT=300
# Check for SUSE status scripts
if [ -f /etc/rc.status ]
then
. /etc/rc.status
rc_reset
else
# Define rc functions for non-suse systems, "void" functions.
function rc_status () (VOID=1;)
function rc_exit () (exit;)
function rc_failed () (VOID=1;)
fi
# This function replace pidof, not working in the same way in different linux
distros
function pidof_process () (
# This sets COLUMNS to XXX chars, because if command is run
# in a "strech" term, ps aux don't report more than COLUMNS
# characters and this will not work.
COLUMNS=400
PROCESS_PID=`ps aux | grep "$PROCESS_DAEMON $PROCESS_PARAMETERS" | grep -v
grep | tail -1 | awk '{ print $2 }'`
echo $PROCESS_PID
)
# Main script
if [ `which $PROCESS_DAEMON | wc -l` == 0 ]
then
echo "Server not found, please check setup and read manual"
rc_status -s
rc_exit
fi
case "$1" in
start)
PROCESS_PID=`pidof_process`
if [ ! -z "$PROCESS_PID" ]
then
echo "Server is currently running on this machine with PID
($PROCESS_PID). Aborting now..."
rc_failed 1
rc_exit
fi
$PROCESS_DAEMON $PROCESS_PARAMETERS
sleep 1
PANDORA_PID=`pidof_process`
if [ ! -z "$PANDORA_PID" ]
then
echo "Server is now running with PID $PANDORA_PID"
rc_status -v
else
echo "Cannot start Server. Aborted."
rc_status -s
fi
245
Appendix. Examples of Configuration Files ;;
stop)
PANDORA_PID=`pidof_process`
if [ -z "$PANDORA_PID" ]
then
echo "Server is not running, cannot stop it."
rc_failed
else
echo "Stopping Server"
kill $PANDORA_PID
COUNTER=0
while [
do
$COUNTER -lt $MAXWAIT ]
PANDORA_PID=`pidof_process`
if [ -z "$PANDORA_PID" ]
then
COUNTER=$MAXWAIT
fi
COUNTER=`expr $COUNTER + 1`
sleep 1
done
# Send a KILL -9 signal to process, if it's alive after
60secs, we need
# to be sure is really dead, and not pretending...
if [ ! -z "$PANDORA_PID" ]
then
kill -9 $PANDORA_PID
fi
rc_status -v
fi
;;
status)
PANDORA_PID=`pidof_process`
if [ -z "$PANDORA_PID" ]
then
echo "Server is not running."
rc_status
else
echo "Server is running with PID $PANDORA_PID."
rc_status
fi
;;
force-reload|restart)
$0 stop
$0 start
;;
*)
echo "Usage: server { start | stop | restart | status }"
exit 1
esac
rc_exit
246
Appendix. Examples of Configuration Files 19 MYSQL BINARY REPLICATION MODEL FOR HA 247
Introduction 19.1. Introduction This setup is proposed to have a full HA enviroment in Pandora FMS, based on an active/passive model. Standard MySQL (not MySQL cluster), allow to have a single MASTER (allowing INSERT/UPDATE operations) and several SLAVES, allowing only read operations. This is used in several enviroments to have a distributed database model, in Pandora all operations read/write are done against the same DB server, so this model cannot be used, anyway, replication is used also to have a "copy" of your primary database, so in a failure event, you can "raise" the slave to be the master database and use it. We use UCARP application to provide the Virtual IP (VIP) mechanism to have a realtime H/A. In the simplest model, with two UCARP daemons running, if the master fails, the secondary will take the VIP and proceed with normal operation. An slave will resume the MySQL operations on the Pandora FMS Server / Console, and user will not notice anything. After the failover, you will need to restore (manually, because it's a very delicated process), the master system and transfer all data from slave to the master again. 19.2. Comparison versus other MySQL HA models There are many ways to implement MySQL HA, we have explored three: • MySQL Cluster: Very complex and with a performance penalty, is the unique way to have a real active/active (cluster) enviroment. Described in depth in our documentation. • MySQL Binary Replica / ucarp: Simple at fist, fast and very standard, but with several scripts and complexity to get back the master in the system. This documentation. • DRBD / heartbeat : Simple, fast and based on system block devices. Also described in our documentation. It's the official way to implement HA in Pandora FMS. In our opinion, the best way to implement the HA is to have the simplest possible setup, because when something fails, any extra complexity will led to confusion and data loss if procedures are not extremely well tested and written. Most times, operators only follow procedures and cannot react to things outside the procedures, and HA could be very difficult to have exact procedures in most cases. 19.3. Initial enviroment This is a brief overview our test scenario: 192.168.10.101 (castor) > Master 192.168.10.102 (pollux) > Slave 192.168.10.100 virtualip 192.168.10.1 pandora > mysql app 19.3.1. Setting up the Mysql Server 19.3.1.1. Master node (Castor) Edit my.cnf file (debian systems): 248
Initial enviroment [mysqld]
bind-address=0.0.0.0
log_bin=/var/log/mysql/mysql-bin.log
server-id=1
innodb_flush_log_at_trx_commit=1
sync_binlog=1
binlog_do_db=pandora
binlog_ignore_db=mysql
19.3.1.2. Slave node (Pollux) Edit my.cnf file: [mysqld]
bind-address=0.0.0.0
server-id=2
innodb_flush_log_at_trx_commit=1
sync_binlog=1
19.3.1.3. Creating a User for Replication Each slave must connect to the master using a MySQL user name and password, so there must be a user account on the master that the slave can use to connect. Any account can be used for this operation, providing it has been granted the REPLICATION SLAVE privilege. mysql> CREATE USER 'replica'@'192.168.10.102' IDENTIFIED BY 'slayer72';
mysql> GRANT REPLICATION SLAVE ON *.* TO 'replica'@'192.168.10.102';
mysql> FLUSH PRIVILEGES;
19.3.1.4. Install your pandora DB Create a new one from installation .sql files or dump your current one in the master node (Castor) Login in the master server: mysql>
mysql>
mysql>
mysql>
create database pandora;
use pandora;
source /tmp/pandoradb.sql;
source /tmp/pandoradb_data.sql;
19.3.1.5. Setting Up Replication with Existing Data Now we want to replicate the initial state of the loaded database in the MASTER node (castor). This is the "start" point to replicate all information to the slave, and assumes you have your database "FROZEN" in the time you make the "photo", after doing the photo a "coordinates" are given and writen in the SQL dump, if master database continues writting data, doesn't matter, replication will continue to replicate all changes from the initial coordinates. Think about this as a lineal path, and you "freeze" a start point for the slave to start to replicate the information. Follow these steps: 1. Start a session on the master by connecting to it with the commandline client, and flush all tables and block write statements by executing the FLUSH TABLES WITH READ LOCK statement: 249
Initial enviroment mysql> FLUSH TABLES WITH READ LOCK;
2. Database writes are now blocked. Use the SHOW MASTER STATUS statement to determine the current binary log file name and position: mysql > SHOW MASTER STATUS;
+------------------+----------+--------------+------------------+
| File
| Position | Binlog_Do_DB | Binlog_Ignore_DB |
+------------------+----------+--------------+------------------+
| mysql-bin.000003 | 98
| pandora
| mysql
|
+------------------+----------+--------------+------------------+
The File column shows the name of the log file and Position shows the position within the file. In this example, the binary log file is mysqlbin.000003 and the position is 98. You need them later when you are setting up the slave. They represent the replication coordinates at which the slave should begin processing new updates from the master. 3. Open a shell and do a mysqldump command: $ mysqldump -u root -pnone pandora -B --master-data > /tmp/dbdump.sql
This dump is "special" and contains the coordinates for the slave server (masterdata), and also (
B) create the database and uses in on the created .SQL dump. 4. Unlock your Mysql primary server: mysql> unlock tables;
5. Copy the SQL file to the SLAVE server (ftp. ssh...) 6. Connect to mysql console, and stop your SLAVE server; mysql> SLAVE STOP;
7. Drop your current pandora database in the SLAVE server (if exists) mysql> drop database pandora;
8. Enter the following SQL sentence to prepare credencials to stablish communication with master: mysql> CHANGE MASTER TO MASTER_HOST='192.168.10.101', MASTER_USER='replica',
MASTER_PASSWORD='slayer72';
Take note that is pointing to the current MASTER server (192.168.10.101). 9. Import the dump sql taken from the current Master server: mysql> SOURCE /tmp/dbdump.sql;
10. Start SLAVE 250
Initial enviroment mysql> SLAVE START;
11. Watch status of synchonization mysql> SHOW SLAVE STATUS;
12. You should see "Waiting for master to send events" to confirm everything is OK. 19.4. Setting up the SQL server to serve Pandora server In both servers: mysql> grant all privileges on pandora.* to [email protected] identified by
'pandora';
mysql> flush privileges;
19.4.1. Start Pandora Server Everything should go fine. Check if everything is correct: In slave server and master server take a look on running processes with following SQL command: mysql> show processlist;
Should show something like: +----+-------------+-----------+------+---------+-----+---------------------------------------------------------| Id | User
| Host
| db
| Command | Time | State
| Info
|
+----+-------------+-----------+------+---------+-----+---------------------------------------------------------| 32 | root
| localhost | NULL | Sleep
|
72 |
| NULL
|
| 36 | system user |
| NULL | Connect | 906 | Waiting for master to send
event
| NULL
|
| 37 | system user |
| NULL | Connect |
4 | Has read all relay log;
waiting for the slave I/O thread to update it | NULL
|
| 39 | root
| localhost | NULL | Query
|
0 | NULL
| show processlist |
+----+-------------+-----------+------+---------+-----+----------------------------------------------------------
19.5. Switchover That means: do the slave to become the master. In the event MASTER server is down, or for any reason the VIP points to the SLAVE server, you must be sure that the SLAVE server executes following SQL commands: 251
Switchover mysql> STOP SLAVE;
mysql> RESET MASTER;
Your Slave server is now working as MASTER. SLAVE doesnt use the replication log from the MASTER and the MASTER is now "out of sync", that means if your Pandora FMS points to the old
master server, will have old information. This is one of the most problematic points and most problems comes from here. The first "Switchover", that means, when the official MASTER goes down, and the official SLAVE becomes the NEW master, is not a problem, it's fully automatic since systems do the queries against the SLAVE / New master server. The problem is the "second" switchover, that means, when you want to have the oldmaster to become the official master again. In this step you need to redone the full process to sync all the HA model, that means. 1. Stop all pandoras. 2. Dump the database from the oldslave (Pollux) to a clean SQL: $ mysqldump -B -u root -pnone pandora > /tmp/pandoradump.sql
3. Copy the sql dump to the official master (Castor) 4. Restore the SQL and drop all old information mysql> drop database pandora;
mysql> source /tmp/pandoradump.sql;
5. In this point both databases are equal, so just obtain the coordinates to set slave back "to replicate" and degrade to SLAVE. Get the coordinates from the official MASTER: mysql> SHOW MASTER STATUS;
+------------------+----------+--------------+------------------+
| File
| Position | Binlog_Do_DB | Binlog_Ignore_DB |
+------------------+----------+--------------+------------------+
| mysql-bin.000003 | 234234
| pandora
| mysql
|
+------------------+----------+--------------+------------------+
(File and Position are the coordinates) 6. Use this SQL in the SLAVE: mysql> SLAVE STOP;
myqsl> CHANGE MASTER TO MASTER_HOST='192.168.10.101', MASTER_USER='replica',
MASTER_PASSWORD='slayer72', MASTER_LOG_FILE='mysql-bin.000003',
MASTER_LOG_POS=234234;
mysql> SLAVE START;
7. Everything should be ok, so you can now restart your VIP processes to asssign the VIP to the official master (Castor) and let Pollux again the slave role. 252
Switchover There is another way to implement failover which supposes MASTER/SLAVE role is
not fixed, but that means this "relative" role should be implemented in the VIP model,
using UCARP that means to change the priority in vhid. Another way to solve this
problem is to use Heartbeat VIP mechanism (See our docs about DRBD)
19.6. Setting up the load balancing mechanism We
are
using
UCARP,
which
uses
CARP
protocol (http://en.wikipedia.org/wiki/Common_Address_Redundancy_Protoco). More information on: http://ucarp.org/ Get the package and install it. Setup is very easy, you need to have a ucarp process running on each mysql server. 19.6.1. Castor / Master ucarp --interface=eth1 --srcip=192.168.10.101 --vhid=1 --pass=pandora
--addr=192.168.10.100 --upscript=/etc/vip-up.sh --downscript=/etc/vip-down.sh &
19.6.2. Pollux / Slave ucarp --interface=eth1 --srcip=192.168.10.102 --vhid=2 --pass=pandora
--addr=192.168.10.100 --upscript=/etc/vip-up.sh --downscript=/etc/vip-down.sh &
19.6.2.1. Contents of scripts [/etc/vipup.sh] #!/bin/bash
/sbin/ifconfig "$1":254 "$2" netmask 255.255.255.0
[/etc/vipdown.sh] #!/bin/bash
/sbin/ifconfig "$1":254 down
19.6.2.2. Some proposed scripts [/etc/mysqlcreatefullreplica.sh] #!/bin/bash
echo "FLUSH TABLES WITH READ LOCK;" | mysql -u root -pnone -D pandora
mysqldump -u root -pnone pandora -B --master-data > /tmp/dbdump.sql
echo "UNLOCK TABLES;" | mysql -u root -pnone -D pandora
[/etc/mysqlrestorereplica.sh] 253
Setting up the load balancing mechanism scp [email protected]:/tmp/dbdump.sql .
echo "SLAVE STOP; drop database pandora; SOURCE /tmp/dbdump.sql;" | mysql -u root
-pnone -D pandora
[/etc/mysqlbecomeslave.sh] echo "CHANGE MASTER TO MASTER_HOST='192.168.10.101', MASTER_USER='replica',
MASTER_PASSWORD='slayer72'; SLAVE START;" | mysql -u root -pnone
[/etc/mysqlbecomemaster.sh] echo "STOP SLAVE; RESET MASTER;" | mysql -u root -pnone
254
Setting up the load balancing mechanism 20 CAPACITY STUDY 255
Introduction 20.1. Introduction Pandora FMS is a quite complex distributed application that has several key elements, that could be a bottleneck if it is not measured and configured correctly. The main aim of this study is to detail the scalability of Pandora FMS regarding on an specific serial of parameters to know the requirements that it could have if it gets an specific capacity. Load test were made in a first phase, aimed to a cluster based system, with an unique Pandora server centralized in a DDBB cluster. The load test are also useful to observe the maximum capacity per server. In the current architecture model (v3.0 or higher), with N independent servers and with one "Metaconsole", this scalability tends to be linear, while the scalability based on centralized models isn't (it would be of the kind shown in the following graph) 20.1.1. Data Storage and Compaction
The fact that Pandora compact data in real time, it's very important related to calculate the size the data will occupy. An initial study was done that related the way that a classic system stored data with the Pandora FMS "asynchronous" way of storing data. This could be seen in the schema that is included in this section. 256
Introduction In a conventional system For a check, with an average of 20 checks per day, we have a total of 5 MB per year in filled space. For 50 checks per agent, it is 250 MB per year. In a non conventional system, asynchronous like Pandora FMS For a check, with an average of 0.1 variations per day, we have a total of 12,3 KB per year in filled space. For 50 checks per agent, this results in 615 KB per year. 20.1.2. Specific Terminology Next is described a glossary of specific terms for this study, for a better comprehension. • Fragmentation of the information: the information that Pandora FMS manages could have different performances: it could change constantly (e.g a CPU percentage meter), or be very static ( for example, determine the state of one service). As Pandora FMS exploits this to "compact" the information in the DB, it's a critical factor for the performance and the study of the capacity, so the more fragmentation, the more size in the DB and more capacity of process will be necessary to use in order to process the same information. • Module: is the basic piece of the collected information for its monitoring. In some environments is known as Event. • Interval: is the amount of time that pass between information collects of one module. • Alert: is the notification that Pandora FMS executes when a data is out of the fixed margins or changes its state to CRITICAL or WARNING. 20.2. Example of Capacity Study
20.2.1. Definition of the Scope
The study has been done thinking about a deployment divided in three main phases: • Stage 1: Deployment of 500 agents. • Stage 2: Deployment of 3000 agents. • Stage 3: Deployment of 6000 agents. 257
Example of Capacity Study
In order to determine exactly Pandora's FMS requisites in deployments of this data volume, you should know very well which kind of monitoring you want to do. For the following study we have taken into account in an specific way the environment characteristics of a fictitious client named "QUASAR TECNOLOGIES" that could be summarized in the following points: •
•
•
•
•
•
Monitoring 90% based on software agents. Homogeneous systems with a features serial grouped in Technologies/policies. Very changeable intervals between the different modules /events to monitor. Big quantity of asynchronous information (events, log elements). Lot of information about processing states with little probability of change. Little information of performance with regard to the total. After doing an exhaustive study of all technologies and determine the reach of the implementation (identifying the systems and its monitoring profiles), we have come to the following conclusions: • There is an average of 40 modules/events per system. • The average monitoring interval is of 1200 seconds (20 min). • There are modules that reports information every 5 minutes and modules that does it once per week. • From all the group of total modules (240,000), it has been determined that the possibility of change of each event for each sample is the 25% • It has been determined that the alert rate per module is 1,3 (that is: 1,3 alerts per module/event). • It is considered (in this case it's an estimation based on our experience) that an alert has 1% probabilities of being fired. These conclusions are the basis to prepare the estimation, and are codified in the Excel spreadsheet used to do the study: With these start up data, and applying the necessary calculations, we can estimate size in DDBB, nº of modules per second that are necessary to process and other essential parameters: 20.2.2. Capacity Study Once we've known the basic requirements for the implementation in each phase ( modules/second 258
Example of Capacity Study
rate), nº of total alerts, modules per day, and MB/month, we're going to do a real stress test on a server quite similar to the production systems ( the test couldn't have been done in a system similar to the production ones). These stress tests will inform us of the processing capacity that Pandora FMS has in a server, and what is its degradation level with time. This should be useful for the following aims: 1. Through an extrapolation, know if the final volume of the project will be possible with the hardware given to do that. 2. To know which are the "online" storage limits and which should be the breakpoints from which the information moves to the historic database. 3. To known the answer margins to the process peaks, coming from problems that could appear ( service stop, planned stops) where the information expecting for being processed would be stored. 4. To know the impact in the performance derived of the different quality (% of change) of the monitoring information. 5. To know the impact of the alert process in big volumes. The tests have been done on a DELL server PowerEdge T100 with 2,4 Ghz Intel Core Duo Processor and 2GB RAM. This server, working on an Ubuntu Server 8.04, has given us the base of our study for the tests on High Availability environments. The tests have been done on agent configurations quite similar to that of the QUASAR TECHNOLOGIES project, so we can't have available the same hardware, but replicate a high availability environment, similar to the QUASAR TECHNOLOGIES to evaluate the impact in the performance as times goes on and set other problems ( mainly of usability) derived from managing big data volume. 259
Example of Capacity Study
The obtained results are very positives, so the system, though very overload, was able to process an information volume quite interesting (180,000 modulos, 6000 agentes, 120,000 alertas). The conclusions obtained from this study are these: 1. You should move the "real time" information to the historical database in a maximum period of 15 days, being the best thing to do it for more than one week data. This guarantee a more quick operation. 2. The maneuver margin in the best of cases is nearly of the 50% of the process capacity, higher than expected, taken into account this information volume. 3. The fragmentation rate of the information is vital to determine the performance and the necessary capacity for the environment where we want to deploy the system 20.3. Methodology in detail
The previous chapter was a "quick" study based only in modules typer "dataserver". In this section we give a more complete way of doing an analysis of the Pandora FMS capacity. As starting point, in all cases, we assume the worstcase scenario providing the we can choose. We assume that if we can't choose , it will be the " Common case" philosophy. It will be never considered anything in the "best of cases" so this phylosophy doesn't work. Next we are going to see how to calculate the system capacity, by monitoring type or based on the information origin. 20.3.1. Data Server Based on the achievement of certain targets, as we have seen in the previous point, we suppose that the estimated target, is to see how it works wiht a load of 100,000 modules, distributed between a total of 3000 agents, that is, an average of 33 modules per agent. A task will be created (executed through cron or manual script) of pandora_xmlstress that has 33 modules, distributed with a configuration similar to this one: • 1 module type string • 17 modules type generic_proc. • 15 modules type generic_data. We will configure the thresholds of the 17 modules of generic_proc type this way: module_begin
module_name Process Status X
module_type generic_proc
module_description Status of my super-important daemon / service / process
module_exec type=RANDOM;variation=1;min=0;max=100
module_end
In the 15 modules of generic_data type, we should define thresholds. The procedure to follow is the following: We should configure the thresholds of the 15 modules of generic_data type so data of this type will be generated: module_exec type=SCATTER;prob=20;avg=10;min=0;max=100
260
Methodology in detail
Then, we configure the thresholds for these 15 modules, so they have this pattern: 0-50 normal
50-74 warning
75- critical
We add to the configuration file of our pandora_xml_stress some new tokens, to could define the thresholds from the XML generation. PLEASE CONSIDER THAT Pandora FMS only "adopts" the definition of thresholds in the creation of the module, but not in the update with new data. module_min_critical 75
module_min_warning 50
We execute the pandora xml stress. We should let it running at least for 48 hours without any kind of interruption and we should monitor (with a pandora agent) the following parameters: Nº of queued packages: find /var/spool/pandora/data_in | wc -l
CPU de pandora_server ps aux | grep "/usr/bin/pandora_server" | grep -v grep | awk '{print $3}'
pandora_server Total Memory: ps aux | grep "/usr/bin/pandora_server" | grep -v grep | awk '{print $4}'
CPU de mysqld (check syntax of the execution, it depends of the mysql distro) ps aux | grep "sbin/mysqld" | grep -v grep | awk '{print $3}'
pandora DDBB response average time /usr/share/pandora_server/util/pandora_database_check.pl
/etc/pandora/pandora_server.conf
Nº of monitors in unknown
echo "select SUM(unknown_count) FROM tagente;" | mysql -u pandora -pxxxxxx -D
pandora | tail -1
261
Methodology in detail
(where is written xxx write de ddbb password "pandora" to use it with the user "pandora") The first executions should be useful to "tune" the server and the MySQL configuration. We use the script /usr/share/pandora_server/util/pandora_count.sh to count (if are xml pending to process) the rate of package proccessing. The aim is to make possible that all the packages generated (3000) could be processed in an interval below the 80% of the limit time (5 minutes). This implies that 3000 packages should be processed in 4 minutes, so: 3000 / (4x60) = 12,5
We should get a processing rate of 12,5 packages minimum to be reasonably sure that pandora could process this information. List of things to work on: Nº of threads, nº maximum of items in intermediate queue (max_queue_files), and, of course, all the parameters of MySQL that are applicable (very important) Solo un comentario acerca de la importancia de esto: un Pandora con un servidor Linux instalado "por defecto" en una maquina potente, puede no pasar de 56 paquetes por segundo, en una máquina potente bien "optimizada" y "tuneada" puede llegar perfectamente a 3040 paquetes por segundo. Tambien depende mucho de la cantidad de modulos que haya en cada agente. Se configura el sistema para que el script de mantenimiento de bbdd en /usr/share/pandora_server/util/pandora_db.pl se ejecute cada hora en vez de cada dia: mv /etc/cron.daily/pandora_db /etc/cron.hourly
We leave the system working, with the package generator a minimum of 48 hours. Once this time has passed, we should evaluate the following points: 1. Is the system stable?, Is it down? If there are problems, checl the logs and graphs of the metrics that we have got (mainly memory). 2. Evaluate the tendency of time of the metric "Nº of monitors in unknown" There should be not tendencies neither important peaks. They should be the exception: If they happen with a regularity of one hour, is because there are problems withe the concurrency of the DDBB management process. 3. Evaluate the metric "Average time of response of the pandora DDBB" It should not increase with time but remain constant. 4. Evaluate the metric "pandora_server CPU" , should have many peaks, but with a constant tendency, not rising. 5. Evaluate the metric "MYSQL server CPU"; should be constant with many peaks, but with a constant tendency , not rising. 20.3.1.1. Evaluation of the Alert Impact If all was right, now we should evaluate the impact of the alert execution performance. We apply one alert to five specific modules of each agent (from type generic_data), for the 262
Methodology in detail
CRITICAL condition.Something not really important, like creating an event or writting to syslog (to not consider the impact that something with hight latency could have like for example sending an email). We can optionally create one event correlation alert to generate one alert for any critical condition of any agent with one of these five modules: We leave the system operating 12 hours under those criteria and evaluate the impact, following the previous criteria. 20.3.1.2. Evaluating the Purging/Transfer of Data
Supposing the data storage policy was: • Deleting of events from more than 72 hours • Moving data to history from more than 7 days. We should leave the system working "only" during at least 10 days to evaluate the long term performance. We could see a "peak" 7 days later due to the moving of data to the history ddbb. This degradation is IMPORTANT to consider. If you can't have so many time available, it is possible to replicate (with less "realism") changing the purging interval to 2 days in events and 2 days to move data to history, to evaluate this impact. 20.3.1.3. Evaluation of the Alert Impact If all was right, now we should evaluate the impact of the alert execution performance. We apply one alert to five specific modules of each agent (from type generic_data), for the CRITICAL condition.Something not really important, like creating an event or writting to syslog (to not consider the impact that something with hight latency could have like for example sending an email). We can optionally create one event correlation alert to generate one alert for any critical condition of any agent with one of these five modules: We leave the system operating 12 hours under those criteria and evaluate the impact, following the previous criteria. 20.3.1.4. Evaluating the Purging/Transfer of Data
Supposing the data storage policy was: • Deleting of events from more than 72 hours • Moving data to history from more than 7 days. We should leave the system working "only" during at least 10 days to evaluate the long term performance. We could see a "peak" 7 days later due to the moving of data to the history ddbb. This degradation is IMPORTANT to consider. If you can't have so many time available, it is possible to replicate (with less "realism") changing the purging interval to 2 days in events and 2 days to move data to history, to evaluate this impact. 263
Methodology in detail
20.3.2. ICMP Server(Enterprise) Here we talk specifically of the ICMP network server.In case of doing the tests for the open network server, please, see the corresponding section of the network server (generic). Supposing that you have the server already working and configured, we are going to explain some key parameters for its performance: block_size X
It defines the number of "pings" that the system will do for any execution. If the majority of pings are going to take the same time, you can increase the number to considerably high numberm i.e: 50 or 70 On the contrary, the module ping park is heterogeneous and they are in very different networks, with different latency times,it is not convenient for you to put a high number, because the test will take the time that takes the slower one, so you can use a number quite low, such as 15 or 20. icmp_threads X
Obviously, the more threads it has, the more checks it could execute. If you make an addition of all the threads that Pandora execute, they will not be more than 3040. You should not use more than 10 threads here, thought it depends a lot of the kind of hardware an Linux version that you are using. Now, we should "create" a fictitious number of modules ping type to test. We assume that you are going to test a total of 3000 modules of ping type. To do this, the best option is to choose a system in the network that would be able to support all pings (any Linux server would do it) Using the Pandora CSV importer(available in the Enterprise version), create a file with the following format: (Nombre agente, IP,os_id,Interval,Group_id)
You can use this shellscript to generate this file (changing the destination IP and the group ID) A=3000
while [ $A -gt 0 ]
do
echo "AGENT_$A,192.168.50.1,1,300,10"
A=`expr $A - 1`
done
Before doing anything, we should have the pandora monitored, measuring the metrics that we saw in the previous point: CPU consumption (pandora and mysqul), nº of modules in unknown and other interesting monitors. We have to import the CSV to create 3000 agents (it will takes some minutes). After we go to the first agent (AGENT_3000) and we create a module Type PING. 264
Methodology in detail
Luego iremos a la herramienta de operaciones masivas y copiaremos ese modulo a los otros 2999 agentes. Pandora debería empezar a procesar esos modulos. Mediremos con las mismas métricas que el caso anterior y veremos como evoluciona. El objetivo es dejar un sistema operable para el numero de modulos de tipo ICMP requerido sin que ninguno de ellos llegue a estado unknown. 20.3.3. Servidor de SNMP (Enterprise) Aqui hablaremos específicamente del servidor de red SNMP Enterprise. En caso de realizar las pruebas para el servidor de red open, vea el punto correspondiente al servidor de red (genérico). Suponemos que ya tiene el servidor funcionando y configurado. Pasaremos a explicar algunos parámetros clave para su funcionamiento: block_size X
Define el numero de peticiones SNMP que hará el sistema por cada ejecución. Hay que tener en cuenta que el servidor los agrupa por IP de destino, de forma que ese bloque es orientativo. Conviene que no sea muy grande (3040 maximo). Cuando un elemento del bloque falla, un contador interno hace que lo reintente el servidor enterprise, y si tras X intentos no funciona, se lo pasará al servidor open. snmp_threads X
Evidentemente, cuantos mas hilos tenga, más chequeos podrá ejecutar. Si suma todos los hilos que ejecuta Pandora no deberían llegar a 3040. No debería usar más de 10 hilos aquí, aunque depende mucho del tipo de hardware y version de Linux que esté usando. El servidor de SNMP Enterprise no soporta versión 3. Esos modulos (v3) serán ejecutuados por la version open. La forma más rapida de probar es mediante un dispositivo SNMP, aplicando a todos los interfaces, todos los modulos de monitorización "básicos" de serie. Esto se hace mediante la aplicación del SNMP Explorer (Agente > Modo de administracion > SNMP Explorer). Identifique las interfaces, y aplica todas las metricas a cada interfaz. En un switch de 24 puertos, esto genera unos 650 modulos. Si genera otro agente con otro nombre, peor la misma IP; tendrá otros 650 modulos. Otra opción puede ser copiar todos los modulos a una serie de agentes que tengan todos la misma IP de forma que los modulos copiados funcionen atacando al mismo switch. Otra opción es utilizar un emulador de SNMP, como el Jalasoft SNMP Device Simulator. El objetivo de este punto es ser capaz de monitorizar de forma constante, un pool de modulos SNMP durante al menos 48 horas, monitorizando la infraestructura, para asegurarse de que el ratio de monitorizacion de mod/seg es constante, y no existen periodos de tiempo donde el servidor produce módulos en estado desconocido. Esta situación se podría dar por: • Escasez de recursos (mem, CPU). Se podría ver una tendencia de estas métricas en incremento contínuo, lo cual es una mala señal. • Problemas puntuales: reinicio del servidor diario (para rotado de logs), ejecución del mantenimiento programado de base de datos, u otros scripts que se ejecuten en el servidor o 265
Methodology in detail
el servidor de BBBDD. • Problemas de red, derivados de procesos no relacionados (p.e: backup de un servidor en la red) que afecten a la velocidad/disponibilidad de la red. 20.3.4. Servidor de Plugins, Red (open) y HTTP Aqui aplica el mismo concepto que arriba, pero de forma mas simplificada. Habra que controlar: • Nº de hilos. • Timeouts (para calcular la incidencia en el peor de los casos). • Tiempo medio de chequeo. Dimensionar con esos datos un conjunto de prueba, y verificar que la capacidad del servidor es constante a lo largo del tiempo. 20.3.5. Recepción de traps Aqui el supuesto es más sencillo: Partimos que el sistema no va a recibir traps de forma constante, sino que más bien se trata de evaluar la respuesta ante una avalancha de traps, de los cuales, algunos generarán alertas. Para ello simplemente hay que hacer un script sencillo que genere traps de forma controlada a gran velocidad: #!/bin/bash
TARGET=192.168.1.1
while [ 1 ]
do
snmptrap -v 1 -c public $TARGET .1.3.6.1.4.1.2789.2005 192.168.5.2 6 666
1233433 .1.3.6.1.4.1.2789.2005.1 s "$RANDOM"
done
NOTA: Cortarlo con CTRLC a los pocos segundos, pues generará cientos de traps en pocos segundos. Una vez montado el entorno hay que validar los siguientes supuestos: 1. Inyección de traps a una tasa constante (basta con meter un sleep 1 al script anterior dentro del bucle while, para generar 1 trap/seg. Se deja el sistema operando 48hr y se evalúa el impacto en el servidor. 2. Tormenta de traps. Evaluar el antes, el durante, y la recuperación ante una tormenta de traps. 3. Efectos del sistema sobre una tabla de traps muy grande (>50,000). Esto incluye el efecto de pasar el mantenimiento de la bbdd. 20.3.6. Eventos De forma similar a los SNMP, evaluaremos el sistema en dos supuestos: 1. Tasa normal de recepción de eventos. Esto ya se ha probado en el servidor de datos, pues en cada cambia de estado, se genera un evento. 2. Tormenta de generación de eventos. Para ello, forzaremos la generación de eventos via CLI. Utilizando el comando siguiente: /usr/share/pandora_server/util/pandora_manage.pl /etc/pandora/pandora_server.conf
--create_event "Prueba de evento" system Pruebas
266
Methodology in detail
Nota: Suponemos que existe un grupo llamado "Pruebas". Ese comando, usado en un bucle como el usado para generar traps se puede usar para generar decenas de eventos por segundo. Se puede paralelizar en un script con varias instancias para provocar un nº mas alto de inserciones. Esto serviría para simular el comportamiento del sistema ante una tormenta de eventos. De esta forma podríamos probar el sistema, antes, durante y después de una tormenta de eventos. 20.3.7. Concurrencia de usuarios Para ello usaremos otro servidor independiente de Pandora, utilizando la funcionalidad de monitorización WEB. Realizaremos una sesión de usuario donde realizaremos las siguientes tareas en este orden, y mediremos lo que tardan. 1.
2.
3.
4.
5.
Login en la consola. Ver eventos. Ir a la vista de grupo. Ir a la vista de detalle de agente Visualizar un informe (en HTML). Dicho informe debería contener un par de gráficas y un par de modulos con informes de tipo SUMA o MEDIA. El intervalo de cada elemento debería ser de una semana o cinco días. 6. Visualización de una gráfica combinada (24hr). 7. Generación de informe en PDF (otro informe diferente). Se realiza esta prueba con al menos tres usuarios diferentes. Se puede paralelizar esa tarea para ejecutarla cada minuto, de forma que si hay 5 tareas (cada uno con su usuario), estaríamos simulando la navegación de cinco usuarios simultáneos. Una vez establecido el entorno, tendremos en cuenta: 1. . La velocidad media de cada modulo es relevante de cara a identificar "cuellos de botella" relacionados con otras actividades paralelas, como la ejecución de script de mantenimiento, etc. 2. . Se medirá el impacto de CPU/Memoria en el servidor para cada sesión concurrent. 3. . Se medirá el impacto de cada sesión de usuario simulada respecto al tiempo medio del resto de sesiones. Es decir, se debería estimar cuantos segundos de demora añade cada sesión extra simultánea. 267
Methodology in detail
21 ADVISES FOR USING ORACLE DB 268
General Advises for using Oracle 21.1. General Advises for using Oracle One of techniques used to promote the Oracle DB administration consist on separate the table index in different tablespace, so in case that the index tablespace get lost, we could recover the information from the tables. In order to could do this before creating the Pandora sketch, you should follow the following steps from an Oracle client such as SQL*plus: CREATE TABLESPACE "PANDORA" LOGGING DATAFILE '<ruta_fichero>/PANDORADAT.dbf' SIZE
1024M EXTENT MANAGEMENT LOCAL SEGMENT SPACE MANAGEMENT AUTO;
CREATE TABLESPACE "PANDORA_DX" LOGGING DATAFILE '<ruta_fichero>/PANDORADAT_DBX.dbf'
SIZE 512M EXTENT MANAGEMENT LOCAL SEGMENT SPACE MANAGEMENT
AUTO;
CREATE USER "PANDORA" PROFILE "DEFAULT" IDENTIFIED BY "<contraseña>" DEFAULT
TABLESPACE "PANDORA" TEMPORARY TABLESPACE "TEMP" ACCOUNT UNLOCK;
GRANT "CONNECT" TO "PANDORA";
GRANT "RESOURCE" TO "PANDORA";
GRANT
GRANT
GRANT
GRANT
GRANT
GRANT
GRANT
GRANT
GRANT
GRANT
GRANT
GRANT
GRANT
GRANT
GRANT
GRANT
GRANT
GRANT
GRANT
GRANT
GRANT
GRANT
GRANT
GRANT
ALTER ANY INDEX TO "PANDORA";
ALTER ANY SEQUENCE TO "PANDORA";
ALTER ANY TABLE TO "PANDORA";
ALTER ANY TRIGGER TO "PANDORA";
CREATE ANY INDEX TO "PANDORA";
CREATE ANY SEQUENCE TO "PANDORA";
CREATE ANY SYNONYM TO "PANDORA";
CREATE ANY TABLE TO "PANDORA";
CREATE ANY TRIGGER TO "PANDORA";
CREATE ANY VIEW TO "PANDORA";
CREATE PROCEDURE TO "PANDORA";
CREATE PUBLIC SYNONYM TO "PANDORA";
CREATE TRIGGER TO "PANDORA";
CREATE VIEW TO "PANDORA";
DELETE ANY TABLE TO "PANDORA";
DROP ANY INDEX TO "PANDORA";
DROP ANY SEQUENCE TO "PANDORA";
DROP ANY TABLE TO "PANDORA";
DROP ANY TRIGGER TO "PANDORA";
DROP ANY VIEW TO "PANDORA";
INSERT ANY TABLE TO "PANDORA";
QUERY REWRITE TO "PANDORA";
SELECT ANY TABLE TO "PANDORA";
UNLIMITED TABLESPACE TO "PANDORA";
Doing this, we create an sketch with the name Pandora and the tablespace PANDORA for tables and Pandora_DX for index. When you create the index instead using the sentence of the file pandoradb.oracle.sql: CREATE INDEX taddress_ip_idx ON taddress(ip);
Change it for the sentence: CREATE INDEX taddress_ip_idx ON taddress(ip) TABLESPACE PANDORA_DX;
In all index creations. 269
General Advises for using Oracle 22 HWGSTE TEMPERATURE SENSOR CONFIGURATION
270
Introduction 22.1. Introduction In this configuration quick guide we're going to learn, step by step, how to use Pandora to monitor a HWgSTE Temperature Sensor. We will assign alerts via eMail and generate a basic report as well. 22.2. Installation and configuration 22.2.1. Step #1. Pandora installation Take a look at the installation manual or begin from a preinstalled Pandora with a virtual image (links). 22.2.2. Step #2. Sensor installation Let's get started with the HWgSTE sensor: Manufacturer
documentation:
STE/STE_ip_temperature_sensor_en.html http://www.hwgroup.com/products/HWg
Sensor manual: http://www.hwgroup.com/download/HWgSTE_MAN_en.pdf It is really important to take care while configuring the IP address to access the temperature sensor and make sure it is connected. We also need to know its OID. For this purpose, we must access and configure the device via web: 271
Installation and configuration In the screen "System → TXT List of common SNMP OID's" we can check the OID of our sensor: Since we only have one sensor, the OID will be: .1.3.6.1.4.1.21796.4.1.3.1.5.1
It is important to note that the device returns the temperature in degrees and without decimal comma in the output. If we want to show the real value, we will have to divide this value by 10. This postprocess can be done in Pandora. And the IP address: 272
Installation and configuration 22.2.3. Step #3. Configuring the sensor in Pandora Let's go to the agent configuration screen. There we are going to create a new agent and fill all the relevant information. This agent must have the same IP address we've just configured in the sensor.: 273
Installation and configuration I have associated it to the Servers group, but it is possible to change it later if I decide to create a Sensors group. Let's define a SNMP module. Go to the module screen: Create a module which type is "SNMP Numeric Data Module". 274
Installation and configuration The SNMP OID field must be filled with the one obtained previously. SNMP community is "public" by default. I need to open the advanced section, to specify a postprocess which can divide the result by 10. Time to click on the "Create" button: Right after creating the module, we should see something like this: If we click in the bulb button... (modules) 275
Installation and configuration The previous look the new module had should have changed, and appear without the red triangle icon, by initialising it: If we take a look to the agent view... (Magnifying glass) We will be able to see the data we've gathered from the sensor: Module is up and running. In a matter of hours we will have enough data to display a graphic like this: 22.2.4. Step #4. Configuring an alert When temperature reaches a value over 38 degrees, we want an alert to be generated via email. The first thing we have to do is to configure the module, so it gets into critical status when its value gets over 38 degrees. Let's edit the module... (click on the key, inside the edition view or the agent data view) 276
Installation and configuration We need to modify the ranges so the module gets into critical status over 38ºC: Now we will have to define an alert action to send an email to a specific email address. Let's go to the menu Administration > Manage alerts > Actions to create a new one. We are going to define an generic alert action to send an email, so we can use it with any moudule entering into a CRITICAL status: After creating the action, we only have to define an alert in the agent which contains the sensor module. To achieve this, we need to edit the agent by going to the alerts sections: Create a new alert, starting from the default template alert "Critical condition": 277
Installation and configuration OK... the new alert is ready. We should see something like this: 22.2.5. Step #5. Creating a basic report
Finally, once we have completed the previous steps, it is time to create a report which will contain a basic temperature graphic, with the average and maximum values. Let's go to the menu Administration → Reports → Create report: Click on the key button so we can add new elements to the report. Choose a "Simple graph" element type. 278
Installation and configuration Following the same procedure, create other two elements with types "AVG (Average value)" and "MAX (Maximum value)" respectively. Once created, in order to view it, we need to click in the report view button (first to the left). Another choice is to go to the menu Operation > Report and click on the report we've just created. The report should look like this (once it has enough data, after some hours/days). 279
Installation and configuration 280
Installation and configuration 23 ENERGY EFFICIENCY WITH PANDORA FMS 281
Energy Efficiency with Pandora FMS Sustainability and energy efficiency are saving. Different manufacturers, both software and hardware. They propose different methods, strategies and tools. Pandora FMS can integrate all of them in a single tool. 23.1. IPMI plugin for Pandora FMS IPMI (Intelligent Platform Management Interface) is an interface created by Intel in order to administrate and monitor IT systems. Through IPMI, for example, check the temperature sensors, voltages and ventilator velocity, all of them in a remote way. 23.1.1. Working of the IPMI plugin
Monitoring through IPMI is based on two components:A plugin that collects data from the device and a Recon Task that discover in an authomatic way all the devices of one network that supports IPMI. 23.1.2. Installing the Plugin and the Recon task
23.1.2.1. Prerequisites Both the plugin and the recon task needs the tool FreeIPMI from its version 0.7.16 In Debian distributions, it's possible to use the command: #apt-get install freeipmi-tools
282
IPMI plugin for Pandora FMS 23.1.2.2. Register of the IPMI plugin The first step is to register the plugin. If you have any doubt, you can check the section Monitoring with plugins. The parameters of the plugin registration are the following ones: The values that you should enter in the different fields are these: •
•
•
•
•
•
•
•
•
Name: IPMI Plugin Plugin Command: /home/admin/ipmiplugin.pl (Path where is the ipmiplugin.pl file ) Plugin type: Standard Max. timeout: 300 IP address option: h Port option: <vacio> User option: u Password option: p Description: This plugin gets information from IPMI devices. It's very important to use "IPMI Plugin" for plugin name because the correct behavior
of recon task depends on it
283
IPMI plugin for Pandora FMS 23.1.2.3. Registration of the Recon Script The second step to finish the installation is to register the Recon Script. You can see the complete process of registration at section Recon Server. The registered plugin will be like this • Name: IPMI Discovery • Script fullpath: /home/admin/ipmirecon.pl (Path where is the ipmirecon.pl file) 23.1.3. Monitoring with the IPMI plugin To start the monitoring we need to create a Recon Task that discovers all the IPMI devices. This task will create one agent by each device discovered, and the modules with all the available checks for each device. The following screenshot shows an example to explore the network 192.168.70.0/24 in it all the IPMI devicew have as credentials admin/admin, 284
IPMI plugin for Pandora FMS With this configuration, the Recon Task will do a network discovery and will create one agent by each device found with all the available modules. In the following image you can see the end result, some of the modules created in one agent of the explored network. 285
IPMI plugin for Pandora FMS 286
IPMI plugin for Pandora FMS 24 NETWORK MONITORING WITH IPTRAF 287
Introduction 24.1. Introduction Pandora FMS allows you to monitor network traffic statistics processed by IPTraf. IPTraf collects network activity statistics from one or all interfaces and stores all information in a logfile. A passive collector filters the information based on rules and creates a tree structure with all the information. One XML file per IP detected will be generated using the network activity information contained in the tree structure. Once XML files are processed, one agent per IP detected will appear in Pandora FMS, these agents will have several modules with their network traffic information. 24.2. How it works The passive collector is a script called passive.pl. This script parses the information and generates XML files in an asyncronous mode. So you must execute th script every time you want to update traffic monitoring information in Pandora FMS. The script must be executed with root privileges
Before the script is executed IPTraf process must be stopped. After the script execution
the log file used must be deleted and IPTraf process must be restarted
In execution command the configuration file is passed as parameter, like this: # ./passive.pl /home/usuario/iptraf/passive.collector.conf
The steps to execute the scripts are the following: 1.
2.
3.
4.
Stop IPTraf Run passive collector Delete logfile Start IPTraf The actions performed by the scripts are the following: 1.
2.
3.
4.
5.
6.
Parse logfile Apply discard rules Apply process rules Create tree with all information Generate XML files and store in data_in folder of Pandora FMS End execution 24.3. Configuration The configuration file called passive.collector.conf has the following parameters: 288
Configuration • incomingdir: Full path of data_in folder of Pandora. • interval: Interval (in seconds) of script execution. This parameter doesn't mean the scrip will be executed each interval, it is used to set the module and agent intervals in Pandora FMS and allow you to know when the agents and modules are in unknown status. The script execution time is controlled externaly. • iface: Interface name which is listening for network traffic. • min_size: Its possible to filter records based on a minimum size, disabled with value 0. • log_path: Full path of IPTraf logfile. • rules: There are two kind of rules: 1. discard : Discard rules are executed first and discard the records that match these rules. 2. process : Process rules are executed in second place and filter the remaining records which will be included in the tree. 24.4. Filtering rules To understand filtering rules first we must understand IPTraf logfile structure. 24.4.1. IPTraf logfile structure And example of a log line is: Mon Nov 22 15:41:59 2010; TCP; eth0; 52 bytes; from 192.168.50.2:54879 to
91.121.0.208:80; first packet
After the date and hour record there is the protocol, the interface name, the number of bytes transfered, the source ip and port and the destination ip and port. After will appear some information in this case indicates this communication is the first package. Important data in this line are the interface name, the number of bytes transfered, the source IP and port and the destination IP and port. 24.4.2. Collector filtering rules The rules have the following structure: [process/discard] [!][ip_src/ip_dst] ip/mask [!][port_src/port_dst] port [!]
[protocol] protocol
The first parameter could be process if you want to process the records which match this rule or discard if you want to discard the record that match. The second parameter set the match with source (ip_src) or destination IP (ip_dst). This parameter could be denied with the character (!) before, indicating we want the records that DON'T match with this IP. The third parameter is an IP following by a network mask. If you want only an IP you can set the IP without mask or the mask 32. If a mask is specified all IP in the range will be considered. For example, 192.168.50.0/24 will be IPs in range 192.168.50.1192.168.50.254. Otherwise 192.168.50.23 y 192.168.50.23/32 are the same IP 192.168.50.23. 289
Filtering rules The fourth parameter is similar to second one but this time the instead of IP we will filter by source (port_src) or destination port (port_dst). Also it is possible to use character (!) before port to denied these ports. The fifht parameter are the port numbers which will be used to match the record. You can specify the following parameters: • One port with a number. For example 8080. • An interval separated by a dash character. For example 2134 to match all ports from 21 to 34 both included. • A port enumeration separated by comma. For example 21,23,80,8080. • A combination of intervals and enumerations. For example 2134,80,8080,4323443244. The sixth parameter is the protocol used to perform the communication. This parameter could be denied with character (!) before, it indicates you want the records which DON'T match with this protocol. es el protocolo por el que se realiza la comunicacion. Este parametro puede ir negado con el caracter de exclamacion (!) delante, indicando que queremos los registros que NO coincidan con ese protocolo. You can use the following formats: • A protocol. For example TCP. • Several protocol separated by comma. For example TCP,UDP,FTP. • A special word "all" to match all protocols. 24.4.2.1. Examples Some valid rules are: discard src_ip 192.168.70.222/32 !port_dst 21-23,80,8080 protocol all
process src_ip 192.168.70.0/24 !port_src 0 !protocol TCP
process src_ip 192.168.80.0/24 !port_dst 80,8080 protocol UDP,TCP
These rules will process the following records: • All records with source IP an IP in network 192.168.80.X while don't have 80 or 8080 as destination port and use TCP or UDP protocols. • All records with source IP in network 192.168.70.X with any source port that don't use TCP protocol except record discard by the first rule. The first rule discard record with source IP 192.168.70.222 and destination port different from 21,22,23,80 and 8080 using any protocol. 24.5. Data generated The data generated by passive collecter are XML files. An XML file per IP detected that match the rules is generated. These files are copied in the path defined in parameter incomingdir of configuration file which must be the path to data_in folder of Pandora. The XML content are modules of Pandora FMS which have the network statistics for this IP. An example of XML file could be like this: <agent_data interval='300' os_name='Network' os_vesion='4.0.2' version='N/A'
timestamp='AUTO'
address='192.168.70.1' agent_name='IP_192.168.70.1'>
<module>
290
Data generated <name>Port_67</name>
<type>async_data</type>
<description>Total bytes of port 67</description>
<interval>300</interval>
<data>1312</data>
</module>
<module>
<name>Port_67_Protocol_UDP</name>
<type>async_data</type>
<description>Total bytes of port 67 for protocol UDP</description>
<interval>300</interval>
<data>1312</data>
</module>
<module>
<name>IP_192.168.70.141</name>
<type>async_data</type>
<description>Total bytes of IP 192.168.70.141</description>
<interval>300</interval>
<data>1312</data>
</module>
<module>
<name>IP_192.168.70.141_Port_67</name>
<type>async_data</type>
<description>Total bytes of IP 192.168.70.141 for port 67</description>
<interval>300</interval>
<data>1312</data>
</module>
<module>
<name>Protocol_UDP</name>
<type>async_data</type>
<description>Total bytes of Protocol UDP</description>
<interval>300</interval>
<data>1312</data>
</module>
</agent_data>
291
Data generated 25 BACKUP PROCEDURE
292
Purpose
25.1. Purpose
The purpose of this document is to illustrate the backup and restore procedures of Pandora FMS v4.1 appliance. 25.2. Database backup
First, we need to backup the existing database: mysqldump -u <pandora_db_user> -p <pandora_db_name> | gzip > pandoradb.sql.gz
<enter the password in console>
Caution: If you use a history database, you must perform a backup of it as well. 25.3. Configuration files backup
In order to backup Pandora's agents and server configuration files, we type: tar -pcvzf pandora_configuration.tar.gz /etc/pandora/*.conf
25.4. Agent backup
We also need to backup the agent folder. This is very important to maintain the already deployed collections and the agent plugins. tar -pcvzf agent.tar.gz /usr/share/pandora_agent
25.5. Server backup
25.5.1. Server plugins
The default folder of the server plugins is under /usr/share/pandora_server (the main Pandora's server folder). Caution: If you have server plugins placed in other folders, you must backup them as well. tar -pcvzf pandora_server.tar.gz /usr/share/pandora_server
tar -pcvzf my_plugin_folder.tar.gz /home/myuser/my_plugin_folder
25.5.2. Remote configuration
A backup of the remote configuration files and collections must be performed in order to maintain the remote agent's normal behavior 293
Server backup
tar -pcvzf collections.tar.gz /var/spool/pandora/data_in/collections
tar -pcvzf md5.tar.gz /var/spool/pandora/data_in/md5
tar -pcvzf remote_agents_conf.tar.gz /var/spool/pandora/data_in/conf
25.6. Console backup
We now perform a backup of the console, so we mantain our custom images, extensions, and more. tar -pcvzf pandora_console.tar.gz /var/www/html/pandora_console
294
Console backup
26 RESTORE PROCEDURE
295
Install the 4.1 appliance
26.1. Install the 4.1 appliance
Insert the CD in your system and press a key in the boot screen. The boot menu will be displayed then. If you select "Install (Text mode) the installation will be performed in text mode. However, if you choose the Install option, the graphical installation will start (recommended). Choose between one of these two options, and reboot the machine after the installation. 26.2. Database restore
Make sure that your database is up and running, and the Pandora's server and agent are stopped. [root@localhost ~]# /etc/init.d/mysqld start
Starting mysqld: [ OK ]
[root@localhost ~]# /etc/init.d/pandora_server stop
Stopping Pandora FMS Server
[root@localhost ~]# /etc/init.d/pandora_agent_daemon stop
Stopping Pandora Agent.
Then, we restore the database [root@localhost ~]# gunzip pandora.sql.gz
[root@localhost ~]# cat pandora.sql | mysql -u root -p pandora
296
Database restore
Enter password: <enter the password in console>
Caution: If you use a history database, you must perform a restore of it as well. 26.3. Configuration files restore
First, we restore the agents and server configuration files: [root@localhost ~]# tar -zxvf pandora_configuration.tar.gz -C /
26.4. Agent restore
Now, we perform the restore of the agent directory [root@localhost ~]# tar -zxvf agent.tar.gz -C /
26.5. Server restore
26.5.1. Server plugins
We restore the pandora server main folder, and every other plugin folder that you may have. [root@localhost ~]# tar -zxvf pandora_server.tar.gz -C /
[root@localhost ~]# tar -zxvf my_plugin_folder.tar.gz -C /
26.5.2. Remote configuration
A restore of the remote configuration files and collections must be performed in order to maintain the remote agent's normal behavior. [root@localhost ~]# tar -zxvf collections.tar.gz -C /
[root@localhost ~]# tar -zxvf md5.tar.gz -C /
[root@localhost ~]# tar -zxvf remote_agents_conf.tar.gz -C /
26.6. Console restore
We now perform a restore of the console, so we mantain our custom images, extensions, and more. [root@localhost ~]# tar -zxvf pandora_console.tar.gz -C /
26.7. Starting Pandora FMS server and agent
The last step, is to start the Pandora FMS server, and agent. 297
Starting Pandora FMS server and agent
[root@localhost ~]# /etc/init.d/pandora_server start
[root@localhost ~]# /etc/init.d/pandora_agent_daemon start
298
Starting Pandora FMS server and agent
27 DEVELOPMENT IN PANDORA FMS 299
Pandora FMS Code architecture 27.1. Pandora FMS Code architecture 27.1.1. How to make compatible links For all links you must use the ui_get_full_url function. • How to use ui_get_full_url Before the call you must include "functions_ui.php".
• You need the url for the refresh:
For example
$url_refresh = ui_get_full_url();
• You need the url for a relative path
For example
Old method $url = $config['homeurl'] . "/relative/path/file_script.php";
New method $url = ui_get_full_url("/relative/path/file_script.php");
• And in javascript? It is just as easy.
For example
Old method <?php
...
$url = $config['homeurl'] . "/relative/path/file_script.php";
...
?>
<script type="text/javascript>
...
jQuery.post ('<?php $url; ?>',
{
...
});
...
</script>
New method <?php
...
$url = ui_get_full_url("/relative/path/file_script.php");
300
Pandora FMS Code architecture ...
?>
<script type="text/javascript>
...
jQuery.post ('<?php $url; ?>',
{
...
});
...
</script>
• Special cases: • For direct links to index.php it is not necessary to use this function.
For example
echo '<form method="post" action="index.php?
param=111¶m=222¶m=333¶m=444¶m=555¶m=666">';
27.1.2. The entry points of execution in Pandora Console
Pandora Console only has a small amount of entry points to execute the web application. This is unlike other web applications like for example Wordpress that have only one entry point in the front end and another one in the back end. Or at the other end for example small web applications designed for SMB where each php file is usually an entry point. 27.1.2.1. Installation
This entry point is for the installation of Pandora Console and the data base. When the installation is finished Pandora Console advises the deletion of this file for security reasons. install.php
27.1.2.2. Normal execution
All interactions between the user and the console by use of their browser are made through this entry point. index.php
27.1.2.3. AJAX requests
All AJAX requests are through this file, this is because it is necessary to enforce major caution (check the users permission) with this type of actions. It provides consistent structure while also allowing easy maintenance. The actions through this file must pass by means of a GET or POST the parameter "page" that is the relative direction of the script to be executed in the AJAX request. ajax.php
301
Pandora FMS Code architecture 27.1.2.4. Mobile console
Pandora FMS has a simplified Pandora Console version for small screen mobile terminals, it is simplified in design and functionality to allow easy interaction with Pandora Console from portable devices. mobile/index.php
27.1.2.5. API
From version 3.1 of Pandora FMS, there is included an API of type REST so that third party apps can interact with Pandora FMS across port 80 using the HTTP protocol. The script must follow these 3 security points: • The client IP must be in the list of valid IPs or match with any regex in this list. This list is set in the Pandora FMS setup. • Must pass the parameter with the API password, this password is also set in Pandora FMS setup. • Must pass the user and password as parameters, this user must have permissions to execute these actions in the API. include/api.php
27.1.2.6. Special cases
In Pandora Console there are several special cases for entry points, these are to avoid the interactive login or general process that make it the main entry point (index.php from root). Extensión Cron Task
This extension is called by the wget command in the cron, and can execute a limited number of tasks without having logged in. enterprise/extensions/cron/cron.php
External view Visual Console
This script generates a page with the view of the Visual Console in full screen (without menus), it doesn't require a login, although for the authentication a hash is needed, this hash is generated by each Visual Console. operation/visual_console/public_console.php
Popup detail of Console Networkmap
A popup window that shows the agent detail for any item in the Networkmap Console. This uses for authentication the session values from the user logged into Pandora Console. enterprise/operation/agentes/networkmap_enterprise.popup.php
302
Pandora FMS Code architecture Popup Module Graph
A popup window that shows a module graph, this window has parameters that can be configured to change how the graph is shown. This uses for authentication the session values from the user logged into Pandora Console. operation/agentes/stat_win.php
Static graphs
The static graphs are image files that are generated by PHP script, if there is a large amount of data then it saves a serialid in special files that the script creates, these serialized files have a life time so as to avoid bad access and DOS attack. The execution of this file doesn't require authentication in Pandora. include/graphs/fgraph.php
Reports
27.1.2.6.1.1.
CSV Reports
This script generates a text file that contains the data in CSV format. This script uses the authentication of the logged in user. enterprise/operation/reporting/reporting_viewer_csv.php
27.1.2.6.1.2.
PDF Report
This script generates a PDF file. This script uses the authentication of the logged in user. enterprise/operation/reporting/reporting_viewer_pdf.php
Events
27.1.2.6.1.3.
Poput Sound Events
This popup window checks periodically for new events and informs with sound events. This script uses the authentication of the logged in user. operation/events/sound_events.php
27.1.2.6.1.4.
CSV Events
This script generates a text file that contains the data in CSV format. This script uses the authentication of the logged in user. operation/events/export_csv.php
303
Pandora FMS Code architecture 27.1.2.6.1.5.
Event marquee
The popup window shows a marquee with the new events in Pandora. For authentication it uses the API password. operation/events/events_marquee.php
27.1.2.6.1.6.
RSS events
This script generates a text file that contains the events in RSS format. This script uses the authentication of the logged in user. operation/events/events_rss.php
27.2. Basic functions for agent, module and group status 27.2.1. Status criteria and DB encoding Agent status description: • Critical (red color): 1 or more modules in critical status. • Warning (yellow color): 1 or more modules in warning status and none in critical status. • Unknown (grey color): 1 or more modules in unknown status and none in critical or warning status. • OK (green color): all modules in normal status. Internal DB status encoding: •
•
•
•
Critical: 1 Warning: 2 Unknown: 3 Ok: 0 27.2.2. Agents 27.2.2.1. Status functions These functions return the number of monitors filtered by status or alert fired by an agent. For all functions the filter parameter was added to make the function more flexible. The filter content is added at the end of the sql query for all functions. With this filter you can add some specific sql clauses to create filters using tables: tagente_estado, tagente and tagente_modulo. • agents_monitor_critical ($id_agent, $filter=""): Returns the number of critical modules for this agent. • agents_monitor_warning ($id_agent, $filter=""): Returns the number of warning modules for this agent. • agents_monitor_unknown ($id_agent, $filter=""): Returns the number of modules with unknown status. • agents_monitor_ok ($id_agent, $filter=""): Returns the number of modules with normal 304
Basic functions for agent, module and group status status. • agents_get_alerts_fired ($id_agent, $filter=""): Returns the number of alerts fired for this agent. 27.2.2.2. Auxiliar functions These functions perform some typical tasks related to agents in some views: • agents_tree_view_alert_img ($alert_fired): Returns the path to alerts image for tree view depending on the number of alert fired. • agetns_tree_view_status_img ($critical, $warning, $unknown): Returns the path to status image for tree view 27.2.3. Groups These functions return the statistics of agents and modules based on agent groups defined in Pandora. Be careful! The server and console functions must use the same sql queries in order to
ensure the result is calculated in the same way
27.2.3.1. Server functions • pandora_group_statistics: This function calculates the group statistics when parameter Use realtime statistics is switched off. 27.2.3.2. Console functions The console functions calculate the satistics based on an array of agents groups. These functions don't return disabled agents or modules. • groups_agent_unknown ($group_array): Returns the number of agents with unknown status for a given set of groups. • groups_agent_ok ($group_array): Returns the number of agents with normal status for a given set of groups. • groups_agent_critical ($group_array): Returns the number of agents with critical status for a given set of groups. • groups_agent_warning ($group_array): Returns the number of agents with warning status for a given set of groups. These functions calculate statistics for modules. Doesn't use disabled modules or agents. • groups_monitor_not_init ($group_array): Returns the number of monitors with noninit status for a given set of groups. • groups_monitor_ok ($group_array): Returns the number of monitors with normal status for a given set of groups. • groups_monitor_critical ($group_array): Returns the number of monitors with critical status for a given set of groups. 305
Basic functions for agent, module and group status • groups_monitor_warning ($group_array): Returns the number of monitors with warning status for a given set of groups. • groups_monitor_unknown ($group_array): Returns the number of monitors with unknown status for a given set of groups. • groups_monitor_alerts ($group_array): Returns the number of monitors with alerts for a given set of groups. • groups_monitor_fired_alerts ($group_array): Returns the number of monitors with alerts fired for a given set of groups. 27.2.4. Modules These functions return the statistics based on module name. Doesn't use disabled agents or modules for the stats. • modules_agents_unknown ($module_name): Returns the number of agents with unknown status that have a module with the given name. • modules_agents_ok ($module_name): Returns the number of agents with normal status that have a module with the given name. • modules_agents_critical ($module_name): Returns the number of agents with critical status that have a module with the given name. • modules_agents_warning ($module_name): Returns the number of agents with warning status that have a module with the given name. These functions return the statistics based on module groups. Doesn't use disabled agents or modules for the stats. • modules_group_agent_unknown ($module_group): Returns the number of agents with unknown status which have modules that belong to the given module group. • modules_group_agent_ok ($module_group): Returns the number of agents with normal status which have modules that belong to the given module group. • modules_group_agent_critical ($module_group): Returns the number of agents with critical status which have modules that belong to the given module group. • modules_group_agent_warning ($module_group): Returns the number of agents with warning status which have modules that belong to the given module group. 27.2.5. Policies These functions return the number of agents with each status for a given policy. Doesn't use disabled agents or modules to calculate the result. • policies_agents_critical ($id_policy): Returns the number of agents with critical status which belong to given policy. • policies_agents_ok ($id_policy): Returns the number of agents with normal status which belong to given policy. • policies_agents_unknown ($id_policy): Returns the number of agents with unknown status which belong to given policy. • policies_agents_warning ($id_policy): Returns the number of agents with warning status which belong to given policy. 306
Basic functions for agent, module and group status 27.2.6. OS These functions calculate the statistics for agents based on Operating Systems. Doesn't use disabled agents or modules. • os_agents_critical ($id_os): Return the number of agents with critical status which has the given OS. • os_agents_ok($id_os): Return the number of agents with critical normal which has the given OS. • os_agents_warning ($id_os): Return the number of agents with critical warning which has the given OS. • os_agents_unknown ($id_os): Return the number of agents with critical unknown which has the given OS. 27.3. Development Most extensions have been described as independent index, specific for the creation of: server plugin, Unix agent plugin and console extensions. In this section it is described how to collaborate in Pandora FMS and how to compile the Window agent from source. In the future, any other subject related with the development that doesn't have a specific index will be in this chapter. 27.3.1. Cooperating with Pandora FMS project This project is supported by voluntary developers that support the project. New developers,documentation editors, or people who want to cooperate is always welcome. A good way to start is to subscribe to our mail list and/or to the forum. 27.3.2. Subversion (SVN) Pandora FMS development is done through SVN (code revision control system).You can find more information about how to enter in the SVN repositories at: OpenIdeas Wiki. Our SVN system is a public one, and is located in Sourceforge: • Navigating: http://sourceforge.net/p/pandora/code/HEAD/tree/ Using the SVN client command line: svn co https://svn.code.sf.net/p/pandora/code/ pandora
27.3.3. Bugs / Failures Reporting errors helps us to improve Pandora FMS. Please, before sending an error report, check our database for bugs and in case of detecting a non reported one, send it using the Sourceforge tool for tracking and reporting of errors on the Project WEB:http://sourceforge.net/projects/pandora/ 27.3.4. Mailing Lists Mailing Lists are good, and they are also an easy way of keeping uptodate. We have a public mailing list for users and news (with low traffic) and a developer mail list for technical debates and notifications (sometimes daily) of the development through our SVN (code version control system) 307
Development automatic notification system. 27.4. Compiling Windows agent from source 27.4.1. Get the latest source To get the latest source from our repository you will need a Subversion client. Then execute this: svn co https://svn.sourceforge.net/svnroot/pandora pandora
27.4.2. Windows In order to build from source, you will need the latest DevCpp IDE version, with the MinGW tools. Download it from here. Open PandoraAgent.dev with DevCpp and construct the project. Everything should compile for a default installation. If you encounter any problem when building from source, please contact us by email ([email protected]) or the SourceForge project web. 27.4.3. Crosscompiling from Linux To crosscompile the Pandora FMS Windows Agent from Linux follow this steps: 27.4.3.1. Installing MinGW for Linux
For Ubuntu/Debian: sudo aptitude install mingw32
For SUSE or RPM compatible environments (with Zypper of manually) from this URL http://download.opensuse.org/repositories/CrossToolchain:/mingw/openSUSE_11.1/
27.4.3.2. Installing the extra libraries needed by the agent
•
•
•
•
•
•
win32api odbc++ curl openssl zlib Boost C++ libraries (http://sourceforge.net/projects/boost/files/) For example, to install Openssl package: Go to http://sourceforge.net/projects/devpaks/files and download the file openssl-0.9.8e-1cm.DevPak
308
Compiling Windows agent from source Uncompress the file openssl0.9.8e1cm.DevPak: tar jxvf openssl-0.9.8e-1cm.DevPak
Copy the libraries and include files to your crossed compiled environment with MinGW: cp lib/*.a /usr/i586-mingw32msvc/lib/
cp -r include/* /usr/i586-mingw32msvc/include/
There is a faster alternative, but you need to solve problems with dependencies/libraries yourself: We have made a tarball with all needed libraries and included files available on official Pandora FMS project download site. This is called mingw_pandorawin32_libraries_9Oct2009.tar.gz 27.4.3.3. Compiling and linking
After installing compiler, includes and libraries, go to the Pandora FMS Agent source directory and run: ./configure --host=i586-mingw32msvc && make
This should create the .exe executable, ready to be used. 27.5. External API There is an external API for Pandora FMS in order to link other applications with Pandora FMS, both to obtain information from Pandora FMS and to enter information into Pandora FMS. All this documentation is at Pandora FMS External API 27.6. Pandora FMS XML data file format Knowing the format of Pandora FMS XML data files can help you to improve agent plugins, create custom agents or just feed custom XML files to the Pandora FMS Data Server. As any XML document, the data file should begin with an XML declaration: <?xml version='1.0' encoding='UTF-8'?>
Next comes the agent_data element, that defines the agent sending the data. It supports the following attributes: • description: Agent description. • group: Name of the group the agent belongs to (must exists in Pandora FMS's database). • os_name: Name of the operating system the agent runs in (must exists in Pandora FMS's database). • os_version: Free string describing the version of the operating system. • interval: Agent interval (in seconds). • version: Agent version string. • timestamp: Timestamp indicating when the XML file was generated (YYYY/MM/DD HH:MM:SS). • agent_name: Name of the agent. 309
Pandora FMS XML data file format • timezone_offset: Offset that will be added to the timestamp (in hours). Useful if you are working with UTC timestamps. • parent_agent_name: Name of the agent parent. • address: Agent IP address. For example: <agent_data description= group= os_name='linux' os_version='Ubuntu 10.10'
interval='30' version='3.2(Build 101227)' timestamp='2011/04/20 12:24:03'
agent_name='foo' timezone_offset='0' address='192.168.1.51' parent_agent_name='too'>
Then we need one module element per module, and we can nest the following elements to define the module: •
•
•
•
•
•
•
•
•
•
•
•
•
•
•
name: Name of the module. description: Description of the module. type: Type of the module (must exist in Pandora FMS's database). data: Module data. max: Maximum value of the module. min: Minimum value of the module. post_process: Postprocess value. module_interval: Interval of the module (interval in seconds / agent interval). min_critical: Minimum value for critical status. max_critical: Maximum value for critical status. min_warning: Minimum value for warning status. max_warning: Maximum value for warning status. disabled: Disables (0) or enables (1) the module. Disabled modules are not processed. min_ff_event: FF threshold (see [1]). status: Module status (NORMAL, WARNING or CRITICAL). Warning and critical limits are ignored if the status is set. Any other elements will be saved as extended information for that module in Pandora FMS's database: A module should at least have a name, type and data element. For example: <module>
<name>CPU</name>
<description>CPU usage percentage</description>
<type>generic_data</type>
<data>21</data>
</module>
There can be any number of module elements in an XML data file. Last, do not forget to close the 310
Pandora FMS XML data file format agent_data tag! There is a special case of multiitem XML data, based on a list of items. This is only applicable to string types. The XML will be something like: <module>
<type>async_string</type>
<datalist>
<data><value><![CDATA[xxxxx]]></value></data>
<data><value><![CDATA[yyyyy]]></value></data>
<data><value><![CDATA[zzzzz]]></value></data>
</datalist>
</module>
311
Pandora FMS XML data file format 28 PANDORA FMS EXTERNAL API 312
Pandora FMS External API The Pandora FMS External API is used doing remote calls (through HTTP) on the file /include/api.php. This is the method that has been defined in Pandora FMS to integrate applications from third parts with Pandora FMS. It basically consist on a call with the parameters formated to receive a value or a list of values that after its application it will use to do operations. A call to the API.php is as simple as this: http://<Pandora Console install>/include/api.php<parameters>
The API only can receive the following parameters: • op (compulsory): is the first parameter that specify the nature of the operation, which could be "get" or "set" or "help": • get: returns a value or values.
• set: send a value or values.
• help: returns a little help from the calls
•
•
•
•
•
op2 (compulsory): the call with an explanatory name of the one that works. id (optional): first parameter of the call. id2 (optional): second parameter of the call. other (optional): third parameter of the call, sometimes it could be a list of serial values.. other_mode (optional): format of the serial. list of posible values: • url_encode: el valor de other es un alfanumérico formateado como UrlEncode.
• url_encode_separator_<separador>:the value will be a serial value list with the divider
character, for example:
...other=peras|melones|sandias&other_mode=url_encode_separator_|
• returnType (optional): return format of the value or values. The current available values are: • string: returns the value as it is as an alphanumeric one.
• csv:return the values as a CSV separated by default with the ";" character (fields) and
with CR (files)
• csv_head: returns same as with "csv" except that it adds a first file with the field
names to return.
28.1. Security
At the moment, the security is based on an IPs list that will have access to the tool. And it will be configured as we could see at the image, in the Pandora Console configuration options. If you introduce the character * in the box text, the ACL check will be omitted relegating the security to the protocol and to the environment. In the same way, the character * can be used as wildcard. In example. 183.234.33.* 313
Security
You can also set a password for the actions of the API. In order to setup the password it is necessary to follow these steps: • apipass: Api password configured in the console. You can do it in the following configuration view (Administration>Setup>): Nota: Before the 4.0.2 version, this parameter was pass 314
Security
To access to the actions of the API, is necessary give a valid user and pass of Pandora FMS, too. • user: Valid user of Pandora FMS • pass: The password of the given user Note: In the API calls the passwords are uncodified. So please be careful and use SSL connections to avoid sniffers. The API allows POST petitions to codify it when use SSL/HTTPS. 28.1.1. Return When the API denies the access, a simple string "auth error" is returned. 28.1.2. Examples In this case, is provided the API password 1234 and the access credentials are user: admin and password: pandora. http://127.0.0.1/pandora_console/include/api.php?
op=get&op2=plugins&return_type=csv&other=;&apipass=1234&user=admin&pass=pandora
Access conditions: • The origin IP is in the ACLs IP list • The API password is not setted or is 1234 • The user admin exists and their password is pandora 28.1.3. Security Workflow Starting from version 4.0.2, the API will have several security improvements, and this is implemented by three factors: 315
Security
• IP filtering. Only listed / filtered IP will be allowed to connect the API. • Global API password, if defined, needed to use the API. • User & Password in the console, need to be valid and have permissions to perform the operation requested. This is explained in this workflow: 28.2. New Calls Extension in the API To develop new calls for the API you have to consider that: • The call has to be inscribed as a function in the file <instalación Pandora Console>/include/functions_api.php . • The function must have the next structure: The prefix "api", the kind of operation "get", "set" or "help" (depend if is a data read, data write or retrieve help operation) and the name of the call, trying to be coherent with the operation, as for example:function api_get_[call_name](parameters) . 316
New Calls Extension in the API • The function can have no parameters, but if it have it, the parameters received will be the following in the same order: • id: first operator or parameter, contains an string. • id2: second operator or parameter, contains an string. • other: rest of operators or parameters, contains as an array of two positions: • $other['type']: that could be string or array.
• $other['data']: that will be an string with the parameter or an array of numeric index
with the past parameters.
• returnType: string that specify the kind of return that the call will have. It is usually transparent for you, but you could use or modify it if necessary. 28.2.1. New Calls in the API from the Pandora FMS extensions Is possible to create new API calls without use /include/functions_api.php. The way is adding into a Pandora FMS extension directory a file with the following name: <extension_name>.api.php and into this file create the desired functions with the same considerations of the standard API but with "apiextension" prefix instead of "api". For example, having an extension called "module_groups" with the path <Pandora installation>/extensions/module_groups we must create a file called module_groups.api.php into this directory. Into this file will be the desired functions, for example a function to get the number of modules in a group. This function must have a name like: "apiextension_get_groupmodules". 28.2.1.1. Function example In this function have been used imaginary functions. function apiextension_get_groupmodules($group_name) {
$group_id = group_id_from_name($group_name);
if($group_id == false) {
echo 'Group doesnt exist';
return;
}
$number_of_modules = group_modules($group_id);
echo $number_of_modules;
}
28.2.1.2. Call example This call example gets the number of modules of the group "Servers" http://127.0.0.1/pandora_console/include/api.php?
op=get&op2=extension&ext_name=module_groups&ext_function=groupmodules&id=Servers&api
pass=1234&user=admin&pass=pandora
317
New Calls Extension in the API 28.2.2. API Functions
The following functions could be used in the function code of your call: • returnError(typeError, returnType): gives back an error in an standardized way for all calls. • typeError: by now 'id_not_found' or null.
• returnType: by now 'string' or error message.
• returnData(returnType, data, separator): is the function that returns the API call data. • returnType: that could be 'string', 'csv', 'csv_head'
• data: is an array that contains the data, as well as its format. It has the following fields:
• 'type' (compulsory): that could be 'string' and 'array'.
• 'list_index' (optional): contains a numeric index array containing the
alphanumeric index that are wanted to take out through exit.
• 'data' (compulsory): contains and string with the data or an array of
alphanumeric index or numeric index with the data.
28.2.3. Example
function api_get_module_last_value($idAgentModule, $trash1, $other = ';',
$returnType)
{
$sql = sprintf('SELECT datos FROM tagente_estado WHERE id_agente_modulo
= %d', $idAgentModule);
$value = get_db_value_sql($sql);
if ($value === false) {
switch ($other['type']) {
case 'string':
switch ($other['data']) {
case 'error_message':
default:
returnError('id_not_found',
$returnType);
break;
}
break;
case 'array':
switch ($other['data'][0]) {
case 'error_value':
returnData($returnType, array('type'
=> 'string', 'data' => $other['data'][1]));
break;
}
break;
}
}
else {
$data = array('type' => 'string', 'data' => $value);
returnData($returnType, $data);
}
}
28.3. API Calls
They are divided in two groups, depending on if they get back or write data in Pandora FMS. 318
API Calls
28.3.1. GET
It gets back the required data. 28.3.1.1. get test
Checks the conection to API and returns the version of Pandora Console. Call syntax: Without parameters Examples
This example will return OK,[version],[build] http://127.0.0.1/pandora_console/include/api.php?
op=get&op2=test&apipass=1234&user=admin&pass=pandora
A return sample could be: OK,v4.0.2,PC120614 28.3.1.2. get all_agents
Returns a list of agents filters by the filter in other parameter. Call syntax: •
•
•
•
op=get (compulsory) op2=all_agents (compulsory) return_type=csv (compulsory) other=<parámetros serializados> (optional) serialized parameters to filter the agent search: •
•
•
•
•
•
<filter_so>
<filter_group>
<filter_module_states>
<filter_name>
<filter_policy>
<csv_separator>
Examples
This example will return all agents which id_os is equal to 1, id_group equal to 2, state equal to warning, their agents will contain 'j', and the policy associated equal to 2. http://127.0.0.1/pandora_console/include/api.php?
op=get&op2=all_agents&return_type=csv&other=1|2|warning|j|2|
~&other_mode=url_encode_separator_|&apipass=1234&user=admin&pass=pandora
28.3.1.3. get module_last_value
Returns the last value of module. This module is filtered by the ID of module pass as parameter id. With the other parameter you can add a error code that your application knows and it is out range of module values. Call syntax: 319
API Calls
•
•
•
•
op=get (compulsory) op2=module_last_value (compulsory) id=<índex> (compulsory) should be an index of an agent module. other=<error return> (optional) that you want to it gives back if there is an error(usually not located in the database. • Error return code are:
• 'error_message' returns an error in a text message.
• 'error_value'<separator><code or value> gives back this code or error value.
But it is necessary to enclose it with 'other_mode',like
other_mode=url_encode_separator_<separador> to put the divider on other.
Examples
http://127.0.0.1/pandora_console/include/api.php?
op=get&op2=module_last_value&id=63&other=error_value|
0&other_mode=url_encode_separator_|&apipass=1234&user=admin&pass=pandora
http://127.0.0.1/pandora_console/include/api.php?
op=get&op2=module_last_value&id=62&apipass=1234&user=admin&pass=pandora
28.3.1.4. get agent_module_name_last_value
Returns the last value of module. This module is filtered by the agent name pass as parameter id and module name pass as parameter id2. With the other parameter you can add a error code that your application knows and it is out range of module values. Call Syntax: •
•
•
•
•
op=get (compulsory) op2=module_last_value (compulsory) id=<alphanumeric>(compulsory) contains the agent name. id2=<alphanumeric> (compulsory) contains the module name. other=<error return> (optional) that you want to return if there is an error ( that usually has not been found in the DB). • Codes of error return are:
• 'error_message' returns error in a text message.
• 'error_value'<separator><code or value> gives back this code or error
value,but it is necessary that it comes with 'other_mode' such as
other_mode=url_encode_separator_<separator> to use the divider in other.
Examples
http://127.0.0.1/pandora_console/include/api.php?
op=get&op2=agent_module_name_last_value&id=miguelportatil&id2=cpu_user&apipass=1234&user=admin&pass=pandora
28.3.1.5. get module_value_all_agents
Returns a list of agents and module value, these modules are in all of agents of list and they are 320
API Calls
filtered by the name of module pass as the parameter id. Call syntax: • op=get (compulsory) • op2=module_value_all_agents (compulsory) • id=<name of the module> (compulsory) This is the module name. Examples
http://127.0.0.1/pandora_console/include/api.php?
op=get&op2=module_value_all_agents&id=example_module_name&apipass=1234&user=admin&pa
ss=pandora
28.3.1.6. get agent_modules
Returns the list of modules of agent, this agent is filtered by the id agent pass as id parameter. Call syntax: •
•
•
•
op=get (compulsory) op2=agent_modules (compulsory) return_type=<csv> (compulsory) Output format. other=<serialized values> (compulsory) Serialized values in order to filter by agent: • <id_agent>
It's necessary to complete 'other_mode' parameter in this way other_mode=url_encode_separator_<separador> in order to configure separator in other field. Examples
http://127.0.0.1/pandora_console/include/api.php?
op=get&op2=agent_modules&return_type=csv&other=14&other_mode=url_encode_separator_|
&apipass=1234&user=admin&pass=pandora
28.3.1.7. get policies
Returns the list of polities of agent, this agent is filtered by id into the other parameter. Call syntax: •
•
•
•
op=get (compulsory) op2=policies (compulsory) return=<csv> (compulsory) other=<serialized values> (optional) Serialized values for filter policy by policy agent: • <id_agent>
Examples
http://127.0.0.1/pandora_console/include/api.php?
op=get&op2=policies&return_type=csv&other=&other_mode=url_encode_separator_|
321
API Calls
&apipass=1234&user=admin&pass=pandora
28.3.1.8. Get tree_agents
Returns a complete list structured by the groups in the first level, agents in the second level and modules in the third level. This list is filtered by the other parameter. Call Syntax: •
•
•
•
op=get (compulsory) op2=tree_agents (compulsory) return=<return kind> (compulsory) that could be 'csv' or 'csv_head'. other=<string or serialized parameters> (optional) in this case could be the divider or a parameter list in order and separated by the divider character. We are going to examine the two cases: • <separator> The divider "yes" of the 'csv'.
• <separator csv>|<character that replaces the CR|<fields 1>,<fields 2>,<fields
N>it will compose the following parameters in order( the divider character '|'
could be specified in "other_mode"):
• <separator csv>: divider of the fields in the CSV.
• <character that replaces the CR> character that will be replaced if it finds
in any returned character the character RC in order to avoid the ambiguity
with the standard use of the RC character to specify registers/files in the
CSV. If you pass an string in other, the substitute character is the blank
space.
• <fields 1>,<fields2>,<fields N> :the fields to show in the CSV are:
• type_row
• group_id
• group_name
• group_parent
• disabled
• custom_id
• agent_id
• agent_name
• agent_direction
• agent_commentary
• agent_id_group
• agent_last_contact
• agent_mode
• agent_interval
• agent_id_os
• agent_os_version
• agent_version
• agent_last_remote_contact
• agent_disabled
• agent_id_parent
322
API Calls
•
•
•
•
•
•
•
•
•
•
•
•
•
•
•
•
•
•
•
•
•
•
•
•
•
•
•
•
•
•
•
•
•
•
•
•
•
•
•
•
•
•
•
•
•
•
agent_custom_id
agent_server_name
agent_cascade_protection
module_id_agent_modulo
module_id_agent
module_id_module_type
module_description
module_name
module_max
module_min
module_interval
module_tcp_port
module_tcp_send
module_tcp_rcv
module_snmp_community
module_snmp_oid
module_ip_target
module_id_module_group
module_flag
module_id_module
module_disabled
module_id_export
module_plugin_user
module_plugin_pass
module_plugin_parameter
module_id_plugin
module_post_process
module_prediction_module
module_max_timeout
module_custom_id
module_history_data
module_min_warning
module_max_warning
module_min_critical
module_max_critical
module_min_ff_event
module_delete_pending
module_id_agent_state
module_data
module_timestamp
module_state
module_last_try
module_utimestamp
module_current_interval
module_running_by
module_last_execution_try
323
API Calls
•
•
•
•
•
•
•
•
•
•
•
•
•
•
•
•
•
•
•
•
•
•
•
•
•
•
•
•
•
•
•
•
•
•
•
•
•
•
•
•
•
•
•
•
•
•
module_status_changes
module_last_status
alert_id_agent_module
alert_id_alert_template
alert_internal_counter
alert_last_fired
alert_last_reference
alert_times_fired
alert_disabled
alert_force_execution
alert_id_alert_action
alert_type
alert_value
alert_matches_value
alert_max_value
alert_min_value
alert_time_threshold
alert_max_alerts
alert_min_alerts
alert_time_from
alert_time_to
alert_monday
alert_tuesday
alert_wednesday
alert_thursday
alert_friday
alert_saturday
alert_sunday
alert_recovery_notify
alert_field2_recovery
alert_field3_recovery
alert_id_alert_template_module
alert_fires_min
alert_fires_max
alert_id_alert_command
alert_command
alert_internal
alert_template_modules_id
alert_templates_id
alert_template_module_actions_id
alert_actions_id
alert_commands_id
alert_templates_name
alert_actions_name
alert_commands_name
alert_templates_description
324
API Calls
•
•
•
•
•
•
•
•
•
•
•
alert_commands_description
alert_template_modules_priority
alert_templates_priority
alert_templates_field1
alert_actions_field1
alert_templates_field2
alert_actions_field2
alert_templates_field3
alert_actions_field3
alert_templates_id_group
alert_actions_id_group'
Examples
http://127.0.0.1/pandora_console/include/api.php?
op=get&op2=tree_agents&return_type=csv&other=;&apipass=1234&user=admin&pass=pandora
http://127.0.0.1/pandora_console/include/api.php?
op=get&op2=tree_agents&return_type=csv&other=;|%20|
type_row,group_id,agent_name&other_mode=url_encode_separator_|
&apipass=1234&user=admin&pass=pandora
28.3.1.9. get module_data
Returns a list of values of a module, this module is filtered by the id of module pass as id in the url. And the list of values is from the now to the period limit passed as second parameter into the other parameter, the first is the CSV separator. Call syntax: •
•
•
•
op=set (compulsory) op2=module_data (compulsory) id=<id_modulo> (compulsory) other=<serialized parameters> (compulsory), the CSV divider character and the period in seconds. Examples
http://127.0.0.1/pandora_console/include/api.php?
op=get&op2=module_data&id=17&other=;|604800&other_mode=url_encode_separator_|
&apipass=1234&user=admin&pass=pandora
28.3.1.10. get graph_module_data
Returns the chart of a module as a image file, this chart is generated with the same method of static graphs of Pandora. It is necesary pass the width, height, period, label and start date of chart, all of they into the other parameter. Call syntax: • op=set (compulsory) 325
API Calls
• op2=module_data (compulsory) • id=<id_modulo> (compulsory) • other=<serialized parameters> (compulsory). Are the following in this order: •
•
•
•
•
<period>
<width>
<height>
<label>
<start_date>
Examples
http://127.0.0.1/pandora_console/include/api.php?
op=get&op2=graph_module_data&id=17&other=604800|555|245|pepito|2009-1207&other_mode=url_encode_separator_|&apipass=1234&user=admin&pass=pandora
28.3.1.11. get events
Returns a list of events filtered by the other parameter. Call syntax: •
•
•
•
•
op=get (compulsory) op2=events (compulsory) return_type=csv (compulsory) other_mode=url_encode_separator_| (optional) other=<serialized parameters> (optional).Are the following in this order: <separator>
<criticity> From 0 to 4, or -1 for to avoid this param
<agent name>
<module name>
<alert template name>
<user>
<numeric interval minimum level > in unix timestamp
<numeric interval maximum level > in unix timestamp
<status>
<event substring>
<register limit>
<offset register>
<optional style [total|more_criticity]> (total - returns the number of the records,
more_criticity - returns the biggest value of criticity)
• <event type> unknown, alert_fired, alert_recovered,.. or its substring. you can also use
'not_normal'.
•
•
•
•
•
•
•
•
•
•
•
•
•
Examples
http://127.0.0.1/pandora_console/include/api.php?
op=get&op2=events&return_type=csv&apipass=1234&user=admin&pass=pandora
326
API Calls
http://127.0.0.1/pandora_console/include/api.php?
op=get&op2=events&other_mode=url_encode_separator_|&return_type=csv&other=;|2|
SERVER|CPU|template_alert00||1274715715|
127471781&apipass=1234&user=admin&pass=pandora
Full usage example
Sample event #1 report this information: 951140;3998;0;14;0;2012-06-23 22:51:28;Module CheckPandora (0.00) is going to
CRITICAL;1340484688;going_up_critical;8176;0;4;;;RemoteAgent;Aerin;transmit;Going
down to critical
state;http://firefly.artica.es/pandora_demo//images/b_red.png;Critical;http://firefl
y.artica.es/pandora_demo//
images/status_sets/default/severity_critical.png
Most of the fields, match the fields in the dababase, try to do this query using the SQL manager at pandora: select * from tevento order by id_evento DESC limit 100; You will see the fields are like this: •
•
•
•
•
•
•
•
•
•
•
•
•
•
Field 1 ID event number (incremental) Field 2 ID agent Field 3 ID user which validate the event Field 4 ID Group (numerical) Field 5 Status (0 new, 1 validated... see more in docs about status codes) Field 6 Timestamp (human string timestamp) Field 7 Event description (pure text) Field 8 utimestamp (Unix timestamp, numerical seconds since 1970) Field 9 event type, tokens representing event type with fixed strings Field 10 ID agent_module the numerical ID of the module with raise this event. It depends on the event type a new_agent event type do not come with any value here (0). Later the API will get the name, you dont need to call again the api to "resolve" the name by asking with the ID. Field 11 Id alert. THe same with F10 Field 12 Criticity (values), check out the docs to see the codes. Field 13 User comments (if provided by the user) Field 14 Tags Now comes the API aditional fields, not in DB: •
•
•
•
•
•
•
Field 15 Agent name Field 16 Group name Field 17 Group image name. Field 18 Long description of the event type Field 19 URL to image representing the event status (red ball) Field 20 Description of the event criticity (Field 12) Field 21 URL to image representing the criticity. 327
API Calls
28.3.1.12. get all_alert_templates
Returns the list of alert templates defined into the Pandora. Call syntax: • op=get (compulsory) • op2=all_alert_templates (compulsory) • other=cvs_separator (optional) Examples
http://127.0.0.1/pandora_console/include/api.php?
op=get&op2=all_alert_templates&return_type=csv&other=;&apipass=1234&user=admin&pass=
pandora
28.3.1.13. get module_groups
Returns the list of module groups. Call syntax: • op=get (compulsory) • op2=module_groups (compulsory) • other=cvs_separator (optional) Examples
http://127.0.0.1/pandora_console/include/api.php?
op=get&op2=module_groups&return_type=csv&other=;&apipass=1234&user=admin&pass=pandor
a
28.3.1.14. get plugins
Returns the list of server plugins of Pandora. Call syntax: • op=get (compulsory) • op2=plugins (compulsory) • other=cvs_separator (optional) Examples
http://127.0.0.1/pandora_console/include/api.php?
op=get&op2=plugins&return_type=csv&other=;&apipass=1234&user=admin&pass=pandora
28.3.1.15. get tags
Returns the list of tags defined into Pandora. Call syntax: • op=get (compulsory) 328
API Calls
• op2=tags (compulsory) • return_type=csv (compulsory) Examples
This example will return all tags in the system. http://localhost/pandora_console/include/api.php?
op=get&op2=tags&return_type=csv&apipass=1234&user=admin&pass=pandora
28.3.1.16. get module_from_conf
>= 5.0 (Only Enterprise) Returns the configuration of a local module. Call syntax: •
•
•
•
op=get (mandatory) op2=update_module_in_conf (mandatory) id=<id agente> (mandatory) id2=<nombre módulo> (mandatory) Examples
http://127.0.0.1/pandora_console/include/api.php?
op=get&op2=module_from_conf&user=admin&pass=pandora&id=9043&id2=example_name
It returns null string if no modules are found. 28.3.1.17. get total_modules
Total modules by group. Call syntax: • op=get (mandatory) • op2=total_modules (mandatory) • id=<id group> (mandatory) Examples
http://localhost/pandora_console/include/api.php?
op=get&op2=total_modules&id=2&apipass=1234&user=admin&pass=pandora
28.3.1.18. get total_agents
Total agents by group. Call syntax: • op=get (mandatory) • op2=total_agents (mandatory) 329
API Calls
• id=<id group> (mandatory) Examples
http://localhost/pandora_console/include/api.php?
op=get&op2=total_agents&id=2&apipass=1234&user=admin&pass=pandora
28.3.1.19. get agent_name
Agent name for a given id Call syntax: • op=get (mandatory) • op2=agent_name (mandatory) • id=<id agent> (mandatory) Examples
http://localhost/pandora_console/include/api.php?
op=get&op2=agent_name&id=1&apipass=1234&user=admin&pass=pandora
28.3.1.20. get module_name
Module name for a given id. Call syntax: • op=get (mandatory) • op2=module_name (mandatory) • id=<id module> (mandatory) Examples
http://localhost/pandora_console/include/api.php?
op=get&op2=module_name&id=1&apipass=1234&user=admin&pass=pandora
28.3.1.21. get alert_action_by_group
Total alert execution with an action by group. Call syntax: •
•
•
•
op=get (mandatory) op2=alert_action_by_group (mandatory) id=<id group> (mandatory) id2=<id action> (mandatory) Examples
http://localhost/pandora_console/include/api.php?
330
API Calls
op=get&op2=alert_action_by_group&id=0&id2=3&apipass=1234&user=admin&pass=pandora
28.3.1.22. get event_info
Return all of event data. This event is selected by id in the id parameter. Call syntax: • op=get (mandatory) • op2=event_info (mandatory) • id=<id_event> (mandatory) Examples
http://127.0.0.1/pandora_console/include/api.php?
op=get&op2=event_info&id=80&apipass=1234&user=admin&pass=pandora
28.3.1.23. get tactical_view
Returns the next values list (this values you can see in the tactical page in Pandora Console) •
•
•
•
•
•
•
•
•
•
•
•
•
•
•
•
•
•
•
•
•
•
•
•
•
•
•
•
monitor_checks monitor_not_init monitor_unknown monitor_ok monitor_bad monitor_warning monitor_critical monitor_not_normal monitor_alerts monitor_alerts_fired monitor_alerts_fire_count total_agents total_alerts total_checks alerts agents_unknown monitor_health alert_level module_sanity server_sanity total_not_init monitor_non_init agent_ok agent_warning agent_critical agent_unknown agent_not_init global_health 331
API Calls
Call syntax: • op=get (mandatory) • op2=tactical_view (mandatory) Example
http://localhost/pandora_console/include/api.php?
op=get&op2=tactical_view&apipass=1234&user=admin&pass=pandora
28.3.1.24. get pandora_servers
>= 5.0 Returns the list of pandora servers. call syntax: •
•
•
•
op=get (mandatory) op2=pandora_servers (mandatory) other=cvs_separator (optional) return_type=csv (mandatory) Example
http://localhost/pandora_console/include/api.php?
op=get&op2=pandora_servers&return_type=csv&apipass=1234&user=admin&pass=pandora
It returns the fields in this order: •
•
•
•
•
•
•
•
•
•
•
name status (1 up, 0 down) type (human readable string) master (1 master, 0 not master) running modules total modules max delay (sec) delayed modules threads queued_modules timestamp of update (human readable string) 28.3.1.25. get custom_field_id
>= 5.0 Translate the name of custom field to the id in the data base. Call syntax: • op=get (mandatory) • op2=custom_field_id (mandatory) • other=<serialized parameters> (mandatory) in this case custom field name • <name> (mandatory)
332
API Calls
Example
http://127.0.0.1/pandora_console/include/api.php?
op=get&op2=custom_field_id&other=mycustomfield&other_mode=url_encode_separator_|
&apipass=1234&user=admin&pass=pandora
28.3.1.26. get gis_agent
>= 5.0 Return the last gis agent data. Sintax call: • op=set (compulsory) • op2=gis_agent (compulsory) • id=<index> (compulsory) agent index. Ejemplo
http://127.0.0.1/pandora5/include/api.php?
apipass=caca&user=admin&pass=pandora&op=set&op2=gis_agent&id=582&other_mode=url_enco
de_separator_|&other=2%7C2%7C0%7C0%7C0%7C2000-01-01+01%3A01%3A01%7C0%7C666%7Ccaca
%7Cpis%7Cmierda
28.3.2. SET
Send data 28.3.2.1. Set new_agent
Create a new agent with the data passed as parameters. Call syntax: • op=set (compulsory) • op2=new_agent (compulsory) • other=<serialized parameters> (compulsory).They are the agent configuration and data, serial in the following order: •
•
•
•
•
•
•
•
•
•
•
•
<agent_name>
<ip>
<id_parent>
<id_group>
<cascade_protection>
<interval_sec>
<id_os>
<id_server>
<custom_id>
<learning_mode>
<disabled>
<description>
333
API Calls
Examples
http://127.0.0.1/pandora_console/include/api.php?
op=set&op2=new_agent&other=agente_nombre|1.1.1.1|0|4|0|30|8|10||0|0|la
%20descripcion&other_mode=url_encode_separator_|
&apipass=1234&user=admin&pass=pandora
28.3.2.2. Set update_agent
Update a new agent with the data passed as parameters. Call syntax: •
•
•
•
op=set (compulsory) op2=update_agent (compulsory) id=<id_agent> (compulsory) other=<serialized parameters> (compulsory).They are the agent configuration and data, serial in the following order: •
•
•
•
•
•
•
•
•
•
•
•
<agent_name>
<ip>
<id_parent>
<id_group>
<cascade_protection>
<interval_sec>
<id_os>
<id_server>
<custom_id>
<learning_mode>
<disabled>
<description>
Examples
http://127.0.0.1/pandora_console/include/api.php?
op=set&op2=update_agent&other=agente_nombre|1.1.1.1|0|4|0|30|8|10||0|0|la
%20descripcion&other_mode=url_encode_separator_|
&apipass=1234&user=admin&pass=pandora
28.3.2.3. Set delete_agent
Delete a agent that passed the name as parameter. Call syntax: • op=set (compulsory) • op2=delete_agent (compulsory) • id=<nombre_agente> (compulsory) should be an agent name. 334
API Calls
Examples
http://127.0.0.1/pandora_console/include/api.php?
op=set&op2=delete_agent&id=agente_erroneo&apipass=1234&user=admin&pass=pandora
28.3.2.4. set create_module_template
Create a alert from a template pass as id parameter, in the module pass as id into other and agent pass as id into the other. Call syntax: •
•
•
•
op=set (compulsory) op2=create_module_template (compulsory) id=<id_template> (compulsory) should be a template id. other=<id_module>|<id_agent> Examples
http://127.0.0.1/pandora_console/include/api.php?
op=set&op2=create_module_template&id=1&other=1|10&other_mode=url_encode_separator_|
&apipass=1234&user=admin&pass=pandora
28.3.2.5. set create_network_module
Create a network module from the data pass as parameters. Call syntax: •
•
•
•
op=set (compulsory) op2=create_network_module (compulsory) id=<agent_name> (compulsory) should be an agent name. other=<serialized parameters> (compulsory) are the module configuration and data, serialized in the following order: •
•
•
•
•
•
•
•
•
•
•
•
•
•
•
•
<name_module>
<disabled>
<id_module_type>
<id_module_group>
<min_warning>
<max_warning>
<min_critical>
<max_critical>
<ff_threshold>
<history_data>
<ip_target>
<tcp_port>
<snmp_community>
<snmp_oid>
<module_interval>
<post_process>
335
API Calls
•
•
•
•
•
<min>
<max>
<custom_id>
<description>
<enable_unknown_events> (only in version 5)
Examples
http://127.0.0.1/pandora_console/include/api.php?
op=set&op2=create_network_module&id=pepito&other=prueba|0|7|1|10|15|0|16|18|0|15|0|
127.0.0.1|0||0|180|0|0|0|0|latency%20ping&other_mode=url_encode_separator_|
&apipass=1234&user=admin&pass=pandora
28.3.2.6. set create_plugin_module
Create a module plugin with the data passed as parameters. Call sintax: •
•
•
•
op=set (compulsory) op2=create_plugin_module (compulsory) id=<agent_name> (compulsory) should be an agent name. other=<serialized parameters> (compulsory) are the module configuration and data, serialized in the following order: •
•
•
•
•
•
•
•
•
•
•
•
•
•
•
•
•
•
•
•
•
•
•
•
<name_module>
<disabled>
<id_module_type>
<id_module_group>
<min_warning>
<max_warning>
<str_warning>
<min_critical>
<max_critical>
<str_critical>
<ff_threshold>
<history_data>
<ip_target>
<tcp_port>
<snmp_community>
<snmp_oid>
<module_interval>
<post_process>
<min_value>
<max_value>
<custom_id>
<description>
<id_plugin>
<plugin_user>
336
API Calls
• <plugin_pass>
• <plugin_parameter>
• <enable_unknown_events> (only in version 5)
Examples
http://127.0.0.1/pandora_console/include/api.php?
op=set&op2=create_plugin_module&id=pepito&other=prueba|0|1|2|0|0||0|0||0|0|
127.0.0.1|0||0|300|0|0|0|0|plugin%20module%20from%20api|2|admin|pass|-p
%20max&other_mode=url_encode_separator_|&apipass=1234&user=admin&pass=pandora
28.3.2.7. set create_data_module
Create a module from parameters passed. With this call you can add database module data but you cannot modify configuration
file of the agents associated to the module
Call sintax: •
•
•
•
op=set (compulsory) op2=create_data_module (compulsory) id=<agent_name> (compulsory) should be an agent name. other=<serialized parameters> (compulsory) are the module configuration and data, serialized in the following order: •
•
•
•
•
•
•
•
•
•
•
•
•
•
•
•
•
<name_module>
<disabled>
<id_module_type>
<description>
<id_module_group>
<min_value>
<max_value>
<post_process>
<module_interval>
<min_warning>
<max_warning>
<str_warning>
<min_critical>
<max_critical>
<str_critical>
<history_data>
<enable_unknown_events> (only in version 5)
337
API Calls
Examples
http://127.0.0.1/pandora_console/include/api.php?
op=set&op2=create_data_module&id=pepito&other=prueba|0|1|data%20module%20from%20api|
1|10|20|10.50|180|10|15||16|20||0&other_mode=url_encode_separator_|
&apipass=1234&user=admin&pass=pandora
28.3.2.8. set create_SNMP_module
Create a SNMP module. Call sintax: •
•
•
•
op=set (compulsory) op2=create_snmp_module (compulsory) id=<agent_name> (compulsory) should be an agent name. other=<serialized parameters> (compulsory) are the module configuration and data, serialized in the following order: •
•
•
•
•
•
•
•
•
•
•
•
•
•
•
•
•
•
•
•
•
•
•
•
•
•
•
•
•
•
<name_module>
<disabled>
<id_module_type>
<id_module_group>
<min_warning>
<max_warning>
<str_warning>
<min_critical>
<max_critical>
<str_critical>
<ff_threshold>
<history_data>
<ip_target>
<module_port>
<snmp_version>
<snmp_community>
<snmp_oid>
<module_interval>
<post_process>
<min_value>
<max_value>
<custom_id>
<description>
<snmp3_priv_method [AES|DES]>
<snmp3_priv_pass>
<snmp3_sec_level [authNoPriv|authPriv|noAuthNoPriv]>
<snmp3_auth_method [MD5|SHA]>
<snmp3_auth_user>
<snmp3_auth_pass>
<enable_unknown_events> (only in version 5)
338
API Calls
Examples
Example 1 (snmp v: 3, snmp3_priv_method: AES, snmp3_priv_pass: example_priv_passw, snmp3_sec_level: authNoPriv, snmp3_auth_method:MD5, snmp3_auth_user: pepito_user, snmp3_auth_pass: example_priv_passw) http://127.0.0.1/pandora_console/include/api.php?
op=set&op2=create_snmp_module&id=pepito&other=prueba|0|15|1|10|15||16|18||15|0|
127.0.0.1|60|3|public|.1.3.6.1.2.1.1.1.0|180|0|0|0|0|SNMP%20module%20from%20API|AES|
example_priv_passw|authNoPriv|MD5|pepito_user|
example_auth_passw&other_mode=url_encode_separator_|
&apipass=1234&user=admin&pass=pandora
Example 2 (snmp v: 1) http://127.0.0.1/pandora_console/include/api.php?
op=set&op2=create_snmp_module&id=pepito1&other=prueba2|0|15|1|10|15||16|18||15|0|
127.0.0.1|60|1|public|.1.3.6.1.2.1.1.1.0|180|0|0|0|0|SNMP module from
API&other_mode=url_encode_separator_|&apipass=1234&user=admin&pass=pandora
28.3.2.9. set update_network_module
Update the network module. Call syntax: •
•
•
•
op=set (compulsory) op2=update_network_module (compulsory) id=<module_name> (compulsory) should be a module name. other=<serialized parameters> (compulsory) are the module configuration and data, serialized in the following order: •
•
•
•
•
•
•
•
•
•
•
•
•
•
•
•
•
•
•
•
<id_agent>
<disabled>
<id_module_group>
<min_warning>
<max_warning>
<str_warning>
<min_critical>
<max_critical>
<str_critical>
<ff_threshold>
<history_data>
<ip_target>
<module_port>
<snmp_community>
<snmp_oid>
<module_interval>
<post_process>
<min>
<max>
<custom_id>
339
API Calls
• <description>
• <disabled_types_event> (only in version 5)
Examples
http://127.0.0.1/pandora_console/include/api.php?
op=set&op2=update_network_module&id=example_module_name&other=44|0|2|10|15||16|18||
7|0|127.0.0.1|0||0|300|30.00|0|0|0|latency%20ping%20modified%20by%20the
%20Api&other_mode=url_encode_separator_|&apipass=1234&user=admin&pass=pandora
28.3.2.10. set update_plugin_module
Update the plugin module. Call sintax: •
•
•
•
op=set (compulsory) op2=update_plugin_module (compulsory) id=<module_name> (compulsory) should be a module name. other=<serialized parameters> (compulsory) are the module configuration and data, serialized in the following order: •
•
•
•
•
•
•
•
•
•
•
•
•
•
•
•
•
•
•
•
•
•
•
•
•
•
<id_agent>
<disabled>
<id_module_group>
<min_warning>
<max_warning>
<str_warning>
<min_critical>
<max_critical>
<str_critical>
<ff_threshold>
<history_data>
<ip_target>
<module_port>
<snmp_community>
<snmp_oid>
<module_interval>
<post_process>
<min_value>
<max_value>
<custom_id>
<description>
<id_plugin>
<plugin_user>
<plugin_pass>
<plugin_parameter>
<disabled_types_event> (only in version 5)
340
API Calls
Examples
http://127.0.0.1/pandora_console/include/api.php?
op=set&op2=update_plugin_module&id=example_plugin_name&other=44|0|2|0|0||0|0||0|0|
127.0.0.1|0||0|300|0|0|0|0|plugin%20module%20from%20api|2|admin|pass|-p
%20max&other_mode=url_encode_separator_|&apipass=1234&user=admin&pass=pandora
28.3.2.11. set update_data_module
With this call you can add database module data but you cannot modify configuration
file of the agents associated to the module
Update the local module. Call sintax: •
•
•
•
op=set (compulsory) op2=update_data_module (compulsory) id=<module_name> (compulsory) should be a module name. other=<serialized parameters> (compulsory) are the module configuration and data, serialized in the following order: •
•
•
•
•
•
•
•
•
•
•
•
•
•
•
•
•
•
•
•
•
•
<id_agent>
<disabled>
<id_module_group>
<min_warning>
<max_warning>
<str_warning>
<min_critical>
<max_critical>
<str_critical>
<ff_threshold>
<history_data>
<ip_target>
<module_port>
<snmp_community>
<snmp_oid>
<module_interval>
<post_process>
<min_value>
<max_value>
<custom_id>
<description>
<disabled_types_event> (only in version 5)
341
API Calls
Examples
http://127.0.0.1/pandora_console/include/api.php?
op=set&op2=update_data_module&id=example_module_name&other=44|0|data%20module
%20modified%20from%20API|6|0|0|50.00|300|10|15||16|18||
0&other_mode=url_encode_separator_|&apipass=1234&user=admin&pass=pandora
28.3.2.12. set update_SNMP_module
Update a SNMP module. Call sintax: •
•
•
•
op=set (compulsory) op2=update_snmp_module (compulsory) id=<module_name> (compulsory) should be a module name. other=<serialized parameters> (compulsory) are the module configuration and data, serialized in the following order: •
•
•
•
•
•
•
•
•
•
•
•
•
•
•
•
•
•
•
•
•
•
•
•
•
•
•
•
•
<id_agent>
<disabled>
<id_module_group>
<min_warning>
<max_warning>
<str_warning>
<min_critical>
<max_critical>
<str_critical>
<ff_threshold>
<history_data>
<ip_target>
<module_port>
<snmp_version>
<snmp_community>
<snmp_oid>
<module_interval>
<post_process>
<min_value>
<max_value>
<custom_id>
<description>
<snmp3_priv_method [AES|DES]>
<snmp3_priv_pass>
<snmp3_sec_level [authNoPriv|authPriv|noAuthNoPriv]>
<snmp3_auth_method [MD5|SHA]>
<snmp3_auth_user>
<snmp3_auth_pass>
<disabled_types_event> (only in version 5)
342
API Calls
Examples
Example (snmp v: 3, snmp3_priv_method: AES, snmp3_priv_pass: example_priv_passw, snmp3_sec_level: authNoPriv, snmp3_auth_method:MD5, snmp3_auth_user: pepito_user, snmp3_auth_pass: example_priv_passw) http://127.0.0.1/pandora_console/include/api.php?
op=set&op2=update_snmp_module&id=example_snmp_module_name&other=44|0|6|20|25||26|
30||15|1|127.0.0.1|60|3|public|.1.3.6.1.2.1.1.1.0|180|50.00|10|60|0|SNMP%20module
%20modified%20by%20API|AES|example_priv_passw|authNoPriv|MD5|pepito_user|
example_auth_passw&other_mode=url_encode_separator_|
&apipass=1234&user=admin&pass=pandora
28.3.2.13. set apply_policy
Apply the policy pass as policy id into the id parameter. Call syntax: • op=set (compulsory) • op2=apply_policy (compulsory) • id=<id_policy> (compulsory) should be a policy Id. Examples
http://127.0.0.1/pandora_console/include/api.php?
op=set&op2=apply_policy&id=1&apipass=1234&user=admin&pass=pandora
28.3.2.14. set apply_all_policies
Apply all policies that are in Pandora. Call syntax: • op=set (compulsory) • op2=apply_all_policies (compulsory) Examples
http://127.0.0.1/pandora_console/include/api.php?
op=set&op2=apply_all_policies&apipass=1234&user=admin&pass=pandora
28.3.2.15. set add_network_module_policy
Add a network module in the policy pass as id in the parameter. Call syntax: •
•
•
•
op=set (compulsory) op2=add_network_module_policy (compulsory) id=<id_policy> (compulsory) should be a policy Id. other=<parámetros serializados> (compulsory) are the module configuration and data, serialized in the following order: 343
API Calls
•
•
•
•
•
•
•
•
•
•
•
•
•
•
•
•
•
•
•
•
•
<id_module_type>
<description>
<id_module_group>
<min_value>
<max_value>
<post_process>
<module_interval>
<min_warning>
<max_warning>
<str_warning>
<min_critical>
<max_critical>
<str_critical>
<history_data>
<ff_threshold>
<disabled>
<module_port>
<snmp_community>
<snmp_oid>
<custom_id>
<enable_unknown_events> (only in version 5)
Examples
http://127.0.0.1/pandora_console/include/api.php?
op=set&op2=add_network_module_policy&id=1&other=network_module_policy_example_name|
6|network%20module%20created%20by%20Api|2|0|0|50.00|180|10|20||21|35||1|15|0|66|||
0&other_mode=url_encode_separator_|&apipass=1234&user=admin&pass=pandora
28.3.2.16. set add_plugin_module_policy
Add a plugin module in the policy pass as id in the parameter. Call syntax: •
•
•
•
op=set (compulsory) op2=add_plugin_module_policy (compulsory) id=<id_policy> (compulsory) should be a policy Id. other=<serialized parameters> (compulsory) are the module configuration and data, serialized in the following order: •
•
•
•
•
•
•
<name_module>
<disabled>
<id_module_type>
<id_module_group>
<min_warning>
<max_warning>
<str_warning>
344
API Calls
•
•
•
•
•
•
•
•
•
•
•
•
•
•
•
•
•
•
•
<min_critical>
<max_critical>
<str_critical>
<ff_threshold>
<history_data>
<module_port>
<snmp_community>
<snmp_oid>
<module_interval>
<post_process>
<min_value>
<max_value>
<custom_id>
<description>
<id_plugin>
<plugin_user>
<plugin_pass>
<plugin_parameter>
<enable_unknown_events> (only in version 5)
Examples
http://127.0.0.1/pandora_console/include/api.php?
op=set&op2=add_plugin_module_policy&id=1&other=example%20plugin%20module%20name|0|1|
2|0|0||0|0||15|0|66|||300|50.00|0|0|0|plugin%20module%20from%20api|2|admin|pass|-p
%20max&other_mode=url_encode_separator_|&apipass=1234&user=admin&pass=pandora
28.3.2.17. set add_data_module_policy
Add a local module in the policy pass as id in the parameter. Call syntax: •
•
•
•
op=set (compulsory) op2=add_data_module_policy (compulsory) id=<id_policy> (compulsory) should be a policy Id. other=<serialized parameters> (compulsory) are the module configuration and data, serialized in the following order: •
•
•
•
•
•
•
•
•
•
<name_module>
<id_module_type>
<description>
<id_module_group>
<min_value>
<max_value>
<post_process>
<module_interval>
<min_warning>
<max_warning>
345
API Calls
<str_warning>
<min_critical>
<max_critical>
<str_critical>
<history_data>
<configuration_data> This is the definition block of the agent that will be inserted in
the config file of the policy agent.
• <enable_unknown_events> (only in version 5)
•
•
•
•
•
•
Examples
http://127.0.0.1/pandora_console/include/api.php?
op=set&op2=add_data_module_policy&id=1&other=data_module_policy_example_name~2~data
%20module%20created%20by%20Api~2~0~0~50.00~10~20~180~~21~35~~1~module_begin
%0dmodule_name%20pandora_process%0dmodule_type%20generic_data%0dmodule_exec%20ps
%20aux%20|%20grep%20pandora%20|%20wc%20-l
%0dmodule_end&other_mode=url_encode_separator_~&apipass=1234&user=admin&pass=pandora
28.3.2.18. set add_SNMP_module_policy
Add a SNMP module in the policy pass as id in the parameter. Call syntax: •
•
•
•
op=set (compulsory) op2=add_snmp_module_policy (compulsory) id=<id_policy> (compulsory) should be a policy Id. other=<serialized parameters> (compulsory) are the module configuration and data, serialized in the following order: •
•
•
•
•
•
•
•
•
•
•
•
•
•
•
•
•
•
•
•
<name_module>
<disabled>
<id_module_type>
<id_module_group>
<min_warning>
<max_warning>
<str_warning>
<min_critical>
<max_critical>
<str_critical>
<ff_threshold>
<history_data>
<module_port>
<snmp_version>
<snmp_community>
<snmp_oid>
<module_interval>
<post_process>
<min_value>
<max_value>
346
API Calls
•
•
•
•
•
•
•
•
•
<custom_id>
<description>
<snmp3_priv_method [AES|DES]>
<snmp3_priv_pass>
<snmp3_sec_level [authNoPriv|authPriv|noAuthNoPriv]>
<snmp3_auth_method [MD5|SHA]>
<snmp3_auth_user>
<snmp3_auth_pass>
<enable_unknown_events> (only in version 5)
Examples
http://127.0.0.1/pandora_console/include/api.php?
op=set&op2=add_snmp_module_policy&id=1&other=example%20SNMP%20module%20name|0|15|2|
0|0||0|0||15|1|66|3|public|.1.3.6.1.2.1.1.1.0|180|50.00|10|60|0|SNMP%20module
%20modified%20by%20API|AES|example_priv_passw|authNoPriv|MD5|pepito_user|
example_auth_passw&other_mode=url_encode_separator_|
&apipass=1234&user=admin&pass=pandora
28.3.2.19. set add_agent_policy
Add a agent into a policy. Call syntax: •
•
•
•
op=set (compulsory) op2=add_agent_policy (compulsory) id=<id_policy> (compulsory) should be a policy Id. other=<serialized parameters> (compulsory) are the agent configuration and data, serialized in the following order: • <id_agent>
Examples
http://127.0.0.1/pandora_console/include/api.php?
op=set&op2=add_agent_policy&id=1&other=167&other_mode=url_encode_separator_|
&apipass=1234&user=admin&pass=pandora
28.3.2.20. set new_network_component
Create a new network component. Call syntax: •
•
•
•
op=set (compulsory) op2=new_network_component (compulsory) id=<network_component_name> (compulsory) should be the network component name. other=<serialized parameters> (compulsory) are the agent configuration and data of the network component, serialized in the following order: • <network_component_type>
347
API Calls
•
•
•
•
•
•
•
•
•
•
•
•
•
•
•
•
•
•
<description>
<module_interval>
<max_value>
<min_value>
<snmp_community>
<id_module_group>
<max_timeout>
<history_data>
<min_warning>
<max_warning>
<str_warning>
<min_critical>
<max_critical>
<str_critical>
<ff_threshold>
<post_process>
<network_component_group>
<enable_unknown_events> (only in version 5)
Examples
http://127.0.0.1/pandora_console/include/api.php?
op=set&op2=new_network_component&id=example_network_component_name&other=7|network
%20component%20created%20by%20Api|300|30|10|public|3||1|10|20|str|21|30|str1|10|
50.00|12&other_mode=url_encode_separator_|&apipass=1234&user=admin&pass=pandora
28.3.2.21. set new_plugin_component
Create a new plugin component. Call syntax: •
•
•
•
op=set (compulsory) op2=new_plugin_component (compulsory) id=<plugin_component_name> (compulsory) should be the plugin component name. other=<serialized parameters> (compulsory) are the agent configuration and data of the plugin component, serialized in the following order: •
•
•
•
•
•
•
•
•
•
•
<plugin_component_type>
<description>
<module_interval>
<max_value>
<min_value>
<module_port>
<id_module_group>
<id_plugin>
<max_timeout>
<history_data>
<min_warning>
348
API Calls
•
•
•
•
•
•
•
•
•
<max_warning>
<str_warning>
<min_critical>
<max_critical>
<str_critical>
<ff_threshold>
<post_process>
<plugin_component_group>
<enable_unknown_events> (only in version 5)
Examples
http://127.0.0.1/pandora_console/include/api.php?
op=set&op2=new_plugin_component&id=example_plugin_component_name&other=2|plugin
%20component%20created%20by%20Api|300|30|10|66|3|2|example_user|example_pass|-p
%20max||1|10|20|str|21|30|str1|10|50.00|12&other_mode=url_encode_separator_|
&apipass=1234&user=admin&pass=pandora
28.3.2.22. set new_snmp_component
Create a new SNMP component. Call syntax: •
•
•
•
op=set (compulsory) op2=new_snmp_component (compulsory) id=<snmp_component_name> (compulsory) should be the snmp component name. other=<serialized parameters> (compulsory) are the configuration and data of the snmp component, serialized in the following order: •
•
•
•
•
•
•
•
•
•
•
•
•
•
•
•
•
•
•
<snmp_component_type>
<description>
<module_interval>
<max_value>
<min_value>
<id_module_group>
<max_timeout>
<history_data>
<min_warning>
<max_warning>
<str_warning>
<min_critical>
<max_critical>
<str_critical>
<ff_threshold>
<post_process>
<snmp_version>
<snmp_oid>
<snmp_community>
349
API Calls
•
•
•
•
•
•
•
•
•
•
<snmp3_auth_user>
<snmp3_auth_pass>
<module_port>
<snmp3_auth_pass>
<snmp3_privacy_method>
<snmp3_privacy_pass>
<snmp3_auth_method>
<snmp3_security_level>
<snmp_component_group>
<enable_unknown_events> (only in version 5)
Examples
http://127.0.0.1/pandora_console/include/api.php?
op=set&op2=new_snmp_component&id=example_snmp_component_name&other=16|SNMP
%20component%20created%20by%20Api|300|30|10|3||1|10|20|str|21|30|str1|15|50.00|
3|.1.3.6.1.2.1.2.2.1.8.2|public|example_auth_user|example_auth_pass|66|AES|
example_priv_pass|MD5|authNoPriv|12&other_mode=url_encode_separator_|
&apipass=1234&user=admin&pass=pandora
28.3.2.23. set new_local_component
Create a new local component. Call syntax: •
•
•
•
op=set (compulsory) op2=new_local_component (compulsory) id=<local_component_name> (compulsory) should be a local component name. other=<serialized parameters> (compulsory) are the configuration and data of the local component, serialized in the following order: •
•
•
•
•
<description>
<id_os>
<local_component_group>
<configuration_data> This is the configuration block of the module.
<enable_unknown_events> (only in version 5)
Examples
http://127.0.0.1/pandora_console/include/api.php?
op=set&op2=new_local_component&id=example_local_component_name&other=local
%20component%20created%20by%20Api~5~12~module_begin%0dmodule_name
%20example_local_component_name%0dmodule_type%20generic_data%0dmodule_exec%20ps%20|
%20grep%20pid%20|%20wc%20-l%0dmodule_interval
%202%0dmodule_end&other_mode=url_encode_separator_~&apipass=1234&user=admin&pass=pan
dora
28.3.2.24. set create_alert_template
Create a template of alert. 350
API Calls
Call sintax: •
•
•
•
op=set (compulsory) op2=create_alert_template (compulsory) id=<template_name> (compulsory) will be the template name. other=<serialized parameters> (compulsory) are the template configuration and data, serialized in the following order: • <type [regex|max_min|max|min|equal|not_equal|warning|critical|onchange|unknown|
always]>
• <description>
• <id_alert_action>
• <field1>
• <field2>
• <field3>
• <value>
• <matches_value>
• <max_value>
• <min_value>
• <time_threshold>
• <max_alerts>
• <min_alerts>
• <time_from>
• <time_to>
• <monday>
• <tuesday>
• <wednesday>
• <thursday>
• <friday>
• <saturday>
• <sunday>
• <recovery_notify>
• <field2_recovery>
• <field3_recovery>
• <priority>
• <id_group>
Examples
Example 1 (condition: regexp =~ /pp/, action: Mail to XXX, max_alert: 10, min_alert: 0, priority: WARNING, group: databases): http://127.0.0.1/pandora_console/include/api.php?
op=set&op2=create_alert_template&id=pepito&other=regex|template%20based%20in
%20regexp|1||||pp|1||||10|0|||||||||||||3&other_mode=url_encode_separator_|
&apipass=1234&user=admin&pass=pandora
Example 2 (condition: value is not between 5 and 10, max_value: 10.00, min_value: 5.00, time_from: 00:00:00, time_to: 15:00:00, priority: CRITICAL, group: Servers): 351
API Calls
http://127.0.0.1/pandora_console/include/api.php?
op=set&op2=create_alert_template&id=template_min_max&other=max_min|template%20based
%20in%20range|NULL||||||10|5||||00:00:00|15:00:00|||||||||||4|
2&other_mode=url_encode_separator_|&apipass=1234&user=admin&pass=pandora
28.3.2.25. set update_alert_template
Update the template alert. Call sintax: •
•
•
•
op=set (compulsory) op2=update_alert_template (compulsory) id=<id_template> (compulsory) should be a template id. other=<serialized parameters> (compulsory) are the template configuration and data, serialized in the following order: • <template_name>
• <type [regex|max_min|max|min|equal|not_equal|warning|critical|onchange|unknown|
always]>
• <description>
• <id_alert_action>
• <field1>
• <field2>
• <field3>
• <value>
• <matches_value>
• <max_value>
• <min_value>
• <time_threshold>
• <max_alerts>
• <min_alerts>
• <time_from>
• <time_to>
• <monday>
• <tuesday>
• <wednesday>
• <thursday>
• <friday>
• <saturday>
• <sunday>
• <recovery_notify>
• <field2_recovery>
• <field3_recovery>
• <priority>
• <id_group>
352
API Calls
Examples
http://127.0.0.1/pandora_console/include/api.php?
op=set&op2=update_alert_template&id=38&other=example_template_with_changed_name|
onchange|changing%20from%20min_max%20to%20onchange||||||1||||5|1|||1|1|0|1|1|0|0|1|
field%20recovery%20example%201|field%20recovery%20example%202|1|
8&other_mode=url_encode_separator_|&apipass=1234&user=admin&pass=pandora
28.3.2.26. set delete_alert_template
Delete a alert template and delete the alerts that are using this template. Call sintax: •
•
•
•
op=set (compulsory) op2=delete_alert_template (compulsory) id=<id_template> (compulsory) should be a template id. other=<serialized parameters> (compulsory) are the template configuration and data, serialized in the following order: Examples
http://127.0.0.1/pandora_console/include/api.php?
op=set&op2=delete_alert_template&id=38&apipass=1234&user=admin&pass=pandora
28.3.2.27. set delete_module_template
Delete a module template. Call sintax: •
•
•
•
op=set (compulsory) op2=delete_module_template (compulsory) id=<id_template> (compulsory) should be a template id. other=<serialized parameters> (compulsory) are the template configuration and data, serialized in the following order: Examples
http://127.0.0.1/pandora_console/include/api.php?
op=set&op2=delete_module_template&id=38&apipass=1234&user=admin&pass=pandora
28.3.2.28. set stop_downtime
Stop a downtime. Call sintax: •
•
•
•
op=set (compulsory) op2=stop_downtime (compulsory) id=<id_downtime> (compulsory) should be a id downtime. other=<serialized parameters> (compulsory) are the downtime configuration and data, serialized in the following order: 353
API Calls
Examples
http://127.0.0.1/pandora_console/include/api.php?
op=set&op2=stop_downtime&id=1&apipass=1234&user=admin&pass=pandora
28.3.2.29. set new_user
Create a new user into Pandora. Call Syntax: •
•
•
•
op=set (compulsory) op2=new_user (compulsory) id=<user_name> (compulsory) will be an user name. other=<serialized parameters> (compulsory) are the user configuration and data, serialized in the following order: •
•
•
•
•
•
•
•
•
<fullname>
<firstname>
<lastname>
<middlename>
<password>
<email>
<phone>
<languages>
<comments>
Examples
http://127.0.0.1/pandora_console/include/api.php?
op=set&op2=new_user&id=md&other=miguel|de%20dios|matias|kkk|pandora|[email protected]|666|
es|descripcion%20y%20esas%20cosas&other_mode=url_encode_separator_|
&apipass=1234&user=admin&pass=pandora
28.3.2.30. Set update_user
Update a user selected by the id into the id parameter. Call Syntax: •
•
•
•
op=set (compulsory) op2=update_user (compulsory) id=<user_name> (compulsory) should be an user name. other=<serialized parameters> (compulsory) are the module configuration and data, serialized in the following order: •
•
•
•
•
<fullname>
<firstname>
<lastname>
<middlename>
<password>
354
API Calls
•
•
•
•
•
•
•
<email>
<phone>
<languages>
<comments>
<is_admin>
<block_size>
<flash_chart>
Examples
http://127.0.0.1/pandora_console/include/api.php?
op=set&op2=update_user&id=example_user_name&other=example_fullname||
example_lastname||example_new_passwd|example_email||example_language|example
%20comment|1|30|&other_mode=url_encode_separator_|
&apipass=1234&user=admin&pass=pandora
28.3.2.31. Set delete_user
Delete a selected user. Call syntax: • op=set (compulsory) • op2=delete_user (compulsory) • id=<nombre_usuario> (compulsory) should be an user name. Examples
http://127.0.0.1/pandora_console/include/api.php?
op=set&op2=delete_user&id=md&apipass=1234&user=admin&pass=pandora
28.3.2.32. set enable_disable_user
Enable a disabled user. Call syntax: • op=set (compulsory) • op2=enable_disable_user (compulsory) • id=<user_name> (compulsory) should be an user name. Examples
Example 1 (Disable user 'example_name') http://127.0.0.1/pandora_console/include/api.php?
op=set&op2=enable_disable_user&id=example_name&other=0&other_mode=url_encode_separat
or_|&apipass=1234&user=admin&pass=pandora
Example 2 (Enable user 'example_name') 355
API Calls
http://127.0.0.1/pandora_console/include/api.php?
op=set&op2=enable_disable_user&id=example_name&other=1&other_mode=url_encode_separat
or_|&apipass=1234&user=admin&pass=pandora
28.3.2.33. set create_group
Create a group. Call syntax: •
•
•
•
op=set (compulsory) op2=create_group (compulsory) id=<group_name> (compulsory) should be a group name. other=<serialized_parameters> (compulsory). Are the following in this order: • <icon name>
• <parent group id> (optional)
• <description> (optional)
Examples
Example 1 (with parent group: Servers) http://127.0.0.1/pandora_console/include/api.php?
op=set&op2=create_group&id=example_group_name&other=applications|
2&other_mode=url_encode_separator_|&apipass=1234&user=admin&pass=pandora
Example 2 (without parent group) http://127.0.0.1/pandora_console/include/api.php?
op=set&op2=create_group&id=example_group_name2&other=computer|
&other_mode=url_encode_separator_|&apipass=1234&user=admin&pass=pandora
28.3.2.34. Set add_user_profile
Add a profile into user. Call syntax: •
•
•
•
op=set (compulsory) op2=add_user_profile (compulsory) id=<user_name> (compulsory) should be an user name. other=<serialized parameters> (compulsory) are the group configuration and data and the profile, serialized in the following order: • <group>
• <profile>
356
API Calls
Examples
http://127.0.0.1/pandora_console/include/api.php?
op=set&op2=add_user_profile&id=md&other=12|4&other_mode=url_encode_separator_|
&apipass=1234&user=admin&pass=pandora
28.3.2.35. set delete_user_profile
Deattach a profile of user. Call syntax: •
•
•
•
op=set (compulsory) op2=delete_user_profile (compulsory) id=<user_name> (compulsory) should be an user name. other=<serialized parameters> (compulsory) are the group configuration, data and profile, serialized in the following order: • <group>
• <profile>
Examples
http://127.0.0.1/pandora_console/include/api.php?
op=set&op2=delete_user_profile&id=md&other=12|4&other_mode=url_encode_separator_|
&apipass=1234&user=admin&pass=pandora
28.3.2.36. set new_incident
Create a new incident. Call syntax: • op=set (compulsory) • op2=new_incident (compulsory) • other=<serialized parameters> (compulsory) are the incident configuration and data, serialized in the following order: •
•
•
•
•
•
<title>
<description>
<origin>
<priority>
<status>
<group>
Examples
http://127.0.0.1/pandora_console/include/api.php?
op=set&op2=new_incident&other=titulo|descripcion%20texto|Logfiles|2|10|
12&other_mode=url_encode_separator_|&apipass=1234&user=admin&pass=pandora
357
API Calls
28.3.2.37. Set new_note_incident
Add a note into a incident. Call syntax: •
•
•
•
•
op=set (compulsory) op2=new_note_incident (compulsory) id=<id_incident> (compulsory )the incident id. id2=<user_name> (compulsory) the user name. other=<note> (compulsory) is the note codified in url encode. Examples
http://127.0.0.1/pandora_console/include/api.php?
op=set&op2=new_note_incident&id=5&id2=miguel&other=una%20nota%20para%20la
%20incidencia&apipass=1234&user=admin&pass=pandora
28.3.2.38. set validate_all_alerts
Validate all alerts. Call syntax: • op=set (compulsory) • op2=validate_all_alerts (compulsory) Examples
http://127.0.0.1/pandora_console/include/api.php?
op=set&op2=validate_all_alerts&apipass=1234&user=admin&pass=pandora
28.3.2.39. set validate_all_policy_alerts
Validate the alerts created from a policy. Call syntax: • op=set (compulsory) • op2=validate_all_policy_alerts (compulsory) Examples
http://127.0.0.1/pandora_console/include/api.php?
op=set&op2=validate_all_policy_alerts&apipass=1234&user=admin&pass=pandora
28.3.2.40. set event_validate_filter
Validate all events that pass the filter pass as parameters. Call syntax: • op=set (compulsory) • op2=event_validate_filter (compulsory) 358
API Calls
• other_mode=url_encode_separator_|(optional) • other=<serialized_parameters> (optional). Are the following in this order: •
•
•
•
•
•
•
•
<separator>
<criticity> De 0 a 4
<agent name>
<module name>
<alert template name>
<user>
< numeric interval minimum level> en unix timestamp
< numeric interval maximum level> en unix timestamp
Examples
http://127.0.0.1/pandora_console/include/api.php?
op=set&op2=event_validate_filter&other_mode=url_encode_separator_|&other=;|
2&apipass=1234&user=admin&pass=pandora
28.3.2.41. set event_validate_filter_pro
It is the similar to previous call. Call syntax: •
•
•
•
op=set (compulsory)) op2=event_validate_filter_pro (compulsory) other_mode=url_encode_separator_| (optional) other=<serialized parameters> (optional), are the following in this order: •
•
•
•
•
•
•
•
<separator>
<criticity> From 0 to 4
<id agent>
<id module>
<id agent module alert>
<user>
<numeric interval minimum level> in unix timestamp
<numeric interval maximum level> in unix timestamp
Examples
http://127.0.0.1/pandora_console/include/api.php?
op=set&op2=event_validate_filter_pro&other_mode=url_encode_separator_|&other=;|
2&apipass=1234&user=admin&pass=pandora
28.3.2.42. set new_alert_template
Apply a new alert from a template and module pass as id agent and name of module. Call syntax: 359
API Calls
•
•
•
•
•
•
op=set (ob) op2=new_alert_template (compulsory) id=<agent name> (compulsory) id2=<alert template name> (compulsory) other_mode=url_encode_separator_| (optional) other=<serialized parameter> (optional), are the following in this order: • <module name> (compulsory)
Examples
http://127.0.0.1/pandora_console/include/api.php?
op=set&op2=new_alert_template&id=miguelportatil&id2=test&other_mode=url_encode_separator_|
&other=memfree&apipass=1234&user=admin&pass=pandora
28.3.2.43. set alert_actions
Add actions into a alert. Call syntax: •
•
•
•
•
•
op=set (compulsory) op2=alert_actions (compulsory) id=<agent name> (compulsory) id2=<alert template name> (compulsory) other_mode=url_encode_separator_| (optional) other=<serialized parameters> (optional), are the following in this order: •
•
•
•
<module name> (compulsory)
<action name> (compulsory)
<fires min > (optional)
<fires max > (optional)
Examples
http://127.0.0.1/pandora_console/include/api.php?op=set&op2=alert_actions&id=miguelportatil&id2=test&other_mode=url_encode_separator_|&other=memfree|
test&apipass=1234&user=admin&pass=pandora
http://127.0.0.1/pandora_console/include/api.php?op=set&op2=alert_actions&id=miguelportatil&id2=test&other_mode=url_encode_separator_|&other=memfree|test|1|
3&apipass=1234&user=admin&pass=pandora
28.3.2.44. set new_module
Create a new module. Call Syntax: • op=set (compulsory) • op2=new_module (compulsory) 360
API Calls
•
•
•
•
id=<agent_name> (compulsory) id2=<new module name> (compulsory) other_mode=url_encode_separator_| (optional) other=<serialized parameters> (optional), are the following in this order: •
•
•
•
•
•
•
•
•
•
•
•
•
•
•
<network module kind > (compulsory)
<action name> (compulsory)
<ip o url > (compulsory)
<port > (optional)
<description > (optional)
<min > (optional)
<max > (optional)
<post process > (optional)
<module interval > (optional)
<min warning > (optional)
<max warning > (optional)
<min critical > (optional)
<max critical > (optional)
<history data > (optional)
<enable_unknown_events> (only in version 5)
Examples
http://127.0.0.1/pandora_console/include/api.php?op=set&op2=new_module&id=miguelportatil&id2=juanito&other_mode=url_encode_separator_|&other=remote_tcp_string|
localhost|33|descripcion%20larga&apipass=1234&user=admin&pass=pandora
28.3.2.45. set delete_module
Delete a module. Call syntax: •
•
•
•
•
op=set (compulsory) op2=delete_module (compulsory) id=<agent name> (compulsory) id2=<module name> (compulsory) other=simulate (optional) Examples
http://127.0.0.1/pandora_console/include/api.php?op=set&op2=delete_module&id=miguelportatil&id2=juanito&other=simulate&apipass=1234&user=admin&pass=pandora
http://127.0.0.1/pandora_console/include/api.php?op=set&op2=delete_module&id=miguelportatil&id2=juanito&apipass=1234&user=admin&pass=pandora
361
API Calls
28.3.2.46. set enable_alert
Enable a alert of a agent. Call syntax •
•
•
•
•
op=set (mandatory) op2=enable_alert id=<Agent name> (mandatory) id2=<Module name> (mandatory) other: Alert template name (p.e: Warning event) (mandatory) Examples
http://localhost/pandora_console/include/api.php?
op=set&op2=enable_alert&id=garfio&id2=Status&other=Warning
%20condition&apipass=1234&user=admin&pass=pandora
28.3.2.47. set disable_alert
Disable a alert of a agent. Call syntax: •
•
•
•
•
op=set (mandatory) op2=disable_alert id=<Agent name> (mandatory) id2=<Module name> (mandatory) other: Alert template name (p.e: Warning event) (mandatory) Examples
http://localhost/pandora_console/include/api.php?
op=set&op2=disable_alert&id=garfio&id2=Status&other=Warning
%20condition&apipass=1234&user=admin&pass=pandora
28.3.2.48. set enable_module_alerts
Equal to the enable_alert api call. Call syntax: •
•
•
•
op=set (obligatorio) op2=enable_module_alerts id=<Nombre del agente> (obligatorio) id2=<Nombre del modulo> (obligatorio) 362
API Calls
Examples
http://localhost/pandora_console/include/api.php?
op=set&op2=enable_module_alerts&id=garfio&id2=Status&apipass=1234&user=admin&pass=pa
ndora
28.3.2.49. set disable_module_alerts
Equal to the call api disable_alert. Call syntax: •
•
•
•
op=set (obligatorio) op2=disable_module_alerts id=<Nombre del agente> (obligatorio) id2=<Nombre del modulo> (obligatorio) Examples
http://localhost/pandora_console/include/api.php?
op=set&op2=disable_module_alerts&id=garfio&id2=Status&apipass=1234&user=admin&pass=p
andora
28.3.2.50. set enable_module
Enable the module. Call syntax •
•
•
•
op=set (mandatory) op2=enable_module id=<Agent name> (mandatory) id2=<Module name> (mandatory) Examples
http://localhost/pandora_console/include/api.php?
op=set&op2=enable_module&id=garfio&id2=Status&apipass=1234&user=admin&pass=pandora
28.3.2.51. set disable_module
Disable the module. Call syntax •
•
•
•
op=set (mandatory) op2=disable_module id=<Agent name> (mandatory) id2=<Module name> (mandatory) 363
API Calls
Examples
http://localhost/pandora_console/include/api.php?
op=set&op2=disable_module&id=garfio&id2=Status&apipass=1234&user=admin&pass=pandora
28.3.2.52. set create_network_module_from_component
Create a new network module from a component. Call syntax: •
•
•
•
op=set (mandatory) op2=create_network_module_from_component (mandatory) id=<Nombre del agente> (mandatory) id2=<Nombre del componente> (mandatory) Examples
http://localhost/pandora_console/include/api.php?
op=set&op2=create_network_module_from_component&id=garfio&id2=OS Total
process&apipass=1234&user=admin&pass=pandora
28.3.2.53. set module_data
Add module value. Call syntax: •
•
•
•
op=set (mandatory) op2=module_data (mandatory) id=<id agente módulo> (mandatory) other: module data and timestamp serialized. • dato: data which must belong to any Pandora data type. • tiempo: could be a specified timestamp of the string "now". Example
http://127.0.0.1/pandora_console/include/api.php?
op=set&op2=module_data&id=14&other_mode=url_encode_separator_|&other=123|
now&apipass=1234&user=admin&pass=pandora
28.3.2.54. set add_module_in_conf
>= 5.0 (Only Enterprise) Add the configuration into a local module. Call syntax: • op=set (mandatory) • op2=add_module_in_conf (mandatory) • id=<id agente> (mandatory) 364
API Calls
• id2=<nombre módulo> (mandatory) • other: The module data that will be placed in the conf file encoded in base64 (mandatory) (mandatory) Examples
http://127.0.0.1/pandora_console/include/api.php?
op=set&op2=add_module_in_conf&user=admin&pass=pandora&id=9043&id2=example_name&other
=bW9kdWxlX2JlZ2luCm1vZHVsZV9uYW1lIGV4YW1wbGVfbmFtZQptb2R1bGVfdHlwZSBnZW5lcmljX2RhdGE
KbW9kdWxlX2V4ZWMgZWNobyAxOwptb2R1bGVfZW5k
Will be returned '0' when success, '1' when error, '2' if already exists 28.3.2.55. set delete_module_in_conf
>= 5.0 (Only Enterprise) Delete a configuration of local module. Call syntax: •
•
•
•
op=set (mandatory) op2=add_module_in_conf (mandatory) id=<id agente> (mandatory) id2=<module name> (mandatory) Examples
http://127.0.0.1/pandora_console/include/api.php?
op=set&op2=add_module_in_conf&user=admin&pass=pandora&id=9043&id2=example_name
Will be returned '0' when success or '1' when error 28.3.2.56. set update_module_in_conf
>= 5.0 (Only Enterprise) Update a configuration of local module. Call syntax: •
•
•
•
•
op=set (mandatory) op2=update_module_in_conf (mandatory) id=<agent id> (mandatory) id2=<module name> (mandatory) other: The new module data that will be placed in the conf file encoded in base64 (mandatory) Ejemplos
http://127.0.0.1/pandora_console/include/api.php?
op=set&op2=update_module_in_conf&user=admin&pass=pandora&id=9043&id2=example_name&ot
her=bW9kdWxlX2JlZ2luCm1vZHVsZV9uYW1lIGV4YW1wbGVfbmFtZQptb2R1bGVfdHlwZSBnZW5lcmljX2Rh
dGEKbW9kdWxlX2V4ZWMgZWNobyAxOwptb2R1bGVfZW5k
365
API Calls
Will be returned '1' when no changes, '0' when success, '1' when error, '2' if doesn't exist 28.3.2.57. set create_event
Create a new event into Pandora. Call syntax: • op=set (mandatory) • op2=create_event (mandatory) • other=<serialized_parameters> (mandatory) event's configuration data as follows: •
•
•
•
•
•
•
•
•
•
•
•
•
•
•
•
•
<event_text> (mandatory)
<id_group> (mandatory)
<id_agent> (mandatory)
<status>
<id_user>
<evnet_type>
<severity>
<id_agent_module>
<id_alert_am>
<critical_instructions>
<warning_instructions>
<unknown_instructions>
<comment>
<user_comment>
<source>
<tags>
<custom_data> Custom data should be a base 64 encoded JSON document.
Examples
http://127.0.0.1/pandora_trunk/include/api.php?
op=set&op2=create_event&other=NewEvent|0|189||apiuser|system|1||||||||VMware||
eyJBbnN3ZXIgdG8gdGhlIFVsdGltYXRlIFF1ZXN0aW9uIG9mIExpZmUsIHRoZSBVbml2ZXJzZSwgYW5kIEV2
ZXJ5dGhpbmciOiA0Mn0=&other_mode=url_encode_separator_|
&apipass=1234&user=admin&pass=pandora
28.3.2.58. set create_netflow_filter
(>=5.0) Create a new filter of netflow. Call syntax: • op=set (mandatory) • op2=create_netflow_filter (mandatory) • other=<serialized parameters> (mandatory) filter data in this order: • <filter_name> (mandatory)
• <group_id> (mandatory)
366
API Calls
• <filter> (mandatory)
• <aggregate_by> (Possible values: dstip,dstport,none,proto,srcip,srcport) (mandatory)
• <output_format> (Possible values:
kilobytes,kilobytespersecond,megabytes,megabytespersecond) (mandatory)
Examples
http://127.0.0.1/pandora/include/api.php?
op=set&op2=create_netflow_filter&apipass=1234&user=admin&pass=pandora&other=Filter
%20name|9|host%20192.168.50.3%20OR%20host%20192.168.50.4%20or%20HOST%20192.168.50.6|
dstport|kilobytes&other_mode=url_encode_separator_|
28.3.2.59. set create_custom_field
>= 5.0 Create a new custom field. Call syntax: • op=set (mandatory) • op2=create_custom_field (mandatory) • other=<serialized parameters> (mandatory) parameters to configure the custom field • <name> (mandatory)
• <flag_display_front> (mandatory; 0 the field will not be displayed on operation view,
1 the field will be displayed)
Example
http://127.0.0.1/pandora_console/include/api.php?
op=set&op2=create_custom_field&other=mycustomfield|
0&other_mode=url_encode_separator_|&apipass=1234&user=admin&pass=pandora
28.3.2.60. set create_tag
>= 5.0 Create a new tag. Sintaxis de la llamada: • op=set (mandatory) • op2=create_tag (mandatory) • other=<serialized parameters> (mandatory) parameters to configure the tag •
•
•
•
<name> Tag's name (mandatory)
<description> Tag's description
<eurl> Tag's URL
<email> Tag's email
367
API Calls
Ejemplo
http://127.0.0.1/pandora_console/include/api.php?
op=set&op2=create_tag&other=tag_name|tag_description|tag_url|
tag_email&other_mode=url_encode_separator_|&apipass=1234&user=admin&pass=pandora
28.3.2.61. set enable_disable_agent
Enable / disabled agent. Call syntax: • op=set (compulsory) • op2=enable_disable_agent (compulsory) • id=<agent_id> (compulsory) should be an agent id. Examples
Example 1 (Disable agent 'example_id') http://127.0.0.1/pandora_console/include/api.php?
op=set&op2=enable_disable_agent&id=example_id&other=0&other_mode=url_encode_separato
r_|&apipass=1234&user=admin&pass=pandora
Example 2 (Enable agent 'example_id') http://127.0.0.1/pandora_console/include/api.php?
op=set&op2=enable_disable_agent&id=example_id&other=1&other_mode=url_encode_separato
r_|&apipass=1234&user=admin&pass=pandora
28.3.2.62. set gis_agent_only_position
>= 5.0 Add new position GIS in any agent. Call syntax: •
•
•
•
op=set (compulsory) op2=gis_agent_only_position (compulsory) id=<índice> (compulsory) agent index other=<parámetros serializados> (compulsory) params to set position • <latitude> Latitude
• <longitude> Longitude
• <altitude> Altitude
Ejemplo
http://127.0.0.1/pandora5/include/api.php?
apipass=caca&user=admin&pass=pandora&op=set&op2=gis_agent_only_position&id=582&other
_mode=url_encode_separator_|&other=2%7C1%7C0
368
API Calls
28.3.2.63. set gis_agent
>= 5.0 Add the gis data agent. Call syntax: •
•
•
•
op=set (compulsory) op2=gis_agent_only_position (compulsory) id=<índice> (compolsory) agent index. other=<parámetros serializados> (compulsory) gis data •
•
•
•
•
•
•
•
•
•
•
<latitude>
<longitude>
<altitude>
<ignore_new_gis_data>
<manual_placement>
<start_timestamp>
<end_timestamp>
<number_of_packages>
<description_save_history>
<description_update_gis>
<description_first_insert>
28.4. Examples Several examples in several languages about to call Pandora API. Ejemplo
http://127.0.0.1/pandora5/include/api.php?
apipass=caca&user=admin&pass=pandora&op=set&op2=gis_agent&id=582&other_mode=url_enco
de_separator_|&other=2%7C2%7C0%7C0%7C0%7C2000-01-01+01%3A01%3A01%7C0%7C666%7Caaa
%7Cbbb%7Cccc
28.4.1. PHP <?php
$ip = '192.168.70.110';
$pandora_url = '/pandora5';
$apipass = '1234';
$user = 'admin';
$password = 'pandora';
$op = 'get';
$op2 = 'all_agents';
$return_type = 'csv';
$other = '';
$other_mode = '';
$url = "http://" . $ip . $pandora_url . "/include/api.php";
$url .= "?";
369
Examples $url .=
$url .=
$url .=
$url .=
$url .=
if ($id
"apipass=" . $apipass;
"&user=" . $user;
"&pass=" . $password;
"&op=" . $op;
"&op2=" . $op2;
!== '') {
$url .= "&id=" . $id;
}
if ($id2 !== '') {
$url .= "&id2=" . $id2;
}
if ($return_type !== '') {
$url .= "&return_type=" . $return_type;
}
if ($other !== '') {
$url .= "&other_mode=" . $other_mode;
$url .= "&other=" . $other;
}
$curlObj = curl_init();
curl_setopt($curlObj, CURLOPT_URL, $url);
curl_setopt($curlObj, CURLOPT_RETURNTRANSFER, 1);
$result = curl_exec($curlObj);
curl_close($curlObj);
$agents = array();
if (!empty($result)) {
$lines = explode("\n", $result);
foreach ($lines as $line) {
$fields = explode(";", $line);
$agent = array();
$agent['id_agent'] = $fields[0];
$agent['name'] = $fields[1];
$agent['ip'] = $fields[2];
$agent['description'] = $fields[3];
$agent['os_name'] = $fields[4];
$agent['url_address'] = $fields[5];
$agents[] = $agent;
}
}
print_list_agents($agents);
function print_list_agents($agents) {
echo "<table border='1' style='empty-cells: show;'>";
echo
echo
echo
echo
echo
echo
echo
echo
echo
echo
"<thead>";
"<tr>";
"<th>" . "ID" . "</th>";
"<th>" . "Name" . "</th>";
"<th>" . "IP" . "</th>";
"<th>" . "Description" . "</th>";
"<th>" . "OS" . "</th>";
"<th>" . "URL" . "</th>";
"</tr>";
"</thead>";
foreach ($agents as $agent) {
echo "<tr>";
echo "<td>" . $agent['id_agent'] . "</td>";
echo "<td>" . $agent['name'] . "</td>";
echo "<td>" . $agent['ip'] . "</td>";
echo "<td>" . $agent['description'] . "</td>";
370
Examples echo "<td>" . $agent['os_name'] . "</td>";
echo "<td>" . $agent['url_address'] . "</td>";
echo "</tr>";
}
echo "</table>";
}
?>
28.4.2. Python import pycurl
import cStringIO
import pprint
def main():
ip = '192.168.70.110'
pandora_url = '/pandora5'
apipass = '1234'
user = 'admin'
password = 'pandora'
op = 'get'
op2 = 'all_agents'
return_type = 'csv'
other = ''
other_mode = ''
url = "http://" + ip
url
url
url
url
url
url
+=
+=
+=
+=
+=
+=
+ pandora_url + "/include/api.php"
"?"
"apipass=" + apipass
"&user=" + user
"&pass=" + password
"&op=" + op
"&op2=" + op2
buf = cStringIO.StringIO()
c = pycurl.Curl()
c.setopt(c.URL, url)
c.setopt(c.WRITEFUNCTION, buf.write)
c.perform()
output = buf.getvalue()
buf.close()
lines = output.split("\n")
agents = []
for line in lines:
if not line:
continue
fields = line.split(";")
agent = {}
agent['id_agent'] = fields[0]
agent['name'] = fields[1]
agent['ip'] = fields[2]
agent['description'] = fields[3]
agent['os_name'] = fields[4]
agent['url_address'] = fields[5]
agents.append(agent)
371
Examples for agent in agents:
print("---- Agent #" + agent['id_agent'] + " ----")
print("Name: " + agent['name'])
print("IP: " + agent['ip'])
print("Description: " + agent['description'])
print("OS: " + agent['os_name'])
print("URL: " + agent['url_address'])
print("")
if __name__ == "__main__":
main()
28.4.3. Perl use strict;
use warnings;
use WWW::Curl::Easy;
sub write_callback {
my ($chunk,$variable) = @_;
push @{$variable}, $chunk;
return length($chunk);
}
my
my
my
my
my
my
my
my
my
my
$ip = '192.168.70.110';
$pandora_url = '/pandora5';
$apipass = '1234';
$user = 'admin';
$password = 'pandora';
$op = 'get';
$op2 = 'all_agents';
$return_type = 'csv';
$other = '';
$other_mode = '';
my $url
$url .=
$url .=
$url .=
$url .=
$url .=
$url .=
= "http://" . $ip . $pandora_url . "/include/api.php";
"?";
"apipass=" . $apipass;
"&user=" . $user;
"&pass=" . $password;
"&op=" . $op;
"&op2=" . $op2;
my @body;
my $curl = WWW::Curl::Easy->new;
$curl->setopt(CURLOPT_URL, $url);
$curl->setopt(CURLOPT_WRITEFUNCTION, \&write_callback);
$curl->setopt(CURLOPT_FILE, \@body);
$curl->perform();
my $body=join("",@body);
my @lines = split("\n", $body);
foreach my $line (@lines) {
my @fields = split(';', $line);
372
Examples print("\n---- Agent #" . $fields[0] . " ----");
print("\nName: " . $fields[1]);
print("\nIP: " . $fields[2]);
print("\nDescription: " . $fields[3]);
print("\nOS: " . $fields[4]);
print("\n");
}
28.4.4. Ruby require 'open-uri'
ip = '192.168.70.110'
pandora_url = '/pandora5'
apipass = '1234'
user = 'admin'
password = 'pandora'
op = 'get'
op2 = 'all_agents'
return_type = 'csv'
other = ''
other_mode = ''
url = "http://" + ip
url
url
url
url
url
url
+=
+=
+=
+=
+=
+=
+ pandora_url + "/include/api.php"
"?"
"apipass=" + apipass
"&user=" + user
"&pass=" + password
"&op=" + op
"&op2=" + op2
agents = []
open(url) do |content|
content.each do |line|
agent = {}
tokens = line.split(";")
agent[:id_agent] = tokens[0]
agent[:name] = tokens[1]
agent[:ip] = tokens[2]
agent[:description] = tokens[3]
agent[:os_name] = tokens[4]
agent[:url_address] = tokens[5]
agents.push agent
end
end
agents.each do |agent|
print("---- Agent #" + (agent[:id_agent] || "") + " ----\n")
print("Name: " + (agent[:name] || "") + "\n")
print("IP: " + (agent[:ip] || "") + "\n")
print("Description: " + (agent[:description] || "") + "\n")
print("OS: " + (agent[:os_name] || "") + "\n")
print("URL: " + (agent[:url_address] || "") + "\n")
print("\n")
373
Examples end
28.4.5. Lua require("curl")
local content = ""
function WriteMemoryCallback(s)
content = content .. s
return string.len(s)
end
ip = '192.168.70.110'
pandora_url = '/pandora5'
apipass = '1234'
user = 'admin'
password = 'pandora'
op = 'get'
op2 = 'all_agents'
return_type = 'csv'
other = ''
other_mode = ''
url = "http://" .. ip
url
url
url
url
url
url
=
=
=
=
=
=
url
url
url
url
url
url
..
..
..
..
..
..
.. pandora_url .. "/include/api.php"
"?"
"apipass=" .. apipass
"&user=" .. user
"&pass=" .. password
"&op=" .. op
"&op2=" .. op2
if curl.new then c = curl.new() else c = curl.easy_init() end
c:setopt(curl.OPT_URL, url)
c:setopt(curl.OPT_WRITEFUNCTION, WriteMemoryCallback)
c:perform()
for line in string.gmatch(content, "[^\n]+") do
line = string.gsub(line, "\n", "")
count = 0
for field in string.gmatch(line, "[^\;]+") do
if count == 0 then
print("---- Agent #" .. field .. " ----")
end
if count == 1 then
print("Name: " .. field)
end
if count == 2 then
print("IP: " .. field)
end
if count == 3 then
print("Description: " .. field)
end
if count == 4 then
print("OS: " .. field)
end
374
Examples if count == 5 then
print("URL: " .. field)
end
count = count + 1
end
print("")
end
28.4.6. Brainfuck [-]>[-]<
>+++++++++[<+++++++++>-]<-.
>+++++[<+++++>-]<----.
>++++[<++++>-]<---.
>++++[<---->-]<++.
>+++[<+++>-]<++.
-.
>++++++++[<-------->-]<--.
>+++[<--->-]<---.
>++++++++[<++++++++>-]<++++.
+.
>++++++++[<-------->-]<-----.
>+++++++++[<+++++++++>-]<----.
++.
--.
>+++[<--->-]<+.
>+++[<+++>-]<.
>++[<++>-]<++.
>++[<-->-]<-.
>+++++++++[<--------->-]<++.
>+++++++++[<+++++++++>-]<---.
+.
>+++++++++[<--------->-]<++.
>+++++++++[<+++++++++>-]<+++.
>++++[<---->-]<+.
>+++[<+++>-]<.
>+++[<--->-]<++.
>+++[<+++>-]<-.
>+++++++++[<--------->-]<++.
>+++++++++[<+++++++++>-]<+++.
>+++[<--->-]<--.
----.
>+++[<+++>-]<-.
+++.
-.
>+++++++++[<--------->-]<++.
>+++++++++[<+++++++++>-]<-.
>++++[<---->-]<+.
>++++[<++++>-]<+.
>++++[<---->-]<-.
>++++++++[<-------->-]<-.
>++++++++[<++++++++>-]<++++++++.
>+++[<--->-]<++.
++.
++.
>++++[<++++>-]<---.
>++[<-->-]<--.
+++.
>++++++++[<-------->-]<---.
>+++[<--->-]<---.
375
Examples >+++++++++[<+++++++++>-]<-.
>+++[<--->-]<--.
>++++[<++++>-]<---.
---.
>+++++++++[<--------->-]<++.
>+++++++++[<+++++++++>-]<+++++.
>+++++[<----->-]<++++.
>+++[<+++>-]<++.
>+++[<--->-]<++.
>++++++++[<-------->-]<-----.
>+++++++++[<+++++++++>-]<----.
>+++[<+++>-]<-.
>++++[<---->-]<--.
>++[<++>-]<+.
>+++[<+++>-]<--.
++++.
>+++++++++[<--------->-]<--.
>++++++++[<++++++++>-]<++++++.
>+++[<+++>-]<+++.
>+++[<--->-]<.
++.
--.
>+++[<+++>-]<--.
>++[<++>-]<+.
>+++[<--->-]<++.
>++[<++>-]<++.
>++[<-->-]<-.
++++.
>++++++++[<-------->-]<-----.
28.4.7. Java (Android) Please you can see our project (Pandora Event Viewer) in Pandroid Event Viewer source code in SourceForge SVN repository but this is piece of code for get the data of events across the API. /**
* Performs an http get petition.
*
* @param context
*
Application context.
* @param additionalParameters
*
Petition additional parameters
* @return Petition result.
* @throws IOException
*
If there is any problem with the connection.
*/
public static String httpGet(Context context,
List<NameValuePair> additionalParameters) throws IOException
{
SharedPreferences preferences = context.getSharedPreferences(
context.getString(R.string.const_string_preferences)
,
Activity.MODE_PRIVATE);
String url = preferences.getString("url", "") + "/include/api.php";
String user = preferences.getString("user", "");
String password = preferences.getString("password", "");
String apiPassword = preferences.getString("api_password", "");
if (url.length() == 0 || user.length() == 0) {
return "";
}
376
Examples ArrayList<NameValuePair> parameters = new
ArrayList<NameValuePair>();
parameters.add(new BasicNameValuePair("user", user));
parameters.add(new BasicNameValuePair("pass", password));
if (apiPassword.length() > 0) {
parameters.add(new BasicNameValuePair("apipass",
apiPassword));
}
parameters.addAll(additionalParameters);
Log.i(TAG, "sent: " + url);
if (url.toLowerCase().contains("https")) {
// Secure connection
return Core.httpsGet(url, parameters);
} else {
HttpParams params = new BasicHttpParams();
HttpConnectionParams.setConnectionTimeout(params,
CONNECTION_TIMEOUT);
HttpConnectionParams.setSoTimeout(params,
CONNECTION_TIMEOUT);
DefaultHttpClient httpClient = new
DefaultHttpClient(params);
UrlEncodedFormEntity entity;
HttpPost httpPost;
HttpResponse response;
HttpEntity entityResponse;
String return_api;
httpPost = new HttpPost(url);
entity = new UrlEncodedFormEntity(parameters);
httpPost.setEntity(entity);
response = httpClient.execute(httpPost);
entityResponse = response.getEntity();
return_api = Core
.convertStreamToString(entityResponse.getCon
tent());
Log.i(TAG, "received: " + return_api);
return return_api;
}
}
28.5. Future of API.php
Some ideas for the future of api.php are: •
•
•
•
Increase the API calls group. Return and get values in xml, jason... Increase the call security for insecure environments. Integrate with third tools standards. 377
Future of API.php
29 PANDORA FMS CLI 378
Pandora FMS CLI The Pandora FMS CLI (CommandLine Interface) is used for making calls in command line on the file /util/pandora_manage.pl. This method is specially useful to integrate applications of thirds parts with Pandora FMS through automated tasks. Basically, it consists on one call with the parameters formated to do and action such as the creation an elimination of one agent, one module or one user, among other things. The CLI is a file in Perl, so one call to CLI is as easy as this: perl pandora_manage.pl <pandora_server.conf path> <option> <option parameters>
Pandora FMS CLI has the following options: • Agents • create_agent: Create an agent • update_agent: Update an agent field • delete_agent: Delete an agent • disable_group: Disable all agents from one group • enable_group: Enable all agents from one group • create_group: Create a group • stop_downtime: Stop a planned downtime • get_agent_group: Get the group name of a given agent • get_agent_modules: Get the module list of a given agent • get_agents: Get list of agents with optative filter parameters • delete_conf_file: Delete a local conf of a given agent • clean_conf_file: Clean a local conf of a given agent deleting all modules, policies and collections data • get_bad_conf_files: Get the files bad configured (without essential tokens) • Módulos • create_data_module: Add one data module to one agent • create_network_module: Add one network module to one agent • create_snmp_module:Add one SNMP module to one agent • create_plugin_module: Add one module kind plugin to one agent • delete_module: Delete one module from one agent • data_module: Insert data to one module • get_module_data: Show data from one module in the last X seconds (interval) in CSV format • delete_data Delete the historic data from a module, from the modules of one agent or from the modules of the agents of one group • update_module: Update one module field • Alerts • create_template_module: Add an alert template to an agent. • delete_template_module: Delete an alert template from an agent. • create_template_action: Create an action to one agent • delete_template_action: Delete an action from an agent • disable_alerts: Disable alerts in all groups. • enable_alerts: Enable alerts in all groups. 379
Pandora FMS CLI •
•
•
•
•
• create_alert_template: Create an alert template • delete_alert_template: Delete an alert template • update_alert_template: Update field of an alert template • validate_all_alerts: Validate all the alerts Users • create_user: Create one user. • delete_user: Delete one user. • update_user: Update field of a user • enable_user: Enable a given user • disable_user: Disable a given user • create_profile: Add a profile to an user. • delete_profile: Delete a profile from an user. • add_profile_to_user: Add a profile to a user in a group • disable_eacl: Disable the ACL Enterprise system. • enable_eacl: Enable the ACL Enterprise system. Events • create_event: Create an event. • validate_event: Validate an event. • validate_event_id: Validate an event given a event id. • get_event_info:Display info about a event given a event id. Incidents • create_incident Crete a incident Policies • apply_policy Force a policy application • apply_all_policies: Add to the application queue all the policies • add_agent_to_policy: Add an agent to a policy • delete_not_policy_modules Delete all the modules not associated to policies from the conf file • disable_policy_alerts: Disable all the alerts from a policy • create_policy_data_module: Create a policy data module • create_policy_network_module: Create a policy network module • create_policy_snmp_module: Create a policy SNMP module • create_policy_plugin_module: Create a policy plugin module • validate_policy_alerts: Validate all the alerts of a given policy • get_policy_modules: Get the module list of a policy • get_policies: Get all the policies (without parameters) or the policies of a given agent (agent name as parameter) Tools • exec_from_file: Execute any CLI option using macros from a CSV file 29.1.1. Agents
29.1.1.1. Create_agent
Parameters: <agent_name> <operative_system> <group_name> <server_name> [<address> <description> <interval>] Description: An agent with the name, the operative system, the group and the server specified will be created. Optionally, it will be possible to give it an address ( IP or name), a description and an interval in seconds (by default 300). 380
Pandora FMS CLI Example: perl pandora_manage.pl /etc/pandora/pandora_server.conf --create_agent 'My agent'
Windows Databases Central-Server 192.168.12.123 'Agent description' 600
29.1.1.2. Update_agent
(>=5.0) Parameters: <agent_name> <field> <new_value> Description: A given field of an existent agent will be updated. The possible fields are the following: agent_name, address, description, group_name, interval, os_name, disabled, parent_name, cascade_protection, icon_path, update_gis_data, custom_id. Example: perl pandora_manage.pl /etc/pandora/pandora_server.conf --update_agent 'Agent name'
group_name 'Network'
29.1.1.3. Delete_agent
Parameters: <agent_name> Descripción: The agent processed will be deleted with name as parameter Example: perl pandora_manage.pl /etc/pandora/pandora_server.conf --delete_agent 'Mi agente'
29.1.1.4. Disable_group
Parameters: <group_name> Description: the agents of the group considered as parameter will be disabled with the execution of this option. If we pass 'All' as group, all agents from all groups will be disabled. Example: perl pandora_manage.pl /etc/pandora/pandora_server.conf --disable_group Firewalls
29.1.1.5. Enable_group
Parameters: <group_name> Description: The agents of the group considered as parameter will be disabled with the execution of this option. If we pass 'All' as group all agents from all groups will be enabled. Example: perl pandora_manage.pl /etc/pandora/pandora_server.conf --enable_group All
381
Pandora FMS CLI 29.1.1.6. Create_group
Parameters: <group_name> [<parent_group_name> <icon> <description>] Description: A new group will be created if it doesn't exist and optionally, can be assigned a parent group, a icon (the icon name without extension) and description. The parent group by default is 'All' and the default icon is empty string (without icon) Example: perl pandora_manage.pl /etc/pandora/pandora_server.conf --create_group 'New group'
'Parent group' 'computer'
29.1.1.7. Stop_downtime
(>=5.0) Parameters: <downtime_name> Description: Stop a planned downtime. If the downtime is finished, a message will be showed Example: perl pandora_manage.pl /etc/pandora/pandora_server.conf --show_downtime 'Downtime
name'
29.1.1.8. Get_agent_group
(>=5.0) Parameters: <agent_name> Description: Get the group name of a given agent Example: perl pandora_manage.pl /etc/pandora/pandora_server.conf --get_agent_group 'Agent
name'
29.1.1.9. Get_agent_modules
(>=5.0) Parameters: <agent_name> Description: Get the module list (id and name) of a given agent Example: perl pandora_manage.pl /etc/pandora/pandora_server.conf --get_agent_modules 'Agent
name'
29.1.1.10. Get_agents
(>=5.0) 382
Pandora FMS CLI Parameters: [<group_name> <os_name> <status> <max_modules> <filter_substring> <policy_name>] Description: Get list of agents with optative filter parameters Possible values for the parameter <status>: critical, warning, unknown, normal Example: perl pandora_manage.pl /etc/pandora/pandora_server.conf --get_agents 'Network'
'Linux' 'critical'
'Policy name'
29.1.1.11. Delete_conf_file
(>=5.0) Parameters: <agent_name> Description: The conf file of one agent will be deleted Example: perl pandora_manage.pl /etc/pandora/pandora_server.conf --delete_conf_file 'Agent
name'
29.1.1.12. Clean_conf_file
(>=5.0) Parameters: [<agent_name>] Description: The conf file of one or all agents (without parameters) will be cleaned (All modules, policies, file collections and comments will be deleted). Example: perl pandora_manage.pl /etc/pandora/pandora_server.conf --clean_conf_file 'Agent
name'
29.1.1.13. Get_bad_conf_files
(>=5.0) Parameters: No Description: A list of the bad configurated conf files will be showed (Files without main tokens: server_ip,server_path,temporal,logfile) Example: perl pandora_manage.pl /etc/pandora/pandora_server.conf --get_bad_conf_files
383
Pandora FMS CLI 29.1.2. Modules
29.1.2.1. Create_data_module
Parameters: <module_name> <module_kind> <agent_name> [<description> <module_group> <min> <max> <post_process> <interval> <warning_min> <warning_max> <critical_min> <critical_max> <history_data> <def_file> <warning_str> <critical_str> <enable_unknown_events>] Description: A module kind data will be created in an agent with the module name, kind of module and name of the agent where it will be created. Optionally it will be possible to give a description, the module group, min and max values, a post_process value, an interval in seconds, min and max warning values, min and max critical values, a history data value and one module definition file. The module definition file will contain some like this: module_begin
module_name My module
module_type generic_data
module_exec cat /proc/meminfo
module_end
| grep MemFree | awk '{ print $2 }'
The default values are 0 for the minimum and maximum, history_data and post_process and 300 for the interval. Notes: The next parameters are only for the Pandora version 5 and next versions: • <enable_unknown_events> Example: perl pandora_manage.pl /etc/pandora/pandora_server.conf --create_data_module 'My
module' generic_data 'My agent' 'module description' 'General' 1 3 0 300 0 0 0 0
1 /home/user/filedefinition 'string for warning' 'string for critical'
If you introduce a different name or kind between the parameters and the file definition, the fixed on the file will have priority. 29.1.2.2. Create_network_module
Parameters: <module_name> <module_kind> <agent_name> <module_address> [<module_port> <descriptionn> <module_group> <min> <max> <post_process> <interval> <warning_min> <warning_max> <critical_min> <critical_max> <history_data> <warning_str> <critical_str> <enable_unknown_events>] Description: A network module will be created in an agent with the module name, kind of module, name of the agent where it will be created and the module address specified. Optionaly, it will be possible to give it a port, a description, values min and max, a post_process value, an interval in seconds, a warning min and max values, critical min and max values and a history data value. The default values are 0 for the min and max, history_data and post_process an another 300 for the interval. the port is optional, so the modules kind ICMP don't need it. In the rest of kinds, it is necessary to specify one module. 384
Pandora FMS CLI Notes: The next parameters are only for the Pandora version 5 and next versions: • <enable_unknown_events> Example: perl pandora_manage.pl /etc/pandora/pandora_server.conf --create_network_module 'My
module' remote_tcp 'My agent' 192.168.12.123 8080 'Module description' 'General' 1 3
0 300 0 0 0 0 1 'string for warning' 'string for critical'
29.1.2.3. Create_snmp_module
Parameters: <module_name> <module_kind> <agent_name> <module_address> <module_port> <version> [<community> <oid> <description> <module_group> <min> <max> <post_process> <interval> <warning_min> <warning_max> <critical_min> <critical_max>
<history_data>
<snmp3_priv_method>
<snmp3_priv_pass> <snmp3_sec_level> <snmp3_auth_method> <snmp3_auth_user> <snmp3_priv_pass> <warning_str> <critical_str> <enable_unknown_events>] Description:A module kind snmp will be created in an agent with the module name, module kind, name of the agent where it will be created, the module address, the associated port and the SNMP version especified. Optionally it will be given a community, am OID, a description, the module group, min and max values, a post_process value, an interval in seconds, min and max values, critical min and max values, an history data value, and the snmp3 values like methods, passwords, etc. The default values are 0 for the min and max, history_data and post_process and 300 for the interval. Notes: The next parameters are only for the Pandora version 5 and next versions: • <enable_unknown_events> Example: perl pandora_manage.pl /etc/pandora/pandora_server.conf --create_snmp_module 'My
module' remote_snmp_inc 'My agent' 192.168.12.123 8080 1 mycommunity myoid 'Module
description'
29.1.2.4. Create_plugin_module
Parameters: <module_name> <module_kind> <agent_name> <module_address> <module_port> <plugin_name> <user> <password> <parameters> [<description> <module_group> <min> <max> <post_process> <interval> <warning_min> <warning_max> <critical_min> <critical_max> <history_data> <warning_str> <critical_str> <enable_unknown_events>] Description: A module kind plugin will be created in an agent with the module name, module kind, name of the agent where it will be created, the module address, the associated port and the corresponding plugin name. Optionally it will be possible to give it a description, the module group, min and max values, a post_process value, an interval in seconds, values warning min and max, critical values min and max and a history data value. The values by default are 0 for min and max, history_data and post_process and 300 for the interval. Notes: The next parameters are only for the Pandora version 5 and next versions: 385
Pandora FMS CLI • <enable_unknown_events> Example: perl pandora_manage.pl /etc/pandora/pandora_server.conf --create_module 'My module'
generic_data 'My agent' 192.168.12.123 8080 myplugin myuser mypass 'param1 param2
param3' 'Module description' 'General' 1 3 0 300 0 0 0 0 1 'string for warning'
'string for critical'
29.1.2.5. Delete_module
Parameters: <module_name> <agent_name> Description: An agent module will be eliminated considering both as parameters Example: perl pandora_manage.pl /etc/pandora/pandora_server.conf --delete_module 'My module'
'My agent'
29.1.2.6. Data_module
Parameters: <server_name> <agent_name> <module_name> <module_type> <module_new_data> [<datehour>] Description: It'll be send data to an agent module giving it as parameter the server name, the agent, the module name, the type of module amd the new data to be inserted. Optionally, it'll be possible to send the datehour that will be as that of the data sending with 24 hours format: 'YYY
MMDD HH:mm'. In the case of not sending this parameter, the current data will be shown. Example: perl pandora_manage.pl /etc/pandora/pandora_server.conf --data_module ServidorGeneral 'My agent' 'My modulo' 'generic_data' 1 '2010-05-31 15:53'
29.1.2.7. Get_module_data
(>=5.0) Parameters: <agent_name> <module_name> <interval> [<csv_separator>] Description: Will be returned the data of a module as 'timestamp data' in CSV format of the last X seconds (interval) using as default separator ';' Example: perl pandora_manage.pl /etc/pandora/pandora_server.conf --get_module_data 'agent
name' 'module name' 86400 ':'
29.1.2.8. Delete_data
Parameters: <module_name> <agent_name> | a <agent_name> | g <group_name> Description: All data associated to a module will be deleted from the historical data in case of 386
Pandora FMS CLI having as parameter m and the name of this one and its agent name; from the agent modules if as parameter the option 'a' is given, and the agent or modules name of all agents from a group, if as parameter the option 'g' and the group name is given. Example: perl pandora_manage.pl /etc/pandora/pandora_server.conf --delete_data -a 'My agent'
In this example all historic data will be deleted from all modules that belongs to the 'My agent' agent. 29.1.2.9. Update_module
Parameters: <module_name> <agent_name> <field_to_update> <new_value> Description: A given field of an existent data module will be updated. The module type will be detected to allow update the specific fields for each type. The possible fields are the following: • Common to any module: module_name, agent_name, description, module_group, min, max, post_process, history_data, interval, warning_min, warning_max, critical_min, critical_max, warning_str, critical_str • For the network modules: ff_threshold, module_address, module_port • For the SNMP modules: ff_threshold, module_address, module_port, version, community, oid, snmp3_priv_method, snmp3_priv_pass, snmp3_sec_level, snmp3_auth_method, snmp3_auth_user, snmp3_priv_pass • For the plugin modules: ff_threshold, module_address, module_port, plugin_name, user, password, parameters Example: perl pandora_manage.pl /etc/pandora/pandora_server.conf --update_module 'Module
name' 'Agent name' description 'New description'
29.1.2.10. Get_agents_module_current_data
(>=5.0) Parameters: <module_name> Description: Get the agent and current data of all the modules with a given name. Example: perl pandora_manage.pl /etc/pandora/pandora_server.conf
--get_agents_module_current_data 'Module name'
29.1.2.11. Create_network_module_from_component
(>=5.0) Parameters: <agent_name> <component_name> Description: Create a new network module in the specified agent from a network component. 387
Pandora FMS CLI Example: perl pandora_manage.pl /etc/pandora/pandora_server.conf
--create_network_module_from_component 'Agent name'
29.1.3. Alerts
29.1.3.1. Create_template_module
Parameters: <template_name> <module_name> <agent_name> Description: A template will be assigned to an agent module giving it the template name, the module and the agent as parameters. Example: perl pandora_manage.pl /etc/pandora/pandora_server.conf --create_template_module
template001 'My module' 'My agent'
29.1.3.2. Delete_template_module
Parameters: <template_name> <module_name> <agent_name> Description: it'll be unassigned a module template of one agent giving it the template name, the module and the agent as parameters. Example: perl pandora_manage.pl /etc/pandora/pandora_server.conf --delete_template_module
plantilla001 'Mi modulo' 'Mi agente'
29.1.3.3. Create_template_action
Parameters: <action_name> <template_name> <module_name> <agent_name> [<fires_min> <fires_max>] Description: It'll be added an action to an alert giving as parameter the name of the action and that of the template, module and agent that composes the alert. It'll be also possible giving it in an optional way the values of scaling fires_min and fires_max ( by default 0). Example: perl pandora_manage.pl /etc/pandora/pandora_server.conf --create_template_action
action012 template001 'My module' 'My agent' 0 4
29.1.3.4. Delete_template_action
Parameters: <action_name> <template_name> <module_name> <agent_name> 388
Pandora FMS CLI Description: It'll be added an action to an alert giving as parameters the names of the action, template, module and agent that composes the alert. Example: perl pandora_manage.pl /etc/pandora/pandora_server.conf --delete_template_action
action012 template001 'My module' 'My agent'
29.1.3.5. Disable_alerts
Parameters: No Description: All alerts will be disabled with the execution of this option.If when it's executed we have any alert disabled and we activate all again, this one will be also enabled. Example: perl pandora_manage.pl /etc/pandora/pandora_server.conf --disable_alerts
29.1.3.6. Enable_alerts
Parameters: No Description: All the alerts will be activated with the execution of this option. If when it's executed we had any alert enabled and we disabled all again, this one will be also disabled. Example: perl pandora_manage.pl /etc/pandora/pandora_server.conf --enable_alerts
29.1.3.7. Create_alert_template
Parameters: <template_name> <condition_type_serialized> <time_from> <time_to> [<description> <group_name> <field1> <field2> <field3> <priority> <default_action> <days> <time_threshold> <min_alerts> <max_alerts> <alert_recovery> <field2_recovery> <field3_recovery> <condition_type_separator>] Description: An alert template will be created. The field <condition_type_serialized> is the type options of the template serialized with the separator ';' by default. It's possible change the separator with the parameter <condition_type_separator> to avoid conflicts some options if it could contain the default character. The possibilities are the following: NOTE: In this examples is used the default separator ';' and the field matches_value is a binary value to set if the alert will be fired when the value match or when the value not match with the conditions. • Regular expression: • Syntaxis: <type>;<matches_value>;<value> • Example: regex;1;stopped|error (Alert when value match regexp 'stopped|error') • Max and min: • Syntaxis: <type>;<matches_value>;<min_value>;<max_value> • Example: max_min;0;30;50 (Alert when value is out of interval 3050) 389
Pandora FMS CLI • Max.: • Syntaxis: <type>;<max_value> • Example: max;70 (Alert when value is above 70) • Min.: • Syntaxis: <type>;<min_value> • Example: min;30 (Alert when value is below 30) • Equal to: • Syntaxis: <type>;<value> • Example: equal;0 (Alert when value is equal to 0) • Not equal to: • Syntaxis: <type>;<value> • Example: not_equal;100 (Alert when value is not equal to 100) • Warning status: • Syntaxis: <type> • Example: warning (Alert when status turns into warning) • Critical status: • Syntaxis: <type> • Example: critical (Alert when status turns into critical) • Unknown status: • Syntaxis: <type> • Example: unknown (Alert when status turns into unknown) • On Change: • Syntaxis: <type>;<matches_value> • Example: onchange;1 (Alert when value changes) • Always: • Syntaxis: <type> • Example: always (Alert all times) The field <days> is seven binary characters that specify the days of the week when the alert will be activated. i.e.: 0000011 to activate the alert only Saturday and Sunday. Example: perl pandora_manage.pl /etc/pandora/pandora_server.conf.2011-10-25
--create_alert_template 'template name' "max_min@1@3@5" 09:00 18:00 "Email will be
sended when the value is in the interval 3-5, between 9AM and 6PM, and only the
Mondays. Separator is forced to @" "Unknown" "[email protected]" "subject" "message" 3
"Mail to XXX" 1000000 38600 1 2 0
@
29.1.3.8. Delete_alert_template
(>=5.0) Parameters: <template_name> Description: An alert template will be deleted if exists. Example: perl pandora_manage.pl /etc/pandora/pandora_server.conf --delete_alert_template
'Template name'
390
Pandora FMS CLI 29.1.3.9. Update_alert_template
(>=5.0) Parameters: <template_name> <field_to_update> <new_value> Description: A given field of an existent alert template will be updated. The possible fields are the following: name, description, type, matches_value, value, min_value, max_value, time_threshold(0
1), time_from, time_to, monday(01), tuesday(01), wednesday(01), thursday(01), friday(01), saturday(01), sunday(01), min_alerts, max_alerts, recovery_notify(01), field1, field2, field3, recovery_field2, recovery_field3, priority(04), default_action, group_name. Example: perl pandora_manage.pl /etc/pandora/pandora_server.conf --update_alert_template
'Template name' priority 4
29.1.3.10. Validate_all_alerts
(>=5.0) Parameters: None Description: Validate all the alerts. Example: perl pandora_manage.pl /etc/pandora/pandora_server.conf --validate_all_alerts
29.1.4. Users
29.1.4.1. Create_user
Parameters: <user_name> <password> <es_admin> [<comments>] Description: It'll be created an user with the name and password that are received as parameters.It will be received also a binary value that specify if the user will be or will be not the administrator. Optionally, it could be also sent comments about the created user. Example: perl pandora_manage.pl /etc/pandora/pandora_server.conf --create_user user002
'renardo' 0 'This user has renardo as password'
29.1.4.2. Delete_user
Parameters: <user_name> Description: An user will be eliminated giving its name as parameter. Example: 391
Pandora FMS CLI perl pandora_manage.pl /etc/pandora/pandora_server.conf --delete_user user002
29.1.4.3. Update_user
(>=5.0) Parameters: <id_user> <field_to_update> <new_value> Description: A given field of an existent user will be updated. The possible fields are the following: email, phone, is_admin (01), language, id_skin, flash_chart (01), comments, fullname, password. Example: perl pandora_manage.pl /etc/pandora/pandora_server.conf --update_user 'User Id'
password 'New password'
29.1.4.4. Enable_user
(>=5.0) Parameters: <user_id> Description: An existent user will be enabled. If it's already enabled, will showed only a message Example: perl pandora_manage.pl /etc/pandora/pandora_server.conf --enable_user 'User id'
29.1.4.5. Disable_user
(>=5.0) Parameters: <user_id> Description: An existent user will be disabled. If it's already disabled, will showed only a message Example: perl pandora_manage.pl /etc/pandora/pandora_server.conf --disable_user 'User id'
29.1.4.6. Create_profile
Parameters: <user_name> <profile_name> <group> Description: A profile will be added to an user giving it as parameter the names of user, profile an group on which they will have the privileges of this profile. You should specify the group 'All' if you want that the profile has validity on all groups. Example: perl pandora_manage.pl /etc/pandora/pandora_server.conf --create_profile usuario002
392
Pandora FMS CLI 'Group coordinator' All
29.1.4.7. Delete_profile
Parameters: <user_name> <profile_name> <group> Description: An user profile will be deleted giving it as parameter the names of user, profile and group on which the profiles has the priviledges. If the profile to delete is associated to the "ALL group", we should specify as group "All". Example: perl pandora_manage.pl /etc/pandora/pandora_server.conf --delete_profile usuario002
'Chief Operator' Applications
29.1.4.8. Add_profile_to_user
(>=5.0) Parameters: <id_user> <profile_name> [<group_name>] Description: A profile in a group to a user will be assigned. If the group is not provided, the grupo will be 'All'. Example: perl pandora_manage.pl /etc/pandora/pandora_server.conf --update_user 'User Id'
'Chief Operator' 'Network'
29.1.4.9. Disable_aecl
Parameters: No Description: The Enterprise mode ACL system will be disabled in the configuration with the execution of this option. Example: perl pandora_manage.pl /etc/pandora/pandora_server.conf --disable_eacl
29.1.4.10. Enable_aecl
Parameters: No Description: The Enterprise mode ACL system will be enabled in the configuration with the execution of this option. Example: perl pandora_manage.pl /etc/pandora/pandora_server.conf --enable_eacl
393
Pandora FMS CLI 29.1.5. Events
29.1.5.1. Create_event
Parameters: <event_name> <event_type> <group_name> [<agent_name> <module_name> <event_state> <severity> <template_name> <user_name> <comment> <source> <id_extra> <tags> <custom_data>] Description: An event will be created with these data: the name and kind of the event, name of the module, agent and group associated. Optionally it could be sent: •
•
•
•
•
•
•
•
•
•
•
•
agent name module name event state (0 if it isn't validated and 1 if it is) severity (from 1 to 4) severity: 0 (Maintenance), 1 (Informational), 2 (Normal), 3 (Warning), 4 (Critical).
From version 5.0 there are 5 (Minor) y 6 (Major) too. template name in the case that is would be associated to one alert. user name comment source Extra id tags: Format should be <tag> <url>,<tag> <url>
You can add multiple tags separated by commas custom data: Custom data should be entered as a JSON document. For example: '{"Location": "Office", "Priority": 42}' Nota: Event type could be: unknown, alert_fired, alert_recovered, alert_ceased, alert_manual_validation, recon_host_detected, system, error, new_agent, going_up_warning, going_up_criticalgoing_down_warning,
going_down_normal,
going_down_critical, going_up_normal, configuration_change. Example: perl pandora_manage.pl /etc/pandora/pandora_server.conf --create_event ' CLI Event'
system Firewalls 'My agent' 'My module' 0 4 Template004
29.1.5.2. Validate_event
Parameters: <agent_name> <module_name> <datehour_min> <datehour_max> <name_user> <criticity> <template_name> Description: All events will be validated considering a group of filters. The configurable filters are: the agent name, the module name, datehour minimum and datehour maximum, the user name, the criticity and the name of the associated template. It's possible to combine the parameters in several ways, leaving blank with empty inverted commas ('') the ones that you don't want to use and filling in the rest. Example: perl pandora_manage.pl /etc/pandora/pandora_server.conf --validate_event 'My agent'
'My module' '' '2010-06-02 22:02'
394
Pandora FMS CLI In this example will be validated all the events associated to the module 'Mi module' of the agent 'My agent' which data would be previous to 2 june 2010 not considering the rest of the filters. It would be also possible to filter the events between two dates filling both of them or the ones that have a data higher to an specific one, filling in only the datehour minimum. 29.1.5.3. Validate_event_id
(>=5.0) Parameters: <id_event> Description: A event will be validated. Example: perl pandora_manage.pl /etc/pandora/pandora_server.conf --validate_event_id 1894
In this example, will be validated the event whose identifier is 1894. 29.1.5.4. Get_event_info
(>=5.0) Parameters: <id_event>[<separator>] Description: Display info about a event given a id. Example: perl pandora_manage.pl /etc/pandora/pandora_server.conf --get_event_info 1894
In this example, will be displayed info about the event whose identifier is 1894. The fields will be separated by | 29.1.6. Incidents
29.1.6.1. Create_incident
(>=5.0) Parameters: <title> <description> <origin> <status> <priority> <group> [<owner>] Description: An incident will be created passing the title, the description, the origin, the status, the priority, the group and optionally the owner to it. The priority will be a number according to the following correspondence: 0: Informative; 1: Low; 2: Medium; 3: Important; 4: Very important; 5: Maintenance the status will be a number according to the following correspondence: 0: Active incident; 1: Active incident with comments; 2: Rejected incident ; 3: Expired incident; 13: Closed incident Example: perl pandora_manage.pl /etc/pandora/pandora_server.conf --create_incident 'Incident'
'Incident Description' 'Other data source' 3 2 'id_owner_user'
395
Pandora FMS CLI 29.1.7. Policies
29.1.7.1. Apply_policy
Parameters: <policy_name> Description: The policy passed as parameter will be apply in a forced way as parameter. The creation of the policy modules is comprehended in the policy applying process, in all their associated agents, and also the creation of policy alerts in the created modules and the changes made in the local agent configuration file that could have the policy to add the created modules and the collections associated to the policy. Example: perl pandora_manage.pl /etc/pandora/pandora_server.conf --apply_policy 'My policy'
29.1.7.2. Apply_all_policies
(>=5.0) Parameters: None Description: Add to the application queue all the policies. The server is who watch the queue and apply the policies Example: perl pandora_manage.pl /etc/pandora/pandora_server.conf --apply_all_policies
29.1.7.3. Add_agent_to_policy
(>=5.0) Parameters: <agent_name> <policy_name> Description: An existent group will be added to an existent policy Example: perl pandora_manage.pl /etc/pandora/pandora_server.conf --add_agent_to_policy 'Agent
name' 'Policy name'
29.1.7.4. Delete_not_policy_modules
Parameters: Not Description: All modules that doesn't belong to any policy will be deleted both from the database and the agent configuration file (if there is one). Example: perl pandora_manage.pl /etc/pandora/pandora_server.conf --delete_nor_policy_modules
396
Pandora FMS CLI 29.1.7.5. Disable_policy_alerts
Parameters: <policy_name> Description: All the alerts from a policy passed by parameter will be flagged as disabled Example: perl pandora_manage.pl /etc/pandora/pandora_server.conf --disable_policy_alerts 'My
policy'
29.1.7.6. Create_policy_data_module
(>=5.0) Parameters: <policy_name> <module_name> <module_type> [<description> <module_group> <min> <max> <post_process> <interval> <warning_min> <warning_max> <critical_min> <critical_max> <history_data> <data_configuration> <warning_str> <critical_str>] Description: A policy data module will be created. The default values are the same of create_data_module option Example: perl pandora_manage.pl /etc/pandora/pandora_server.conf --create_policy_data_module
'policy name' 'module name' generic_proc 'module description' 'group name' 0 100 0
300 30 60 61 100 0 "module_begin\nmodule_name modname\nmodule_end" 'string for
warning' 'string for critical'
29.1.7.7. Create_policy_network_module
(>=5.0) Parameters: <policy_name> <module_name> <module_type> [<module_port> <description> <module_group> <min> <max> <post_process> <interval> <warning_min> <warning_max> <critical_min> <critical_max> <history_data> <ff_threshold> <warning_str> <critical_str>] Description: A policy network module will be created. The default values are the same of create_network_module option Example: perl pandora_manage.pl /etc/pandora/pandora_server.conf
--create_policy_network_module 'policy name' 'module name' remote_icmp_proc 22
'module description' 'group name' 0 100 0 300 30 60 61 100 0 0 'string for warning'
'string for critical'
29.1.7.8. Create_policy_snmp_module
(>=5.0) Parameters: <policy_name> <module_name> <module_type> <module_port> <version> [<community> <oid> <description> <module_group> <min> <max> <post_process> <interval> <warning_min> <warning_max> <critical_min> <critical_max> <history_data> 397
Pandora FMS CLI <snmp3_priv_method> <snmp3_priv_pass> <snmp3_sec_level> <snmp3_auth_method> <snmp3_auth_user> <snmp3_priv_pass> <ff_threshold> <warning_str> <critical_str>] Description: A policy SNMP module will be created. The default values are the same of create_snmp_module option Example: perl pandora_manage.pl /etc/pandora/pandora_server.conf --create_policy_snmp_module
'policy name' 'module name' remote_snmp_inc 8080 1 mycommunity myoid 'Module
description'
29.1.7.9. Create_policy_plugin_module
(>=5.0) Parameters: <policy_name> <module_name> <module_kind> <module_port> <plugin_name> <user> <password> <parameters> [<description> <module_group> <min> <max> <post_process> <interval> <warning_min> <warning_max> <critical_min> <critical_max> <history_data> <warning_str> <critical_str>] Description: A policy plugin module will be created. The default values are the same of create_plugin_module option Example: perl pandora_manage.pl /etc/pandora/pandora_server.conf
--create_policy_plugin_module 'policy name' 'module name' generic_data 22 myplugin
myuser mypass 'param1 param2 param3' 'Module description' 'General' 1 3 0 300 0 0 0
0 1 'string for warning' 'string for critical'
29.1.7.10. Validate_policy_alerts
(>=5.0) Parameters: <policy_name> Description: Validate all the alerts of a given policy Example: perl pandora_manage.pl /etc/pandora/pandora_server.conf --validate_policy_alerts
'Policy name'
29.1.7.11. Get_policy_modules
(>=5.0) Parameters: <policy_name> Description: Get the module list (id and name) of a given policy Example: perl pandora_manage.pl /etc/pandora/pandora_server.conf --get_policy_modules 'Policy
name'
398
Pandora FMS CLI 29.1.7.12. Get_policies
(>=5.0) Parameters: [<agent_name>] Description: Get all the policies (without parameters) or the policies of a given agent (agent name as parameter) Example: perl pandora_manage.pl /etc/pandora/pandora_server.conf --get_policies 'Agent name'
29.1.8. Netflow
29.1.8.1. Create_netflow_filter
(>=5.0) Parameters: <filter_name> <group_name> <filter> <aggregate_by> <output_format> Description: Create a new netflow filter. The possible values of aggregate_by parameter are: dstip,dstport,none,proto,srcip,srcport The possible
values
of
ouput_format
parameter
are: kilobytes,kilobytespersecond,megabytes,megabytespersecond Example: To create a netflow filter we execute the following option: perl pandora_manage.pl /etc/pandora/pandora_server.conf --create_netflow_filter
"Filter name" Network "host 192.168.50.3 OR host 192.168.50.4 or HOST 192.168.50.6"
dstport kilobytes
29.1.9. Tools
29.1.9.1. Exec_from_file
(>=5.0) Parameters: <file_path> <option_to_execute> <option_params> Description: With this option is possible to execute any CLI option with macros from a CSV file. The number of macros will be the number of columns in the CSV file. Each macro will be named __FIELD1__ , __FIELD2__ , __FIELD3__ etc. Example: We are going to create users from a CSV file. We need a CSV file like that: User
User
User
User
1,Password 1,0
2,Password 2,0
3,Password 3,0
Admin,Password Admin,1
The name of the file will be '/tmp/users_csv' 399
Pandora FMS CLI We are going to execute the option create_user with the following options: <user_name> <user_password> <is_admin> <comments> To do this, we execute the following option: perl pandora_manage.pl /etc/pandora/pandora_server.conf --exec_from_file
/tmp/users_csv create_user __FIELD1__ __FIELD2__ __FIELD3__ 'User created with
exec_from_file option from CLI'
NOTE: Commas into the CSV columns are not yet supported 29.1.9.2. create_snmp_trap
(>=5.0) Parameters: <file_path> <name> <oid> <desc> <severity> Name: As seen in the snmp trap console. OID: SNMP trap main OID. Severidad: Numeric value, which have following values: Severity 0 (Maintenance), 1(Info) , 2 (Normal), 3 (Warning), 4 (Critical), 5 (Minor) and 6 (Major). Sample: perl pandora_manage.pl /etc/pandora/pandora_server.conf --create_snmp_trap
Cisco_FAN_Crash 1.3.3.3.2.12.3.3.4.1 "Something happen with the FAN inside the CISCO
device, probably a failure" 3
29.2. Help
To obtain general help with the Pandora FMS CLI you only need to writte: perl pandora_manage.pl --h
To obtain help of one specific option, it would be enough with putting this option without parameters (this for the options that use parameters). perl pandora_manage.pl /etc/pandora/pandora_server.conf --create_user
400
Help
30 CONSIDERATIONS ON PLUGIN DEVELOPMENT
401
Introduction
30.1. Introduction
The plugins allows to Pandora get information that requires a complex process or that requires the use of complex systems or APIs. Examples of plugins could be the Oracle database monitoring that requires a complex process for the monitoring and also some autodiscovery tasks. Other example could be a simple HTML parse, but that requires some that Goliat can't do. 30.2. Differences in Implementation and Performance Pandora offers two possibilities when executing plugins: execution in the agent or in the server. The server plugins do independent executions to collect each information piece. The server plugin execution is very difficult so it is only possible for plugins that aren't heavy, this is, that doesn' t need several queries to get a single piece of information. A server plugin could be an specific HTML parse plugin that doesn't requires lot of queries and so it will not overload the server. The agent plugins allow to obtain several modules at the same time and for this reason they are much more flexible than the server plugins. They are perfects for plugins that need several queries to get an information piece, so they allow more flexibility to the programmer so it's possible to return several modules at the same time. 30.3. Recon Tasks To do recon tasks on plugins that need it, we have two possibilities: The first one consists on using the the Pandora server Recon server. To do this, it will be necessary to create the adhoc code for the specific technology or situation.The Recon Tasks loads the Pandora server, so,if for doing the recon task are necessary lot of data requests, this option should't be consider. It is also possible to create a recon task using an agent plugin. Usually, the agent plugins returns modules that are attached to the XML that the agent sends to the Pandora server. But, consider that when installing the agent in a machine with it, Tentacle is also installed, and this allow to send XML to the Pandora server. To do a recon task from an agent plugin, it is possible to use this, and besides adding the modules to the agent as a common plugin does, to give our plugin the capacity to send XMLs to Pandora with the information of other agents updated as a recon task would do. The idea is that the plugin, besides creating the average modules,collects the information and create and send the XML simulating other agents installed if necessary. The reason to create a plugin that sends data through XML and besides does recon task is to could distribute the monitoring load in different machines and not centralize it in the server. 30.4. Server Plugin or Agent Plugin? A server plugin should be used when: • The load of each execution is small, for example, simple queries. • If the Recon Task requires lot of data process. • If the Recon Task execution intervals are large, for example, once a week An agent plugin will be used when: • The information collection requires lot of process or lot of queries. 402
Server Plugin or Agent Plugin? • The associated Recon Task requires a high process load or lot of queries. • The Recon Task execution intervals are close to the common execution intervals for agents, for example, every 5 minutes. 403
Server Plugin or Agent Plugin? 31 SERVERS PLUGIN DEVELOPMENT 404
Pandora Server Plugin Zipfile (.pspz) 31.1. Pandora Server Plugin Zipfile (.pspz) With Pandora FMS 3.0 there is a new way to register plugins and modules who uses the new Plugin (like a library of modules depending on the plugin). This is basically an admin extension to upload a file in .pspz format who is described below. System reads the file, unpack and install the binaries/script in the system, register the plugin and create all the modules defined in the .pspz in the module library of Pandora FMS (Network components). This section describe how to create a .pspz file. 31.2. Package File A .pspz is a zip file with two files: plugin_definition.ini: Who contains the specification of the plugin and the modules. Should have this name (case sensitive). <script_file>: It's the plugin script/binary itself. Could have any valid name. You can download an example of .pspz here: [1] 31.3. Structure of plugin_definition.ini 31.3.1. Header/Definition This is a classic INI file with optional sections. The first section, the most important, is a fixed name section called "plugin_definition", and this is an example: [plugin_definition]
name = Remote SSH exec
filename = ssh_pandoraplugin.sh
description = This plugin execute remotely any command provided
timeout = 20
ip_opt = -h
execution_command =
execution_postcommand =
user_opt = -u
port_opt =
pass_opt =
plugin_type = 0
total_modules_provided = 1
filename: Should have the same name as the script included in the .pspz file, referenced before as <script_file>. In this sample is a .sh shell script called "ssh_pandoraplugin.sh". *_opt: Are the registration options for the plugin, like shown in the form to register "manually" the plugin in the Pandora FMS console. plugin_type: 0 for a standard Pandora FMS plugin, and 1 for a Nagiostype plugin. total_modules_provided: Defines how many modules are defined below. You should define at least one (for use as example as minimum). execution_command: If used, put this before the script. Could be a interpreter, like for example "java jar". So plugin will be called from Pandora FMS Plugin Server as "java jar <plugin_path>/<plugin_filename>". execution_postcommand: If used, defines aditional parameters passed to the plugin after the 405
Structure of plugin_definition.ini plugin_filename , invisible for the user. 31.3.2. Module definition / Network components This are defined as dynamic sections (section with a incremental name), and you may have many as you want, and you need to define here the same number of modules as defined in total_modules_provided in prev. section. If you have 4 modules, section names should be module1, module2, module3 and module4. This is an example of a module definition: [module1]
name = Load Average 1Min
description = Get load average from command uptime
id_group = 12
type = 1
max = 0
min = 0
module_interval = 300
id_module_group = 4
id_modulo = 4
plugin_user = root
plugin_pass =
plugin_parameter = "uptime | awk '{ print $10 }' | tr -d ','"
max_timeout = 20
history_data = 1
min_warning = 2
min_critical = 5
str_warning = "peligro"
min_critical = "alerta"
min_ff_event = 0
tcp_port = 0
critical_inverse = 0
warning_inverse = 0
critical_instructions = "Call the boss"
warning_instructions = "Call NASA"
unknown_instructions = "I want a pizza and maybe beer"
A few things to have in mind: • Do not "forget" any field, all fields *MUST* be defined, if you don't have data, let it blank, like the plugin_pass field in the example above. • Use double quotes "" to define values who contains special chars or spaces, like the field plugin_parameter in the above example. INI files who contains characters like ' " / _ ( ) [ ] and others, MUST have double quotes. Try to avoid use of character " in data, if you must use it, escape with \" combination. • If you have doubts on the purpose or meaning of this fields, take a look on tnetwork_component in your Pandora FMS database, it has almost the same fields. When you create a network component is stored in that database, try to create a network component who use your plugin and analyze the record entry in that table to understand all the values. • id_module, should be 4 always (this means this is a plugin module). • type, defines what kind of module is: generic_data (1), generic_proc (2), generic_data_string (3) or generic_data_inc (4) as defined in ttipo_modulo. • id_group, is the PK (primary key) of the tgrupo table, who contain group definitions. Group 406
Structure of plugin_definition.ini 1 is "all groups", and acts like an special group. • id_module_group, comes from table tmodule_group, just an association of module by functionality, purely descriptive. You can use "1" for General module group. 31.4. Versión 2 Since Pandora FMS v5, the server plugins use macros. With this change, plugin_definition.ini has changed. A version parameter has been added and the parameters ip_opt, user_opt, port_opt and pass_opt have disappeared. Instead is possible to add macros to the execution_postcommand parameter as _field1_ , _field2_ ... _fieldN_ Each macro will have a parameter with the structure macro_desc_field1_ , macro_desc_field2_ ... macro_desc_fieldN_. Followed by the short description of the macro. This new structure is known as the version 2. The old version is still compatible. If the version parameter is not defined, version 1 is
assumed
31.4.1. Example of the plugin definition version 2 [plugin_definition]
version = 2
name = Remote SSH exec
filename = ssh_pandoraplugin.sh
description = This plugin execute remotely any command provided
timeout = 20
execution_command =
execution_postcommand = -h _field1_ -u _field2_
macro_desc_field1_ = Host address
macro_desc_field2_ = User
plugin_type = 0
total_modules_provided = 1
407
Versión 2 32 AGENT PLUGINS DEVELOPMENT
408
Agent Plugins Development
The agent plugin is executed by the Pandora FMS Software Agent so it should have some special features: • Each execution of the plugin could return one or several modules with their correspondent values. The exit should have a XML format as we will explain later: • It could have access both local resources to the machine or a resources from other machine in a remote way. • It is possible to use any kind of programming language supported by the operative system where the Pandora software agent would be installed. • All dependencies or necessary software to execute the plugin should be available and be installed in the same machine that executes the Pandora software. The agent plugins could do a kind of "recon task" so the plugin could return several modules in one execution and the number could change between different executions. 32.1. Example of Agent Plugin Development
We are going to explain now an example of a simple plugin. This agent plugin returns the percentage of use of the system filesystems. The code is the following one: #!/usr/bin/perl
use strict;
sub usage() {
print "\npandora_df.pl v1r1\n\n";
print "usage: ./pandora_df\n";
print "usage: ./pandora_df tmpfs /dev/sda1\n\n";
}
# Retrieve information from all filesystems
my $all_filesystems = 0;
# Check command line parameters
if ($#ARGV < 0) {
$all_filesystems = 1;
}
if ($ARGV[0] eq "-h") {
usage();
exit(0);
}
# Parse command line parameters
my %filesystems;
foreach my $fs (@ARGV) {
$filesystems{$fs} = '-1%';
}
# Retrieve filesystem information
# -P use the POSIX output format for portability
my @df = `df -P`;
shift (@df);
# No filesystems? Something went wrong.
if ($#df < 0) {
exit 1;
409
Example of Agent Plugin Development
}
# Parse filesystem usage
foreach my $row (@df) {
my @columns = split (' ', $row);
exit 1 if ($#columns < 4);
$filesystems{$columns[0]} = $columns[4] if (defined
($filesystems{$columns[0]}) || $all_filesystems == 1);
}
while (my ($filesystem, $use) = each (%filesystems)) {
# Remove the trailing %
chop ($use);
# Print module output
print "<module>\n";
print "<name><![CDATA[" . $filesystem . "]]></name>\n";
print "<type><![CDATA[generic_data]]></type>\n";
print "<data><![CDATA[" . $use . "]]></data>\n";
print "<description>% of usage in this volume</description>\n";
print "</module>\n";
}
exit 0;
An important part of the code is the usage function: sub usage() {
print "\npandora_df.pl v1r1\n\n";
print "usage: ./pandora_df\n";
print "usage: ./pandora_df tmpfs /dev/sda1\n\n";
}
In this function it describes the version and how to use the plugin. It is very important and it should be shown when executing the plugin without any kind of parameter or with an action type h or help. In this example is executed when the parameter h is executed, the following lines verify it: if ($ARGV[0] eq "-h") {
usage();
exit(0);
}
Regarding the values returned by the plugin, you can notice that onece the data has been collected from the following file systems, an XML part is created and printe by the standard exit for any one of them. This task is done in the following lines: while (my ($filesystem, $use) = each (%filesystems)) {
410
Example of Agent Plugin Development
# Remove the trailing %
chop ($use);
# Print module output
print "<module>\n";
print "<name><![CDATA[" . $filesystem . "]]></name>\n";
print "<type><![CDATA[generic_data]]></type>\n";
print "<data><![CDATA[" . $use . "]]></data>\n";
print "<description>% of usage in this volume</description>\n";
print "</module>\n";
}
An example of the result that this plugin returns could be: <module>
<name><![CDATA[tmpfs]]></name>
<type><![CDATA[generic_data]]></type>
<data><![CDATA[0]]></data>
<description>% of usage in this volume</description>
</module>
<module>
<name><![CDATA[/dev/mapper/VolGroup-lv_home]]></name>
<type><![CDATA[generic_data]]></type>
<data><![CDATA[26]]></data>
<description>% of usage in this volume</description>
</module>
<module>
<name><![CDATA[/dev/sda9]]></name>
<type><![CDATA[generic_data]]></type>
<data><![CDATA[34]]></data>
<description>% of usage in this volume</description>
</module>
The number of returned modules by this plugin will depend on the number of configured filesystems and it could change between different executions. The XML piece is added to the general XML that the software agent generates and it is sent to the Pandora server to be processed by the Data Server 32.2. Troubleshooting
If Pandora FMS does not recognize your agent plugin, you don't get the information you expect or the agent just doesn't want to work, there are a few things which you have to keep in mind: 32.2.1. Check the pandora_agent.conf document
The Software Agent needs a line in this file with the correct path of the plugin. For example: module_plugin /etc/pandora/plugins/MyMonitor.pl /etc/pandora/plugins/MyMonitor.conf
2> /etc/pandora/plugins/MyMonitor.err
MyMonitor.pl is the agent plugin, MyMonitor.conf is the configuration file passed as an argument, 411
Troubleshooting
and MyMonitor.err is a file that will receive the possible errors of the plugin execution and will keep clean the standard output. 32.2.2. Reboot the pandora_agent_daemon
If you have the basic version of Pandora FMS (not Enterprise), the Software Agent will run the plugins every five minutes. For those people who can not wait, it is possible to restart the Software Agent from the command line. For example: /etc/init.d/pandora_agent_daemon restart
32.2.3. Check the plugin permissions
The plugin, and the files which are going to be used for it, must have the correct read, write and execute permissions. In Unix this should be enough: chmod 755 <plugin_path>
32.2.4. Validate the output
An easy way to find the errors is run the plugin manually in the command line. Sit down and check the output carefully, for example: popeye:/etc/pandora/plugins # ./pandora_df
<module>
<name><![CDATA[/dev/sda2]]></name>
<type><![CDATA[generic_data]]></type>
<data><![CDATA[19]]></data>
<description>% of usage in this volume</description>
</module>
<module>
<name><![CDATA[udev]]></name>
<type><![CDATA[generic_data]]></type>
<data><![CDATA[1]]></data>
<description>% of usage in this volume</description>
</module>
32.2.5. Validate the resulting XML
The XML that prints the plugin must have valid XML syntax. The XML also needs to be well formed. To check if it is, you could follow this steps from the command line: 1. Create an XML document with the plugin output: ./Plugin.pl > Plugin.xml 2. Check the XML document: xmllint Plugin.xml 32.2.6. Debug mode
You can activate the debug mode by changing the value of the label debug in your pandora_agent.conf file from 0 to 1. Once you do this, when the Software Agent run the plugin, the results will be saved in an XML document with all the agent information. 412
Troubleshooting
The name of the document will be the agent name with .data, and will be located in /tmp directory (checkout the pandora agent log at /var/log/pandora/pandora_agent.log). By checking the document, you can see if the data of your plugin are being collected and if it what you expect. When you enable Debug mode, the agent executes only once and exits
32.2.7. Forum
If the error remains after all, fell free to ask in our forum. 413
Troubleshooting
33 CONSOLE EXTENSIONS
414
Console Extensions
Extensions are a form to develop new functionality for your Pandora Console as plugins. In this article you will learn how to develop a extension: 33.1. Kinds of Extensions
There are two kinds of extensions: • Visibles, extensions that are shown in Pandora Menu. • Invisibles, extensions that are loaded and executed in index.php of Pandora Menu but doesn't apeare in Pandora Menu. 33.2. Directory of Extensions
The directory of extensions is a subdirectory in your local installation of Pandora Console with the name "extensions". This directory contains for each extension the following: Main file of the extension
This file has the code to load in Pandora Console
Subdirectory of extension
this is optional and may contain the Icon image file (a 18x18 image) to show next to the name
of the extension in the menu and others files as translations, modules, images...
33.3. Extension Skeleton
<?php
< Comments with license, author/s, etc... >
< php auxiliary code as functions, variables, classes that your extension use >
function < name of main function > () {
< Main function Code >
}
/*-------------------------------------*/
/* Adds the link in the operation menu */
extensions_add_operation_menu_option ('< Name Extension >', '< father ID menu >', '<
relative path Icon >');
/* Adds the link in the godmode menu */
extensions_add_godmode_menu_option ('< Name Extension >', '< ACL level >', '< father
ID menu >', '< relative path Icon >')
/*-------------------------------------*/
/* Sets the callback function to be called when the extension is selected in the
operation menu */
extensions_add_main_function ('< name of main function >');
/* Sets the callback function to be called when the extension is selected in the
godmode menu */
extensions_add_godmode_function ('< name of godmode function >');
?>
415
API for Extensions
33.4. API for Extensions
The API for extensions is stil under development and may change in the future
You can get more information about the API in the pandoradevelop mailng list or in the forum. The following sections contain the description of the functions in the API for extensions: 33.4.1. extensions_add_operation_menu_option
extensions_add_operation_menu_option ('< string name >', '< father ID menu >', '< relative path Icon >'): this function adds the link to the extension with the given name in the Operations menu. The third parameter is optional and is the relative path to the icon image ( 18x18 pixels) to apear next to the link, if this parameter is not defined an icon of a plug ( ) will be used. 33.4.2. extensions_add_godmode_menu_option
extensions_add_godmode_menu_option ('< Name Extension >', '< ACL level >' , '< father ID menu >', '< relative path Icon >'): this function adds the link to the extension with the given name in the Godmode menu if the user has the required ACL level as indicated by the second parameter. The forth parameter is optional and is the relative path to the icon image ( 18x18 pixels) to apear next to the link, if this parameter is not defined an icon of a plug ( ) will be used. 33.4.3. extensions_add_main_function
extensions_add_main_function ('< name of main function >'): sets the callback function that will be called when the user clicks on the link to the extension in the operation menu 33.4.4. extensions_add_godmode_function
extensions_add_godmode_function ('< name of godmode function >'): add the function of extension for to call one time when the user go to extension in Pandora Console godmode instead load main_function. 33.4.5. extensions_add_login_function
extensions_add_login_function ('< name of login function >'): add the function of extension for to call one time when the user login correctly in Pandora console. 33.4.6. extensions_add_godmode_tab_agent
extensions_add_godmode_tab_agent('< ID of extension tab >', '< Name of extension tab >', '< Image file with relative dir >', '< Name of function to show content of godmode tab agent >'): adds one more tab to the agent edit view that when it is selected executes the code of the name function that we pass to it. 33.4.7. extensions_add_opemode_tab_agent
extensions_add_opemode_tab_agent('< ID of extension tab >', '< Name of extension tab >', 416
API for Extensions
'< Image file with relative dir >', '< Name of function to show content of operation tab agent >'):adds one more tab to the agent operating view than when it is selected will execute the code of the name function that we pass to it. 33.4.8. Father IDs in menu
List of available strings IDs for use in extension API. If use null value or not incluyed param in call function, the extension appear only in submenu of extension. 33.4.8.1. Operation
•
•
•
•
•
•
'estado': Monitoring view network: Network view reporting: Reporting and data visualization gismaps: GIS view eventos: Events view workspace: User's workspace 33.4.8.2. Administration
•
•
•
•
•
•
•
•
•
•
'gagente': Manage monitoring gmassive: Massive operations 'gmodules': Manage modules 'galertas': Manage alerts 'gusuarios': Manage users 'godgismaps': Manage GIS 'gserver': Manage servers 'glog': System logs 'gsetup': SetupConfiguración 'gdbman': DB Maintenance Administration Enterprise
These elements are only available with Enterprise version
• gpolicies: Manage policies 33.5. Example 417
Example The extension show a table where the colummns are Modules groups and the rows the Agent groups. And each cell have a colour with the next meanings: • Green: when all modules of Group are OK. • Yellow: when at least one monitor in warning. • Red: At least one monitor fails. And this extension hang from the Operation menu in Agents. 33.6. Source code
<?php
418
Source code
/**
* Pandora FMS- http://pandorafms.com
* ==================================================
* Copyright (c) 2005-2009 Artica Soluciones Tecnologicas
*
* This program is free software; you can redistribute it and/or
* modify it under the terms of the GNU General Public License
* as published by the Free Software Foundation for version 2.
* This program is distributed in the hope that it will be useful,
* but WITHOUT ANY WARRANTY; without even the implied warranty of
* MERCHANTABILITY or FITNESS FOR A PARTICULAR PURPOSE. See the
* GNU General Public License for more details.
*/
/**
* Translate the array texts using gettext
*/
function translate(&$item, $key) {
$item = __($item);
}
/**
* The main function of module groups and the enter point to
* execute the code.
*/
function mainModuleGroups() {
global $config; //the useful global var of Pandora Console, it has many data
can you use
//The big query
$sql = "select COUNT(id_agente) AS count, estado
FROM tagente_estado
WHERE utimestamp != 0 AND id_agente IN
(SELECT id_agente FROM tagente WHERE id_grupo = %d AND
disabled IS FALSE)
AND id_agente_modulo IN
(SELECT id_agente_modulo
FROM tagente_modulo
WHERE id_module_group = %d AND disabled IS FALSE AND
delete_pending IS FALSE)
GROUP BY estado";
echo "<h1>" . __("Combine table of agent group and module group") . "</h1>";
echo "<p>" . __("This table show in columns the modules group and for rows
agents group. The cell show all modules") . "</p>";
$agentGroups = get_user_groups ($config['id_user']);
$modelGroups = get_all_model_groups();
array_walk($modelGroups, 'translate'); //Translate all head titles to
language is set
$head = $modelGroups;
array_unshift($head, ' ');
//Metaobject use in print_table
$table = null;
$table->align[0] = 'right'; //Align to right the first column.
$table->style[0] = 'color: #ffffff; background-color: #778866; font-weight:
bolder;';
$table->head = $head;
//The content of table
$tableData = array();
419
Source code
//Create rows and celds
foreach ($agentGroups as $idAgentGroup => $name) {
$row = array();
array_push($row, $name);
foreach ($modelGroups as $idModelGroup => $modelGroup) {
$query = sprintf($sql,$idAgentGroup, $idModelGroup);
$rowsDB = get_db_all_rows_sql ($query);
$states = array();
if ($rowsDB !== false) {
foreach ($rowsDB as $rowDB) {
$states[$rowDB['estado']] = $rowDB['count'];
}
}
$count = 0;
foreach ($states as $idState => $state) {
$count = $state;
}
$color = 'transparent'; //Defaut color for cell
if ($count == 0) {
$color = '#babdb6'; //Grey when the cell for this
model group and agent group hasn't modules.
$alinkStart = '';
$alinkEnd = '';
}
else {
$alinkStart = '<a href="index.php?
sec=estado&sec2=operation/agentes/status_monitor&status=-1&ag_group=' .
$idAgentGroup .
'&modulegroup=' . $idModelGroup . '">';
$alinkEnd = '</a>';
if (array_key_exists(0,$states) && (count($states)
== 1))
$color = '#8ae234'; //Green when the cell
for this model group and agent has OK state all modules.
else {
if (array_key_exists(1,$states))
$color = '#cc0000'; //Red when the
cell for this model group and agent has at least one module in critical state and
the rest in any state.
else
$color = '#fce94f'; //Yellow when
the cell for this model group and agent has at least one in warning state and the
rest in green state.
}
}
array_push($row,
'<div
style="background: ' . $color . ' ;
height: 15px;
margin-left: auto; margin-right:
auto;
text-align: center; padding-top:
5px;">
' . $alinkStart . $count . ' modules' .
$alinkEnd . '</div>');
}
array_push($tableData,$row);
420
Source code
}
$table->data = $tableData;
print_table($table);
echo "<p>" . __("The colours meaning:") .
"<ul>" .
'<li style="clear: both;">
<div style="float: left; background: #babdb6; height: 20px;
width: 80px;margin-right: 5px; margin-bottom: 5px;"> </div>' .
__("Grey when the cell for this model group and agent group
hasn't modules.") . "</li>" .
'<li style="clear: both;">
<div style="float: left; background: #8ae234; height: 20px;
width: 80px;margin-right: 5px; margin-bottom: 5px;"> </div>' .
__("Green when the cell for this model group and agent has
OK state all modules.") . "</li>" .
'<li style="clear: both;"><div style="float: left; background:
#cc0000; height: 20px; width: 80px;margin-right: 5px; margin-bottom:
5px;"> </div>' .
__("Red when the cell for this model group and agent has at
least one module in critical state and the rest in any state.") . "</li>" .
'<li style="clear: both;"><div style="float: left; background:
#fce94f; height: 20px; width: 80px;margin-right: 5px; margin-bottom:
5px;"> </div>' .
__("Yellow when the cell for this model group and agent has
at least one in warning state and the rest in green state.") . "</li>" .
"</ul>" .
"</p>";
}
extensions_add_operation_menu_option("Modules groups", 'estado',
'module_groups/icon_menu.png');
extensions_add_main_function('mainModuleGroups');
?>
33.7. Explain
In the source code there are two parts: • The source code of extension. • The API calls functions. The order of parts is indifferent, but it's better put "The API calls functions" in the bottom of you main file extension because the style guidelines advise to add this part into bottom thus all extensions have more or less a same style. 33.7.1. Source code of extension
In this case for this example has two function in the same file, but if you has a complex code, it is better divide in many files (and it save in subdirectory extension), the functions are: • function translate(&$item, $key) This function use for callback in the array_walk function. Because the main function keep the
titles of columns and the titles of rows in array without translations.
• function mainModuleGroups() This is the heard of extension, and it's huge of lines, I see not all code, see some important
421
Explain
parts:
• The first is access to config global var. In this var has many configurations and
default values for many things of Pandora Console.
• The second var is the query in MySQL into a string. And the %d is the format
placeholders is for Id Group and Id Module Group and these are sustitute for
value in sprintf function into foreach loops.
• Some echos for print the text before the table.
• Extract of DB two arrays with one dimension and the index is id, and the content
is title for columns (Module groups) and rows (Agent group) in each case.
• Translate the Model Group array titles.
• Make the meta-object $table, fill by rows and print.
• Before the foreach loops, define into $table the head and styles of table.
• The first loop is for rows (each agent group).
• The second loop is for columns in current row (each model group).
• Then for each cell, it has two number, id model group and id
agent group, with this two number we make a query to
database and we obtain the files.
• Proccess the result array for obtain other array that is array and
the index is a integer of diferents kinds of monitor states and
the content is a count of monitor in this state.
• Well, the only thing left is to make or fill the content of cell in
html. The trick is easy. If the count off all states is zero, the
background for div in CSS is grey. If $states[1] != 0 or in
human language there is one at least of monitor in critical state,
the div has a red color. If the array only have a one cell and it's
the normal state, the green is in this div. And others cases, the
yellow is the color for div.
• Add link in the cell if count is more than 0.
• Save the row in $table, and start other iteration of foreach.
• Print the table.
• Print the legend and other notes in the bottom of page.
33.7.2. API calls functions
It's few lines of code. Because the operations in this lines are: • Insert the extension into Pandora menu. And it's with the call extensions_add_operation_menu_option("Modules groups",
'estado', 'module_groups/icon_menu.png'); where:
• 'Modules groups' is the name appear in submenu of agents.
• 'estado' is the element hang the extension.
• 'module_groups/icon_menu.png' is the image icon appear in submenu, the
path is relative to your extension directory.
• Define the main function of this extension . And it's with the call extensions_add_main_function('mainModuleGroups'); where:
• 'mainModuleGroups' is the name of extension main function.
422
Explain
The order of call the functions is indifferent. You can call first one and second another or any other form. 33.7.3. Directory organization
The instalation of extension is very easy, because the Pandora Console search new extensions and add into system when new extension is found. You only copy all files of extensions into the directory extension in your Pandora Console instalation. But you must set the permissions for the Pandora Console can read the files and subdirectories of extension. In the screenshot, the extension has a directory structure: • module_groups • icon_menu.png
• module_groups.php And the extension directory is for example in /var/www/pandora_console. 33.7.4. Subdirectory
In this case, the example has one subdirectory, and usually any extension must has one subdirectory. The subdirectory has the same name as the name extension and the main file. The subdirectory of the example only has an image icon file (icon_menu.png). This icon is shown in the Pandora Menu. 423