1
http://www.phil.cmu.edu:8080/jcourse/cont...modules/causal_graphs/0000-printable.html
Causal Graphs
1000: Introduction
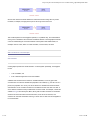
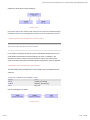
Causal relations between variables are often represented by diagrams. We draw an arrow
from a variable X to a variable Y if X is a direct cause of Y (relative to the set of variables
under consideration). So, for example, the claim that water temperature influences the height
of the water in a glass (by making the water expand or contract) can be represented by the
following diagram, where the boxes are variables with the possible values they might take on
in square brackets.
FIGURE 1000-1
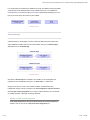
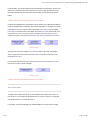
The causal relations between the state of a light bulb, a light switch and a battery can be
represented by a causal graph involving three variables:
FIGURE 1000-2
and the relations between the refrigerator door, the light switch, and the refrigerator light by
another:
FIGURE 1000-3
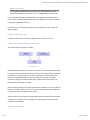
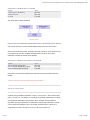
We use the same kind of diagram no matter whether the cause tends to prevent the effect or
to bring the effect about. So we would represent the claim that an inoculation (with the Salk
polio vaccine) prevents Polio by the following graph.
1 of 14
4/5/01 3:34 PM
http://www.phil.cmu.edu:8080/jcourse/cont...modules/causal_graphs/0000-printable.html
FIGURE 1000-4
We use other means to indicate whether the causal factor tends to bring about or prevent
the effect; for example, we might place a plus or minus sign next to the arrow:
FIGURE 1000-5
This module explains how causal graphs represent, in a qualitative way, the causal relations
among a set of variables. It also introduces and defines features of causal graphs that will be
crucial in understanding the connection between causal systems and statistical data, for
example: common cause, direct vs. indirect causation, common effect, and more.
2000: The Elements of Causal Graphs
2100: Variables
Causal graphs represent the causal relations in a causal system. Specifically, causal graphs
involve:
1
a set of variables, and
2
a set of directed edges that connect the variables.
Variables were introduced in the module on Variable Causation, so we only give a brief
overview here. The values of variables are properties of an individual, e.g., the hair color of a
person, the population of a country. The set of values for a variable must be both exclusive
and exhaustive. A set of values is exclusive if no individual can have more than one value. A
set of values is exhaustive if every individual has one of the values. For example, consider the
variable Hair Type with values: [Red, Blond, Short], that are neither exclusive nor exhaustive.
Someone can have hair that is both blond and short, so the set is not exclusive, and
someone can have hair that is black and long, in which case no value from the set applies so
it is not exhaustive.
2 of 14
4/5/01 3:34 PM
http://www.phil.cmu.edu:8080/jcourse/cont...modules/causal_graphs/0000-printable.html
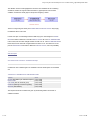
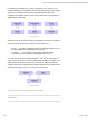
In a causal graph, we represent each variable as a box with the variable's name and possible
values (though we will sometimes leave out the variable values). So, if our variables are
REFRIGERATOR DOOR [Closed, Open], LIGHT SWITCH [Depressed, Released], and LIGHT
[Off, On], then we need to have a box for each variable:
FIGURE 2100-1
2200: Directed Edges
A directed edge in a causal graph is an arrow, where the head of the arrow points to the
effect variable and the tail comes from the cause variable. We say it is a directed edge to
distinguish it from an undirected edge :
FIGURE 2200-1
We include a directed edge from a variable X to a variable Y in the causal graph that
represents a set of variables S if and only if X is a direct cause of Y relative to S.
We gave an account of "cause" in the Variable Causation and Determinism and
Indterminism modules. The key concepts involve causal assignments, response structures,
and a test pair of causal assignments. If you need to review these ideas, go to the module
on Variable Causation. Here again are the key definitions:
Definition: Test Pair of Causal Assignments
If two causal assignments C1 and C2 are identical except for the values assigned to
variable X, then C1 and C2 are a test pair of causal assignments for X.
3 of 14
4/5/01 3:34 PM
http://www.phil.cmu.edu:8080/jcourse/cont...modules/causal_graphs/0000-printable.html
Definition: Direct Cause
If, in a system of variables S there are any test pair of causal assignments for X in
which there is a difference in the effect Y, then X is a direct cause of Y relative to S.
In the module on Determinism and Indeterminism, we explained how this definition still
covered cases of indeterministic causation in which the "difference in the effect" amounts to
a change in the probability it will occur.
Lets examine how a causal graph represents the causal relations in a system with a few
simple examples.
Example 1: Switches and Lights
Consider the causal system among the variables BATTERY, SWITCH and LIGHT.
< A simulation in the interactive version of this module. >
The causal graph of this system is as follows:
FIGURE 2200-2
Notice that there is no arrow from the switch to the battery, nor from the battery to the switch,
even though they are physically connected by wire on the circuit. Why? Because the state of
the battery has no causal influence on the state of the switch, nor does the state of the
switch (in this idealized example) have any direct influence on the state of the battery.
Intervening to change the state of the battery will not affect the state of the switch, even
though the two are physically connected.
Notice second that there is an arrow from the switch to the light bulb, even though, when the
battery is uncharged, changing the switch from open to closed (or from closed to open) will
not change the state of the light bulb (it will stay off).
There is an arrow from the switch to the light bulb because there is some state of the battery,
namely when it is charged, for which changing the causal assignment of the switch does
change the state of the light.
Example 2: Lighting a Match
4 of 14
4/5/01 3:34 PM
http://www.phil.cmu.edu:8080/jcourse/cont...modules/causal_graphs/0000-printable.html
The definition of direct cause highlights the role of the other variables we are considering.
Sometimes, whether an edge should be included in a graph depends on those other
variables. Consider the causal graph for the process of lighting a match:
FIGURE 2200-3
There is no edge that goes directly from STRIKE MATCH to MATCH LIGHTS. Why? Apply
the definition above to this case:
Is there a test pair of causal assignments that differ only by the value assigned to STRIKE
MATCH that make a difference to the effect MATCH LIGHTS? No. If the TIP TEMPERATURE
is above 350, then the match will light whether we strike it or not. If the TIP TEMPERATURE is
below 350, then the match will not light whether we strike it or not. Thus there are no test
pairs for STRIKE MATCH that make a difference to MATCH LIGHTS, even to its probability.
2300: Examples
2310: Deterministic Causation: The Malaria Example
Consider the case of malaria again. The variables in the first causal system we considered
are:
TABLE 2310-1: VARIABLES FOR THE MALARIA CASE
Variable
.
BITTEN (Was bitten by an infected mosquito) .
INOCULATED
.
HAS GENE (Has the sickle cell gene)
.
DRINKER (Drinks gin and tonics regularly)
.
MALARIA (Gets malaria)
.
Value
[True, False]
[True, False]
[True, False]
[True, False]
[True, False]
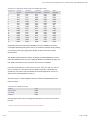
The response structure for malaria was given by the following table in the module on
Variable Causation:
5 of 14
4/5/01 3:34 PM
http://www.phil.cmu.edu:8080/jcourse/cont...modules/causal_graphs/0000-printable.html
TABLE 2310-2: RESPONSE STRUCTURE FOR THE MALARIA CASE
Assignment
. Variable 1:
BITTEN
. Variable 2:
. Variable 3:
INNOCULATED HAS GENE
. Variable 4:
DRINKER
. Effect:
MALARIA
1
2
3
4
5
6
7
8
9
10
11
12
13
14
15
16
. True
. True
. True
. True
. True
. True
. True
. True
. False
. False
. False
. False
. False
. False
. False
. False
. True
. True
. True
. True
. False
. False
. False
. False
. True
. True
. True
. True
. False
. False
. False
. False
. True
. False
. True
. False
. True
. False
. True
. False
. True
. False
. True
. False
. True
. False
. True
. False
. False
. False
. False
. False
. False
. False
. True
. True
. False
. False
. False
. False
. False
. False
. False
. False
. True
. True
. False
. False
. True
. True
. False
. False
. True
. True
. False
. False
. True
. True
. False
. False
Should there be a direct arrow from the variable BITTEN to the variable MALARIA in the
causal graph representing this system? How do you answer this question? Not by guessing,
not by common sense, but by applying the definition for direct cause to the response
structure above.
The definition requires that there is at least one test pair of causal assignments for BITTEN
that make a difference to MALARIA. So to apply the definition, first locate the test pairs, and
then check to see if there are any in which the value of MALARIA is different.
In this case, those pairs are: 1 and 9, 2 and 10, 3 and 11, 4 and 12, 5 and 13, 6 and 14, 7
and 15, and 8 and 16. Is the value of MALARIA different across any of these pairs? Put
another way, is the value of MALARIA different across causal assignments 1 and 9? Is it
different across causal assignments 2 and 10?
The answer is yes. In causal assignments 8 and 16, where the variables besides BITTEN
take on the values:
TABLE 2310-3: VARIABLE VALUES
Variable
INOCULATED
HAS GENE
DRINKER
. Value
. False
. False
. False
then changing the value of BITTEN changes the effect MALARIA. So BITTEN is a cause of
MALARIA.
< A link to exercises in the interactive version of this module. >
6 of 14
4/5/01 3:34 PM
http://www.phil.cmu.edu:8080/jcourse/cont...modules/causal_graphs/0000-printable.html
2320: Indeterministic Causation: The Cell Phone Example
Consider the case of the Cell Phone again. In the full, deterministic causal system, there are
three variables:
TABLE 2320-1: VARIABLES FOR THE CELL PHONE SYSTEM
Variable
CALL PLACED
IN RANGE OF TOWER
CONNECTED
. Value
. [Send, End]
. [Yes, No]
. [Yes, No]
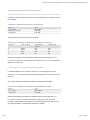
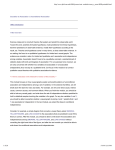
The response structure for CONNECTED is as follows:
TABLE 2320-2: DETERMINISTIC RESPONSE STRUCTURE FOR CONNECTED
Assignment
. CALL PLACED
. IN RANGE OF
TOWER
. CONNECTED
1
2
3
4
.
.
.
.
.
.
.
.
.
.
.
.
Send
Send
End
End
Yes
No
Yes
No
Yes
No
No
No
Would the causal graph among these three variables have a directed edge from CALL
PLACED to CONNECTED? Yes, because there is a test pair for CALL PLACED that makes a
difference to CONNECTED.
< A link to exercises in the interactive version of this module. >
In causal assignments 1 and 3, where IN RANGE OF TOWER is assigned "Yes," then
changing CALL PLACED from End to Send always changes the value of CONNECTED from
No to Yes.
Now consider the pseudo-indeterministic system involving just these variables:
TABLE 2320-3: VARIABLES FOR THE PSEUDO-INDETERMINISTIC SYSTEM
Variable
CALL PLACED
CONNECTED
. Value
. [Send, End]
. [Yes, No]
Would the causal graph among these two variables still have a direct edge from CALL
PLACED to CONNECTED? How do we answer the question in this case, where the
causation is indeterministic? First we write out the indeterministic response structure, and
then apply the definition of indeterministic causation for variables.
7 of 14
4/5/01 3:34 PM
http://www.phil.cmu.edu:8080/jcourse/cont...modules/causal_graphs/0000-printable.html
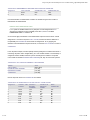
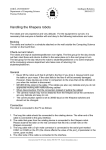
TABLE 2320-4: INDETERMINISTIC RESPONSE STRUCTURE FOR CONNECTED
Assignment
. CALL PLACED
. CONNECTED = Yes
. CONNECTED = No
1
2
. Send
. End
. 50%
. 0%
. 50%
. 100%
Here is the definition of indeterministic causation for variables we gave in the module on
Determinism and Indeterminism
Definition: Direct Indeterministic Cause
If, in a system of variables S there are any test pairs of causal assignments for X in
which there is a difference in the probability of the effect Y, then X is an direct
indeterministic cause of Y relative to S.
So we need to apply this definition to the indeterministic response structure above. Causal
assignments 1 and 2 are a test pair for CALL PLACED, and there is indeed a difference in
the probability over CONNECTED across these two assignments. So, by applying the
definition to the indeterministic response structure, it is clear that CALL PLACED is a cause of
CONNECTED
In the cell phone example, we were implicitly assuming background conditions that include a
functioning cell phone with a charged battery, etc. Lets consider whether or not the battery is
charged as another variable, instead of a part of the background conditions. The system
now includes the variable:PHONE BATTERY CHARGED [Yes, No]. So now the full system is:
TABLE 2320-5: CELL PHONE SYSTEM WITH A NEW VARIABLE
Variable
CALL PLACED
PHONE BATTERY CHARGED
IN RANGE OF TOWER
CONNECTED
. Value
.
.
.
.
[Send, End]
[Yes, No]
[Yes, No]
[Yes, No]
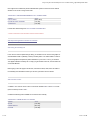
Now the response structure for CONNECTED is as follows:
TABLE 2320-6: RESPONSE STRUCTURE FOR THE CELL PHONE SYSTEM
8 of 14
Assignment
. Variable 1: CALL . Variable 2:
PLACED
BATTERY
CHARGED
. Variable 3: IN
RANGE OF
TOWER
. Effect:
CONNECTED
1
2
3
4
5
6
7
8
.
.
.
.
.
.
.
.
.
.
.
.
.
.
.
.
.
.
.
.
.
.
.
.
Send
Send
Send
Send
End
End
End
End
.
.
.
.
.
.
.
.
Yes
Yes
No
No
Yes
Yes
No
No
Yes
No
Yes
No
Yes
No
Yes
No
Yes
No
No
No
No
No
No
No
4/5/01 3:34 PM
http://www.phil.cmu.edu:8080/jcourse/cont...modules/causal_graphs/0000-printable.html
Now suppose we consider the pseudo-indeterministic system in which we cannot observe
whether or not we are in range of the tower:
TABLE 2320-7: PSEUDO-INDETERMINISTIC CELL PHONE SYSTEM
Variable
CALL PLACED
PHONE BATTERY CHARGED
CONNECTED
. Value
. [Send, End]
. [Yes, No]
. [Yes, No]
Is there still a directed edge from CALL PLACED to CONNECTED?
< A link to exercises in the interactive version of this module. >
3000: Representing Different Varieties of Causation
3100: Using the Causality Lab
In the next four sections (3200 through 3500), you will learn how to construct the graphs for
several different kinds of (relatively common) causal systems. You will be asked to construct
the causal graphs that represent systems described to you in text. To do so, you will use a
Java applet called the Causality Lab. To help you get oriented to the Lab, we have written an
on-line User Manual.
Before going to the next page in this section, read sections 3100, 3200, 3410 and 3420 of
the Causality Lab User Manual. When you are done, proceed to the next section.
3200: Common Causes
A variable C is a common cause of two or more other variables X and Y when C is a cause
(direct or indirect) of both X and Y.
Consider the following three variables for TVs that function normally.
TABLE 3200-1: VARIABLES FOR A TV SYSTEM
Variable
SOUND
POWER SWITCH
PICTURE
9 of 14
. Value
. [Yes, No]
. [On, Off]
. [Yes, No]
4/5/01 3:34 PM
http://www.phil.cmu.edu:8080/jcourse/cont...modules/causal_graphs/0000-printable.html
Suppose the causal graph for these variables is:
FIGURE 3200-1
Here POWER SWITCH is a common cause of both PICTURE and SOUND because changing
the state of POWER SWITCH changes both the value of PICTURE and the value of SOUND.
< A link to exercises in the interactive version of this module. >
3300: Causal Chains and Direct vs Indirect Causation
If one variable only influences another through some intermediate variable, then there is no
arrow between the first feature and the third feature in the chain. For example, in this
simulation, the amount of water coming from the dam through the spout influences the
speed of the turbine which influences whether electricity is generated to power the light bulb:
< A simulation in the interactive version of this module. >
The water is still a cause of the light bulb, but only an indirect one. If the variables and their
values are:
TABLE 3300-1: VARIABLES FOR TURBINE SYSTEM
Variable
WATER
TURBINE
LIGHT
. Value
. [Flowing, Not flowing]
. [Spinning, Not spinning]
. [On, Off]
then the causal graph is as follows:
FIGURE 3300-1
10 of 14
4/5/01 3:34 PM
http://www.phil.cmu.edu:8080/jcourse/cont...modules/causal_graphs/0000-printable.html
In the simulation, you cannot actually directly control whether the turbine spins, but only set a
switch next to the turbine (the Turbine Switch) to up or down. When the switch is up, then
the water is diverted away from the turbine, but if the switch is down water flows over the
turbine.
< A link to exercises in the interactive version of this module. >
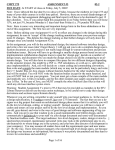
Causal chains highlight the fact that the idea of direct causation only makes sense relative to
the set of variables under consideration. In the causal graph below, for example, the variable
REFRIGERATOR DOOR is a direct cause of the variable LIGHT SWITCH, and the variable
LIGHT SWITCH is a direct cause of the variable REFRIGERATOR LIGHT, but the state of the
REFRIGERATOR DOOR is not a direct cause of the state of the REFRIGERATOR LIGHT
relative to the system : {REFRIGERATOR DOOR, LIGHT SWITCH, REFRIGERATOR LIGHT}.
FIGURE 3300-2
Why? Because if we fix the variable LIGHT SWITCH at either of its values, then bringing
about a change in the state of the REFRIGERATOR DOOR will have no influence on the
REFRIGERATOR LIGHT.
If we were only discussing the system: {REFRIGERATOR DOOR, REFRIGERATOR LIGHT},
then the door is a direct cause of the light:
FIGURE 3300-3
< A link to exercises in the interactive version of this module. >
3400: Common Effects
A variable E is a common effect of two or more variables X and Y when both X and Y are
both causes of E, and at least one causal path from X to E does not involve Y, and at least
one causal path from Y to E does not involve X.
For example, consider the following three variables applied to TVs that function normally.
11 of 14
4/5/01 3:34 PM
http://www.phil.cmu.edu:8080/jcourse/cont...modules/causal_graphs/0000-printable.html
TABLE 3400-1: VARIABLES FOR A TV SYSTEM
Variable
POWER SWITCH (on the TV)
REMOTE SWITCH
PICTURE
. Value
. [On, Off]
. [On, Off]
. [Yes, No]
The causal graph for these variables is:
FIGURE 3400-1
Here PICTURE is a common effect of both REMOTE SWITCH and POWER SWITCH. This is a
case in which each of the "cause" variables independently causes the common effect.
When we have interacting causes, the graph is the same in structure. So the structure of the
causal graph is by no means completely informative about the nature of the causal
relationship. Consider the following set of variables:
TABLE 3400-2: VARIABLES FOR AGRICULTURE SYSTEM
Variable
WATER (did the crops get rain)
FERTILIZER (did the fertilizer get water)
GROWTH (did the plants grow well)
. Value
. [On, Off]
. [Yes, No]
. [Yes, No]
Furthermore, we will assume that plants grow well only if they are both watered and have
fertilizer.
< A link to exercises in the interactive version of this module. >
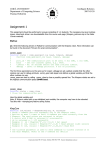
3500: Cyclic Causal Graphs
Causation among variables is asymmetric. That is, if X is a cause of Y, then it doesn't follow
that Y is a cause of X. "Is a sibling of" is an example of a symmetric relationship. An example
of an asymmetric relationship among people is "likes." Causation among variables is
asymmetric, but it isn't antisymmetric. A relationship is antisymmetric if the fact that it holds
one way precludes it holding the other. For example, the relationship "is a parent of" is
antisymmetric. If person X is a parent of Y, then Y cannot be a parent of X.
12 of 14
4/5/01 3:34 PM
http://www.phil.cmu.edu:8080/jcourse/cont...modules/causal_graphs/0000-printable.html
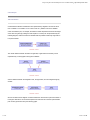
It is possible for one variable X to be a cause of Y and also for Y to be a cause of Y. For
example, losing sleep can cause anxiety, and anxiety can also cause a loss of sleep. Higher
wages can cause inflation, and inflation can cause higher wages. Success causes
confidence, and confidence causes success. In each of these cases, we say that there is a
direct cycle in the causal graph.
FIGURE 3500-1
What does it mean to say that there is a direct cycle between SUCCESS and CONFIDENCE?
We can just apply the defintion we have given for a "direct cause" twice:
+
SUCCESS
CONFIDENCE: There are test pairs of causal assignments for SUCCESS
that make a difference to the probability over CONFIDENCE.
+
CONFIDENCE
SUCCESS: There are test pairs of causal assignments for
CONFIDENCE that make a difference to the probability over SUCCESS.
So, a direct cycle is just when we have two variables, X and Y, and X is a direct cause of Y,
and Y is also a direct cause of X. Cycles of causality need not be direct. For example, in the
system including the variables LOSING SLEEP and ANXIETY, we might also include the
variable: ADRENALINE. The system would now best be represented by the following causal
graph, where the effect of ANXIETY on LOSING SLEEP is now indirect:
FIGURE 3500-2
< A link to exercises in the interactive version of this module. >
4000: Summary
13 of 14
4/5/01 3:34 PM
http://www.phil.cmu.edu:8080/jcourse/cont...modules/causal_graphs/0000-printable.html
Causal graphs provide a powerful qualitative representation of causal relations among
variables. A causal graph includes a set of variables, and a set of directed edges that
connect pairs of these variables. The edges are "directed" because causation is asymmetric
and has a direction. If one variable X is a direct cause of another variable Y in some causal
system S, then we include an arrow, or directed edge, from X to Y in the causal graph that
represents S.
What does it mean for one variable to be a direct cause of another relative to a system of
variables S? X is a direct cause of Y relative to a set of variables Sjust in case there are test
pairs of causal assignments for X across which there is a difference in Y.
Whether or not there is an edge from one variable to another depends on what other
variables we have included in the system. If, for example, there is a causal chain A
B
C,
but A has no direct influence on C that doesn't go through B, then we don't include an edge
from A to C. If we consider a system that doesn't include B, however, then relative to that
system, we need to include an A
C edge.
Although causation among variables is asymmetric, it is not anti-symmetric, so it is possible
for one variable A to be a cause of B and also for B to be a cause of A. In such a case, we
say the causal graph has a direct cycle. If there is a chain of edges leading from any variable
back to itself, then we say the graph has a cycle. If a graph has a cycle, we say it is a cyclic
graph. If the graph has no cycle, then we say it is acyclic.
14 of 14
4/5/01 3:34 PM