1
Mentype® Chimera®
Manual
The new standard for chimerism analysis
In-Vitro-Diagnostics
25
100
400
1000
Version January 2013
45-13210-0025
45-13210-0100
45-13210-0400
45-13210-1000
Batch Code
Biotype Diagnostic GmbH
Moritzburger Weg 67
D-01109 Dresden
Germany
Made in Germany
2
Biotype Diagnostic GmbH develops, produces and markets their PCR-based rapid
Mentype® Detection Kits. Our products provide customers with fast and reliable
testing methods for professional medical diagnostics.
Our Mentype® Test Kits guarantee highest quality standards for
clinical research and diagnostics.
For information and enquiries about the Mentype® Chimera®
PCR Amplification Kit, please do not hesitate to get in touch or visit
www.biotype.de/en/home.html.
Mentype® Chimera®
January 2013
Mentype® Chimera®
3
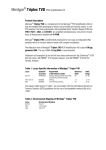
Product description
Mentype® Chimera® is a multiplex-PCR application specifically developed for
chimerism monitoring after blood stem cell and bone marrow transplantation,
respectively. The assay was validated by chimerism analysis of over 200 HLA-matched
related donor-recipient-pairs and its suitability was confirmed in a comparative clinical
evaluation study. Ever since the assays is successfully used in routine diagnostics.
Genetic markers that are addressed by Mentype® Chimera® are distributed over 12
chromosomes and represent highly polymorphic short tandem repeats (STRs) with a
very high rate of heterozygosity and a balanced allelic distribution. Together, this
significantly increases the chance to identify informative loci for donor-recipient
discrimination and provides reliability and robustness of chimerism analyses.
One PCR reaction simultaneously amplifies the autosomal loci D2S1360, D3S1744,
D4S2366, D5S2500, D6S474, D7S1517, D8S1132, D10S2325, D12S391,
D18S51, D21S2055, SE33 (ACTBP2), and the gender-specific locus Amelogenin. .
One primer for each locus is fluorescence-labelled with 6-FAM, BTG, or BTY.
The detection limit of the Mentype® Chimera® PCR amplification kit is 200 pg
genomic DNA. The optimal range under standard conditions is 0.2-1.0 ng DNA.
The test kit is validated using the GeneAmp® PCR System 9700 Aluminium, Eppendorf
Mastercycler ep-S, Biometra T1, ABI PRISM® 310 Genetic Analyzer and
ABI PRISM® 3130 Genetic Analyzer applying the POP-4® polymer.
Development, manufacture and distribution of Biotype® products are certified
according to DIN EN ISO 9001:2008.
Mentype® Chimera®
January 2013
4
Content
1. Description of Mentype® Chimera® ................................................................ 5
2. PCR amplification .......................................................................................... 8
2.1 Master mix preparation............................................................................ 8
2.2 PCR amplification parameter.................................................................... 9
3. Electrophoresis using the ABI PRISM® 310 Genetic Analyzer ......................... 10
3.1 Matrix generation .................................................................................. 10
3.2 Sample preparation ............................................................................... 13
3.3 Setting up the GeneScan® software ....................................................... 13
3.4 Analysis parameter ............................................................................... 14
4. Electrophoresis using the ABI PRISM® 3100-Avant/3100 Genetic Analyzer..... 15
4.1 Spectral calibration / matrix generation................................................... 15
4.2 Sample preparation ............................................................................... 17
4.3 Setting up the GeneScan® software ....................................................... 18
4.4 Analysis parameter ............................................................................... 19
5. Electrophoresis using the ABI PRISM® 3130/3130xl Genetic Analyzer ............ 20
5.1 Spectral calibration / matrix generation................................................... 20
5.2 Sample preparation ............................................................................... 23
5.3 Setting up the GeneMapper™ ID software ............................................. 24
5.4 Analysis parameter / analysis method .................................................... 26
6. Electrophoresis using the ABI PRISM® 3500/3500xL Genetic Analyzer ........... 27
6.1 Spectral calibration / matrix generation................................................... 27
6.2 Sample preparation ............................................................................... 30
6.3 Setting up a run .................................................................................... 31
7. Analysis ...................................................................................................... 34
7.1 Biotype® template files .......................................................................... 35
7.2 Controls................................................................................................ 37
7.3 Lengths of fragments and alleles............................................................ 37
8. Interpretation of results ................................................................................ 43
9. Population-genetic data ............................................................................... 44
10. References ............................................................................................... 47
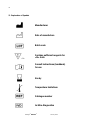
11. Explanation of Symbols .............................................................................. 48
Mentype® Chimera®
January 2013
5
1. Description of Mentype® Chimera®
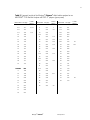
Table 1. Locus-specific information of Mentype® Chimera®
Locus
Amelogenin X
Amelogenin Y
D2S1360
D3S1744
D4S2366
D5S2500
D6S474
D7S1517
D8S1132
D10S2325
D12S391
D18S51
D21S2055
GenBank
accession
M55418
M55419
G08130
G08246
G08339
G08468
G08540
G18365
G08685
G08790
G08921
L18333
G27274
SE33 (ACTBP2)
NG000840
Repeat motif
of the reference allele
Reference
allele
[TATC]9 [TGTC]9 [TATC]5
[TCTA]2 TA[TCTA]12 TCA [TCTA]2
[ATAG]9 ATTG [ATAG]2
[ATAG]12
[TAGA]5 TGA [TAGA]12
[GAAA]11 CAAA [GAAA]2 CAAA [GAAA]2
[TCTA]9 TCA [TCTA]9 TCTGTCTA
[TCTTA]12
[AGAT]5 GAT [AGAT]7 [AGAC]6 AGAT
[AGAA]13
[CTAT]2 CTAA [CTAT]9 CTA [CTAT]3 TAT
[CTAT]3 TAT [CTAT]4 CAT[CTAT]2
[AAAG]9 AA [AAAG]16
Allele
range
23
16
12
12
17
17
20
12
19.3
13
24
19-32
13-22
9-15
9-18
11-20
14-31
12.1-27
6-23
13-28
5.3-42
16.1-39
25.2
3-50
Table 1 shows STR loci with respective repeat motifs and alleles that are concordant
with the guidelines for the use of microsatellite markers of the International Society for
Forensic Genetics (ISFG; Bär et al., 1997). The nomenclature for STR loci D8S1132
and D12S391 is in accordance with Hering and Müller (2001), for loci D4S2366 und
D6S474 with Becker et al. (2007), for locus D10S2325 with Wiegand et al. (1999) and
the nomenclature for locus D7S1517 is in accordance with Wiegand and Klintschar
(2002). Allele ranges include all known alleles of the National Institute of Standards
and Technology (NIST as at 12/2008) and the current literature.
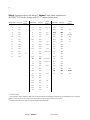
Table 2. Chromosomal mapping for Mentype® Chimera®
Locus
Amelogenin X
Amelogenin Y
D2S1360
D3S1744
D4S2366
D5S2500
D6S474
D7S1517
D8S1132
D10S2325
D12S391
D18S51
D21S2055
SE33
Chromosomal mapping
Xp22.1-22.3
Yp11.2
2p24-p22
3p24
4p16-15.2
5q11.2
6q21-22
7q31.33
8q23.1
10p12
12p13.2
18q21.3
21q22
6q14.2
Mentype® Chimera®
January 2013
6
Kit content
Mentype® Chimera® PCR Amplification Kit (100 Reactions)
Nuclease-free water
Reaction mix A
Primer mix
Multi Taq2 DNA polymerase
Control DNA XY5 (2 ng/µl)
DNA Size Standard 550 (BTO)
Allelic ladder
3.0 ml
500 µl
250 µl
40 µl
10 µl
50 µl
25 µl
Ordering information
Mentype® Chimera®
Mentype® Chimera®
Mentype® Chimera®
Mentype® Chimera®
25 reactions
100 reactions
400 reactions
1000 reactions
Cat. No.
Cat. No.
Cat. No.
Cat. No.
45-13210-0025
45-13210-0100
45-13210-0400
45-13210-1000
Storage
Store all components at -20 °C and avoid repeated thawing and freezing. Primer mix
and allelic ladder must be stored protected from light. The DNA samples and post-PCR
reagents (allelic ladder and DNA size standard) should be stored separately from PCR
reagents. The expiry date is indicated on the kit cover.
Additionally required reagents
Additional reagents required in order to use the Biotype® PCR Amplification Kit:
Reagent
Hi-Di™ Formamide, 25 ml
Matrix Standards BT5
single-capillary instruments (5x25 µl)
Matrix Standards BT5
multi-capillary instruments (25 µl)
Matrix Standards BT5
multi-capillary instruments (50 µl)
Mentype® Chimera®
Supplier
Life Technologies
Corporation
Order number
4311320
Biotype Diagnostic GmbH
00-10411-0025
Biotype Diagnostic GmbH
00-10421-0025
Biotype Diagnostic GmbH
00-10421-0050
January 2013
7
Warnings and safety instructions
The PCR Amplification Kit contains the following potentially hazardous chemicals:
Kit component
Reaction mix
Chemical
Sodium azide NaN3
Hazards
toxic if swallowed, develops toxic gases
when it gets in contact with acids
Observe the Material Safety Data Sheets (MSDS) for all Biotype® products, which are
available on request. Please contact the respective manufacturers for copies of the
MSDS for any additionally needed reagents.
Quality assurance
All kit components undergo an intensive quality assurance process at Biotype
Diagnostic GmbH. Quality of the test kits is permanently monitored to ensure
unrestricted usability. Please contact us if you have any questions regarding quality
assurance.
Trademarks and Patents
Mentype® and Chimera® are registered trademarks of Biotype Diagnostic GmbH.
ABI PRISM®, GeneMapper®, GeneAmp® and Applied Biosystems® are registered
trademarks of Applied Biosystems LLC.
Under the law of Europe POP-4® is a registered trademark of Applied Biosystems LLC.
POP-4® is registered as trademark of Life Technologies Corporation in the US.
The PCR is covered by patents. Patentees are Hoffmann-La Roche Inc. and
F. Hoffmann-La Roche (Roche).
Mentype® Chimera®
January 2013
8
Protocols for PCR amplification, electrophoresis, and analysis
2. PCR amplification
2.1 Master mix preparation
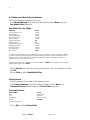
The table below shows the volumes of all PCR reagents per 25 µl reaction volume,
including a sample volume of 1.0 µl (template DNA). The number of reactions to be set
up shall be determined taking into account positive and negative control reactions. Add
one or two reactions to this number to compensate the pipetting error.
Component
Nuclease-free water
Reaction mix A*
Primer mix
Multi Taq2 DNA Polymerase (hot start, 2.5 U/µl)
Volume of master mix
Volume
16.1 µl
5.0 µl
2.5 µl
0.4 µl
24.0 µl
* contains Mg2+, dNTPs, BSA
All components should be mixed (vortex) and centrifuged for about 10 s before
preparing the master mix. The volume of DNA applied to the assay depends on its
concentration. For reference samples 1 µl is mostly sufficient. For critical patient
samples the amount of template can be increased appropriately. Fill up the final
reaction volume to 25 µl with nuclease-free water.
Generally, DNA templates shall be stored in nuclease-free water or in diluted TE buffer
(10 mM Tris HCl, pH 8.0 and 1 mM EDTA), e.g. 0.1 x TE buffer.
The primer mixes are adjusted for balanced peak heights at 30 PCR cycles and
0.5 ng Control DNA XY5 in a reaction volume of 25 µl. If more DNA template is
applied, higher peaks can be expected for small PCR fragments and relatively low
peaks for large fragments. Reduce the amount of DNA template to correct this
imbalance.
Positive control
For the positive amplification control, dilute Control DNA XY5 to 0.5 ng/µl.
Instead of template DNA, pipette diluted Control DNA into a reaction tube containing
the PCR master mix.
Negative control
For the negative amplification control, pipette nuclease-free water instead of template
DNA into a reaction tube that contains the PCR master mix.
Template DNA
Sometimes, measured DNA concentration varies depending on the quantification
method used. It might thus be necessary to adjust the optimal DNA amount.
Mentype® Chimera®
January 2013
9
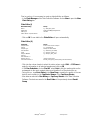
2.2 PCR amplification parameter
Perform a “hot start” PCR in order to activate the Multi Taq2 DNA Polymerase and to
prevent formation of non-specific amplification products.
Number of PCR cycles depend on the amount of DNA applied. 30 PCR cycles are
recommended for all samples. In case of critical samples (< 100 pg DNA), the number
of PCR cycles can be increase from 30 to 32.
Standard method
Recommended for all DNA samples
Temperature
94 °C
94 °C
60 °C
72 °C
68 °C
10 °C
Time
4 min (hot start for activation of the Multi Taq2 DNA Polymerase)
30 s
120 s
30 cycles
75 s
60 min
∞
hold
Optional
Recommended for small amounts of DNA
Temperature
94 °C
94 °C
60 °C
72 °C
68 °C
10 °C
Time
4 min (hot start for activation of the Multi Taq2 DNA Polymerase)
30 s
120 s
32 cycles
75 s
60 min
∞
hold
Note: If thermal cyclers with rapid heating and cooling steps (> 2 °C/s) are used,
ramping should be adjusted to 2 °C/s in order to provide an optimal kit balance.
Very small amounts of DNA may result in statistical dropouts and imbalances of the
peaks. Increasing numbers of PCR cycles raise the risk of cross contamination caused
by minimal amounts of impurities. Furthermore, unspecific amplification products could
appear.
.
Mentype® Chimera®
January 2013
10
3. Electrophoresis using the ABI PRISM® 310 Genetic Analyzer
For general instructions on instrument setup, matrix generation and application of the
GeneScan® or GeneMapper® ID software, refer to the ABI PRISM® 310 Genetic
Analyzer User’s Manual. Electrophoresis using the GeneScan® software is described
below.
The virtual filter set G5 shall be used for combined application of the five fluorescent
labels 6-FAM, BTG, BTY, BTR, and BT0 (the matrix standard will be called BT5
hereinafter).
Material
Capillary
Polymer
Buffer
47 cm / 50 µm (green)
POP-4® for 310 Genetic Analyzer
10x Genetic Analyzer Buffer with EDTA
3.1 Matrix generation
Prior to conducting DNA fragment size analysis with the filter set G5, a matrix with five
fluorescent labels 6-FAM, BTG, BTY, BTR, and BTO must be generated.
Color
Blue (B)
Green (G)
Yellow (Y)
Red (R)
Orange (O)
Matrix standard
6-FAM
BTG
BTY
BTR
BTO
Five electrophoresis runs shall be conducted, one for each fluorescent label, 6-FAM,
BTG, BTY, BTR, and BTO, use the same conditions as for samples and allelic ladders
of the Biotype® test kit to generate suitable matrix files.
Matrix sample
Matrix sample 1
Component
Hi-Di™ Formamide
Matrix standard 6-FAM
Volume
12.0 µl
1.0 µl
Matrix sample 2
Hi-Di™ Formamide
Matrix standard BTG
12.0 µl
1.0 µl
Matrix sample 3
Hi-Di™ Formamide
Matrix standard BTY
12.0 µl
1.0 µl
Matrix sample 4
Hi-Di™ Formamide
Matrix standard BTR
12.0 µl
1.0 µl
Matrix sample 5
Hi-Di™ Formamide
Matrix standard BTO
12.0 µl
1.0 µl
- Denaturation for 3 min at 95 °C
- Cool down to 4 °C and place samples on the autosampler tray
- Create a Sample Sheet, choose 5 Dyes and enter a sample designation
Mentype® Chimera®
January 2013
11
Injection list for matrix generation
Parameter
Module File
Matrix File
Size Standard*
Injection [s]
Injection [kV]
Run [kV]
Run [°C]
Run Time [min]
Set up
GS STR POP-4 (1 ml) G5
NONE
NONE
5
15.0
15.0
60
24
* Prepare matrix standards always without DNA Size Standard (BTO)
Analysis of the matrix samples
- Run the GeneScan® software
- File → New → Project (open folder of current run) → Add Sample Files
- Select a matrix sample in the Sample File column
- Sample → Raw Data
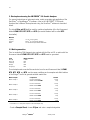
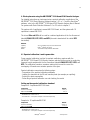
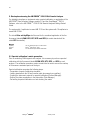
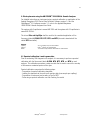
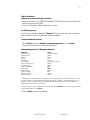
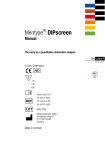
- Check the matrix samples for a flat baseline. As shown in the figure below there
should be at least five peaks with peak heights about 1000-4000 RFU (Y-axis) for
each matrix sample (optimal range: 2000-4000 RFU)
▼ 3200 Data Points (X)
5500▼
Fig. 1 Electropherogram with raw data of the matrix standard 6-FAM
- Select an analysis range with flat baseline and re-inject the matrix sample if
necessary
- Note down start and end value (data points) of the analysis range, e.g. start value
3200, end value 5500
- Calculate the difference, e.g. 5500-3200 = 2300 data points
Mentype® Chimera®
January 2013
12
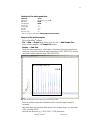
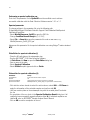
Generation of a new matrix
- File → New → Matrix
Fig. 2 Matrix sample selection
- Import matrix samples for all dyes (B, G, Y, R, O)
- Enter a Start At value, e.g. 3200
- Enter the calculated difference under Points, e.g. 2300
- Click on OK to calculate the new matrix
Fig. 3 New matrix BT5
- Save the matrix in the matrix folder: File → Save as, e.g. Matrix BT5
Matrix check
Check the new matrix with current samples.
- File → New → Project (open folder of the respective run) → Add Sample Files
- Select sample(s) in the Sample File column
- Sample → Install New Matrix (open matrix folder and select new matrix)
- Re-analyse your samples
There should be no pull-up peaks between the dye panels (B, G, Y, R, O) with the new
matrix.
Mentype® Chimera®
January 2013
13
3.2 Sample preparation
Component
Hi-Di™ Formamide
DNA Size Standard 550 (BTO)
prepare 12 µl of the mix (formamide + DNA size standard) for all samples
add 1 µl PCR product (diluted if necessary) or allelic ladder
- Denaturation for 3 min at 95 °C
- Cool down to 4 °C
- Cool down to 4 °C and place samples on the autosampler tray
Volume
12.0 µl
0.5 µl
Signal intensities
Options to increase the signal intensity:
- Reduce the volume of the DNA Size Standard 550 (BTO) to peak heights of
about 500 relative fluorescent units (RFU)
- Purify the PCR products before starting the analysis
3.3 Setting up the Data Collection Software
- Create a Sample Sheet and enter sample designation
Injection list
Parameter
Module File
Matrix File
Size Standard
Injection [s]*
Injection [kV]
Run [kV]
Run [°C]
Run Time [min]**
Set up
GS STR POP-4 (1 ml) G5
e.g. Matrix BT5
e.g. SST-BTO_60-500bp
5
15.0
15.0
60
28
* Deviating from the standard settings, the injection time may range between 1 and 20 s depending on the type
of sample. If reference samples with very high signal intensities are recorded, a shorter injection time may be
selected in order to avoid pull-up peaks. For samples with low cDNA content or critical patient samples an
injection time of up to 20 s may be necessary.
** Depending on the analysis conditions, the run time for Mentype® Chimera® was modified in order to analyse
fragments with lengths of up to 500 bp.
Mentype® Chimera®
January 2013
14
3.4 Analysis parameter / analysis method
The recommended analysis parameters are:
Analysis Range
Data Processing
Peak Detection
Size Call Range
Size Calling Method
Split Peak Correction
Start: 2000
Stop: 10000
Baseline: Checked
Multicomponent: Checked
Smooth Options: Light
Peak Amplitude Thresholds
B:* Y:*
G:* R:*
O:*
Min. Peak Half Width: 2 pts
Polynominal Degree: 3
Peak Window Size: 11 pts**
Min: 60
Max: 550
Local Southern Method
None
* The peak amplitude threshold (cut-off value) corresponds to the minimum peak height that will be detected by
the GeneScan® or GeneMapper® ID software. Thresholds are usually 50-200 RFU and should be determined
individually by the laboratory. Recommendation: The minimal peak height should be three times as high as the
background noise of the baseline.
** Point alleles (i.e. alleles with at least 1 bp difference to the next integer allele) may occasionally not be
distinguished. For improved peak detection, minimise the Peak Window Size further.
Mentype® Chimera®
January 2013
15
4. Electrophoresis using the ABI PRISM® 3100-Avant/3100 Genetic Analyzer
For detailed instructions on instrument setup, spectral calibration, application of the
ABI PRISM® 3100 Data Collection Software version 1.0.1 or 1.1 and the GeneScan®
software, refer to the ABI PRISM ® 3100-Avant/3100 Genetic Analyzer User’s Manual.
For systems with Data Collection Software 2.0 or 3.0 refer to chapter 5.
The system with 4 capillaries is named ABI 3100-Avant, and the system with 16
capillaries is named ABI 3100.
The virtual filter set G5 shall be used for combined application of the five fluorescent
labels 6-FAM, BTG, BTY, BTR, and BT0 (the matrix standard will be called BT5
hereinafter).
Material
Capillary
Polymer
Buffer
36 cm Capillary Array for 3100-Avant/3100
POP-4® Polymer for 3100
10x Genetic Analyzer Buffer with EDTA
4.1 Spectral calibration / matrix generation
Proper spectral calibration is critical to evaluate multicolour systems with the
ABI PRISM® 3100-Avant/3100 Genetic Analyzer and shall be done prior to conducting
fragment length analysis with the five fluorescent labels 6-FAM, BTG, BTY, BTR, and
BT0. The calibration procedure creates a matrix which is used to correct the
overlapping of fluorescence emission spectra of the dyes.
Spectral calibration comprises the following steps:
- Preparation of the spectral calibration standards
- Loading the standards to the 96-well reaction plate (one sample per capillary)
- Entering the plate composition
- Performing a spectral calibration run and checking the matrix
Setting up the spectral calibration standard
Example for 4 capillaries/ABI 3100-Avant
Component
Hi-Di™ Formamide
Matrix standard BT5
- Load 12 µl of the mix to a 96-well reaction plate, e.g. position A1-D1
- Denaturation for 3 min at 95 °C
- Cool down to 4 °C and place samples on the autosampler tray
Volume
60.0 µl
5.0 µl
Example for 16 capillaries/ABI 3100
Component
Volume
Hi-Di™ Formamide
204.0 µl
17.0 µl
Matrix standard BT5
- Load 12 µl of the mix to a 96-well reaction plate, e.g. position A1-H1 and A2-H2
- Denaturation for 3 min at 95 °C
- Cool down to 4 °C and place samples on the autosampler tray
Mentype® Chimera®
January 2013
16
Performing a spectral calibration run
First of all, the parameter file for DyeSetG5 must be modified once to achieve
successful calibration with the Data Collection Software version 1.0.1 or 1.1.
Spectral parameter
To change settings in the parameter file go to the following path:
D:\AppliedBio\Support Files\Data Collection Support Files\CalibrationData\Spectral
Calibration\ParamFiles
- Select MtxStd{Genescan_SetG5} to open the PAR-file
- Change Condition Bounds Range to [1.0; 20.0]
- Select File → Save As to save the parameter file under a new name, e.g.
MtxStd{Genescan_SetG5_BT5}.par
Always use this parameter file for spectral calibration runs using Biotype® matrix standard
BT5.
Plate Editor for spectral calibration (I)
- Place the 96-well plate on the autosampler tray
- Run the ABI PRISM® 3100 Data Collection Software
- In Plate View click New to open the Plate Editor dialog box
- Enter a name of the plate
- Select Spectral Calibration
- Select 96-Well as plate type and click on Finish
Plate editor for spectral calibration (II)
Parameter
Sample Name
Dye Set
Spectral Run Module
Spectral Parameters
Set up
Enter name for the matrix samples
G5
Default (enter the name for spectral run module)
MtxStd{GeneScan_SetG5_BT5}.par (parameters created before)
- Click into the column header to select the entire column, select Edit → Fill Down to
apply the information of the selected samples and confirm with OK
- Link your reaction plate on the autosampler tray with the created plate ID and start
the run
- On completion of the run check in the Spectral Calibration Result dialog box if all
capillaries have successfully passed calibration (label A). If individual capillaries are
labelled X, refer to ABI PRISM ®Genetic Analyzer User’s Manual.
- Click on OK to confirm completion of the run
Mentype® Chimera®
January 2013
17
Matrix check
- Select Tools → Display Spectral Calibration → Dye Set → G5 to review the
spectral calibration profile for each capillary
- The quality value (Q value) must be greater than 0.95 and the condition number
(C value) must be between 1 and 20. Both values must be within the previously
determined range
- Check the matrix samples for a flat baseline. There should be five peaks with peak
heights of about 1000-5000 RFU (Y-axis) in each matrix sample (optimal range:
2000-4000 RFU)
- If all capillaries have passed the calibration, the last calibration file for Dye Set G5
must be activated manually under Tools → Set Active Spectral Calibration.
Rename the calibration file under Set Matrix Name (e.g. BT5_Date of calibration)
- If calibration was not successful, try to re-inject the samples with higher injection
voltage or injection time. The editing of the Spectral Run Module will be necessary.
You can re-inject the same samples up to three times. Otherwise use more matrix
standard for spectral calibration
- Check the new matrix with your current samples. There should be no pull-up peaks
between the dye panels (B, G, Y, R, O) with the new matrix
4.2 Sample preparation
Component
Hi-Di™ Formamide
DNA Size Standard 550 (BTO)
Prepare 12 µl of the mix (formamide + DNA size standard) for all samples
Add 1 µl PCR product (diluted if necessary) or allelic ladder
- Denaturation for 3 min at 95°C
- Cool down to 4°C
- For analysis: load samples on the tray
Volume
12.0 µl
0.5 µl
Since injections take place simultaneously on all capillaries, 4 or 16 samples must be
pipetted on the plate of multi-capillary analyzers. If fewer samples are analysed, the
empty positions must be filled with 12 µl Hi-Di™ Formamide.
To ensure a reliable allelic assignment on multi-capillary analyzers, several allelic
ladders should be run.
Room temperature may influence the performance of PCR products on multi-capillary
instruments, so that shoulder peaks or split peaks occur especially at low
temperatures. Pay attention to keeping ambient conditions as recommended by the
instrument manufacturer. Optimal will be a stable room temperature > 22 °C.
Signal intensities
Options to increase the signal intensity:
- Reduce the volume of the DNA Size Standard 550 (BTO) to peak heights of about 500
relative fluorescent units (RFU)
- Purify the PCR products before starting the analysis
Mentype® Chimera®
January 2013
18
4.3 Setting up the Data Collection Software
Edit the default run module in Dye Set G5 once for the first run.
- Select Module Editor to open the dialog box
- Select the appropriate Run Module as template from the GeneScan table
- Modify the Injection Voltage to 3 kV and the Injection Time to 10 s
Run Module 3kV_10s_500bp
Parameter
Run Temperature [°C]
Cap Fill Volume
Maximum Current [A]
Current Tolerance [A]
Run Current [A]
Voltage Tolerance [kV]
Pre Run Voltage [kV]
Pre Run Time [s]
Injection Voltage [kV]
Injection Time [s]*
Run Voltage [kV]
Number of Steps
Voltage Step Interval
Data Delay Time [s]
Run Time [min]**
Set up
Default
Default
Default
Default
Default
Default
Default
Default
3.0
10
Default
Default
Default
Default
26
* Deviating from the standard settings, the injection time may range between 1 and 20 s depending on the type
of sample. If reference samples with very high signal intensities are recorded, a shorter injection time may be
selected in order to avoid pull-up peaks. For samples with low DNA content or critical patient samples an
injection time of up to 20 s may be necessary.
** Depending on the analysis conditions, the run time for Mentype® Chimera® was modified in order to analyse
fragments with lengths of up to 500 bp.
- Click on Save As, enter the name of the new module (e.g. 3kV_10s_500bp) and
confirm with OK
- Click on Close to exit the Run Module Editor
Starting the run
- Place the prepared 96-well plate on the autosampler tray
- Run the ABI PRISM® 3100 Data Collection Software
- In Plate View click on New to open the Plate Editor dialog box
- Enter a name of the plate
- Select GeneScan
- Select 96-Well as plate type and click on Finish
Mentype® Chimera®
January 2013
19
Plate Editor
Parameter
Sample Name
Dyes
Colour Info
Project Name
Dye Set
Run Module*
Analysis Module 1
Set up
Enter name for the samples
O
Ladder or sample
e.g. 3100_Project1
G5
3kV_10s_500bp
DefaultAnalysis.gsp
* parameter see above
- Complete the table in the Plate Editor and click on OK
- Click into the column header to select the entire column and select Edit → Fill
Down to apply the information of the selected samples
- Link your reaction plate on the autosampler tray with the created plate ID and start
the run
- On completion of the run, view data as Color Data in Array View of the 3100 Data
Collection Software or as Analyzed Sample Files under
D:/AppliedBio/3100/DataExtractor/ExtractRuns
4.4 Analysis parameter / analysis method
The recommended analysis parameters are:
Analysis Range
Data Processing
Peak Detection
Size Call Range
Size Calling Method
Split Peak Correction
Start: 2000
Stop: 10000
Baseline: Checked
Multicomponent: Checked
Smooth Options: Light
Peak Amplitude Thresholds
B:* Y:*
G:* R:*
O:*
Min. Peak Half Width: 2 pts
Polynominal Degree: 3
Peak Window Size: 11 pts**
Min: 60
Max: 550
Local Southern Method
None
* The peak amplitude threshold (cut-off value) corresponds to the minimum peak height that will be detected by
the GeneScan or GeneMapper® ID software. Thresholds are usually 50-200 RFU and should be determined
individually by the laboratory. Recommendation: The minimal peak height should be three times as high as the
background noise of the baseline.
** Point alleles (i.e. alleles with at least 1 bp difference to the next integer allele) may occasionally not be
distinguished. For improved peak detection, minimise the Peak Window Size further.
Mentype® Chimera®
January 2013
20
5. Electrophoresis using the ABI PRISM® 3130/3130xl Genetic Analyzer
For detailed instructions on instrument setup, spectral calibration, or application of the
ABI PRISM® Data Collection Software version 3.0 and the GeneMapper® ID/ID-X
Software, refer to the ABI PRISM ® 3130/3130xl Genetic Analyzers Getting Started
Guide.
The system with 4 capillaries is named ABI 3130 and the system with 16 capillaries is
named ABI 3130xl.
The virtual filter set Any5Dye shall be used for the combined application of the five
fluorescent labels 6-FAM, BTG, BTY, BTR, and BT0 (the matrix standard will be
called BT5 hereinafter).
Material
Capillary
Polymer
Buffer
36 cm Capillary Array for 3130/3130xl
POP-4® Polymer for 3130
10x Genetic Analyzer Buffer with EDTA
5.1 Spectral calibration / matrix generation
Prior to conducting DNA fragment size analysis, it is necessary to perform a spectral
calibration with the fluorescent labels 6-FAM, BTG, BTY, BTR, and BTO for each
analyzer. The calibration procedure creates a matrix that is used to correct the overlap
of fluorescence emission spectra of the dyes.
Spectral calibration comprises the following steps:
- Preparation of spectral calibration standards
- Loading standards to the 96-well reaction plate (one sample per capillary)
- Creating the instrument protocol for spectral calibration (Protocol Manager)
- Defining the plate composition in the plate editor (Plate Manager)
- Performing a spectral calibration run and checking the matrix
Mentype® Chimera®
January 2013
21
Setting up the spectral calibration standards
Example for 4 capillaries/ABI 3130
Component
Hi-Di™ Formamide
Matrix standard BT5
- Load 12 µl of the mix to a 96-well reaction plate, e.g. position A1-D1
- Denaturation for 3 min at 95 °C
- Cool down to 4 °C and place samples on the autosampler tray
Volume
60.0 µl
5.0 µl
Example for 16 capillaries/ABI 3130xl
Component
Volume
Hi-Di™ Formamide
204.0 µl
17.0 µl
Matrix standard BT5
- Load 12 µl of the mix to a 96-well reaction plate, e.g. position A1-H1 and A2-H2
- Denaturation for 3 min at 95 °C
- Cool down to 4 °C and place samples on the autosampler tray
Performing a spectral calibration run
- Place the 96-well plate on the autosampler tray
- In the Protocol Manager of the Data Collection Software click on New in
Instrument Protocol to open the Protocol Editor dialog box
Instrument Protocol for spectral calibration
Protocol Editor
Name
Type
Dye Set
Polymer*
Array Length*
Chemistry
Run Module*
Set up
User (enter name )
SPECTRAL
Any5Dye
User (POP4)
User (36cm)
Matrix Standard
Default (enter a name for the run module)
* Depends on the type of polymer and length of capillary used
- Click on OK to leave the Protocol Editor dialog box
- In the Plate Manager of the Data Collection Software, click on New to open the
New Plate Dialog box
Plate Editor for spectral calibration (I)
New Plate Dialog
Name
Application
Plate Type
Owner Name / Operator Name
Set up
e.g. Spectral_BT5_date
Spectral Calibration
96-Well
…
- Click on OK. A new table in the Plate Editor will open automatically
Mentype® Chimera®
January 2013
22
Plate Editor for spectral calibration (II)
Parameter
Sample Name
Priority
Instrument Protocol 1
Set up
Enter name for the matrix samples
e.g. 100
Spectral36_POP4_BT5 (setting described before)
- Click into the column header to select the entire column, select Edit → Fill Down to
apply the information to all selected samples, and click on OK
- In the Run Scheduler click on Find All, select Link to link the reaction plate on the
autosampler to the newly created plate record (position A or B) and start the run
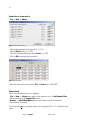
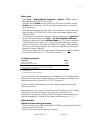
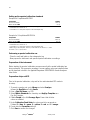
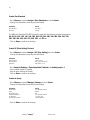
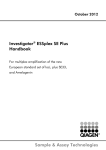
O,
R,
Y,
G,
B
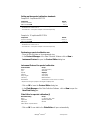
Fig. 4 Electropherogram of spectral calibration with matrix standard BT5 on an ABI 3130
Matrix check
- The quality value (Q value) of each capillary must be greater than 0.95 and the
condition number range (C value) must be between 1 and 20
- Check the matrix samples for a flat baseline. As shown in the figure above, there
should be five peaks with peak heights of about 1000-5000 RFU (Y-axis) in each
matrix sample (optimal range: 2000-4000 RFU)
- If all capillaries have passed the test, the last calibration file for the Dye Set Any5Dye
is activated automatically in the Spectral Viewer. Rename the calibration file (e.g.
BT5_Date of calibration) using the respective button
- If calibration was not successful, try to re-inject the samples with higher injection
voltage or injection time. Editing of the Spectral Run Module will be necessary. You
can re-inject the same samples up to three times. Otherwise use more matrix
standard for spectral calibration
Mentype® Chimera®
January 2013
23
- Check the new matrix with your current samples. There should be no pull-up peaks
between the dye panels (B, G, Y, R, O) with the new matrix
5.2 Sample preparation
Component
Hi-Di™ Formamide
DNA Size Standard 550 (BTO)
prepare 12 µl of the mix (formamide + DNA size standard) for all samples
add 1 µl PCR product (diluted if necessary) or allelic ladder
- Denaturation for 3 min at 95 °C
- Cool down to 4 °C and place samples on the autosampler tray
Volume
12.0 µl
0.5 µl
Since injections take place simultaneously on all capillaries, 4 or 16 samples must be
pipetted on the plate of multi-capillary analyzers. If fewer samples are analysed, the
empty positions must be filled with 12 µl Hi-Di™ Formamide.
To ensure a reliable allelic assignment on multi-capillary analyzers, several ladders
should be run.
Room temperature may influence the performance of PCR products on multi-capillary
instruments, so that shoulder peaks or split peaks occur especially at low
temperatures. Pay attention to keeping ambient conditions as recommended by the
instrument manufacturer. Optimal will be a stable room temperature > 22 °C.
Signal intensities
Options to increase the signal intensity:
- Reduce the volume of the DNA Size Standard 550 (BTO) to peak heights of about 500
relative fluorescent units (RFU)
- Purify the PCR products before starting the analysis
Mentype® Chimera®
January 2013
24
5.3 Setting up the Data Collection Software
Edit the Run Module as follows for the first run:
- In the Module Manager of the Data Collection Software click on New to open the
Run Module Editor dialog box
Run Module 3kV_10s_500bp
Parameter
Oven Temperature [°C]
Poly Fill Volume
Current Stability [µA]
PreRun Voltage [kV]
PreRun Time [s]
Injection Voltage [kV]
Injection Time [s]*
Voltage Number of Steps
Voltage Step Interval
Data Delay Time [s]
Run Voltage [kV]
Run Time [s]**
Set up
Default
Default
Default
Default
Default
3.0
10
Default
Default
Default
Default
1560
* Deviating from the standard settings, the injection time may range between 1 and 20 s depending on the type
of sample. If reference samples with very high signal intensities are recorded, a shorter injection time may be
selected in order to avoid pull-up peaks. For samples with low DNA content or critical patient samples an
injection time of up to 20 s may be necessary.
** Depending on the analysis conditions, the run time for Mentype® Chimera® was modified in order to analyse
fragments with lengths of up to 500 bp.
- Click on Save As, enter the name of the new module (e.g. 3kV_10s_500bp) and confirm
with OK
- Click on Close to exit the Run Module Editor
Starting the run
- Place the prepared 96-well plate on the autosampler tray
- In the Protocol Manager of the Data Collection Software, click on New in the
Instrument Protocol window to open the Protocol Editor dialog box
Instrument Protocol
Protocol Editor
Name
Type
Run Module*
Dye Set
Set up
enter a name
REGULAR
3kV_10s_500bp
Any5Dye
* parameter see above
- Click on OK to exit the Protocol Editor
Mentype® Chimera®
January 2013
25
Prior to each run, it is necessary to create a plate definition as follows:
- In the Plate Manager of the Data Collection Software click on New to open the New
Plate Dialog box
Plate Editor (I)
New Plate Dialog
Name
Application
Plate Type
Owner Name / Operator Name
Set up
e.g. Plate_BT5_Date
Select GeneMapper Application
96-Well
…
- Click on OK. A new table in the Plate Editor will open automatically
Plate Editor (II)
Parameter
Sample Name
Priority
Sample Type
Size Standard
Panel
Analysis Method
Snp Set
User-defined 1-3
Results Group 1
Instrument Protocol 1
Set up
Enter a name for the samples
e.g. 100 (Default)
Sample or allelic ladder
e.g. SST-BTO_60-500bp
e.g. Chimera_Panels_v1
e.g. Analysis_HID_3130
(select results group)
Run36_POP4_BT5_26min (setting described before)
- Click into the column header to select the entire column, select Edit → Fill Down to
apply the information to all selected samples and click on OK
- In the Run Scheduler, click on Find All, select Link to link the reaction plate on the
autosampler to the newly created plate record (position A or B) and start the run
- During the run, view Error Status in the Event Log or examine the quality of the raw
data for each capillary in the Capillaries Viewer or the Cap/Array Viewer
- View data as overview in Run History or Cap/Array Viewer of the Data Collection
Software. Run data are saved in the Run Folder of the previously chosen Result
Group
Mentype® Chimera®
January 2013
26
5.4 Analysis parameter / analysis method
The recommended analysis parameters are:
Peak Detection Algorithm
Ranges
Smoothing and Baselining
Size Calling Method
Peak Detection
Advanced
Analysis: Partial Range
Start Pt: 2000; Stop Pt: 10000
Sizing: All Sizes
Smoothing: Light
Baseline Window: 51 pts
Local Southern Method
Peak Amplitude Thresholds
B:* Y:*
G:* R:*
O:*
Min. Peak Half Width: 2 pts
Polynominal Degree: 3
Peak Window Size: 11 pts**
Slope Thresholds: 0.0
* The peak amplitude threshold (cut-off value) corresponds to the minimum peak height that will be detected by
the GeneMapper® ID/ID-X software. The thresholds are usually 50-200 RFU and should be determined
individually by the laboratory. Recommendation: The minimal peak height should be three times as high as the
background noise of the baseline.
** Point alleles (i.e. alleles with at least 1 bp difference to the next integer allele) may occasionally not be
distinguished. For improved peak detection, minimise the Peak Window Size further.
Mentype® Chimera®
January 2013
27
6. Electrophoresis using the ABI PRISM® 3500/3500xL Genetic Analyzer
For detailed instructions on instrument setup, spectral calibration, or application of the
Applied Biosystems 3500 Series Data Collection Software version 1.0 and the
GeneMapper® ID-X software version 1.2, refer to the Applied Biosystems
3500/3500xL Genetic Analyzers User Guide.
The system with 8 capillaries is named AB 3500 and the system with 24 capillaries is
named AB 3500xL.
The virtual filter set Any5Dye shall be used for the combined application of five
fluorescent labels 6-FAM, BTG, BTY, BTR, and BT0 (the matrix standard will be
called BT5 hereinafter).
Material
Capillary
Polymer
Buffer
36 cm Capillary Array for 3500/3500xL
POP-4® Polymer for 3500/3500xL
10x Genetic Analyzer Buffer with EDTA for 3500/3500xL
6.1 Spectral calibration / matrix generation
Prior to conducting DNA fragment size analysis, it is necessary to perform a spectral
calibration with the fluorescent labels 6-FAM, BTG, BTY, BTR, and BTO for each
analyzer. The calibration procedure creates a matrix that is used to correct the overlap
of fluorescence emission spectra of the dyes.
Spectral calibration comprises the following steps:
- Preparation of spectral calibration standards
- Loading the standards to the multi-well reaction plate (one sample per capillary)
- Preparation of instrument and creating a Dye Set BT5
- Performing a spectral calibration run and checking the matrix
Mentype® Chimera®
January 2013
28
Setting up the spectral calibration standards
Example for 8 capillaries/ABI 3500
Component
Hi-Di™ Formamide
Matrix standard BT5
- Load 12 µl of the mix to a 96-well reaction plate, e.g. position A1-H1
- Denaturation for 3 min at 95 °C
- Cool down to 4 °C and place samples on the autosampler tray
Volume
108.0 µl
9.0 µl
Example for 24 capillaries/ABI 3500xL
Component
Volume
Hi-Di™ Formamide
300.0 µl
25.0 µl
Matrix standard BT5
- Load 12 µl of the mix to a 96-well reaction plate, e.g. position A1-H1, A2-H2 and A3-H3*
- Denaturation for 3 min at 95 °C
- Cool down to 4 °C and place samples on the autosampler tray
* When using a 384-well plate, load 10 µl of the mixtures to columns 1, 3, and 5
in rows A, C, E, G, I, K, M, and O.
Performing a spectral calibration run
- Place the multi-well plate on the autosampler tray
- Now prepare the instrument and specific spectral calibration run settings
Preparation of the instrument
Before starting the spectral calibration process ensure that the spatial calibration has
been performed. This process is necessary if a new capillary array was installed before
and is described in detail in the Applied Biosystems 3500/3500xL Genetic Analyzers
User Guide.
Preparation of dye set BT5
Prior to the spectral calibration, a dye set for the matrix standard BT5 needs to
be setup.
1. To create a new dye set, go to Library and select Analyze,
followed by Dye Sets and click Create.
2. Enter a Dye Set Name, e.g. BT5.
3. Select Matrix Standard as a chemistry and AnyDye Template as a
Dye Set Template.
4. Disable Purple in the field Arrange Dyes. Ensure that all other
colors are enabled.
5. Under Calibration Peak Order the colors need to be arranged as
Follows: 5 – blue, 4 – green, 3 – yellow, 2 – red, and 1 – orange.
6. Do not alter the Parameter settings.
7. Click Save to confirm the changes.
Mentype® Chimera®
January 2013
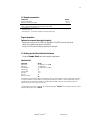
29
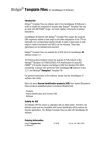
Fig. 5 Setup for dye set BT5
- In the Protocol Manager of the Data Collection Software click on New in
Instrument Protocol to open the Protocol Editor dialog box
Performing a spectral calibration run
Once the multi-well plates containing the spectral calibration mixture is placed
in the autosampler tray the spectral calibration process can be started.
1. To access the Spectral Calibration screen, select Maintenance on
the Dashboard of the 3500 Series Data Collection Software.
2. The number of wells in the spectral calibration plate and their
location in the instrument must be specified.
3. Select Matrix Standard as a chemistry standard and BT5 for dye
set.
4. (Optional) Enable Allow Borrowing.
5. Click Start Run.
Mentype® Chimera®
January 2013
30
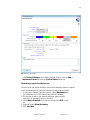
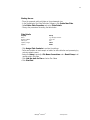
Fig. 6 Electropherogram of spectral calibration with matrix standard BT5 on an ABI 3500
Matrix check
- The quality value (Q value) of each capillary must be greater than 0.8 and the
condition number range (C value) must be between 1 and 20
- Check the matrix samples for a flat baseline. As shown in the figure above, there
should be five peaks with peak heights of about 1000-5000 RFU (Y-axis) in each
matrix sample (optimal range: 2000-4000 RFU)
- A successful calibration will be displayed in green in Overall and for each capillary
- If all capillaries have passed the test, Accept Results
- If calibration failed, Reject Results and refer to spectral calibration
troubleshooting of Applied Biosystems 3500/3500xL Genetic Analyzer User Guides
6.2 Sample preparation
Component
Hi-Di™ Formamide
DNA Size Standard 550 (BTO)
prepare 12 µl of the mix (formamide + DNA size standard) for all samples
add 1 µl PCR product (diluted if necessary) or allelic ladder
- Denaturation for 3 min at 95 °C
- Cool down to 4 °C and place samples on the autosampler tray
Volume
12.0 µl
0.5 µl
Since injections take place simultaneously on all capillaries, 8 or 24 samples must be
pipetted on the plate of multi-capillary analyzers. If fewer samples are analysed empty
positions need to be filled with 12 µl Hi-Di™ Formamide.
To ensure a reliable allelic assignment on multi-capillary analyzers, several ladders
should be run.
Room temperature may influence the performance of PCR products on multi-capillary
instruments, so that shoulder peaks or split peaks occur especially at low
temperatures. Pay attention to keeping ambient conditions as recommended by the
instrument manufacturer. Optimal will be a stable room temperature > 22 °C.
Mentype® Chimera®
January 2013
31
Signal intensities
Options to increase the signal intensity:
- Reduce the volume of the DNA Size Standard 550 (BTO) to peak heights of about 500
relative fluorescent units (RFU)
- Purify the PCR products before starting the analysis
6.3 Setting up a run
For the first run using the Mentype® Chimera® Kit you will need to setup a number of
protocols within the 3500 Series Data Collection Software.
Create Instrument protocol
- Go to Library and select Analyze / Instrument protocol and click Create
- Change the parameters according the table below
Instrument protocol for Mentype® Chimera®
Parameter
Application Type
Capillary Length
Polymer
Dye Set
Run Module
Protocol Name
Oven Temperature [°C]
Run Voltage [kV]
Injection Voltage [kV]
Run Time [s]**
PreRun Time [s]
Injection Time [s]*
Data Delay Time [s]
Advanced Options
Set up
HID / Microsatellite
Default
Default
BT5
Default
e.g. Mentype Chimera
Default
Default
3.0
1560
Default
10
Default
Default
* Deviating from the standard settings, the injection time may range between 1 and 20 s depending on the type
of sample. If reference samples with very high signal intensities are recorded, a shorter injection time may be
selected in order to avoid pull-up peaks. For samples with low DNA content or critical patient samples an
injection time of up to 20 s may be necessary.
** Depending on the analysis conditions, the run time for Mentype® Chimera® was modified in order to analyse
fragments with lengths of up to 500 bp.
- Click on Save to confirm the settings
Mentype® Chimera®
January 2013
32
Create Size Standard
- Go to Library and select Analyze / Size Standards and click Create
- Change the parameters according the table below
Parameter
Size Standard
Dye Color
Set up
BTO_550
Orange
The DNA Size Standard 550 (BTO) should be used with the following lengths of fragments:
60, 80, 90, 100, 120, 140, 160, 180, 200, 220, 240, 250, 260, 280, 300, 320, 340,
360, 380, 400, 425, 450, 475, 500, 525, and 550 bp.
- Click on Save to confirm the settings
Create QC (Size Calling) Protocol
- Go to Library and select Analyze / QC (Size Calling) and click Create
- Change the parameters according the table below
Parameter
Protocol Name
Size Standard
Sizecaller
Set up
enter a name
BTO_550 (from above)
Size Caller v.1.1.0
- Go to Analysis Settings / Peak Amplitude Treshold and disable purple. All
other colours should be enabled
- Keep all other settings as Default
- Click on Save to confirm the settings
Create an Assay
- Go to Library and select Manage / Assays and click Create
- Change the parameters according the table below
Parameter
Assay Name
Color
Application Type
Instrument Protocol
QC Protocols
Genemapper Protocol
Set up
e.g. Mentype Chimera
Default
HID
e.g. Mentype Chimera
e.g. BTO_550
could be defined
- Click on Save to confirm the settings
Mentype® Chimera®
January 2013
33
Starting the run
- Place the prepared multi-well plate on the autosampler tray
- In the Dashboard of the Data Collection Software, click Create New Plate
- Go to Define Plate Properties and select Plate Details
- Change the parameters according the table below
Plate Details
Property
Name
Number of Wells
Plate Type*
Capillary Length
Polymer
Set up
e.g. Mentype Chimera
96 or 384
HID
36cm
POP4
- Click Assign Plate Contents to confirm the settings
- Define well position of each sample or ladder for data collection and processing by
entering sample names
- Assign an Assay (required) a File Name Conventions and a Result Group to all
named wells in the plate
- Click Link the plate for Run and enter Run Name
- Click Start Run
Mentype® Chimera®
January 2013
34
7. Analysis
For general instructions on automatic sample analysis refer to the GeneScan® or
GeneMapper® ID or GeneMapper® ID-X Software User’s Manual.
Note: Within the Mentype® Chimera® the red panel should be faded out.
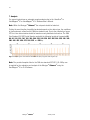
Finding the exact lengths of amplified products depends on the device type, the conditions
of electrophoresis, as well as the DNA size standard used. Due to the complexity of some
STR loci, size-determination should be based on evenly distributed references. The DNA
Size Standard 550 (BTO) shall thus be used with the following lengths of fragments: 60,
80, 90, 100, 120, 140, 160, 180, 200, 220, 240, 250, 260, 280, 300, 320, 340, 360,
380, 400, 425, 450, 475, 500, 525, and 550 bp.
Fig. 7 Electropherogram of the DNA Size Standard 550 (BTO), fragments with lengths in bp
Note: The provided template files for the DNA size standard SST-BTO_60-500bp can
be applied for the evaluation and analysis of the Mentype® Chimera® using the
GeneMapper® ID or ID-X Software.
Mentype® Chimera®
January 2013
35
7.1 Biotype® template files
Allele allocation should be carried out with suitable analysis software, e.g.
GeneMapper® ID/ID-X or Genotyper software in combination with the Mentype®
Chimera® template files from Biotype. Biotype® template files are available on our
homepage (www.biotype.de) for download or as CD-ROM on request.
Recommended Biotype® templates for GeneMapper® ID/ID-X Software are:
Panels
BinSets
Size Standard
Analysis Method
Plot Settings
Table Settings
Chimera_Panels_v1/v1X
Chimera_Bins_v1/v1X
SST-BTO_60-500bp
Analysis_HID_310
Analysis_HID_3130
Analysis_HID_310_50rfu
Analysis_HID_3130_50rfu
PlotsBT5_4dyes
Table for 2 Alleles
Table for 10 Alleles
or higher versions
or higher versions
Panels and BinSets always have to be used, whereas the other template files are
optional.
Additional Biotype® templates for GeneMapper® ID-X Software:
Stutter*
Chimera_Stutter_v1X
or higher version
* When loading the above mentioned panels, the stutter settings will not be accepted. Thus, the stutter data has
to be imported separately.
Recommended Biotype® template files for Genotyper Software are:
Mentype_Chimera_v1
or higher versions
Important Note: Import and allele calling with provided template files is only
guarantied using GeneMapper® ID/ID-X software. If GeneMapper® software is applied
you may experience import problems using some template files. You may have to
adjust Panels and Bins with one ore more runs of the allelic ladder on your specific
instrument setup. Contact us for support (support@biotype,de).
General procedure for the analysis
1. Check the DNA size standard
2. Check the allelic ladder
3. Check the positive control
Mentype® Chimera®
January 2013
36
4. Check the negative control
5. Analyse and interpret the sample data
Mentype® Chimera®
January 2013
37
7.2 Controls
The Control DNA XY5 of the test kit and other commercially available DNA from
standard cell lines represent the following alleles:
Table 3. Allele assignment of Mentype® Chimera®
Locus
Amelogenin
D2S1360
D3S1744
D4S2366
D5S2500
D6S474
D7S1517
D8S1132
D10S2325
D12S391
D18S51
D21S2055
SE33
Control
DNA XY5
X/Y
22/25
17/18
9/12
10/11
15/16
22/27
18/20
13/14
17/19
13/15
25/27
15/21.2
ATCC
K-562
X/X
20/28
18/18
13/13
15/15
14/17
21/24/25
20/24
7/13
23/23
15/16
28/35
26.2/28.2
CCR
9947A
X/X
23/24
17/17
11/13
15/16
13/17
19/25
19/21
9/10
18/20
15/19
19.1/26
19/29.2
CCR
9948
X/Y
22/25
18/18
9/14
11/15
16/16
20/22
20/24
8/14
18/24
15/18
19.1/26
23.2/26.2
CCR
3657
X/Y
22/23
14/17
9/14
11/16
15/16
24/25
17/18
9/14
18/19
12/20
19.1/25
22.2/27.2
For further confirmation, the table above displays alleles of reference DNA
purchased from ATCC (http://atcc.org/Produtcs/PurifiedDNA.cfm#celllines), as well as
three assignments of reference DNA purchased from Coriell Cell Repositories (CCR;
http://locus.umdnj.edu/nigms/) standard of Szibor et al. (2003).
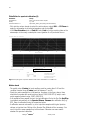
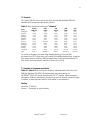
7.3 Lengths of fragments and alleles
Table 4 to table 6 show the fragment lengths of individual alleles that refer to the
DNA Size Standard 550 (BTO). All analyses have been performed on an
ABI PRISM® 310/3130 Genetic Analyzer with POP-4® polymer. Different analysis
instruments, DNA size standards or polymers may result in different fragment lengths.
In addition, a visual alignment with the allelic ladder is recommended.
Scaling
Horizontal: 70-480 bp
Vertical: Depending on signal intensity
Mentype® Chimera®
January 2013
37
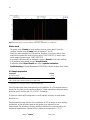
SE33
D10S2325
D5S2500
D8S1132
AM
D7S1517
D3S1744
D12S391
D18S51
D2S1360
D6S474
D21S2055
D4S2366
Figure 8
Fig. 8 Electropherogram of the Mentype® Chimera® using 500 pg Control DNA XY5. Analysis was
performed on an ABI PRISM® 3130 Genetic Analyzer with the DNA Size Standard 550 (BTO). Allele
assignment was performed using the GeneMapper® ID Software and the Mentype® Chimera®
template file.
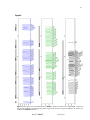
39
Figure 9
Fig. 9 Electropherogram of the allelic ladder Mentype® Chimera®. Analysis was performed on an ABI PRISM® 3130 Genetic
Analyzer with the DNA Size Standard 550 (BTO). Allele assignment was performed using the GeneMapper® ID Software and
the Mentype® Chimera® template file.
Mentype® Chimera®
January 2013
40
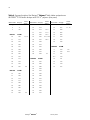
Table 4. Fragment lengths of the Mentype® Chimera® allelic ladder analysed on an
ABI PRISM® 3130 Genetic Analyzer with POP-4® polymer. (blue panel)
Marker/allele Size [bp]*
Further
alleles**
Marker/allele Size [bp]*
Further
alleles**
Marker/allele Size [bp]*
Further
alleles**
Amelogenin
6-FAM
D12S391
6-FAM
D6S474
X
77
15
213
13
354
Y
80
16
217
16.3
14
358
17
221
17.3
15
362
D7S1517
6-FAM
18
226
18.3
16
366
16
108
19
230
19.1, 19.3
17
370
17
112
20
234
20.3
18
374
18
116
21
238
19
378
19
120
22
242
20
124
23
246
D4S2366
6-FAM
21
128
24
250
9
429
9.2
22
132
25
254
10
433
10.2
23
136
26
258
11
437
24
140
25
144
D2S1360
26
148
27
152
28
155
D3S1744
6-FAM
23
297
13
165
24
302
14
169
25
306
15
173
26
310
16
177
27
314
17
182
28
318
18
186
29
322
19
190
30
326
20
194
31
330
21
198
32
334
14, 15
29
22
27
6-FAM
11.2
440
6-FAM
12
441
19
281
13
445
20
285
14
449
21
289
15
454
22
293
Mentype® Chimera®
January 2013
11, 12
41
Table 5. Fragment lengths of the Mentype® Chimera® allelic ladder analysed on an
ABI PRISM® 3130 Genetic Analyzer with POP-4® polymer (green panel)
Marker/allele Size [bp]*
D8S1132
BTG
12.1
117
13.1
121
14.1
125
15
Further
alleles**
Marker/allele Size [bp]*
Further
alleles**
Marker/allele Size [bp]*
Further
alleles**
D18S51
BTG
D21S2055
BTG
8
241
7
16.1
351
9
245
9.2
17.1
355
10
249
18.1
359
128
10.2
251
19.1
363
16
132
11
253
11.2
20.1
367
17
136
12
257
12.2
21.1
371
18
140
13
261
13.2
22.1
375
22
19
144
14
264
14.2
23
378
23.1
20
148
15
268
24
382
21
151
16
272
16.2
25
386
22
155
17
276
26
390
23
159
17.2
278
17.3
27
395
24
163
18
279
28
399
25
167
18.2
281
29
403
26
171
19
283
30
406
27
175
20
287
31
411
21
291
32
415
33
419
12, 13
14.3
D5S2500
BTG
21.2
293
9
188
22
295
10
192
23
299
19.2
23.1
34
423
35
427
11
196
24
302
36
431
12
200
25
306
37
435
13
204
26
310
39
443
14
208
27
314
15
212
28
318
16
216
17
220
18
224
Mentype® Chimera®
29
January 2013
38
42
Table 6. Fragment lengths of the Mentype® Chimera® allelic ladder analysed on an
ABI PRISM® 3130 Genetic Analyzer with POP-4® polymer (yellow panel)
D10S2325
BTY
Further
Marker/allele Size [bp]*
alleles**
SE33
BTY
6
121
6.3
205
4.2, 5.3
25.2
278
7
126
7.3
209
7
26.2
282
26
8
131
8
210
8.2
27.2‡
285
27
9.2
Marker/allele Size [bp]*
Further
Marker/allele Size [bp]*
alleles**
SE33
BTY
Further
alleles**
9
136
9
214
28.2
289
28, 28.3
10
141
10
218
29.2
293
29
11
145
10.2
220
30.2
297
30
12
150
11
222
11.2
31.2
301
31
13
155
12
226
12.2
32
303
14
160
13
230
32.2
305
15
165
13.2
232
13.3
33
307
16
170
14
234
14.2, 14.3
33.2
309
17
175
19
185
18
15
238
34
311
15.2
240
34.2
313
16‡
241
16.2, 16.3
35
315
17
245
17.2, 17.3
35.2
317
18
249
36
318
18.2
251
18.3
36.2
321
19
253
37
322
37.2
19.2
255
38
326
39,42
49
369
50
20
257
20.2
259
20.1
21
261
21.2
263
22.2
267
23.2
270
23
24.2
274
24
25
276
22
* rounded to integer
** The “off-ladder” alleles of Biotype’s DNA pool are allocated with the actual Biotype® template files for GeneMapper® ID or Genotyper
software. For further alleles see amongst others http://www.cstl.nist.gov/biotech/strbase/str_fact.htm
‡
For better orientation, these alleles are heightened within the allelic ladder.
Mentype® Chimera®
January 2013
43
8. Interpretation of results
As mentioned above, post PCR analysis and automatic allele assignment with suitable analysis
software ensure a precise and reliable discrimination of alleles.
An automated calculation of the donor/recipient DNA ratio, as well as standard deviations and
detection limits can be obtained directly from raw data of a fragment size analysis using e.g.
ChimerisTM Monitor Software from Biotype Diagnostic GmbH.
If results that are obtained with Mentype® Chimera® should be harmonized to results from
cytological analyses, make sure that cytological analyses were performed with at least 500
leucocytes.
Pull-up peaks
Pull-up peaks may occur if peak heights are outside the linear detection range, or if an incorrect
matrix was applied. They appear at positions of specific peaks in other color channels, typically
with lower signal intensities.
Stutter peaks
The occurrence of stutter peaks depends on the sequence of the repeat structure and the
number of alleles. N-4 peaks are caused by a loss of a repeat unit during amplification of
tetranucleotide STR motives, caused by slippage effects of the Taq DNA Polymerase.
Interpretation of those peaks should be done in accordance with the template files of the
Genotyper and GeneMapper® ID/ID-X software.
Template-independent addition of nucleotides
Because of its terminal transferase activity, the Multi Taq DNA Polymerase tends to add an
adenosine radical at the 3’-end of the amplified DNA fragments. The artefact peak is one base
shorter than expected (-1 bp peaks). All Biotype® primers are designed to minimise these
artefacts. Artefact formation is further reduced by the final extension step of the PCR protocol at
68°C for 60 min. Peak height of the artefact correlates with the amount of DNA. Laboratories
should define their individual limits for analysis of the peaks.
Artefacts
Room temperature may influence the performance of PCR products on multi-capillary
instruments, shoulder peaks or split peaks occur. Furthermore, automated assignment could be
influenced in some cases. If these effects occur we recommend injecting the sample again at
higher room temperature and maybe using more than one allelic ladder sample per run.
Influence of polymers
The Mentype® Chimera® kit was validated and certified for the analysis on POP-4® polymer..
The use of other polymers (e.g. POP-7™ or POP-6™) might influence the run behaviour of
specific PCR products. Furthermore background noise might increase through different
behaviour of free fluorescent dyes.
Mentype® Chimera®
January 2013
44
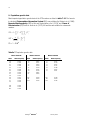
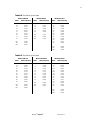
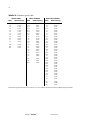
9. Population-genetic data
Most important population-genetic data of the STR markers are listed in table 7-10. The formula
to calculate Polymorphism Information Content (PIC) was published by Botstein et al. (1980),
Expected Heterocygosity (HET) by Nei and Roychoudhury et al. (1974), and, Power of
Discrimination (PD) refers to Jones et al. (1972). All formulas are suitable for autosomale
markers.
n
2
n −1 n
2
PIC = 1− ∑ fi − 2 ∑ ∑ fi f j
i =1
HET =
2
i =1 j =i +1
n K 2
1− ∑ f
n − 1 j =1
PD = 1 – Σi fi2
Tabelle 7. Population-genetic data
Marker D2S1360
Marker D3S1744
Marker D4S2366
Allele
Allele frequency
Allele
Allele frequency
Allele
Allele frequency
19
20
21
22
23
24
25
26
27
28
29
30
31
32
0.007
0.126
0.060
0.309
0.142
0.098
0.086
0.093
0.035
0.023
0.012
0.002
0.005
0.002
13
14
15
16
17
18
19
20
21
0.007
0.104
0.053
0.100
0.319
0.197
0.130
0.067
0.023
9
10
11
12
13
14
15
0.347
0.179
0.074
0.147
0.168
0.074
0.011
PIC
PD
HET
0.790
0.943
0.792
PIC
PD
HET
0.760
0.919
0.795
PIC
PD
HET
0.820
0.955
0.856
Mentype® Chimera®
January 2013
45
Tabelle 8. Population-genetic data
Marker D5S2500
Marker D6S474
Marker D7S1517
Allele
Allele frequency
Allele
Allele frequency
Allele
Allele frequency
9
10
11
12
13
14
15
16
17
18
0.007
0.084
0.313
0.161
0.061
0.042
0.213
0.103
0.009
0.007
13
14
15
16
17
18
0.246
0.212
0.154
0.285
0.097
0.005
PIC
PD
HET
0.740
0.918
0.733
PIC
PD
HET
0.780
0.938
0.804
16
17
18
19
20
21
22
23
24
25
26
27
28
0.007
0.007
0.049
0.120
0.101
0.099
0.082
0.077
0.155
0.230
0.054
0.014
0.005
PIC
PD
HET
0.860
0.967
0.826
Tabelle 9. Population-genetic data
Marker D8S1132
Marker D10S2325
Marker D12S391
Allele
Allele frequency
Allele
Allele frequency
Allele
Allele frequency
16
17
18
19
20
21
22
23
24
25
26
27
0.007
0.095
0.221
0.153
0.128
0.119
0.133
0.077
0.056
0.005
0.005
0.002
6
7
8
9
10
11
12
13
14
15
16
0.002
0.102
0.056
0.121
0.142
0.144
0.193
0.133
0.065
0.037
0.005
PIC
PD
HET
0.850
0.964
0.828
PIC
PD
HET
0.860
0.967
0.851
15
16
17
17.3
18
18.3
19
19.3
20
21
22
23
24
25
26
0.035
0.019
0.107
0.019
0.215
0.007
0.121
0.016
0.117
0.093
0.114
0.072
0.040
0.021
0.002
PIC
PD
HET
0.870
0.971
0.893
Mentype® Chimera®
January 2013
46
Tabelle 10. Population-genetic data
Marker D18S51
Marker D21S2055
Marker SE33 (ACTBP2)
Allele
Allele frequency
Allele
Allele frequency
Allele
Allele frequency
10
12
13
14
15
16
17
18
19
20
21
24
0.005
0.103
0.110
0.157
0.199
0.161
0.112
0.072
0.028
0.030
0.021
0.002
PIC
PD
HET
0.850
0.964
0.902
16.1
17.1
18.1
19.1
20.1
21.1
22.1
23
25
26
27
28
29
30
31
32
33
34
35
36
37
0.056
0.021
0.023
0.274
0.040
0.019
0.005
0.007
0.112
0.116
0.016
0.007
0.030
0.021
0.023
0.026
0.067
0.074
0.053
0.007
0.002
PIC
PD
HET
0.870
0.971
0.856
11
12
13
13.2
14
15
16
17
17.3
18
18.3
19
19.2
20
20.2
21
21.2
22
22.2
23.2
24
24.2
25.2
26.2
27.2
28.2
29.2
30
30.2
31.2
32.2
33
33.2
34
36
0.002
0.014
0.002
0.002
0.026
0.049
0.047
0.070
0.002
0.044
0.002
0.082
0.009
0.044
0.009
0.035
0.019
0.007
0.035
0.023
0.002
0.035
0.044
0.040
0.084
0.084
0.051
0.002
0.061
0.028
0.023
0.009
0.005
0.002
0.002
PIC
PD
HET
0.950
0.990
0.949
All population-genetic data based on an analysis of ca. 210 unlinked Caucasians performed by Biotype Diagnostic GmbH.
Mentype® Chimera®
January 2013
47
10. References
Bär W, Brinkmann B, Budowle B, Carracedo A, Gill P, Lincoln P, Mayr W, Olaisen B
(1997) DNA Recommendations. Further report of the DNA commission of the ISFG regarding the
use of short tandem repeat systems. Int J Legal Med 110:175-176.
Becker D, Vogelsang D, Brabetz W (2007) Population data on the seven short tandem repeat
loci D4S2366, D6S474, D14S608, D19S246, D20S480, D21S226 and D22S689 in a German
population. Int J Legal Med 121:78-81.
Botstein D, White RI, Skolnick M, Davis RW (1980) Construction of a genetic linkage map in
man using restriction fragment length polymorphisms. Am J Hum Genet 32:314–331.
Hering S, Müller E (2001) New allele and mutational events in D12S391 and D8S1132:
sequence data from an eastern German population. Forensic Sci Int 124:187-191.
Jones DA (1972) Blood samples: Probability of Discrimination. J Forensic Sci Soc 12:355-359.
Nei M, Roychoudhury AK (1974) Sampling variances of heterozygosity and genetic distance.
Genetics 76:379–390.
Szibor R, Edelmann J, Hering S, Plate I, Wittig H, Roewer L, Wiegand P, Calì F, Romano
V, Michael M (2003) Cell line DNA typing in forensic genetics – the necessity of reliable
standards. Forensic Sci Int 138: 37-43.
Wiegand P, Lareu M. V., Schürenkamp M (1999) D18S535, D1S1656 and D10S2325:
three efficient short tandem repeats for forensic genetics. Int J Legal Med 112:360-363.
Wiegand P, Klintschar M (2002) Population genetic data, comparison of the repeat structure
and mutation events of two short STRs. Int J Legal Med 116:258-261.
Mentype® Chimera®
January 2013
48
11. Explanation of Symbols
Manufacturer
Date of manufacture
Batch code
<N>
Contains sufficient reagents for
<N> tests
Consult instructions (handbook)
for use
Use by
Temperature limitations
Catalogue number
In-Vitro-Diagnostics
Mentype® Chimera®
January 2013
49
Notes
Mentype® Chimera®
January 2013
50
Notes
Mentype® Chimera®
January 2013