1
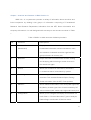
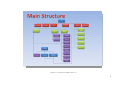
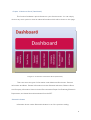
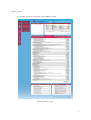
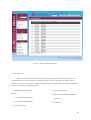
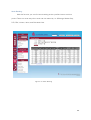
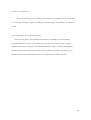
User Manual for BSIS Version 2.1
1 Chapter 1 Overview and Structure of BSIS Version 2.1
BSIS V.2.1 is a system that provides a variety of information about securities and
listed companies by dividing it into groups of information comprising of Fundamental
Research from Research Department, Information from the SET, Sector Information and
Company Information. It is well designed with and easy-to-use structure as shown in Table
1
Table 1: BSIS V 2.1 Main structure divided by functions
No.
1.
Functions
Monitored Stock
(Dashboard)
2.
Briefcase
3.
Search
4.
Knowledge
5.
Statistics
6.
Configuration
Descriptions
Displays summarized information, balance sheet,
fundamental information, technical indicators, news,
and research of selected securities organized into
groups of menus for an easy use.
Keeps securities in favorite folders for later viewing
and analyzing without having to search for them in
the search box again.
Allows you to search for securities by 2 functions,
i.e. advanced search, and search by symbol.
Collectively provides useful information about
securities. This includes Research Paper, Earning
Guide, Information from the SET, Event updates.
Shows statistical information such as Buy/Sell signal, Net
Buy/Sell by investor types, lists of stocks ranked by P/E
value; dividend yield; market cap; highest & lowest price.
Allows you to configure the display of information in 4
main fields i.e. Focused Securities, Types of Analysis,
Default Page, and Number of Records shown.
2 BSIS 2.1 structure is organized into function menus. When you click on the security symbol
designated by an underline, it will redirect you to the company information page. However, in the
Monitored Stock menu, there are individual information tabs for Selected Indicators, Balance Sheet,
and Company Information. In other words, by clicking on the security symbol in the Monitored Stock
page, it will not redirect you to the company information page.
3 Diagram 1: Architecture of BSIS version 2.1
4 Chapter 2 Monitored Stock (Dashboard)
This function facilitates a quick reference to your favorite stocks. You can simply
click on any stock symbol to view its related information which will be shown on this page.
Diagram 2: Architecture of Monitored Stock (Dashboard)
There are two main types of information under Monitored Stock menu: General
Information and News. General Information includes Selected Indicators, Balance Sheet,
and Company Information. News includes Recommended Paper from Bualuang Research
Department, and Latest News disseminated from the SET.
Selected Indicators
Information shown under Selected Indicators is as of the previous trading
5 day which includes the followings:
1. Price Information: Displays price information of selected stocks e.g.
Open, High, Low, Close, Price Change, and Percentage Price Change.
2. Bid/Offer: Displays Last Bid and Last Offer prices as well as volume and value.
3. Highest/Lowest (1 Year): Displays stock’s highest and lowest prices
within 1 year and its pertaining dates.
4. Fundamental Ratios: Includes P/E, P/BV, EPS, Market Cap, and Dividend Yield.
5. Buy/Sell Signal: Buy/Sell signals are marked when technical indicators criteria are met.
These indicators include MACD, RSI, DI/14, STO, and MA(s).
Figure 2-1: Selected Indicators
6 Balance Sheet
This section shows the company’s latest Balance Sheet.
Figure 2-2: Balance Sheet
7 Company Information
This section shows company’s summarized information of the selected stock as shown
in the table below.
Figure 2-3: Company Information
8 No.
Group
Stock Information
Share
Profit
Shareholders
Sub-group
Description
Stock Symbol
Stock Price
Sector
Market
Highest
Lowest
Average
Volatility
Foreign Holding
Available Share
Queue Share
Par Change
Operating Period
Profits
Earning Per Share
4QMAEPS
Par Value
Book Value
Registered Share
Common + Preferred Share
Names of shareholder
Percentage of share
Rights
Dividend
Valuations
9 Recommended Paper and Latest News
This part provides recommended research and news about the selected stock. You can
click on each headline marked by an underline and its information will pop up in a new window in
a PDF or Microsoft Office format.
Figure 2-4: Recommended Paper
Figure 2-5: Latest News
10 To Add/Remove STOCK TODAY
Click on the EDIT button on the Stock Today section shown in figure 2-6.
Figure 2-6: Lists of Monitored Stocks (Stock Today)
After clicking on the EDIT button, there will be a popup window for you to enter your
favorite stocks for monitor. You can enter as many as twenty-four stock symbols. When you
finish, click the SAVE button, the stock symbols you have entered will show in the Stock Today
section.
Figure 2-7: Lists of Monitored Stocks (Stock Today)
11 Measurement Configuration
Measurement Configuration function allows you to give conditions to monitored
stocks by setting value ranges and their corresponding colors. Whenever the conditions are
met, colors specified earlier will be displayed next to the stock symbols in the Stock Today
section. You can do this setting by clicking on the
button as shown in figure 2-6, then a
popup window for configuration will appear (see figure 2-8).
Figure 2-8: Gauge Color Configuration
12 Chapter 3 Briefcase
For a quick viewing, you can create your favorite portfolios as well as assign stocks
to each of them.
To View Data
To view data, simply click on the portfolio name. All stocks saved for selected portfolio
will be displayed. You can also remove stock lists by checking the box in front of each stock
symbol, and click REMOVE button.
Figure 3-1: Briefcase
13 To Create a Portfolio
To create a briefcase, you can type a portfolio name in the specified box and then click
ADD PORTFOLIO. Your portfolio folder will be shown on the Portfolio List panel.
Figure 3-2: Add Portfolio
To Assign Stocks
To assign stocks to the folder(portfolio), click the add
button next to the portfolio
name. A popup window for symbol adding will appear. You can either select a stock from the
drop-down list or manually type a stock symbol in the second box, then click SAVE button.
Figure 3-3: Add Symbol
14 Stock Comparison
Stocks in each folder can be compared by various indicators i.e. Market indicators,
Fundamental measures, Technical indicators, Earning Guide, and Valuation. You can select
stocks that you want to compare by checking the box in front of the stock symbol, then click
COMPARE button. After that you can select an indicator from the drop-down list as well as
specify date for comparison.
Figure 3-4: Portfolio-Comparison
15 Graph
Three types of graph can also be viewed under Briefcase section.
1. Multiple stock graph comparison
2. P/E movement of selected stock
3. Single stock graph
Multiple Stock Graph Comparison
This function allows you to compare up to 5 stocks in one time by checking the box in
front of each stock symbol then clicking VIEW GRAPH. Each graph shows a movement of price
change in percentage. Different graphs are given different colors representing different stocks.
You can hide, show, or remove selected graph from the screen and also can add a new stock by
typing a stock symbol in the search box. After clicking SEARCH button, the program will show
the graph of the stock that you have entered.
Figure 3-5: Multiple Stock Graph Comparison
16 P/E Graph
P/E graph shows the selected stock’s P/E movement over time. In the P/E graph window,
you can type in a stock symbol in the search box and click SEARCH. The program will
automatically display the new P/E graph.
Figure 3-6: P/E graph (Symbol BBL)
Detailed Technical Analysis Graph
This function allows you to view the detailed technical analysis graph by simply checking
the box in front of the stock symbol and clicking
GRAPH button from Briefcase(Figure 3-1) or
Portfolio-Comparison(Figure 3-4), There are 5 indicators i.e. Simple Moving Average (SMA25, 75,
200) (shown with price movement in a bar chart format), DI14, Slow Stochastic (STO), MACD,
and RSI. You can opt to hide or show any of the 5 indicators by clicking once on the indicator
name, a red strikethrough line will appear on the selected indicator, and its graph will disappear.
Clicking again on that selected name, the red strikethrough line will disappear, and the graph of
the selected indicator will show again.
When you are working on the technical graph screen, you can change stock for a new
technical analysis by simply entering a stock symbol in the box provided in front of SEARCH
button. Then click SEARCH. The corresponding detailed graph will appear.
17 Figure 3-7: Detailed Technical Analysis Graph (Symbol BBL)
18 Chapter 4 Search
Stock search comprises of two functions i.e. advanced search and search by symbol.
Advanced Search
Advanced search allows you to select types of information such as fundamental or
technical and its corresponding indicators (index) and other conditional criteria. You can also
specify Sector, Date of Data. These criteria can be saved for later reference by clicking SAVE
SEARCH button then a popup window will ask you to create a file name.
After completing all criteria, click SEARCH button for results. In the result page you can also
check the box in front of each stock symbol and then add it to your Briefcase, Stock Today
(displayed in Monitored Stock section), or click COMPARE button to compare stock information or
click VIEW GRAPH to compare multiple stock graph.
19 Figure 4-1: Search-Advanced Sear
20 Search by Symbol
For known stocks, you can manually enter stock symbols in the provided boxes.
Figure 4-2: Search--Search By Symbol
21 Chapter 5 Knowledge Base
Knowledge Base provides a variety of information comprised of 5 features
which includes Main page showing recommended research on individual stocks,
Research Paper on general aspects, Earning Guide, Information from the SET, and
Event updates. Each feature is comprised of components as shown below.
1. Main
4.3. Broker Ranking
2. Research Paper
4.4. Stock Ranking
2.1.
Economics/Market
5. Event
5.1. Calendar
2.2. Sector
5.2. Dividend
2.3. Fundamental
5.3. Exercise
2.4. Technical
5.4. New Capital
2.5. IPO
5.5. New Securities
3. Earning Guide
5.6. Sign Posting
4. SET
5.7. Subscription
4.1. Sector News
5.8. Subscription Right
4.2. Overview
22 Diagram 3: Architecture of Knowledge Base
23 Main Page of Knowledge Base
Main page of Knowledge Base includes:
1. Recommended Research: Provides stock research that is in focus for the period.
2. Top 5 Research: Shows the top 5 research papers that are most viewed in the latest
week.
3. Weekly Research: Shows all research papers that have been published in the latest
week.
4. Selected Research Paper : Shows research papers that match with your monitored
stocks.
Clicking on the topic headline, the system will automatically display information in
a PDF format in a new popup window. For other file formats, after you click the
headline, a dialogue box will appear for you to choose the type of file you want to
open.
24 Figure 5-1: Main Page
25 Figure 5-2: Popup research in PDF format
Economic/Market Research
Economic and Market research provides information of a wider aspect that could
affect business operations in certain ways. The significant effects of the economic
factors on the stock issuing companies depend on their business environment and
operations. Market research provides insightful forecast of the market direction.
26 Figure 5-3: Economic/Market Research
Sector Research
Sector research, also known as Industry Research, gives you information on the
external factors or forces certain businesses are facing. This will help you make a good
decision about your investment. Sector research can be categorized according to business
sectors the issuing companies are in.
1. Agricultural and Industrial
Groups
1.1. Agricultural Business
1.2. Food and Beverages
2.1. Home Appliances
2.2. Personal Utensils and Medical
Supplies
2.3. Fashion
2. Consumer Goods
27 3. Financial Business
3.1. Banking
3.2. Capital and Assets
3.3. Insurance and Life
Insurance
4. Materials and Industrial
Products
4.1. Petroleum and Chemicals
4.2. Equipments and Machines
4.3. Packaging Materials
4.4. Paper and Printing
Inventory
4.5. Motor Vehicles
5. Property and Construction
5.1. Constructing Inventory
6.1. Energies
6.2. Mines
7. Service
7.1. Commerce
7.2. Entertainment
7.3. Medical Doctor
7.4. Hotels and Travelling
7.5. Printing and Printed Matters
7.6. Specific Business
7.7. Transportation and Logistics
8. Technology
8.1. Communication
8.2. Electronics and Computers
8.3. Electronic Parts
5.2. Property Development
6. Resources
28 29 Figure 5-4: Sector Research
Fundamental Research
This part provides you analysis on a single stock, also called Company Research. Many
company research papers are released everyday from Bualuang Research Department.
30 Figure 5-5: Fundamental Research
Technical Analysis
Technical analysis in this section gives you investment recommendation on individual
stocks, based on technical indicators that are signaling
31 Figure 5-6: Technical Analysis
32 IPO Research
IPO research provides you information about new securities that are entering the
stock market. In other words, it is analysis about securities that are about to be initially
traded on the SET or MAI.
Figure 5-7: IPO Research
33 Valuation
The valuation information provides you investment recommendations on stocks
covered by Bualuang analysts. The information includes target price, recommendation, expected
earning per share, expected P/E ratios, etc.
Figure 5-8: VALUATION
34 Earning Guide
Earning Guide is different from Valuation in that there are no recommendation and
target prices given. Here provides forecast on revenues and earnings of stocks under
analysts’ cover.
Figure 5-9: Earning Guide
35 CONSENSUS
Consensus information is pulled from the security research consortium. This part
gives you average valuation forecasts of P/E ratios, Dividend Yields, and Target Prices of
traded stocks.
Figure 5-10: CONSENSUS
SET
Information in this section is released by the SET. This includes Sector News,
Overview,
Broker
Ranking,
and
Stock
Ranking.
36 Sector News
This section provides stock news submitted by the SET. You can choose the
sector as well as define time period for the news that you want. After clicking GO
button, the system will show news on stocks under selected sector.
Figure 5-11: Sector News
37 Overview
This part shows market overview for the specified period. You can choose between
two markets that are SET and MAI. Information shown includes historical high and low of
the index, volume/value per day, deals, market P/E, market P/BV, Dividend Yield, Market
Cap.
Figure 5-12: Overview
38 Broker Ranking
Broker Ranking will show results according to the criteria selected. Three criteria are
available to select. First is the trading markets, between the SET and the MAI. Second is how
brokers are ranked, among by Value, by Volume and by deals. Third is the period for certain
ranking. The results will show ranking starting from the broker with the highest value or volume
previously preset.
Figure 5-13: Broker Ranking
39 Stock Ranking
With this function you can find stock ranking under specified sector and time
period. There are seven ways the results can be ranked by i.e. %Change, Market Cap,
P/E, P/BV, Volume, Value, and Dividend Yield.
Figure 5-14: Stock Ranking
40 Event
Event section shows information on upcoming activities related to rights exercising,
dividend announcement, new capital raising, and new securities issuing.
Calendar
The event updates will be shown on the calendar so that it is easy to view. You
can select the sector, type of events (X-Date, Payment Date, Trade Date, Sign Posting Date),
and period for the results you need.
Stock symbols are shown in the calendar with the events in abbreviation. You can
click on any event marked by an underline to view its detailed information.
41 Figure 5-15: Calendar
42 Dividend
The results for dividend related events can be chosen according to X-Date, Payment
Date, and period of interest.
Figure 5-16: Dividend
43 Exercise
This part shows a list of warrants that can be exercised during specified period. You
can select the type of event dates i.e. Exercise Date, Trade Date, and X-Date before defining
the period.
The results will show Symbol, selected event dates e.g., Exercise Period, Exercise
Price, Exercise Ratio, Number of Warrants to be exercised, and Newly Issued Common
Shares.
Figure 5-17: Exercise
44 New Capital
This section shows a list of securities that their issuing companies raised new
capital. Results can be ranked by Symbol, Payment Date, Trade Date. Time period can
be specified.
Figure 5-18: New Capital
45 New Securities
This section allows you to find securities that have newly entered the market (SET and
MAI). The types of new securities available for choosing include Common Stocks, Warrants,
Unit Trusts, Debentures, and Convertible Debentures. Results shown can be either sorted by
Trade Date, or Subscription Date. Period of interest can be defined.
The results will show Securities symbols, Trade Date, Subscription Date, IPO Price,
First Closing Price, and Latest Closing Price.
Figure 5-19 Knowledge Base/ New Securities
46 Sign Posting
You can select the sign posting that you want from the drop-down list which
includes Suspension (SP), Notice Pending (NP), Designated (D), and Halt (H). Period for
the focused results can be defined.
The results will display Securities symbol, Sign, Posted Date, Lifted Date, Price
before Posted Date, Price on Posted Date, and Price on Lifted Date.
Figure 5-20: Sign Posting
47 Subscription
Subscription will display securities with new capital by period. User can
arrange displayed information by securities, subscription date, or trade date, and
the types of securities can also be defined.
The information will display on securities, subscription ratio (holding:new),
subscription price, allotted shares, issued shares, trade date, first and latest closing
price.
Figure 5-21: Subscription
48 Subscription Rights
It will display on subscription rights and user can view by period of X-Date and Board
Date.
Figure 5-22: Subscription Rights
49 Chapter 6 Statistics
This section provides statistical records of securities based on fundamental measures
and technical indicators.
Diagram 4: Architecture of Statistic (Statistic)
Buy/Sell Signal
This section provides stock recommendations based on technical indicators that mark
the Buy or Sell signals. Results run alphabetically from A-Z. Some results may have technical
research papers related to the recommended stocks. There are five technical indicators in the
50 results as shown below:
1. Simple Moving Average: Shows a buy signal when SMA 5-day is higher than SMA 10day backwards and shows a sell signal when SMA 10-day is higher than the SMA 5day.
2. MACD: Shows a buy signal when MACD line crosses Average line higher. MACD shows
a sell signal when MACD crosses Average line lower.
3. DI/14: Shows a buy signal when plus graph crosses minus graph higher and if the line is
lower, it will show a sell signal.
4. RSI: Shows a buy signal when RSI line crosses Average line higher. It shows a sell
signal when RSI crosses Average lower.
5. STO: Shows a buy signal when STO crosses Average higher. It shows a sell signal when
STO crosses Average lower.
51 Figure 6-1: Buy/Sell Signal
Net Buy/Sell
Under this menu, you can find the following information: Net Buy/Sell by Investor Type,
Turnover records, Trading Stat, and NVDR, TTF, Short Sell.
52 Net Buy/Sell by Type
This section provides you daily records of Net Buy/Sell by investor type. You can
select the market between SET and MAI. Also, there are two views to choose i.e.
Percentage view, and Net Value view.
Figure 6-2: Net Buy/Sell by Type
53 Turnover
This section shows records of daily trading value. Results can be segregated by
market, trading board, and by security type.
Figure 6-3: Turnover
54 Trading Stat
This section shows statistic records of selected sector. You can choose the type of
results to be displayed between sector index and sector fundamental measures (P/E,
P/BV, Div. Yield, Market Cap).
Figure 6-4: Trading Stat
55 NVDR/TTF/Short Sell
This section shows records of NVDR, TTF and Short Sell activities. Data include number of
securities, companies, trading volume and value of both markets (SET and MAI).
Figure 6-5: NVDR
56 Figure 6-6: TTF
57 Figure 6-7: Short Sell
There are four types of graph in the Short Sell result page: Graph Total, Graph Net, Total
Quarter, and Net Quarter.
58 Figure 6-8: Graph of Total Buy/Sell
Figure 6-9: Graph of Net Buy/Sell
59 Figure 6-10: Graph of Total Buy/Sell by Quarter
Figure 6-11: Graph of Net Buy/Sell by Quarter
60 SET INDEX
This section shows statistical index records of the four trading boards which
are SET, SET50, SET100, and MAI. When the index closes higher compared to that of
the previous day, the displayed number will be in green. On the other hand, when the
index closes lower compared to that of the previous day, the number displayed will
be in red.
61 SET
Figure 6-12: SET INDEX
62 Figure 6-13: SET50 INDEX
Figure 6-14: SET100 INDEX
63 Figure 6-15: MAI INDEX
Warrants
This section gives you information on the warrants that are traded in the market.
The results include a list of warrants, running alphabetically from A to Z, Exercise Price, Warrant
Date of Expire, Intrinsic Value, Gearing Value, Warrant Graph.
64 Figure 6-16: Warrants
Lowest P/E
In this section you will find a list of thirty securities with lowest P/E values. Please note
that results are as of the previous trading day and do not include zero P/E value.
65 Figure 6-17: Securities with Lowest P/E
Highest EPS
This section shows a list of thirty securities with highest earning per share (EPS).
Results are as of the previous trading.
66 Figure 6-18: Securities with Highest EPS
Highest Dividend Yield
This section shows a list of thirty securities with highest dividend yield. Results are as of
the previous trading.
67 Figure 6-19: Securities with Highest Dividend Yield
Highest Market Cap
This section shows a list of thirty securities with highest Market Capitalization (Market
Cap). Results are as of the previous trading.
68 Figure 6-20: Securities with Highest Market Cap
P/BV > Close
This section shows a list of thirty securities ranked from the stock with the highest value
of the difference between its P/BV and Close Price. Results are as of the previous trading day.
69 Figure 6-21: Securities with P/BV > CLOSE
70 Highest & Lowest Price
Highest Price
Figure 6-22: Securities with Highest Price (by period)
71 Figure 6-23: Securities with Highest Price (by date period)
72 Lowest Price
Figure 6-24: Securities with Lowest Price (by period)
73 Figure 6-25: Securities with Lowest Price (by date period)
74 Chapter 7 Company Info
The Company Info function lets you find information of your interested stock by
entering a stock symbol in the box provided. The results of your search are divided into three
information categories i.e. Company Information, Financial Information, and Other
Information.
Diagram 5: Architecture of Company Info
75 Company Information
This section is comprised of information about Director, Shareholding, Profile,
Summarize. You can click on one of the four links to view the information of the stock you
are interested in.
Director
In this part, it shows a list of people who are in the board of director in the
company of your selected stock. The results also allow you to view each director’s
positions in other companies.
76 Figure 7-1: Director
77 7-2: Position in other companies
Shareholding
This section shows a list of major shareholders in ranking, running from the one
with the highest shareholding proportion.
78 Figure 7-3: Shareholding
Profile
Information shown in the Profile section is comprised of general information about
the company such as address, phone, website address, its capital, auditor, its trading
market, number of listed shares, Par value, etc
79 Figure 7-4: Profile
80 Selected Indicators
Figure 7-5: Selected Indicators
81 Balance Sheet
Figure 7-6: Balance Sheet
82 Summarize
It will display company’s summarized information which is divided into 3 parts
comprising of company information, balance sheet, and selected indicators. The data will
show name, number of shares, shareholders, profits, rights, dividend and valuation.
Figure 7-7: Company Information
83 Financial Statement
This section shows balance sheet reports of the last 5 years for you selected stock.
You can choose the period you want to view from quarter to year.
Figure 7-8: Financial Statement
84 Right & Benefits
This section provides you records of rights and benefits of your selected
stock/company. It allows you to select many rights e.g. XD, XM, XR, etc.
Figure 7-9: Right & Benefits
Capital Movement
This section shows details of authorized capital for the selected company with the
information as shown in the table below.
85 Figure 7-10: Capital Movement
Investment
This section provides you information on the company’s investment in other
businesses. The results give you the names of the invested companies, their business type,
paid-up capital, and investment ratio.
86 Figure 7-11: Investment
87 Sign History
This section allows you to search for stocks with sign posting history. There are 4 signs
for you to select: Suspension, Notice Pending, Designated, and Halt.
Figure 7-12: Sign History
88 Company News
This section will show all news related to your selected stock under the specified time
period.
Figure 7-13 Company Information/ Company News
89 Trading Data
This section shows records of trading data e.g. open price, close price, percentage
price, etc. However, you can select between trading data records and statistical values of
your selected stock for the results.
Figure 7-14: Trading Data
90 Chapter 8 Configuration
This function allows you to configure the display of information in four main fields
i.e. Focused Securities, Types of Analysis, Default Page, and Number of Records
shown.
The Configuration of Focused Securities
There are two parts in this setting that will affect your display of the information.
First part deals with sectors of securities which will show information of the securities
related to the selected sectors in the Selected Research Page; in the Knowledge Base
function. Second part allows you to select which technical indicators you want on your
Detailed Technical Analysis Graph when you use Briefcase or Search function.
91 Information that you are interested in
Two types of analysis are available for you to choose: Fundamental Analysis and
Technical Analysis. The setting will affect the Recommended Paper displayed in Monitored
Stock.
92 Default Page
This setting allows you set your favorite welcome screen, which is likely your frequently
browsed screen. There are six pages to select for your default page:
1. Monitored
Stock
4. Knowledge
2. Portfolio
6. Market Status
5. Search
3. Earning Guide
Display Preferences
This allows you to set the number of records shown for the search results. You can choose
from 5, 10, 15, 20, to 25 records. However, larger number of records will consume more
processing time. It is advisable that you choose the number that most suits to your internet
speed.
93 The setting will affect results of the followings:
1. Number of shares displayed in one page
2. Number of search results
3. Number of news’s topic and/or research paper
94 Figure 8 Configuration
95