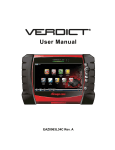
Download VERDICT User Manual - Snap-on

Transcript
User Manual
October 2010
EAZ0063L05B Rev. A
Trademarks
Snap-on, ShopStream, ShopStream Connect, and VERDICT are trademarks of Snap-on Incorporated, registered in
the United States and other countries.
All other marks are trademarks or registered trademarks of their respective holders.
Copyright Information
©2010 Snap-on Incorporated. All rights reserved.
Disclaimer of Warranties and Limitation of Liabilities
The information, specifications and illustrations in this manual are based on the latest information available at the
time of printing. While the authors have taken due care in the preparation of this manual, nothing contained herein:
• Modifies or alters in any way the standard terms and conditions of the purchase, lease, or rental agreement
under the terms of which the equipment to which this manual relates was acquired.
• Increases in any way the liability to the customer or to third parties.
Snap-on reserves the right to make changes at any time without notice.
IMPORTANT:
Before operating or maintaining this unit, please read this manual carefully paying extra attention to the safety
warnings and precautions.
Visit our websites at:
http://diagnostics.snapon.com (North America)
snapondiag.com (United Kingdom)
sun-diagnostics.com (United Kingdom)
For Technical Assistance Call
1-800-424-7226 (North America)
CALL +44 (0) 845 601 4736 (United Kingdom)
E-mail [email protected] (United Kingdom)
For technical assistance in all other markets, contact your selling agent.
ii
Safety Information
For your own safety and the safety of others, and to prevent damage to the equipment and
vehicles upon which it is used, it is important that the accompanying Important Safety Instructions
be read and understood by all persons operating, or coming into contact with, the equipment. We
suggest you store a copy near the unit in sight of the operator.
This product is intended for use by properly trained and skilled professional automotive
technicians. The safety messages presented throughout this manual are reminders to the
operator to exercise extreme care when using this test instrument.
There are many variations in procedures, techniques, tools, and parts for servicing vehicles, as
well as in the skill of the individual doing the work. Because of the vast number of test applications
and variations in the products that can be tested with this instrument, we cannot possibly
anticipate or provide advice or safety messages to cover every situation. It is the automotive
technician’s responsibility to be knowledgeable of the system being tested. It is essential to use
proper service methods and test procedures. It is important to perform tests in an appropriate and
acceptable manner that does not endanger your safety, the safety of others in the work area, the
equipment being used, or the vehicle being tested.
It is assumed that the operator has a thorough understanding of vehicle systems before using this
product. Understanding of these system principles and operating theories is necessary for
competent, safe and accurate use of this instrument.
Before using the equipment, always refer to and follow the safety messages and applicable test
procedures provided by the manufacturer of the vehicle or equipment being tested. Use the
equipment only as described in this manual.
Read, understand and follow all safety messages and instructions in this manual, the
accompanying safety manual, and on the test equipment.
Safety Message Conventions
Safety messages are provided to help prevent personal injury and equipment damage. All safety
messages are introduced by a signal word indicating the hazard level.
'$1*( 5
Indicates an imminently hazardous situation which, if not avoided, will result in death or serious
injury to the operator or to bystanders.
:$51 ,1*
Indicates a potentially hazardous situation which, if not avoided, could result in death or serious
injury to the operator or to bystanders.
&$87,21
Indicates a potentially hazardous situation which, if not avoided, may result in moderate or minor
injury to the operator or to bystanders.
iii
Safety Information
Important Safety Instructions
Safety messages contain three different type styles.
• Normal type states the hazard.
• Bold type states how to avoid the hazard.
• Italic type states the possible consequences of not avoiding the hazard.
An icon, when present, gives a graphical description of the potential hazard.
Example:
:$51 ,1*
Risk of unexpected vehicle movement.
• Block drive wheels before performing a test with engine running.
A moving vehicle can cause injury.
Important Safety Instructions
For a complete list of safety messages, refer to the accompanying safety manual.
SAVE THESE INSTRUCTIONS
iv
Contents
Safety Information ..................................................................................................................... iii
Contents ...................................................................................................................................... v
Chapter 1: Using This Manual ................................................................................................... 1
Conventions.................................................................................................................................. 1
Bold Text ................................................................................................................................ 1
Symbols ................................................................................................................................. 1
Terminology ........................................................................................................................... 2
Notes and Important Messages ............................................................................................. 2
Procedures............................................................................................................................. 2
Chapter 2: Introduction.............................................................................................................. 3
D7 Display Device ........................................................................................................................ 3
Functional Description ........................................................................................................... 3
Technical Specifications ........................................................................................................ 5
Power Sources....................................................................................................................... 6
S3 Scanner Module ...................................................................................................................... 7
Functional description ............................................................................................................ 7
Technical Specifications ........................................................................................................ 8
Power Sources....................................................................................................................... 8
M2 Data Acquisition Device.......................................................................................................... 9
Functional Description ........................................................................................................... 9
Technical Specifications ...................................................................................................... 10
Power Sources..................................................................................................................... 10
Chapter 3: Getting Started....................................................................................................... 11
Powering Up ............................................................................................................................... 11
Module Buttons .................................................................................................................... 12
VERDICT Toolbar ................................................................................................................ 13
Windows Toolbar ................................................................................................................. 17
Powering Down .......................................................................................................................... 17
Emergency Shutdown .......................................................................................................... 17
Chapter 4: Navigation .............................................................................................................. 18
D7 Display Device Controls, and Features................................................................................. 18
Control Buttons .................................................................................................................... 18
LEDs .................................................................................................................................... 19
The Stand ........................................................................................................................... 19
M2 Data Acquisition Device Controls and Features ................................................................... 19
Rotary Selector Switch......................................................................................................... 19
Soft Keys.............................................................................................................................. 21
Chapter 5: S3 Scanner Operations ......................................................................................... 22
Getting Started ........................................................................................................................... 22
The Demonstration Program................................................................................................ 22
v
Contents
Disconnecting the VERDICT Unit From a Vehicle ............................................................... 23
Vehicle Identification................................................................................................................... 24
Alternative Vehicle Identification .......................................................................................... 26
Connecting to a Vehicle.............................................................................................................. 27
Cables .................................................................................................................................. 27
No Communication Message ............................................................................................... 28
Navigation................................................................................................................................... 28
Scanner Screen Layout ....................................................................................................... 28
Screen Messages ................................................................................................................ 31
Making Selections ................................................................................................................ 31
Operations .................................................................................................................................. 32
Data Display......................................................................................................................... 33
Codes Menu......................................................................................................................... 37
Functional Tests................................................................................................................... 40
Generic Functions ................................................................................................................ 41
Troubleshooter ..................................................................................................................... 42
Scanner Toolbar Operations ................................................................................................ 43
Exiting the Scanner .................................................................................................................... 47
Downloading Firmware............................................................................................................... 47
Chapter 6: OBD Direct Operations.......................................................................................... 50
OBD Health Check ..................................................................................................................... 50
Global OBD II Code Check .................................................................................................. 51
Global OBD II Clear Codes .................................................................................................. 52
Readiness Monitors ............................................................................................................. 52
Connector Information ......................................................................................................... 52
OBD Diagnose............................................................................................................................ 53
Start Communication ........................................................................................................... 53
Select Communication Protocol ........................................................................................... 57
Connector Information ......................................................................................................... 57
Chapter 7: Component Test Operations ................................................................................ 58
Vehicle Identification................................................................................................................... 58
Creating a Favorites List ...................................................................................................... 58
Identifying a Test Vehicle ..................................................................................................... 60
Operations .................................................................................................................................. 62
Component Information ....................................................................................................... 62
Tests .................................................................................................................................... 63
Chapter 8: M2 Data Acquisition Device.................................................................................. 67
Controls, and Features ............................................................................................................... 67
Rotary Selector Switch......................................................................................................... 67
Soft Keys.............................................................................................................................. 68
Digital Multimeter Operations ..................................................................................................... 69
Volts DC ............................................................................................................................... 69
Volts AC ............................................................................................................................... 74
Resistance ........................................................................................................................... 75
Continuity and Diode Check ................................................................................................ 76
Auxiliary ............................................................................................................................... 77
Capacitance ......................................................................................................................... 78
vi
Contents
Oscilloscope......................................................................................................................... 79
Remote Functions ................................................................................................................ 86
Updating the Software ................................................................................................................ 87
Creating a Software Backup ................................................................................................ 88
Chapter 9: Scope Multimeter Operations............................................................................... 89
Getting Started ........................................................................................................................... 90
Capabilities .......................................................................................................................... 90
Leads and Adapters ............................................................................................................. 91
Screen Layout ...................................................................................................................... 93
Making Selections ................................................................................................................ 96
Operations .................................................................................................................................. 97
Starting the Scope and Multimeter....................................................................................... 97
Scope and Multimeter Setup................................................................................................ 98
Chapter 10: Information Operations ..................................................................................... 107
Chapter 11: Help Operations ................................................................................................. 108
Navigating the Help File ........................................................................................................... 108
Using the VERDICT Hard Keys ......................................................................................... 109
Using the Help Toolbar ...................................................................................................... 110
Chapter 12: System Settings Operations............................................................................. 111
Synchronizing Wireless Communications ................................................................................ 111
Pairing the S3 Scanner Module ......................................................................................... 112
Pairing the M2 Data Acquisition Device ............................................................................. 113
Chapter 13: Data Manager Operations ................................................................................. 115
Screen Layout .......................................................................................................................... 115
Navigation................................................................................................................................. 116
Operations ................................................................................................................................ 116
My Data.............................................................................................................................. 116
Up ...................................................................................................................................... 116
Open .................................................................................................................................. 117
New .................................................................................................................................... 117
Delete................................................................................................................................. 118
Rename ............................................................................................................................. 119
Save ................................................................................................................................... 119
Properties........................................................................................................................... 119
More ................................................................................................................................... 120
Chapter 14: Vehicle History Operations............................................................................... 121
Screen Layout .......................................................................................................................... 121
Vehicle History Main Body ................................................................................................. 121
Vehicle History Toolbar ...................................................................................................... 122
Shop Information ...................................................................................................................... 125
Chapter 15: Maintenance ....................................................................................................... 126
D7 Display Device .................................................................................................................... 126
Cleaning the Touch Screen ............................................................................................... 126
Calibrating the Touch Screen ............................................................................................ 126
vii
Contents
Cleaning and Inspecting the D7 Display Device ................................................................ 129
Battery Service................................................................................................................... 129
Operating System Restore................................................................................................. 132
S3 Scanner Module .................................................................................................................. 132
Cleaning and Inspecting the S3 Scanner Module .............................................................. 132
Replacing the Protective Handgrip..................................................................................... 133
M2 Data Acquisition Device...................................................................................................... 133
Cleaning and Inspecting the M2 Data Acquisition Device.................................................. 133
Replacing the Battery Pack................................................................................................ 133
Appendix A: Software License.............................................................................................. 136
Index ........................................................................................................................................ 141
viii
Chapter 1
Using This Manual
This manual contains tool usage instructions.
Some of the illustrations shown in this manual may contain modules and optional equipment that
are not included on your system. Contact your sales representative for availability of other
modules and optional equipment.
1.1 Conventions
The following conventions are used.
1.1.1 Bold Text
Bold emphasis is used in procedures to highlight selectable items such as buttons and menu
options.
Example:
• Press the OK button.
1.1.2 Symbols
Different types of arrows are used.
The “greater than” arrow (>) indicates an abbreviated set of selection instructions.
Example:
• Select Utilities > Tool Setup > Date.
The example statement abbreviates the following procedure:
1. Navigate to the Utilities screen.
2. Highlight the Tool Setup submenu.
3. Highlight the Date option from the submenu.
4. Press OK to confirm the selection.
The solid arrows (e, c, d, b) are navigational instructions referring to the four directions of the
directional arrow keys.
Example:
• Press the down d arrow.
1
Using This Manual
Conventions
1.1.3 Terminology
The term “select” means highlighting a button or menu item and pressing the Accept, OK, Yes, or
other similar button to confirm the selection.
Example:
• Select Reset.
The above statement abbreviates the following procedure:
1. Navigate to and highlight the Reset selection.
2. Press the OK, or similar, button.
1.1.4 Notes and Important Messages
The following messages are used.
Notes
A NOTE provides helpful information such as additional explanations, tips, and comments.
Example:
i
NOTE:
For additional information refer to...
Important
IMPORTANT indicates a situation which, if not avoided, may result in damage to the test
equipment or vehicle.
Example:
IMPORTANT:
Do not disconnect the data cable while the Scanner is communicating with the ECM.
1.1.5 Procedures
An arrow icon indicates a procedure.
Example:
z
To change screen views:
1. Select the View button.
The dropdown menu displays.
2. Select an option from the menu.
The screen layout changes to the format selected.
2
Introduction
Chapter 2
The VERDICT™ Diagnostic Platform is a specialized personal automotive diagnostic solution that
combines information with test instrumentation to help you diagnose symptoms, codes, and
complaints quickly and efficiently. There are three main components to the VERDICT system:
• "D7 Display Device"—the central processor and monitor for the system
• "S3 Scanner Module"—the device for accessing vehicle data
• "M2 Data Acquisition Device"—the device for performing meter and lab scope tests
This manual describes the construction and operation of these three devices and how they work
together to deliver diagnostic solutions.
2.1 D7 Display Device
2.1.1 Functional Description
1— Audio Speaker
2— Power Indicator LED (light emitting diode)
3— Microphone
4— Hard Drive Activity LED
5— Directional Buttons; left (e), right (c), up (d), down (b)
6— Stylus lanyard anchor post
7— S Button (special functions)
8— Enter Button
9— Camera (shutter) Button
10—Virtual Keyboard Button
11—Brightness Button
12—Power Button
Figure 2-1 Model D7 front view
3
Introduction
D7 Display Device
/HIW6LGH
5LJKW6LGH
1— USB (universal serial bus) Ports (2)
2— Head Phone Jack
3— Microphone Jack
4— DC Power Supply Input Port
5— SD (secure digital) Card Port
6— Mini USB Client Port
Figure 2-2 Model D7 side views
1— Battery Compartment Cover
2— Kennsington Lock (standard security device connection, device not included)
3— Stylus
4— Camera Lens
5— Collapsible Stand (closed)
Figure 2-3 Model D7 back view
4
Introduction
D7 Display Device
2.1.2 Technical Specifications
Processor:
Intel Atom
Operating System
Microsoft Windows Embedded Standard SP3
Touch Screen
Resistive Touch Panel
Display:
7 inch diagonal, LCD TFT
1024 x 600 resolution SWVGA
16 bit color
Battery:
Lithium Ion Smart Battery Pack
Approximately 3.5 hour run time
Approximately 3 hour charge time, unit not operating
Approximately 4 hour charge time, unit operating
DC Jack Operating Voltage
10V to 32V DC
Communications:
802.11 b/g/n Wireless
Bluetooth 2.0 Class 1
Dimensions:
Width:
9.9 inches
252 mm
Height:
6.8 inches
173 mm
Depth:
1.8 inches
46 mm
Weight (including battery):
2.9 lbs.
1.32 kg
Operating Temperature Range (ambient):
At 0 to 90% relative humidity (non-condensing)
32 to 113°F
0 to 45°C
5
Introduction
D7 Display Device
Storage Temperature (ambient):
At 0 to 70% relative humidity (non-condensing)
–4 to 140°F
–20 to 60°C
Environmental Conditions:
This product is intended for indoor use only
This product is rated for Pollution Degree 2 (normal conditions)
Power Supply:
Supply Rating; 19 VDC. 3.42A
2.1.3 Power Sources
Your Display Device can receive power from any of the following sources:
•
•
•
•
"Internal Battery Pack"
"AC/DC Power Supply"
"Vehicle Power"
"Docking Cradle (Optional)"
Internal Battery Pack
The display unit can be powered from the internal rechargeable battery. A fully charged standard
battery provides sufficient power for about 3.5 hours of continuous operation. An optional
high-capacity battery that provides 6 hours of operation is available. A LED on the front of the unit
indicates the battery state of charge.
AC/DC Power Supply
The display unit can be powered from a wall socket using the AC/DC power supply and power
cord. The AC/DC power supply also powers the internal battery pack charging process.
Vehicle Power
The display unit can be powered from a cigarette lighter or other suitable power port on the test
vehicle through a direct cable connection. The vehicle power cable connects to the DC power
supply port on the left side of the display unit.
Docking Cradle (Optional)
The display unit can be powered and operated when installed on the optional docking cradle. The
docking cradle also powers the internal battery pack charging process and allows USB
connectivity for attaching peripherals. Contact your sale representative for additional details.
6
Introduction
S3 Scanner Module
2.2 S3 Scanner Module
2.2.1 Functional description
7RS
%RWWRP
)URQW
1— Data cable connector
2— Memory card port (remove protective hand grip for access)
3— Bluetooth LED (green)
4— Communication issue LED (red)
5— Vehicle power LED (green)
6— Ethernet port (remove protective hand grip for access)
7— Universal serial bus (USB) port (remove protective hand grip for access)
8— Ethernet port (remove protective hand grip for access)
Figure 2-4 Model S3 Scanner Module
Wireless Communication
The S3 Scanner Module is a wireless communications device that transmits vehicle data to the
VERDICT display device without a physical connection. The working range of the transmitter is
about 30 feet (9.14 m). A signal lost due to moving out of range automatically restores itself when
the display unit is brought closer to the Scanner module. The Scanner sounds a tone and the
Display Device shows a warning message when the signal is lost.
7
Introduction
S3 Scanner Module
2.2.2 Technical Specifications
Communications:
Bluetooth 2.0 Class 1
Dimensions:
Length:
8.04 inches
204.3 mm
Height:
3.82 inches
97 mm
Depth:
1.66 inches
42.1 mm
Weight (including protective hand grip):
0.9 lbs.
0.408 kg
Operating Temperature Range (ambient):
At 0 to 90% relative humidity (non-condensing)
32 to 113°F
0 to 45°C
Storage Temperature (ambient):
At 0 to 70% relative humidity (non-condensing)
–4 to 140°F
–20 to 60°C
Environmental Conditions:
This product is intended for indoor use only
This product is rated for Pollution Degree 2 (normal conditions)
2.2.3 Power Sources
The Scanner Module operates on 12-volt vehicle power, which it receives through the data cable
connector. The unit powers on whenever it is connected to an OBD-II compliant data link
connector (DLC). For non OBD-II compliant vehicles, the unit can be powered from a cigarette
lighter or other suitable power port on the test vehicle using the auxiliary power cable.
8
Introduction
M2 Data Acquisition Device
2.3 M2 Data Acquisition Device
2.3.1 Functional Description
1— DC Power Supply Input Port
2— Color Graphic Display Screen
3— Soft Keys for Selecting Additional Functions
4— Rotary Switch for Selecting Primary Functions
5— Common (Ground) Lead Input Port
6— Channel 1 (Red) Lead Input Port
7— Channel 2 (Green) Lead Input Port
Figure 2-5 Model M2 Data Acquisition Module
Wireless Communication
The VERDICT M2 is digital graphing multimeter and wireless communications device. The unit
can be used as a stand-alone meter, or configured to transmit vehicle data to the D7 Display
Device without a physical connection. The working range of the transmitter is about 30 feet
(9.14 m). A signal lost due to moving out of range automatically restores itself when the display
unit is brought closer to the M2 meter. The VERDICT M2 sounds a tone and the Display Device
shows a warning message when the signal is lost.
9
Introduction
M2 Data Acquisition Device
2.3.2 Technical Specifications
Display:
Color graphical display
Battery Pack:
4 1.2V Ni-Mh (nickel-metal hydride)
Dimensions:
Height:
9.125 inches
231.8 mm
Width:
4.25 inches
107.9 mm
Depth:
2.00 inches
50.8 mm
Weight (including battery):
1.9 lbs.
0.86 kg
Agency Approvals:
IEC 61010-1 Over Voltage
CAT III—1000 VAC/DC
CAT IV—600 VAC/DC
Pollution Degree 2
UL Listed 61010-1:
CAT II 750 VAC, 1000 VDC
CAT III 600 VAC/DC
2.3.3 Power Sources
The Data Acquisition Device comes with a rechargeable battery pack, which is already installed in
the unit. Simply turn on the unit and observe the battery icon on the display to determine the
battery pack state of charge. The AC/DC Power Supply (included) provides power from a wall
socket to recharge the battery pack, or to power the unit if the battery pack charge is low.
Internal Battery Pack
The data acquisition unit is powered from the internal rechargeable battery. An icon in the upper
right-hand corner of the display screen indicates the battery state of charge.
AC/DC Power Supply
An AC/DC Wall Adapter for charging the internal battery of the M2 Data Acquisition Device is also
provided. The jack that connects the adapter to the M2 unit is longer than the jack that is used for
the display device.
10
Chapter 3
Getting Started
Make sure the VERDICT Display Device has a charged battery or is connected to an AC power
supply (see "Power Sources‚" on page 8). It is highly recommended to back up personal and
saved data to a USB mass storage device on a regular basis to prevent loss in the event of system
corruption or hard disk drive failure.
3.1 Powering Up
Press the Display Device Power button to switch the unit on. The system boots up, then opens the
VERDICT Home screen (Figure 3-1).
1. Module Buttons
2. VERDICT Toolbar
3. Windows Toolbar
Figure 3-1 Sample VERDICT Home screen
11
Getting Started
Powering Up
3.1.1 Module Buttons
The Module buttons configure the VERDICT for the type of test to be performed. The table below
gives brief descriptions of the available Module buttons, which operations are available depends
upon the individual configuration of your VERDICT system.
Table 3-1 Module buttons
Name
Button
Description
Scanner
Configures the unit to operate as a scan
tool. See "S3 Scanner Operations‚" on
page 22.
OBD Direct
Allows you to perform generic OBD-II
system tests without identifying the specific
vehicle. See "OBD Direct Operations‚" on
page 50.
Component Test
Opens a diagnostic database of specific
tests for the identified vehicle. See
"Component Test Operations‚" on page 58.
Scope Multimeter
Configures the unit to operate as a lab
scope, graphing multimeter, or digital
multimeter. See "Scope Multimeter
Operations‚" on page 89.
Information
Provides the information needed to make
repairs once you have made your
diagnosis. The linked program varies by
region. See "Information Operations‚" on
page 107.
Help
Opens the on-line help for the system. See
"Help Operations‚" on page 108.
System Settings
Establishes and manages wireless
connections to peripheral devices, such as
the Scanner module and the Data
Acquisition Device. See "System Settings
Operations‚" on page 111.
Vehicle History
Identifies the test vehicle and organizes and
manages work in progress and service
records. See "Vehicle History Operations‚"
on page 121.
Data Manager
Opens the organization system for saved
data files. See "Data Manager Operations‚"
on page 115.
Exit
Closes the VERDICT diagnostic Platform
software and returns the display to the
Windows desktop.
Use the stylus or your finger tip to select from the Module buttons.
12
Getting Started
Powering Up
3.1.2 VERDICT Toolbar
Operation of the buttons located on the VERDICT toolbar are described in the table below:
Table 3-2 Module buttons
Name
Button
Description
Home
Touching this button returns you to the
VERDICT Home screen from any test.
Windows Toolbar
Touching this button opens and closes the
standard Windows toolbars at the top and
bottom of the screen.
Menu
Touching this button opens a menu that
provides information on the screen being
viewed.
Change Vehicle
The currently identified vehicle is shown to
the right of the buttons, touching allows you
to change the identified test vehicle.
View Record
Touching the button opens an editable
worksheet of vehicle records.
Hardware Status
Indicates the wireless connectivity status of
the Scanner module and the Data
Acquisition Device.
Menu Button Options
The Menu button on the VERDICT Toolbar at the base of the display screen opens a list of basic
operations and features. Menu options vary by module and may include:
• Safety Information—opens the Important Safety Instructions document, which should be read
and understood prior to using the VERDICT Diagnostic Platform.
•
•
•
•
File—allows you to print or save the data being viewed.
Edit—allows you to configure alarms when viewing Scanner data.
Tools—allows you to perform certain maintenance operations and adjust tool settings.
Help—allows you to view supporting documentation.
Selecting a menu item opens a submenu of choices, and some submenus also open an additional
menu. A right arrowhead (c) indicates additional choices are available. Touch an item to select it.
File
Use to print or save a copy of the data currently being viewed. Selecting opens a submenu:
• Save—available from the Scanner module, opens an additional submenu with these options:
– Screenshot—saves a graphic image of the current screen
– Collected Data—saves a recording of all the data currently in the buffer plus the number
of frames designated after the trigger event (see "Properties‚" on page 45).
13
Getting Started
Powering Up
• Print—available from the Scanner module, opens an additional submenu with these options:
– Screen—sends the current screen image to a printer.
– Troubleshooter—prints the full text of the troubleshooter topic shown in the main body.
• Print Article—available from the Component Test module, has one of the following results:
– If VERDICT is connected to a printer, the file is sent to the printer.
– If VERDICT is not connected to a printer, the article is saved as a .xps file, which can be
retrieved, moved, or copied and printed at a later time.
Selecting a print option opens a standard Windows Print dialog box, which allows you to print or
save the file.
Edit
This Scanner module option performs the same function as the Alarms button on the Scanner
Toolbar. For more information refer to "Alarms‚" on page 46).
Tools
This Scanner module option allows you to adjust tool settings to your personal preferences.
Selecting Tools opens a submenu of the following sections.
Graph Properties
Selecting opens the General Graph Properties dialog box, which is similar what is available from
the Properties button on the Scanner Toolbar (see "Properties‚" on page 45). Changes made here
apply to all of the graphs. General graph options allow you to:
•
•
•
•
Change the background and plot colors of the graphs.
Switch graph grid lines on and off.
Adjust how much data is captured after a triggering event.
Adjust the sweep time of the graphs.
Units Setup
Selecting opens a dialog box that allows you to choose between US customary or metric units of
measure for temperature, vehicle speed, air pressure and other pressure readings.
z
To change the units setup:
1. From the VERDICT toolbar select Tools > Units Setup.
The Measurement Units Setup dialog box opens (Figure 3-2).
2. Use the dropdown menus to select the desired value for each item.
3. Tap Accept to close the dialog box and apply the changes.
14
Getting Started
Powering Up
Figure 3-2 Sample view options
Table 3-3 Scan tool units of measurement—defaults and options
Setting
Default
Option
Temperature
degrees Celsius (°C)
degrees Fahrenheit (°F)
Air Pressure
(including manifold pressure)
kilopascal (kPa)
inches of mercury (“Hg)
Vehicle Speed
kilometers per hour (KPH)
miles per hour (MPH)
Other Pressure
kilopascal (kPa)
pounds per square inch (PSI)
Download Firmware
This option is used to update the firmware on your VERDICT unit. For firmware information,
contact your sales representative or Customer Care. While downloading the firmware, do not
interrupt the download process. Connection interruption may cause damage to the VERDICT unit.
i
NOTE:
It is recommended to connect the VERDICT to an AC power source when downloading firmware.
Display BEN
This option shows the BEN of the currently identified vehicle in the Scanner toolbar. The BEN is a
unique identifier that is used internally for data coordination and communication.
Help
A variety of utilities and additional resources are available through the Help menu. Menu options
vary by module and may include:
•
•
•
•
•
•
•
User Manual
Version Info
Activation Status
User’s Manuals
About Component Test
About Scanner
Shop Information
15
Getting Started
Powering Up
User Manual
This option opens this document, which provides overall navigation and operation information for
the VERDICT Diagnostic Platform.
Version Info
This option opens a window showing the version of the VERDICT software and a copy of the
Software License Agreement (Figure 3-3). Tap OK to close the window.
Figure 3-3 Sample software version screen
Activation Status
This option opens a dialog box with version and licensing details for the VERDICT system, and
activation status for the Display device and all other modules.
User’s Manuals
This Scanner module option opens a submenu of support documentation, such as vehicle
communication software manuals. These manuals provide connection and test information for
specific vehicles. Selecting a menu item opens a printable PDF version of the document in a
separate window.
About Component Test
This option opens a dialog box that contains software version and details, copyright data, and
other specific details about the Component Test module.
About Scanner
This option opens a dialog box that contains software version and details, copyright data, and
other specific details about the Scanner module.
16
Getting Started
Powering Down
Shop Information
This Vehicle History option that allows you to add personalized shop information that can be
included on printed data files. Selecting opens a form that can be filled in using the virtual
keyboard. Select OK when done and the information is saved.
3.1.3 Windows Toolbar
This is the standard Windows toolbar. Your VERDICT unit is a fully functional personal computer
based on the Windows Embedded Standard operating system. Refer to Microsoft documentation
for additional information.
3.2 Powering Down
All vehicle communication must be terminated before shutting down the VERDICT unit. A warning
message displays if you attempt to shut down while the Scanner is communicating with the
vehicle. Forcing a shut down while communicating may lead to ECM problems on some vehicles.
Exit the Scanner module before powering down.
z
To power down the VERDICT unit:
1. Navigate to the VERDICT Home screen.
2. Select the Exit button.
3. From the Windows desktop, open the Windows Start menu.
4. Select Turn Off Computer.
5. Select Turn Off in the dialog box.
The open programs close and the power switches off.
3.2.1 Emergency Shutdown
In case of emergency, press and hold the Power button to force a shutdown.
17
Navigation
Chapter 4
This chapter discusses how to use the hardware controls and features for the VERDICT Display
Device and Data Acquisition Module. There are no external controls on the Scanner Module, it can
only be operated by a separate device.
4.1 D7 Display Device Controls, and Features
The external controls on the display device are simple because most operations are controlled
through the touch screen. Touch screen navigation is menu driven, which allows you to quickly
locate the test, procedure, or data that you need through a series of choices and questions.
Detailed descriptions of the menu structures are found in the chapters for the various modules.
The following sections describe the external controls and features of the display device.
4.1.1 Control Buttons
Name and location of control buttons:
Table 4-1 Display Device control buttons
Name
Button
Description
S Button
A function button that provides a shortcut for
capturing a screen image.
Directional Buttons
Moves the cursor or highlight on the display
screen up, down, right, or left.
Enter Button
Selects a highlighted item or returns the display
to the previous screen.
Camera Button
Operates the built-in camera. Press once to
open the application, The button then acts as
the shutter to take a photograph of what is
visible on the screen.
Keyboard Button
Opens or closes the virtual keyboard.
Brightness Button
Increases the screen backlighting in seven
incremental steps.
Power Button
Turns the unit on and off.
All other tool operations are controlled through the touch screen.
18
Navigation
M2 Data Acquisition Device Controls and Features
z
To use the camera:
1. Press the Camera button.
The camera screen opens and the button now becomes the shutter.
2. Focus the image to be captured in the view finder.
3. Press the Camera button.
The view finder now shows the captured picture.
4. Select OK to save the image, or Delete to delete it.
The view finder is live and the Camera button is the shutter, repeat steps 2, 3, and 4 to take
additional pictures.
5. Select Exit from the live view to close the camera application.
4.1.2 LEDs
There are two light-emitting diodes (LEDs) on the front face of the device:
• Power Indicator LED—this device uses three colors to show the battery and power status as
follows:
– Green indicates a either a battery with a full, or nearly full, charge or DC power
– Orange indicates a battery that is charging. An orange LED that fades on and off at three
second intervals indicates the unit is in Standby mode.
– Red indicates a low battery (15% of capacity or less).
• Hard Drive Activity LED—illuminates when the central processing unit (CPU) is reading or
writing to the hard disk drive (HDD).
4.1.3 The Stand
The built-in stand extends from the back of the unit to allow hands-free viewing. The stand clips
into the unit for storage and pivots out so the display is at a 35 degree angle when in use.
4.2 M2 Data Acquisition Device Controls and Features
There are two sets of controls for the M2 Data Acquisition Device:
• Rotary Selector Switch—establishes the primary operation of the unit
• Soft Keys—select additional functions, which vary depending upon the position of the Rotary
Selector Switch
The following sections describe the external controls and features of the M2 unit.
4.2.1 Rotary Selector Switch
Turning the Rotary Selector Switch determines the primary function of the M2 unit.
19
Navigation
M2 Data Acquisition Device Controls and Features
Figure 4-1 Sample Rotary Selector Switch
The available functions are represented by graphic icons on the face of the tool. Descriptions of
the functions are given in the following table:
Table 4-2 Data Acquisition Device rotary switch settings
Function
Icon
Description
Off
Switches power to the M2 unit off. The switch should be in
this position whenever the tool is not being used to prevent
battery drain.
Volts DC
Measures direct current (DC) voltages within a range of zero
to 600 volts. This setting is also used to measure frequency
(hertz), duty cycle (%), and time period (cycle, ms).
Volts AC
Measures alternating current (AC) voltages within a range of
zero to 1000 volts. This setting is also used to measure
frequency (hertz), duty cycle (%), and time period (cycle, ms).
Resistance
Measures the DC resistance to current in ohms in a range of
zero to open circuit (infinite).
Continuity/
Diode Check
Performs dual tests; circuit continuity and diode test (forward
drop). The “S” (special function) soft key switches between
the two tests.
Auxiliary
Performs three auxiliary tests; current (amperes), pressure,
and temperature. The “S” (special functions) soft key
switches between the three tests. Pre-approved sensors
must be used in order to take valid measurements.
Capacitance
Measures capacitance in nanofarad (nF), millifarad (mF), and
microfarad (µF).
Oscilloscope
(Waveform Viewer)
Configures the M2 unit to perform as one or two channel
oscilloscope, or waveform viewer.
Remote Functions
Configures the M2 unit to be operated through the Display
Device. Readings are also shown on the Display Device
screen. All of the controls on the from panel of the M2 unit
become inoperative when the rotary switch is in this position.
20
Navigation
M2 Data Acquisition Device Controls and Features
4.2.2 Soft Keys
The eight soft keys located above the rotary dial on the M2 unit are used to initiate a variety of
additional functions while performing meter tests. The functionality of the soft keys varies
according to what type of tests are being performed, as determined by the position of the rotary
switch. Some of the soft keys do not function for certain test modes. Refer to "M2 Data Acquisition
Device‚" on page 67 for additional information.
In general, a short or momentary push of a soft key activates the assigned function, a long push returns to
the normal display.
21
Chapter 5
S3 Scanner Operations
The Scanner allows you to establish a data link to the electronic control systems of the vehicle
being serviced to retrieve diagnostic trouble codes (DTCs) view live data parameters, and perform
tests. The Scanner can access the electronic control module (ECM) for various vehicle control
systems such as engine, transmission, antilock brake system (ABS) and more.
Scanner testing requires connecting the VERDICT Diagnostic Platform to the test vehicle using
the data cable and test adapters. On screen instructions tell you how to connect the Scanner,
additional connection information can be found in the appropriate vehicle communication software
manual for the test vehicle, which is available through the Help menu.
The S3 Scanner Module is J2534 compliant and capable of flash programming vehicle ECMs.
5.1 Getting Started
Prior to its first use, the Scanner Module must be synchronized with the VERDICT Display Device
to establish a wireless communication link. Refer to “Pairing the S3 Scanner Module“ on page 112
for details.
A demonstration program allows you to become familiar with Scanner operations and testing
without being connected to an actual vehicle.
5.1.1 The Demonstration Program
The Scanner module demonstration program allows you to become familiar with many of the test
capabilities without connecting to a vehicle. Sample data and mock test results help you learn the
menus and basic operations.
The Scanner module must be synchronized with the display device to use the demonstration
program. See “Pairing the S3 Scanner Module“ on page 112 for details. Both the Scanner module
and the display device must be powered on.
z
To start the demonstration program:
1. From the VERDICT Home screen, tap the Scanner icon.
The manufacturer menu displays. This menu lists includes all makes that are covered by any
of the VERDICT modules, not just those for which Scanner information is available. There is
a Demonstration button that launches the program is also included in the list.
2. Tap the Demonstration button.
22
S3 Scanner Operations
Getting Started
Figure 5-1 Sample demonstration selection
A screen with two choices now displays:
– US Domestic—contains actual data captured while driving a 2001 Chevrolet Tahoe. Look
for the throttle position (TP) sensor dropout while analyzing the data in Graphing mode.
– OBD Training Mode—provides simulated data for an OBD-II/EOBD vehicle that allows
you to access any of the standard functions.
3. Select either option and a confirmation message displays.
4. Select Ok to load the selected database.
5. Follow the on-screen instructions and select as needed until the Systems menu displays.
6. Select from any of the systems listed, then select from the submenus.
IMPORTANT:
Do not connect a vehicle to the VERUS unit while in the Demonstration mode.
5.1.2 Disconnecting the VERDICT Unit From a Vehicle
When disconnecting the VERDICT unit from the vehicle, make sure the Scanner software is not
communicating with the vehicle.
z
To exit Scanner and disconnect the VERDICT Unit from a vehicle:
1. From a codes or data display screen, tap the Exit button on the upper toolbar.
Figure 5-2 Sample upper toolbar Exit button
The screen goes to the codes or data menu.
2. Tap the Back button on the upper toolbar.
23
S3 Scanner Operations
Vehicle Identification
Figure 5-3 Sample upper toolbar Back button
The screen goes to the system menu.
3. Tap the Back button on the upper toolbar.
A “stopping communication” briefly displays followed by the systems menu.
4. Tap the Change Vehicle button on the VERDICT toolbar.
Figure 5-4 Sample VERDICT toolbar Change Vehicle button
The vehicle description on the toolbar should now read “No Active Vehicle”.
5. Tap the Home button on the VERDICT toolbar.
Figure 5-5 Sample VERDICT toolbar Home button
The Home screen displays.
6. Disconnect the test adapter from the vehicle connector.
i
NOTE:
Damage to the electronic control module (ECM) of the vehicle can occur if communication is
disrupted. Ensure that the vehicle communication cable is properly connected at all times during
testing. Exit testing before removing the test cable or powering down.
5.2 Vehicle Identification
The Scanner information presented is provided by a direct link to the ECM of the vehicle being
tested. Therefore, certain attributes of the test vehicle must be entered into the VERDICT unit so
that the data displays correctly. Vehicle identification information is carried over if you enter the
Scanner module either from the Component Test module or from one of the records stored in the
Vehicle History module. However, you may need to enter additional attributes in some instances.
The vehicle identification sequence is menu driven, you simply follow the screen prompts and
make a series of choices. Each selection you make advances you to the next screen. A Back
button in the upper left corner of the screen returns you to the previous screen. Exact procedures
may vary somewhat by vehicle.
z
To identify a vehicle for Scanner testing:
1. Tap the Scanner module button from the Home screen.
A list of manufactures displays (Figure 5-6).
24
S3 Scanner Operations
Vehicle Identification
Figure 5-6 Sample manufacturer list
2. Select the manufacturer of the test vehicle from the list.
A model year menu displays.
i
NOTE:
You can limit the number of manufacturers that appear on the list by selecting Configure Favorites
from the toolbar. See “Creating a Favorites List“ on page 58 for details.
3. Select the year of the test vehicle from the menu.
A list of vehicle types or models displays. Several selections may be required to identify the
vehicle type and model, follow the screen prompts and enter the required information.
A confirmation dialog box displays once all the required data has been entered (Figure 5-7).
Figure 5-7 Sample confirmation dialog box
25
S3 Scanner Operations
Vehicle Identification
4. From the Confirm vehicle details dialog box, select:
a. OK to continue.
b. Cancel to return to the engine list.
When Yes is selected list of systems available for testing on the identified vehicle displays.
5. Select a test to continue (Figure 5-8).
Figure 5-8 Sample available tests list
The identification sequence is now complete, refer to the Operations section that follows for
details on how to navigate through the Scanner data and perform tests.
i
NOTE:
If you return to the Home screen and select Component Test, Information, or another module the
vehicle identification entered here is carried over. However, additional information may be needed
in some instances.
5.2.1 Alternative Vehicle Identification
Occasionally, you may identify a test vehicle that the Scanner does not recognize, the database
does not support, or has some unique characteristics that prevent it from communicating with the
Scanner through the normal channels. In these instances, a menu of alternate choices that allow
you to establish communication with the vehicle by other means displays. In addition to being able
to identify a different manufacturer, the following alternatives are available:
• OBDII/EOBD—allows you to perform generic OBD-II or EOBD tests, see “OBD Direct
Operations“ on page 50 for additional information.
• System ID Modes—allows you to begin the vehicle identification by first selecting the system
• to be tested. Selecting opens a menu of manufacturers that support this mode.
• Select by Database—allows you to begin the vehicle identification by first selecting which
manufacturer database to load. Selecting opens a menu of available databases.
26
S3 Scanner Operations
Connecting to a Vehicle
5.3 Connecting to a Vehicle
Make a selection from the systems available for testing list and instructions for connecting the
Scanner to the vehicle with the data cable display on the screen (Figure 5-9).
Figure 5-9 Sample vehicle connection message
If an adapter and key are needed, the instructions tell you which ones to use, and also where to
locate the vehicle diagnostic connector to perform the selected tests. Refer to the appropriate
Vehicle Communication Software Manual for additional details.
5.3.1 Cables
One of two data cables, one for OBD-II compliant vehicles and one for non-OBD-II models, are
used to connect the S3 Scanner module to the test vehicle. The 26-pin end of either cable
attaches to the data cable port on the Scanner module and is secured with two captive screws.
The 16-pin end of the OBD-II cable directly plugs into the data link connector (DLC) of the test
vehicle. The 15-pin end of the non-OBD-II cable attaches to a cable adapter and is secured with
captive screws, the adapter then plugs into the diagnostic connector on the test vehicle.
On-screen instructions on the display device screen tell you which cable, and adapter if needed,
to use once a test vehicle has been identified. The screen message also includes the location of
the vehicle diagnostic connector that the cable attaches to for testing the selected system.
A replaceable 7.5 amp blade-type fuse is installed in the vehicle connector end of the cable to
protect the unit from high circuit voltage and current. A green LED, also on the vehicle connector
end of the cable, illuminates whenever there is power supplied to the cable. An LED that fails to
illuminate indicates either a problem on the vehicle power circuit or a blown data cable fuse.
All OBD-II vehicles have vehicle battery power (B+) available on the DLC, so the Scanner module
should power on as soon as the cable is connected to the vehicle. The auxiliary power cable
supplies power for testing non-OBD-II models that do not have B+ on the diagnostic connector. An
optional OBD-I Data Cable and adapters are required for testing non-OBD-II models.
27
S3 Scanner Operations
Navigation
The large end of the auxiliary power cable plugs into the vehicle accessory port. The small end of
the cable fits into a power port built into the side of the cable adapter. An in-line fuse on the
auxiliary cable provides circuit protection.
z
To connect the data cable to the vehicle:
1. Follow the on-screen instructions for connecting to the vehicle (Figure 5-9).
2. Once connected, select Continue.
The Scanner establishes communication then displays a list of available tests. If the Scanner
is unable to establish a communications link, a “no communications” message displays.
3. Select from the available tests to open a submenu of test options.
5.3.2 No Communication Message
When the screen displays a “no communication” message, it means the VERDICT unit and the
vehicle control module cannot communicate with each other for some reason.
The following conditions cause a “no communication” message to display:
•
•
•
•
•
•
•
The Scanner is unable to establish a communication link with the vehicle.
You selected a system for testing that the vehicle is not equipped with (such as ABS).
There is a loose connection.
There is a blown vehicle fuse.
There is a wiring fault on the vehicle, or in the data cable or adapter.
There is a circuit fault in the data cable, Personality Key, or adapter.
Incorrect vehicle identification was entered.
Refer to the Vehicle Communication Software manuals for manufacturer-specific problems.
5.4 Navigation
This section describes how to navigate the Scanner interface and select scanner tests.
5.4.1 Scanner Screen Layout
The Scanner screens typically include three sections (Figure 5-10):
28
S3 Scanner Operations
Navigation
1— Scanner Toolbar
2— Main Body
3— Data Buffer Toolbar
Figure 5-10 Scanner module screen layout
Scanner Toolbar
The Scanner toolbar contains a number of buttons that allow you to configure the displayed data
and to exit. The table below provides a brief explanation of the Scanner toolbar button operations:
Table 5-1 Scanner toolbar buttons
Name
Button
Description
Exit
Closes the current test and returns you
to the menu.
Back
Returns to the previously viewed
screen.
Custom
Allows you to select which parameters
are displayed on the screen.
Scale
Switches the scale values, displayed
along the left-hand side of the graphs,
on and off.
Sweep
Switches the sweep values, displayed
at the base of the graphs, on and off.
Properties
Allows you to adjust the display
characteristics for all of the data
screens.
Alarms
Allows you to set an alarm on certain
data parameters when the signal goes
above or below the alarm setting.
29
S3 Scanner Operations
Navigation
Main Body
The main body of the screen varies depending on the stage of operation. The main body can show
vehicle identification selections, the main menu, test data, instructions, troubleshooting
information, controls, and other diagnostic information.
Data Buffer Toolbar
Whenever communication is established with a vehicle, the Scanner continuously records data
transmitted by the ECM in the data buffer. The toolbar below the main body of the screen contains
the buttons for navigating this buffered data.
Use the toolbar buttons (Table 5-2) to more precisely navigate the data.
Table 5-2 Data buffer toolbar buttons
Name
Button
Description
Go To Start
Moves to the first frame in the data buffer
Pause
Suspends data capture and changes to show the
Play button
Play
Starts or resumes data capture and changes to show
the Pause button
Go To End
Moves to the last frame in the data buffer
Clear
Erases data in the data buffer
Step Back
Moves to the previous frame in the data buffer
Frame Counter
Indicates the data buffer frame currently displayed
Step Forward
Moves to the next frame in the data buffer
Snapshot
Arms the VERDICT software to take a snapshot of
vehicle data
Zoom In
Increases the sweep of the graph
Zoom Out
Decreased the sweep of the graph
30
S3 Scanner Operations
Navigation
Use the slider in the middle of the toolbar to quickly move through paused data.
Figure 5-11 Sample data buffer slider
5.4.2 Screen Messages
Screen messages appear when additional input is needed before proceeding. There are three
types of on-screen messages:
• Confirmations
• Warnings
• Errors
Confirmation Messages
Confirmation messages inform you when you are about to perform an action that cannot be
reversed or when an action has been initiated and your confirmation is needed to continue.
When a user-response is not required to continue, the message displays briefly before
automatically disappearing.
Warning Messages
Warning messages inform you when completing the selected action may result in an irreversible
change or loss of data.
Error Messages
Error messages inform you when a system or procedural error has occurred.
Examples of possible errors include:
• A cable is disconnected.
• A peripheral, such as a printer is powered off.
5.4.3 Making Selections
The Scanner software is a menu driven program that presents a series of choices one at a time.
As you select from a menu, the next menu in the series displays. Each selection narrows the focus
and leads to the desired test. Use your fingertip or the stylus to make menu selections.
31
S3 Scanner Operations
Operations
5.5 Operations
The Scanner allows you to establish a data link to the electronic control systems of the vehicle
being serviced in order to view live data parameters and perform tests. You can use selected
functional tests, get troubleshooting tips, and get vehicle-specific trouble codes for various vehicle
control systems such as engine, transmission, antilock brake system (ABS) and more.
The Scanner has two main functions:
1. Scanner—provides access to Vehicle Communication Software functions such as reading
codes, viewing data, and performing functional tests.
2. Fast-Track Troubleshooter—provides the diagnostic power of Fast-Track Troubleshooter, a
database of experience based information developed by master technicians.
After a system is selected and the Scanner establishes communication with the vehicle, a
Scanner Main menu, which lists available tests, displays.
Figure 5-12 Sample Scanner Main menu
Main menu options vary slightly by the year, make, and model of the test vehicle. The main menu
may include:
• Data Display— displays data parameter information from the vehicle control module.
Selecting may open a submenu of viewing options.
• Codes Menu—displays diagnostic trouble code (DTC) records from the vehicle control
module. Selecting may open a submenu of viewing options.
• Clear Codes—erases DTC records and other data from the ECM. This selection is found on
a Codes submenu for some models.
• Functional Tests—provides specific subsystem and component tests. The tests vary
depending on the manufacturer and model.
• Actuator Tests—similar to functional tests, checks the operation of certain actuators, such as
solenoid valves and relays.
• Memory Resets—allows you to reprogram adaptive values for certain components after
making repairs. Selecting opens a submenu. These options are found on the Functional Tests
Menu for some models.
32
S3 Scanner Operations
Operations
• System Tests—provides specific subsystem testing. Performing these tests is similar to
functional tests.
• Generic Functions—lets you access certain available Generic OBD II functions from a
proprietary menu (1996 and newer vehicles only).
• Troubleshooter—provides step-by-step procedures, integrating parameter data and
retrieving trouble codes when appropriate, for specific symptoms of the identified vehicle.
z
To perform a Scanner test
1. Launch the Scanner—Tap Scanner on the VERDICT Home screen.
2. Identify the vehicle—Identify the test vehicle by selecting from the menu options.
3. Select the system—Select the system to be tested from the systems menu.
4. Connect the data cable to the vehicle—Follow the on-screen connection instructions to
connect the VERDICT S3 Scanner unit to the test vehicle.
5. Select the test from the Scanner main menu—Select the desired test.
5.5.1 Data Display
Depending upon the test vehicle, this selection may appear as Data, Data Display, Data Only,
Data (No Codes), or something similar. All are the same, selecting has one of the following results:
• A submenu of data viewing choices displays.
• Vehicle data displays.
A submenu displays when more than one data viewing mode is available on the identified vehicle.
On some models, the engine must be started or cranked before data can be displayed. For these
models, a “Waiting to Communicate” message displays if the engine was not cranked or started.
Data Screens
When a Data selection is made, the screen displays the data list for the selected module.The
items available for any control module vary from one vehicle to another.
Data is presented in a 2-column format. An abbreviated parameter name is at the left of each
column and its value is at the right edge of the column. Parameters display in the order that they
are transmitted by the ECM, so expect variation between vehicles.
Gesture scrolling allows you to quickly move through the data list. Simply touching the screen and
drag your finger up or down to reposition the parameters being displayed. Position bars to the right
of each column indicate the position of the current screen in relation to the entire list. Each column
of parameters scrolls independently of the other column. Figure 5-13 shows a typical data screen.
33
S3 Scanner Operations
Operations
1— Parameter field
2— Parameter name
3— Parameter value
4— Position bar
Figure 5-13 Sample data screen
Data Graphs
Tap anywhere in the parameter field to open a data graph for that parameter (Figure 5-14).
Selecting a parameter for graph view moves it to the top of the list. Tap anywhere in the parameter
field at the top of a graph to close the graph for that parameter and return to a text view. You can
view up to four graphs at a time on the VERDICT screen.
Figure 5-14 Sample graph view
34
S3 Scanner Operations
Operations
The two icons display on each data graph allow you configure settings for the selected graph only:
Table 5-3 Data graph icon operations
Name
Button
Description
Expand/Collapse
Tap to expand the graph to fill the entire screen, tap
again to collapse the graph to the standard view.
Graph Properties
Tap to open the Graph Properties dialog box, which
allows you to set triggers for recording a snapshot
and adjust the scale.
Triggers
Triggers establish threshold values, an upper limit and a lower limit, for recording a data snapshot.
A snapshot allows you to closely evaluate conditions that caused the triggering event.
When a snapshot is taken, the Scanner retrieves some of the buffered data, captures data at the
trigger point, and records additional data after the trigger point. This gives you a complete picture
of what was happening before the fact, what occurred at the trigger point, and what happened
after the fact.
Once data collection is finished, data collection pauses. A vertical line now appears on each of the
data graphs to indicate the triggering point. The trigger line on the parameter that triggered the
snapshot is a different color than those on the other graphs. This makes it easy to determine which
parameter caused the trigger.
You can adjust the amount of data collected after a triggering event using the Properties button on
the Scanner toolbar. See “Properties“ on page 45 for additional information.
z
To adjust the length of a snapshot:
1. Tap the Properties button on the Scanner toolbar to open the dialog box.
2. Highlight one of the Samples After Trigger options:
–
–
–
–
–
–
0 Samples
5 Samples
10 Samples
20 Samples
50 Samples
100 Samples
3. Tap the Accept button to close the dialog box.
z
To set triggers and record a snapshot:
1. Tap the Graph Properties icon on the parameter graph you wish to set triggers on to open the
dialog box.
2. From the Graph Properties dialog box, tap Triggers On.
A check mark appears in the box and the minimum and maximum fields activate
(Figure 5-15).
35
S3 Scanner Operations
Operations
Figure 5-15 Sample Graph Properties dialog box
3. Tap either Max: (maximum) or Min: (minimum) to activate that field and open the keyboard.
4. Type the desired trigger value into the field.
5. Tap the other field and enter a trigger value, then close the virtual keyboard.
6. Tap Accept to close the dialog box.
Trigger lines (red for upper and blue for lower) display on the selected parameter graph.
The area between the upper and lower trigger lines establishes the triggering condition. Once
the snapshot is armed, any data points that register outside of the set trigger conditions
initiates a snapshot. The Scanner continues to record the preset amount of data after the
trigger and includes it in the snapshot.
7. Tap Snapshot on the Data Buffer Toolbar to arm the snapshot.
A red background appears on the Snapshot button to indicate it has been armed
(Figure 5-16).
Figure 5-16 Sample armed Snapshot button
The data capture pauses when a trigger activates.
8. Tap the Play button on the toolbar to resume viewing live data.
i
NOTE:
Selecting an armed Snapshot button disarms it.
Scale
Scale adjusts the upper and lower values displayed on the vertical axis of a data graph. Two scale
modes are available; auto scale and manual scale. Auto scale, which is the default setting,
automatically adjusts the graph scale based upon the minimum and maximum values transmitted
by the ECM. Manual scale allows you to set the minimum and maximum values.
36
S3 Scanner Operations
z
Operations
To manually set the scale on a graph:
1. Tap the Graph Properties icon on the graph you wish to scale to open the dialog box.
2. From the Graph Properties dialog box, tap Auto Scale On.
Figure 5-17 Sample manual scale selection
The check mark is cleared from the box and the minimum and maximum fields activate
3. Tap either Max: (maximum) or Min: (minimum) to activate that field and open the keyboard.
4. Type the desired trigger value into the field.
5. Tap the other field and enter a trigger value, then close the virtual keyboard.
6. Tap Accept to close the dialog box.
The dialog box closes and the parameter scale is now at the set values.
Using Zoom
The zoom options Data Buffer toolbar allow you to change the level of magnification of the sweep
when viewing graph data. Use the Zoom In (+) button to increase magnification, and the Zoom Out
(–) button to decrease magnification.
5.5.2 Codes Menu
This selection may appear as Codes, Codes Menu, Codes Only, codes (No Data), or something
similar on the menu. Selecting opens a list of data parameter viewing options that include:
•
•
•
•
Display Codes
Clear Codes
Freeze Frame/Failure Records
DTC Status
37
S3 Scanner Operations
Operations
Display Codes
Selecting either opens a list of diagnostic trouble codes (DTCs) stored in the selected electronic
control module (ECM), or a submenu of DTC viewing options. Submenu options include:
• Trouble Code Information—opens a list of codes in ECM memory
• History Codes—opens a list codes whose symptoms are not currently present. History codes
indicate an intermittently occurring problem.
• Failed This Ignition—opens a list of codes that set during the current ignition cycle.
• MIL SVS or Message Requested—displays ECM requests to light the malfunction indicator
lamp (MIL) or service vehicle soon (SVS) lamp, or display a driver information alert.
• Last Test Failed—displays a complete list of failed tests.
• Test Failed Since Code Cleared—displays a list failed tests that failed since the last time
codes were cleared from ECM memory.
A code list includes the DTC, a brief description, and a hyperlink to search for more detailed
information about the code in the Information module (Figure 5-18).
Figure 5-18 Sample code list
Tap a hyperlink, the “i” icon on the right edge of the screen, to open the Information module and
initiate a search.
Clear Codes
The Scanner clears trouble codes from the control module memory on some vehicles. If this
function is not available on the test vehicle, Clear Codes does not appear as a menu option.
z
To clear codes:
1. Select Clear Codes from the Codes Menu.
A confirmation message displays.
2. Make sure any conditions shown on the confirmation message are met, then select Yes.
A “codes cleared” message displays once the operation is complete.
38
S3 Scanner Operations
Operations
3. Select Continue to return to the Codes Menu.
Freeze Frame/Failure Records
This selection displays the DTC that was set, along with corresponding data, when the ECM
commanded the malfunction indicator lamp (MIL) to turn on.
DTC Status
This selection allows you to view the records of a particular DTC.
z
To check DTC status
1. Select DTC Status from the Codes Menu.
The DTC Status entry field displays and the virtual keyboard opens (Figure 5-19).
Figure 5-19 Sample DTC Status entry field
2. Use the virtual keyboard to enter the characters of the DTC.
3. Tap the virtual keyboard Backspace button if needed to erase a character.
4. Tap the virtual keyboard Return key once all the code characters are entered.
The DTC status report displays (Figure 5-20).
39
S3 Scanner Operations
Operations
Figure 5-20 Sample DTC status report
5. Tap Exit to return to the DTC status entry screen.
6. Tap Exit again to return to the Codes menu.
5.5.3 Functional Tests
The Functional Tests selection is used to access vehicle-specific subsystem and component
tests. Available tests vary by manufacturer, year, and model, and only the available tests display
in the menu.
There are four general types of functional test operations:
• Information Tests—are read-only tests, like selecting “VIN” from a Functional Tests menu to
display the VIN of the identified vehicle.
• Toggle Tests—switch a component, such as a solenoid, relay, or switch, between two
operating states.
• Variable Control Tests—command a certain value for a system or component, such as
varying the spark timing in 1° increments or the EGR valve duty cycle in 10% increments.
• Reset Tests—reset the adaptive, or learned, values that are stored in the control module.
Selecting Functional Tests opens a menu of test options that varies by make and model. Selecting
a menu option either activates the test or opens a submenu of additional choices. Follow all
screen instructions while performing tests. How and what information is presented on the screen
varies according to the type of test being performed.
40
S3 Scanner Operations
Operations
Figure 5-21 Sample functional test controls
Some toggle and variable control tests display functional test controls at the top of the screen with
data stream information below (Figure 5-21).
Functional test controls allow you manipulate the test signal as shown in Table 5-4.
Table 5-4 Functional test control buttons
Name
Button
Description
Test
Activates the test.
Return
Cancels the test.
Change List
Allows you to switch data lists.
Minus
Switches an item off or low, or incrementally reduces
a variable signal.
Plus
Switches an item high or on, or incrementally
increases a variable signal.
5.5.4 Generic Functions
The Generic Functions selection opens a menu of available OBD-II/EOBD functions on 1996
and newer vehicles. For additional information on generic function refer to the Global OBD Vehicle
Communications Software Manual. Menu options typically include:
• Readiness Monitors—displays the status of the OBD-II/EOBD required monitors
• ($02)Freeze Frame—displays data stored in ECM memory when a DTC is set
41
S3 Scanner Operations
•
•
•
•
•
•
•
Operations
($05) Oxygen Sensor Monitoring—displays on-board oxygen sensor monitoring test results
($06) Non-Continuous Monitors—displays the status of system monitors
($08) Request Control of On-Board System—establishes bidirectional ECM communication
($09) Calibration Identification—displays the ECM calibration identification numbers
($09) Calibration Verification umber—displays the ECM calibration
($09) In-Use Performance Tracking—displays a monitoring conditions report
($09) Vehicle Identification Number—displays the VIN
Refer to the Global OBD Vehicle Communications Software Manual for additional information.
5.5.5 Troubleshooter
Fast-Track® Troubleshooter is a database of experience-based information of validated
real-world repair strategies that have been compiled by top-notch technicians since 1988. The
Troubleshooter system simplifies the diagnosis process, as it contains information on virtually all
common diagnostic trouble code (DTC) problems and driveability symptoms for most vehicles
covered by the vehicle communication software.
Troubleshooter information is organized into a series of diagnostic tips that are designed to quickly
lead you to the root cause of a particular problem. The tips are vehicle-specific, which means only
tips that relate to the identified vehicle are presented.
Troubleshooter appears in a Scanner menu only if tips are available for the system selected on the
identified vehicle. Selecting opens a Troubleshooter Menu that typically includes:
• Code Tips—provides detailed information on setting conditions, testing, and interpreting test
results for specific codes.
• Symptom Tips—provides diagnostic tests and procedures based on vehicle operation.
• Time Savers—provides supplemental information, such as firing order and #1 cylinder
location, that may be needed to make a diagnosis.
• Common Problems—provides advice and remedies for certain “pattern failures” that have
been experienced on vehicles of the same model.
• Tests and Procedures—explains how to perform certain tests on the specific test vehicle.
Some tips provide specifications and installation information as well.
• Fast-Track Data Scan (Normal Values)—contains information and guidelines on how to
quickly validate data readings for certain sensors and actuators, live data values are provided
for comparison.
Certain live data parameter values display directly within the tip when performing Troubleshooter
tests and procedures. A tip may also contain a hyperlink to a Troubleshooter Reference, another
test or procedure, or a supplemental operation, such as Clear Codes. Hyperlinks are shown in
blue, and tapping them opens the link. Troubleshooter References open in a separate window.
(Figure 5-22).
42
S3 Scanner Operations
Operations
1— Live data values
2— Hyperlink
Figure 5-22 Sample data values within a Troubleshooter tip
5.5.6 Scanner Toolbar Operations
The Scanner toolbar is used to configure certain aspects of the displayed data and to exit. The
following sections explain how to use the toolbar.
Custom
The Custom button on the Scanner Toolbar is used to determine which specific parameters
display. Minimizing the number of parameters on the data list allows you to focus on any
suspicious or symptom-specific data parameters. You can add or remove most parameters from
the list. Certain vital parameters, such as RPM, cannot be removed. These appear in gray at the
top of the list along with a lock icon and cannot be selected.
IMPORTANT:
Limiting the number of parameters that displays to those that apply to a particular situation results
in a faster data refresh rate, and reduces the amount of memory used for saved files.
z
To create a custom data list:
1. Select Custom on the Scanner Toolbar.
The parameter selection dialog box opens (Figure 5-23).
2. Create a custom data list by tapping on the parameters to be included. A parameter that
displays is highlighted, a parameter that does not display is not. Keep the following in mind:
– Item at the top of the list that cannot be highlighted are locked and cannot be turned off.
– Drag the screen to scroll and view the entire list.
43
S3 Scanner Operations
Operations
– Use the Select All button to display the complete list.
– Use the Deselect All button to remove all of the highlights.
– Use the Cancel button to return to the data display.
Figure 5-23 Sample custom configuration screen
3. Select OK to display the updated data list.
Scale
The Scale button on the Scanner Toolbar switches the scale values, displayed along the left-hand side
of the graphs, on and off (Figure 5-24).
Figure 5-24 Sample data graph scales
44
S3 Scanner Operations
Operations
Sweep
The Sweep button on the Scanner Toolbar switches the sweep values, displayed below the graphs, on
and off (Figure 5-25).
Figure 5-25 Sample data graph sweep
Properties
The Properties button on the Scanner Toolbar is used to configure certain characteristics of the
parameter graph display. Selecting opens a Properties dialog box that allows you to adjust colors,
settings, and sweep (Figure 5-26).
Figure 5-26 Sample properties dialog box
Selecting either color option, Edit Plot Color or Edit Background Color, opens a standard color
selection dialog box. select a color, then tap OK to close the dialog box.
45
S3 Scanner Operations
Operations
The Show Grid button is used to switch a background grid pattern on the data graphs on and off:
• To switch the grid on; tap to highlight Show Grid, then tap Accept.
• To switch the grid off; tap Show Grid twice so it is not highlighted, then tap Accept.
The Samples After Trigger setting determines how many data samples are recorded following a
triggering event. The highlighted samples button indicates the number of frames that are included
in the recording after a triggering event.
The sweep options let you choose the amount of data that displays across the graph. Values are
in sample points, or frames of data. A frame of data equals one complete transmission of the serial
data by the control module.
Alarms
Alarms are visual indicators next to a parameter in the data display list that change color to show
the status of the signal. A red alarm indicates on, a gray alarm indicates off. Only parameters with
a range of two states, can have alarms. Parameters with continuous ranges, such as variable
voltage and pressure values, cannot have alarms.
The Alarms selection is used to configure visual indicators on certain digital data parameters. If a
vehicle does not provide signals for these functions, the alarm indicators are unused.
The alarm indicator assignments remain as selected until you exit the data list:
z
To configure alarm settings:
1. Select the Alarms button on the Scanner Toolbar.
The Alarm List dialog box opens.
2. Check the parameters that you want to show alarms.
3. Select Save List.
Alarm indicators now appear next to the selected parameters in the Data List. The indicators
are green when the value is high, and gray when the value is low (Figure 5-27).
Figure 5-27 Sample alarm indicators
46
S3 Scanner Operations
i
Exiting the Scanner
NOTE:
Alarms can only be set for certain parameters. If the Alarm List dialog box is empty, no parameters
are available and alarms cannot be set.
5.6 Exiting the Scanner
The Scanner remains open as long as there is an active communication link with the vehicle. You
must disconnect this communication link in order to exit from Scanner tests and close the
VERDICT Diagnostic Platform software. A warning message displays if you attempt to shut down
with the Scanner communicating.
i
z
NOTE:
Damage to the vehicle electronic control module (ECM) may occur if communication is disrupted.
Make sure the data cable and the USB cable are properly connected at all times during testing.
Exit all tests before disconnecting the test cable or powering down the tool.
To exit the Scanner:
1. From an active screen, select Exit from the Scanner Toolbar to return to the Systems Menu.
2. From the Systems Menu, select Back from the Scanner data menu.
A “stopping communications” message briefly displays followed by the Scanner main menu.
Now, the Scanner is no longer communicating with the vehicle and it is safe to return to the Home
screen and exit the VERDICT Diagnostic Platform.
5.7 Downloading Firmware
The internal programming of the Scanner Module, known as the firmware, can be updated using
the VERDICT D7 Display Device. Firmware updates increase the Scanner diagnostic capabilities,
typically by adding new tests, new models, or enhanced applications to the databases.
The display device automatically searches for available updates for all of the VERDICT
components when it is connected to the internet. Any updates that are found are downloaded and
stored on the device. However, the update must be installed in order to complete the process. This
section describes installing an update to the Scanner Module firmware.
When the display device has downloaded and stored a Scanner firmware update it displays a
notification message when Scanner is selected from the VERDICT Home screen (Figure 5-28).
Selecting OK from the firmware update message begins the process as explained in the following
procedure, selecting Cancel closes the message and launches the Scanner. Not updating the
firmware does not impact Scanner operations, the Scanner remains fully functional but may not
benefit from the additional features available in the update. Therefore, you can delay updating the
firmware until it is a convenient time to have your VERDICT out of service for a few minutes.
47
S3 Scanner Operations
Downloading Firmware
Figure 5-28 Firmware update available message
z
To update the firmware:
1. Power on the VERDICT D7 Display Device.
2. Connect the VERDICT S3 Scanner module to the D7 Display Device as follows (Figure 5-29):
a. From the bottom of the Scanner, gently lift up and out on the sides of the handgrip to free
it from Scanner housing.
b. Open the hinged cover on the base of the Scanner to expose the service ports.
c. Plug the small end of the USB cable into the USB port on the Scanner.
1— Hinged cover
2— USB port
Figure 5-29 Scanner service ports
d. Plug the large end of the USB cable into one of the ports on the side of the display device.
i
NOTE:
The Scanner and Display Device must be connected with the USB cable to update the firmware.
The USB cable also provides powers to the Scanner so there is no need to connect to a vehicle.
48
S3 Scanner Operations
Downloading Firmware
3. Select Scanner from the VERDICT D7 Display Device Home screen.
4. Select OK when the firmware update notification displays (Figure 5-28).
The firmware update begins and installation progress is tracked on the screen (Figure 5-30).
Figure 5-30 Sample update in progress screen
A “firmware has been successfully updated” message displays once the installation process
is complete (Figure 5-31).
Figure 5-31 Sample firmware update complete message
5. Select OK to close the message and return to Scanner operations.
The S3 Scanner Module, with the latest firmware update, is now ready to use.
49
Chapter 6
OBD Direct Operations
This Home screen option allows you to access Generic OBD-II Scanner tests without completing
a vehicle identification. This option presents a quick way to check for diagnostic trouble codes
(DTCs), isolate the cause of an illuminated malfunction indicator lamp (MIL), check monitor status
prior to emissions certification testing, verify repairs, and perform a number of other services that
are emissions-related. OBD Direct is also used for testing OBD-II compliant vehicles that are not
included in the Scanner databases.
OBD Direct is a Scanner function, and the Scanner Module must be connected to the test vehicle
and communicating with the display device. Keep in mind, this function provides generic OBD-II
information only. Select Scanner from the VERDICT Home screen for enhanced OBD-II functions.
Selecting OBD Direct on the VERDICT Home screen opens a menu with two options (Figure 6-1):
Figure 6-1 Sample OBD Direct main menu
6.1 OBD Health Check
The OBD Health Check offers a way to quickly check for and clear generic diagnostic trouble
codes (DTCs) and to check readiness monitors. Selecting OBD Health Check opens a submenu
of options (Figure 6-2).
50
OBD Direct Operations
OBD Health Check
Figure 6-2 Sample OBD Health Check menu
6.1.1 Global OBD II Code Check
This is option displays any stored emission related generic DTCs reported by the ECM. Selecting
this option opens a submenu with two choices: Codes and Pending Codes.
Select an option to display the code list. Refer to "Codes Menu‚" on page 37 and the Global OBD
Vehicle Communication Software Manual for additional information.
Codes
The Codes option displays a list of current emission related DTCs.
OBD-II Codes have a priority according to their emission severity, with higher priority codes
overwriting lower priority codes. The priority of the code determines the illumination of the MIL and
the code erase procedure. Vehicle manufacturers have implemented the ranking differently, so
there will be differences between makes.
Pending Codes
The purpose of this service is to enable the scan tool to obtain “pending” or maturing diagnostic
trouble codes. These are codes whose setting conditions were met during the last drive cycle, but
need to be met on two or more consecutive drive cycles before the DTC actually sets.
The intended use of this service is to assist the service technician after a vehicle repair and after
clearing diagnostic information, by reporting test results after a single driving cycle.
• If a test failed during the driving cycle, the DTC associated with that test is reported. If the
pending fault does not occur again within 40 to 80 warm-up cycles, the fault is automatically
cleared from memory.
51
OBD Direct Operations
OBD Health Check
• Test results reported by this service do not necessarily indicate a faulty component or system.
If test results indicate another failure after additional driving, then a DTC is set to indicate a
faulty component or system, and the MIL is illuminated.
6.1.2 Global OBD II Clear Codes
This option is used to clear all emission related diagnostic data such as, DTCs, freeze frame data,
and test results from the memory of the selected ECM. Although OBD Direct only displays generic
OBD-II data, clearing codes erases all of the stored data including any enhanced codes.
A confirmation screen displays when the clear codes option is selected to prevent accidental loss
of data. Select Yes on the confirmation screen to continue. Refer to "Codes Menu‚" on page 37
and the Global OBD Vehicle Communication Software Manual for additional information.
6.1.3 Readiness Monitors
Use this menu option to check the readiness of the monitoring system. An OBD-II system checks
the status of emission-related subsystems by running continuous or periodic tests. Test results are
shown in the data viewer (Figure 6-3).
Figure 6-3 Sample readiness monitor test report
Gesture sweep to view the entire list of Readiness Monitors to ensure that all tests are complete.
It is possible to print the readiness test status or save it as part of a Vehicle history.
6.1.4 Connector Information
This option opens a database of vehicle diagnostic connector locations that includes most makes
and models. The menu driven interface leads you quickly to the difficult to find test connector.
52
OBD Direct Operations
z
OBD Diagnose
To locate a vehicle diagnostic connector:
1. Select Connector Information from the System menu.
2. Select a manufacturer from the list presented.
3. Select a model from the list presented.
Instructions for which, if any, cable adapter or pin to use.
4. Select Continue.
Information on where to locate the vehicle diagnostic connector display (Figure 6-4).
Figure 6-4 Sample connector location message
5. Select Continue to return to the System menu.
6.2 OBD Diagnose
Selecting OBD Diagnose opens a menu with the following options:
• Start Communication—begins the test session
• Select Communication Protocol—allows you to select which protocol to use
• Connector Information—provides data link connector (DLC) location details for most models
6.2.1 Start Communication
Use the following procedure to conduct an OBD Direct test session:
z
To perform an OBD Direct Test:
1. Select Start Communications from the OBD Direct menu.
A generic connection message displays (Figure 6-5), connect the Scanner module to the
test vehicle as instructed.
53
OBD Direct Operations
OBD Diagnose
Figure 6-5 Sample generic connection message
2. Select Continue.
A communications message that shows how many ECMs were detected, Which ECM is
communicating, and which communication protocol is being used (Figure 6-6).
Figure 6-6 Sample communication message
3. Select Continue.
A menu of available tests displays, options include (Figure 6-7):
–
–
–
–
–
–
Readiness Monitors
MIL Status
Display Current Data ($01)
Clear Emissions Related Data ($4)
Display Freeze Frame Data ($02)
Display Trouble Codes ($03)
54
OBD Direct Operations
OBD Diagnose
– Display Test Parameter/Results ($05, 06, 07)
– Request Control of On-Board System ($8)
– Read Vehicle Identification ($09)
4. Select a test to continue.
Figure 6-7 Sample Start Communication menu
Readiness Monitors
Use this menu item to check the readiness of the monitoring system. If a monitor system is not
supported, it is not displayed. Scroll, if needed, to view the entire list of monitors. Selecting
Readiness Monitors opens a submenu with two choices:
• Monitors Complete Since DTC Cleared—displays the results of all monitor tests that have run
since the last time the electronic control module (ECM) memory was cleared.
• Monitors Complete This Cycle—displays only the results of monitor tests that ran during the
current drive cycle, they reset when the ignition is switched off.
MIL Status
This item is used to check the current condition of the Malfunction Indicator (MIL). Additional
information, such as which ECM commanded the MIL on and the distance driven while the MIL is
on (if supported), can also be displayed. It is also possible to print the MIL Status.
($01) Display Current Data
Use this item to display the current emission related data from the selected electronic control
module (ECM) of the vehicle. Displayed data includes analog inputs and outputs, digital inputs and
outputs, and system status information broadcast on the vehicle data stream.
55
OBD Direct Operations
OBD Diagnose
($02) Display Freeze Frame Data
This item is used to display freeze fame data for any stored emission related diagnostic trouble
codes (DTC). In most cases the stored frame is the last DTC that occurred. Certain DTCs, those
that have a greater impact on vehicle emission, have a higher priority. In these cases, the highest
priority DTC is the one for which the freeze frame records are retained.
Freeze frame data includes a “snapshot” of critical parameter values at the time the DTC set.
($03) Display Trouble Codes
This is used to display any stored emission related DTCs reported by the various ECMs.
($04) Clear Emissions Related Data
This item is used to clear all emission related diagnostic data such as, DTCs, freeze frame data,
and test results from the memory of the selected ECM.
($05, 06, 07) Display Test param./Results
This selection opens a submenu of test parameters and test results form various sensors, such as
the oxygen sensor (O2S), monitor test results, and a record of DTCs detected during the last drive
cycle. The menu includes:
• Oxygen Sensor Monitoring ($05)
• Specific Monitored Systems ($06)
• DTCs Detected During Last Drive ($07)
($08) Request Control of On-board System
This service enables bidirectional control of the ECM, that is the Scanner transmits control
commands to operate the vehicle system. This function is useful in determining how well the ECM
responds to a command.
Available options vary by make, model, and year of the test vehicle. Select a test and follow the
on-screen instructions.
($09) Read Vehicle Identification
This selection displays the vehicle identification number (VIN), the calibration identification, and
the calibration verification number (CVN) of the test vehicle.
($09) In-use Performance Tracking
This selection displays the “In-use Performance Tracking” of monitored data. It is basically a
record of the number of times each of the monitor tests have been completed.
56
OBD Direct Operations
OBD Diagnose
6.2.2 Select Communication Protocol
A communication protocol is a standardized way of data communication between an ECM and a
scan tool. Global OBD may use the following communication protocols:
•
•
•
•
•
ISO 9141-2 (K-LINE)
SAE J1850 PWM (Pulse Width Modulation)
SAE J1850 VPW (Variable Pulse Width)
ISO 14230-4 (Keyword Protocol 2000)
SAE J2284/ISO 15765-4 (CAN)
Touch Select Communication Protocol to open a menu of options (Figure 6-8).
Figure 6-8 Sample communication protocol menu
When the All Protocols setting is used the Scanner attempts to establish communication using
each protocol on order to determine which one the vehicle is broadcasting on.
6.2.3 Connector Information
This option opens the same database of vehicle diagnostic connector locations as discussed for
OBD Health Check testing. Refer to "Connector Information‚" on page 52.
57
Chapter 7
Component Test Operations
The Component Test software is a component-testing powerhouse, providing you with a robust
diagnostic database for use with scopes and meters. It is like having access to a complete library
of shop manuals for testing engine-management components, transmission sensors and
components, and ABS systems.
Component Test helps you with everything from selecting the appropriate test for a specific
component to showing the hook-up location and correct pin configuration. This software
thoroughly guides and instructs you on proper testing procedures and offers tips from the internal
troubleshooter database. The component test procedures, tips, and meter settings reduce your
overall set-up and diagnostic testing time. Vehicle-specific component tests are provided for
engine, transmission, ABS, charging, transfer case and suspension systems.
&$87,21
Risk of electrical shock.
• Read the Important Safety Instructions document provided separately for messages on
the safe use of this product.
• This product is intended for Measurement Category I (for example, automotive 12V
systems), do not use this product for Measurement Categories II, III, and IV.
• Measurement Category I is for performing measurements on circuits not directly
connected to MAINS or MAINS circuits (an example of a MAINS circuit is 120V AC or
240V AC household or industrial electricity), do not connect this product to MAINS or
MAINS circuits.
• Maximum rated transient over voltage impulse is 500 volts, do not exceed the rated
transient over voltage.
Electrical shock can cause personal injury, equipment damage, or circuit damage.
7.1 Vehicle Identification
The component test information presented is specific to the vehicle being tested. Therefore,
certain attributes of the test vehicle must be entered into the VERDICT unit so that the correct data
can be retrieved. Vehicle identification information is carried over if you enter the Component Test
module either from the Scanner module or from one of the records stored in the Vehicle History
module. However, you may need to enter additional attributes in some instances.
The vehicle identification sequence is menu driven, you simply follow the screen prompts and
make a series of choices. Each selection you make advances you to the next screen.
7.1.1 Creating a Favorites List
Once a Component Test database is loaded, a list of manufacturers displays. This list is often long
and includes makes that are not frequently used. A toolbar at the top of the screen allows you to
custom configure the manufacturer list to display only the makes you frequently service.
58
Component Test Operations
Vehicle Identification
Figure 7-1 Sample manufacturer list
z
To custom configure the manufacturer list:
1. Tap Configure Favorites on the toolbar.
A list of selectable manufacturers displays.
Figure 7-2 Sample Configure Favorites screen
2. Tap each manufacturer you want to include, selected manufactures are highlighted.
i
NOTE:
Manufacturers appear on the favorites list in the order in which they are selected. Therefore, if you
select the makes you work on most frequently first, they will appear at the top of the list.
3. Tap Finished on the toolbar once your selections have been made.
The screen returns to the manufacturer list, but only the makes you selected display. Note the
“Favorites” toolbar selection now reads “Full list”.
59
Component Test Operations
Vehicle Identification
4. Tap Full List on the toolbar to view the complete list of manufacturers.
5. Tap Back on the tool bar at any time to return to the previous screen.
Your favorites list is what will display whenever a Component Test database is launched in the
future. The list can be modified at any time by selecting Configure Favorites from the toolbar.
7.1.2 Identifying a Test Vehicle
Exact procedures to identify the test vehicle may vary somewhat by vehicle and market. The
following procedure, which identifies a 2008 Ford Focus for testing the fuel injection system, is
typical of what to expect.
z
To identify a vehicle for Component Test:
1. Tap the Component Test module button from the Home screen.
2. Select which database to load for the test vehicle if requested (optional).
After the database loads, a list of manufacturers displays.
3. Select FORD and a list of systems available for testing displays (Figure 7-3).
Figure 7-3 Sample available systems menu
4. Select FUEL INJECTION and a model year menu displays.
5. Select 2008 from the year menu and a list of available models displays.
6. Select FOCUS from the model list and a list of available engines displays.
7. Select 2.0L ZETEC from the engine list and a confirmation dialog box displays (Figure 7-4).
60
Component Test Operations
Vehicle Identification
Figure 7-4 Sample confirmation dialog box
8. From the Confirm vehicle details dialog box, select Ok to continue, or Cancel to return to the
engine list.
9. A list of tests available for the identified vehicle displays, select a test to continue (Figure 7-5).
Figure 7-5 Sample available tests list
The identification sequence is now complete, refer to the Operations section that follows for
details on how to navigate through the Component Test information and perform tests.
i
NOTE:
If you return to the Home screen and select Scanner or Information the vehicle identification
entered here is carried over. However, additional information may be needed in some instances.
61
Component Test Operations
Operations
7.2 Operations
The Component Test software provides vehicle specific component test procedures and
information that aid in setting up scopes and meters. Once a test vehicle is identified, you can
select a component test from the list of available tests. For most selections two main choices are
available on the component menu:
1. COMPONENT INFORMATION—provides information on the selected component and
connector pin details that assists you in understanding the components prior to diagnosis.
2. TESTS—provides a pre-configured list of tests, guides you through performing the tests, and
offers tips and resources to reduce setup and testing time.
7.2.1 Component Information
Component Information provides details on specific vehicle components to provide a better
understanding the components prior to diagnosis.
The Component Information screens contain information to assist you with testing. The screens
are divided in sections to help quickly guide you to the correct information (Figure 7-6):
Figure 7-6 Sample Component Information screen
•
•
•
•
z
Operation—provides a general description of normal component operation.
Connector—displays the component connector and lists pin assignments.
Location—identifies the component location and the best place for testing it.
Tech note—provides component test-related tips (for example, common failures or faults) as
well as update or recall information.
To view component information:
1. Select a component from the tests list.
2. Select COMPONENT INFORMATION from the component menu.
62
Component Test Operations
i
Operations
NOTE:
An additional selection, such as front or rear for an oxygen sensor (O2S), may be required before
advancing to the component information screen.
The component information screen displays (Figure 7-6). A scroll indicator along the right
edge of the screen appears if there is additional information below what is on the screen.
3. Gesture sweep to view any additional information.
4. Select Back at any time to return to the previous screen.
7.2.2 Tests
The Tests section guides you through the process of performing test on a specific component. It
also provides specifications, tips on how and where to connect the test meter leads, and also
configures the multimeter or lab scope to perform the selected test.
Once a test vehicle is identified, you can select a component from the available tests list.
z
To select a test:
1. Select a component from the list.
2. Select TEST to open the list.
i
NOTE:
More than one selection is available in some instances. For example, a primary and a secondary
tests selection display when ignition tests is selected.
The list shows all of the tests available for the selected component, choices vary by make,
model, and year.
Some tests, such as O2S voltage, open an additional submenu similar to the one shown in
Figure 7-7 when more than one option is available.
Figure 7-7 Sample O2S voltage test submenu
63
Component Test Operations
Operations
3. Select a test option and the test screen displays (Figure 7-8).
Figure 7-8 Sample Test screen
A scroll indicator along the right edge of the screen appears if there is additional information
below what is on the screen.
4. Gesture sweep to view any additional information.
5. Select Back at any time to return to the previous screen, or select Exit to return to the main
component menu.
Hyperlinks
Component test screens contain hyperlinks that either take you to another page that contains
additional information or open an additional window on top of the current screen. Hyperlinks
display as blue lettering with an underline, the color changes once the link has been selected.
Common hyperlinks are:
– View Meter—opens a live meter set up to perform the test in the lower portion of the
screen (Figure 7-9). Once the meter view is open, the Component Test toolbar at the top
of the screen is replaced by the Scope Multimeter toolbar, which allows you to make
adjustments to the settings. See “Scope Multimeter Toolbar” on page 93 for details.
– Show More Information—advances to a new screen with more detailed information
about a particular test, select Back to return to the test screen.
View Meter
A Meter button, which is only available in the Component Test view meter mode, appears on the
upper toolbar (Figure 7-9).
64
Component Test Operations
Operations
Figure 7-9 Sample view meter window
Three view meter options are available:
1. With View Meter active (Figure 7-9), tap the toolbar Meter button once and the meter expands
to fill the entire screen.
2. Tap the Meter button a second time and the meter open as a separate window (Figure 7-10).
This window can remain open if you switch to the Scanner module and can be accessed from
the Windows toolbar at the bottom of the screen. You can also resize and reposition the meter
window on the screen.
Figure 7-10 Sample meter view in a separate window
3. Tap the Meter button a third time to close the window and return to the standard view as
shown in Figure 7-9.
4. There are two ways to close meter view and return to the Component Test screen:
– Tap the Close button (red box with an X) on the Scope Viewer toolbar.
– Select More > Exit from the Component Test toolbar.
65
Component Test Operations
Operations
Connecting to a Test Vehicle
Before performing a test, you must connect the meter test leads to the vehicle. Certain component
tests require the use of specific leads. Information on specific leads and other connecting
information displays in the initial test screen. Follow the on-screen connection instructions in the
test procedure and support sections to connect the test leads.
Performing a Test
Once you connect the test leads to the vehicle, you can proceed with testing.
z
To perform component tests:
1. Follow the instructions display in the test procedure section.
2. Gesture sweep to view all of the instructions and follow the on-screen procedures.
3. Select the View Meter hyperlink to display test results.
4. Refer to the on-screen information to verify test results.
IMPORTANT:
Refer to “Scope Multimeter Operations” on page 89 for additional information on working with the
View Meter window.
66
Chapter 8
M2 Data Acquisition Device
This chapter discusses how to use the hardware controls and features, and how to download and
install software updates for the VERDICT M2 Data Acquisition Module.
8.1 Controls, and Features
There are two sets of controls for the M2 Data Acquisition Device:
1— Soft Keys—select test functions, which vary depending upon the Rotary Switch position
2— Rotary Switch—establishes the primary operation of the unit
Figure 8-1 VERDICT M2 controls
The following sections describe the external controls and features of the M2 unit.
8.1.1 Rotary Selector Switch
The VERDICT M2 is a combination digital-multimeter (DMM) and waveform viewer, capable of
reading volts (AC and DC), resistance (ohms), capacitance (farads), continuity, diode forward
voltages, and external auxiliary probes, as well as viewing dynamic voltage graphs (waveforms).
The Rotary Selector Switch on the front panel determines which measurements are taken.
67
M2 Data Acquisition Device
Controls, and Features
The available functions are represented by graphic icons on the face of the tool. Descriptions of
the functions are given in the following table:
Table 8-1 Data Acquisition Device rotary switch settings
Function
Icon
Description
Off
Switches power to the M2 unit off. The switch
should be in this position when the tool is not
being used to prevent battery drain.
Volts DC
Measures direct current (DC) voltages within a
range of zero to 1000 volts. This setting is also
used to measure frequency (hertz), duty cycle
(%), and time period (cycle, ms).
Volts AC
Measures alternating current (AC) voltages
within a range of zero to 1000 volts. This setting
is also used to measure frequency (hertz), duty
cycle (%), and time period (cycle, ms).
Resistance
Measures the DC resistance to current in ohms
in a range of zero to open circuit (infinite).
Continuity/
Diode Check
Performs dual tests; circuit continuity and diode
test (forward drop). The “S” (special function)
soft key switches between the two tests.
Auxiliary
Performs three auxiliary tests; current
(amperes), pressure, and temperature. The “S”
(special functions) soft key switches between
the three tests. Pre-approved sensors must be
used in order to take valid measurements.
Capacitance
Measures capacitance in nanofarad (nF),
millifarad (mF), and microfarad (µF).
Oscilloscope
(Waveform Viewer)
Configures the M2 unit to perform as one or two
channel oscilloscope, or waveform viewer.
Remote Functions
Configures the M2 unit to be operated through
the Display Device. Readings are also shown
on the Display Device screen. All of the controls
on the from panel of the M2 unit become
inoperative when the rotary switch is in this
position.
8.1.2 Soft Keys
The eight soft keys located above the rotary dial on the M2 unit are used to initiate a variety of
additional functions while performing meter tests. The functionality of the soft keys varies
according to what type of tests are being performed, as determined by the position of the rotary
switch. Some of the soft keys do not function for certain test modes.
68
M2 Data Acquisition Device
Digital Multimeter Operations
The table below gives a brief general description of soft key operations, the “Mode” column lists
the tests during which the key is active. More detailed information is found in the categorical
sections that follow.
Table 8-2 Data Acquisition Device Soft Key functions
Name
Key
Description
Mode
F1
Switches the displayed value between a
“normal” and relative reading.
Volts DC,
Volts AC,
Resistance,
Auxiliary
F2
Freezes, or pauses, the data being displayed.
A second push returns the display to live data.
All except
Continuity and
Diode Check
F3
Changes the measurement range when
operating in the Volts DC, Volts AC, Resistance,
Auxiliary, or capacitance range. Changes the
time base when operating in the graph mode.
Volts DC,
Volts AC,
Resistance,
Capacitance
F4
Select special functions when operating in
oscilloscope mode.
Waveform Viewer
S
The Special Functions key switches the
displayed value between frequency, duty cycle,
and pulse width, and selects a continuity or
diode test. Also selects submenus when
operating in oscilloscope mode.
Volts DC,
Volts AC,
Waveform Viewer
Min/Max
The Min/Max key displays the minimum and
maximum sampled signal values along with the
current value.
All except
Continuity and
Diode Check,
Capacitance
Range
The Range key switches between the precision
of the displayed value between the four
available ranges.
All
Graph
The Graph key switches the display from a
digital readout to a histogram, or graph.
Volts DC,
Volts AC,
Resistance,
Auxiliary
In general, a short or momentary push of a soft key activates the assigned function, a long push
returns to the normal display.
8.2 Digital Multimeter Operations
This section details the digital multi-meter (DMM) features available based on the Rotary Selector
Switch position.
8.2.1 Volts DC
The Volts DC setting is used for measuring direct current (DC) voltages within a range of zero to
1000 volts, frequency, duty cycle, and pulse width.
69
M2 Data Acquisition Device
Digital Multimeter Operations
Figure 8-2 Volts DC selected
A typical Volts DC screen with Min/Max active is shown in Figure 8-3. Note the functions of the F1,
F2, and F3 soft keys are shown at the bottom of the display screen. The F4 soft key is not
operational in the Volts DC mode, although the beeper does sound if the key is pressed.
7%$
3&-
3&'
7
'
3FMBUJWF
'
'SFF[F
7
'
3BOHF
'
Figure 8-3 Sample Volts DC screen
F1 Key, Relative
The lower numbers shown in Figure 8-3 do not display when you first select the Volts DC function.
The DMM takes a “snapshot” of the current reading and holds it on the display when the F1 key is
momentarily pressed. A “relative” value, which is continuously updated and shows the relationship
between the initial reading and the most current reading, now displays as well. Additional
momentary presses of the F1 key record new snapshots that replace the previous base reading.
Press and hold the F1 key to cancel the relative function.
70
M2 Data Acquisition Device
Digital Multimeter Operations
Alternate F1 Menu
There is a special alternate menu that is available by pressing and holding the F1 key for several
seconds while in Volts DC mode (Figure 8-4). This menu allows your to modify three settings:
• Beeper functions
• Display backlighting
• Display screen colors
7%$
.*/
."9
7
'
'
7
'
'
Figure 8-4 Sample active menu select mode screen
Each of these operations are explained below, a second long press of the F1 key returns the
display to the normal mode. The F4 key is nonfunctional in the alternate menu mode.
Pressing F1 from the alternate menu switches the internal beeper used for the continuity test and
to indicate soft key pushes on and off. The beeper function remains “on” to indicate low battery
conditions and other special functions like loss of contact with the remote device.
Pressing F2 from the alternate menu changes the intensity of the LCD display backlight. Each key
push advances to the next level of intensity, then returns to the lowest level once maximum
brightness is reached. The backlight never turns completely off. There are five intensity levels for
the backlight.
Pressing F3 from the alternate menu switches between the two available combinations of screen
background and character colors. One is light characters on a dark background and the other is
dark on light.
F2 Key, Freeze
A press of the F2 key freezes, or so that the displayed value remains static. A second press of the
F2 key returns to unit to normal operation. This function is available in normal and relative modes.
F3 Key and Range Key
Pressing the F3 and Range keys changes the measuring range. Measuring ranges vary by which
function (Volts DC, Volts AC, Resistance, Auxiliary) is selected. A long press of the F3 or Range key
returns to unit to auto-range operation. This function is available in normal and relative modes.
71
M2 Data Acquisition Device
Digital Multimeter Operations
Min/Max Key
Press the Min/Max key and the display shows both the instantaneous voltage reading and the
minimum and maximum voltages that occurred since the last time the key was pressed. See
"Sample active menu select mode screen‚" on page 71.
The displayed values continue to update until the Min/Max key is pressed again, then:
• A short press of the Min/Max key resets the readings
• A long press of the Min/Max key returns to normal Volts DC mode.
S Key, Special Functions
The S key is used to activate special time measurement functions available when sampling
voltage. Each press of the S key advances to the next function in the following order:
1. The screen changes to show the frequency, period, and duty cycle of the test signal.
2. The screen changes to show the frequency, period, and pulse width of the test signal.
i
NOTE:
Press and hold the S key at any time to instantly return the display to a voltage reading.
In this special time measurement mode, the readings shown on the screen are integrated, or
filtered. This means that the displayed values show average time-based measurements with great
accuracy, but do not capture fast signal anomalies such as instantaneous “glitches” or timing
shifts. However, these types of fast signal changes can be seen using the Graph key.
Graphing Voltage Measurement Screens
The VERDICT M2 can generate a graphical history of a voltage signal over time, which is called a
histogram. Pressing the Graph button when operating in Volts DC or Volts AC range causes the
display to change from a digital reading to a graphical display.
While viewing a histogram, the function keys operate as follows:
• F1—switches peak detection on and off
• F2—freezes and unfreezes the histogram (pauses and resumes data collection).
• F3—incrementally increases the measurement range. The Range key incrementally
decreases the measurement range.
• F4—incrementally increases the timescale of the histogram. The Graph key incrementally
decreases the timescale.
A digital value of the signal displays in the upper-right corner of the display while operating in
graphing mode.
Graphing with Min/Max Function
In the Volts DC graphing function you can capture and store the minimum and maximum voltages
by pressing the Min/Max soft key. The readings appear in the upper-left portion of the LCD. The
VERDICT M2 device captures and reports very fast events (as fast as 50 microseconds) in this
mode, which is only available in Volts DC.
72
M2 Data Acquisition Device
Digital Multimeter Operations
Press the Min/Max key and the display shows both the instantaneous voltage reading (large
characters) and the minimum and maximum voltages that occurred since the last time the key was
pressed. The displayed values continue to update until the “Min/Max” key is pressed again. Then
the values reset the readings on the display begin the process again. Press and hold the Min/Max
key to cancel this function, and return to the normal volts DC mode.
z
To exit graph mode:
• Press and hold the Graph key for two seconds.
Graphing Time-Based Measurement Screens
z
To access time-based measurement graphs:
1. Press the Graph key.
2. Press the S key.
The VERDICT M2 is now in time-based measurement mode.
In this mode, the VERDICT M2 uses a specialized strategy called “cycle-by-cycle” (C-B-C)
time-based measurements to capture signal glitches. To do this, the VERDICT M2 unit examines
each cycle of the signal under test, calculates its period, duty cycle and pulse width, and generates
a graphical history of that signal (called a histogram). Any significant variation of the signal is
visible on the histogram.
When you initially enter this mode, the system shows frequency histograms (the default setting).
A press of the S key switches the display from frequency to duty cycle. A second press of the
S key switches the display from duty cycle for pulse width.
There three items displayed on the LCD in the graph mode:
• A histogram of the signal being measured displays across the screen
• The averaged result of the timing measurement appears on the upper-right side of the screen
• The minimum and maximum value readings display on the upper-left side of the screen (after
first pressing the Min/Max key).
Range
A press of either the Range or F3 key takes the meter out of the automatic voltage scale function
and allows you to change the voltage scale or resolution. Subsequent key presses switches the
display between the available ranges. Press and hold the Range key to cancel this function and
return to automatic range operation.
73
M2 Data Acquisition Device
Digital Multimeter Operations
8.2.2 Volts AC
Figure 8-5 Volts AC selected
When sampling AC voltage the soft keys function the much the same as for DC voltage. However,
there are some differences. Brief explanations are provided below, refer to "Volts DC‚" on page 69
for more detailed descriptions.
F1 Key
The F1 key switches between normal and relative readings. A short push of the key resets the
reading, a long push opens the alternate menu.
F2 Key
A single press of the F2 key pauses, or freezes, the displayed voltage. A second press returns the
display to normal mode.
F3 Key
Short pushes of the F3 and Range keys incrementally increase and decrease the selected
measurement range respectively. These keys are active in both the standard Volts AC and
histogram modes.
F4 Key
The F4 key is nonfunctional in this mode.
S Key
Pressing the S key activates the time management functions to display frequency, duty cycle, and
pulse width. A long press of the key returns to the normal display mode.
74
M2 Data Acquisition Device
Digital Multimeter Operations
Min/Max Key
Pressing the Min/Max key causes minimum and maximum readings to display along with the
current value. A long press of the key returns to the normal display mode.
Range Key
A press of the F3 or Range keys changes the voltage scale or resolution of the display. Each key
press incrementally advances through the available settings. A long press of the Range key
returns to display to the automatic range.
Graph Key
Pushing the Graph key generates a histogram that graphically shows the various values of the
voltage measurements taken.
The Range and F3 keys can be used to change the measurement range. When Range is pressed,
the current histogram erases and a new graph starts building from zero.
Pressing the F4 and Graph keys while in Graph mode changes the sweep rate, or the time
represented by the width of the screen.
A “long press” of the “Graph” key returns the unit to the normal “Volts AC” function.
8.2.3 Resistance
This setting allows you to measures the DC resistance to current in ohms. When sampling
resistance the soft keys function much the same as for DC or AC voltage. Brief explanations are
provided below, refer to "Volts DC‚" on page 69 for more detailed descriptions.
Figure 8-6 Resistance selected
F1 Key
The F1 key switches between normal and relative readings. A short push of the key resets the
reading, a long push opens the alternate menu.
75
M2 Data Acquisition Device
Digital Multimeter Operations
F2 Key
A single press of the F2 key pauses, or freezes, the displayed value. A second press returns the
display to normal mode.
F3 Key and Range Key
A short push of the F3 or Range key changes the selected measurement range.
F4 Key and S Key
The F4 and S Keys are nonfunctional in this mode.
Min/Max Key
Pressing the Min/Max key causes minimum and maximum readings to display along with the
current value. A long press of the key returns to the normal display mode.
8.2.4 Continuity and Diode Check
This setting allows you to perform circuit continuity tests, and perform a forward drop test to check
the operation of a diode.
Figure 8-7 Continuity and diode check selected
The S key is the only soft key that is operational in continuity and diode mode. Pressing the S key
switches between the continuity test and diode test settings. Continuity is the default setting.
When testing continuity, the M2 unit sounds a beep if a short circuit is detected (continuity between
the two test leads).
When testing a diode, the M2 unit induces a current to the device under test and measures the
resultant voltage drop across the device.
76
M2 Data Acquisition Device
Digital Multimeter Operations
8.2.5 Auxiliary
This selection allows you to select between three auxiliary tests; current (amperes), temperature,
and pressure. Approved probes, sensors, and transducers must be used in order to obtain valid
measurements.
Figure 8-8 Sample auxiliary selected
Brief explanations of the soft key functions are provided below, refer to "Volts DC‚" on page 69 for
more detailed descriptions.
F1 Key
The F1 key switches between normal and relative readings. A short push of the key resets the
reading, a long push opens the alternate menu.
F2 Key
A single press of the F2 key pauses, or freezes, the displayed value. A second press returns the
display to normal mode.
F3 Key and Range Key
The F3 and Range keys select the measurement range, which varies with the selected function:
• Current—switches the scale between available settings for AC Amp and DC Amp probes.
• Temperature—switches between displaying degrees Celsius and degrees Fahrenheit.
• Pressure—switches between displaying pressure as pounds-per-square-inch (PSI) and
vacuum as inches-of-mercury (inHg).
F4 Key
The F4 key is nonfunctional in this mode.
77
M2 Data Acquisition Device
Digital Multimeter Operations
S Key
The S key is used to switch between the three different test modes (amperage, temperature, and
pressure) available in the auxiliary setting. Each key press advances to the next available mode.
Min/Max Key
Pressing the Min/Max key causes minimum and maximum readings to display along with the
current value. A long press of the key returns to the normal display mode.
Graph Key
Pushing the Graph key generates a histogram that graphically shows the various values of the
measurements taken.
The Range and F3 keys can be used to change the measurement range. When Range is pressed,
the current histogram erases and a new graph starts building from zero.
Pressing the F4 and Graph keys while in Graph mode changes the sweep rate, or the time
represented by the width of the screen.
A “long press” of the “Graph” key returns the unit to the normal “Auxiliary” function.
8.2.6 Capacitance
This selection is used to measure capacitance.
Figure 8-9 Sample capacitance selected
F1 Key
Relative readings are not available in this mode. A short push of the F1 key does cause a beep to
sound, but the display remains unchanged. A long push of the F1 key opens the alternate menu.
78
M2 Data Acquisition Device
Digital Multimeter Operations
F2 Key
A single press of the F2 key pauses, or freezes, the displayed value. A second press returns the
display to normal mode.
F3 Key and Range Key
The F3 and Range keys select the measurement range.
F4 Key, S Key, Min/Max Key, and Graph Key
The F4, S, Min/Max, and Graph keys are nonfunctional in this mode.
8.2.7 Oscilloscope
The data acquisition device has the ability to provide a two-channel oscilloscope, or waveform
viewer. The viewer becomes active when the rotary switch is turned to the “scope” position.
Figure 8-10 Sample scope setting
Soft key functions are unique when performing oscilloscope tests. In this mode there are seven
available setting ranges for the F2, F3, and F4 keys. Pressing the F1 key scrolls up through the list
of settings, and pressing the S key scrolls down through the list. The F1 area on the screen shows
which of the six settings is currently active (Figure 8-11). Available scope functions are shown in
the table below:
Setting
F1 Key
S Key
F2 Key
Display
Freeze
F3 Key
F4 Key
Scale
Time
Trigger
Slope
Level
Channel
Preset A
GCI&S†
LF AC†
HF AC†
Scroll down PCI&S†
LF DS†
HF DS†
Special
Preset B
Peak
Invert
Coupling
Position
Move Ch1 Trace
Move Ch2 Trace
Not Used
Channel
Display Ch1
Display Ch2
Check scales
Scroll up
† See page 82 for acronym definitions
79
M2 Data Acquisition Device
Digital Multimeter Operations
Display Selections
With the scope in the display mode the soft keys perform the following functions:
• F2—the first press pauses data collection to allow closer examination of the waveform, the
second press restores data collection.
• F3 and Range—each press of the F3 key advances up to the next available scale, which is
the value of the voltage displayed vertically on the screen. The currently selected scale is
shown at the top of the screen. The Range key moves incrementally down through the list of
available scales.
• F4 and Graph—each press of the F4 key advances to the next timebase, or sweep rate,
which is the time represented on the width of the display. The currently selected timebase is
shown at the top of the screen. Use the Graph key to move incrementally down through the
list of available time bases. Press and hold the F4 key to return to the default setting.
9'LY
&+
'&
P6
9
7$872
7&+
7
'
%JTQMBZ
'
'SFF[F
'
4DBMF
'
5JNF
1— Mode
2— Scale
3— Timebase
Figure 8-11 Sample display screen
Trigger Selections
Triggering allows you to set the scope so that it begins sampling and displaying a trace once
predetermined signal conditions, or triggers, are met. Triggering produces a much more stable
waveform. The trace always begins at the trigger point, so the image does not appear to flicker or
drift as it updates.
80
M2 Data Acquisition Device
Digital Multimeter Operations
9'LY
&+
'&
P6
9
7$872
7&+
7
'
'
5SJHHFS
4MPQF
'
-FWFM
'
$IBOOFM
1— Mode
2— Trigger channel
3— Trigger slope
4— Trigger level
Figure 8-12 Sample trigger screen
With the scope in the trigger mode the soft keys perform the following functions:
• F2 Slope—pressing the F2 key switches triggering back and forth between the rising
(positive) edge and trailing (negative) edge of the waveform. A graphic in the upper-right
corner of the display screen shows the currently selected slope.
• F3 Level—short presses of the F3 key incrementally increase the trigger voltage level. An
indicator to the right of the screen graph shows the current trigger voltage level. Short presses
of the Range key incrementally decrease the trigger voltage level. Press and hold either key
(F3 or Range) to return to the default setting.
• F4 Channel—a press of the F4 key switches triggering between channel 1 (CH1) and channel
2 (CH2). The channel currently selected for triggering is shown at the top of the screen.
i
NOTE:
Triggering is not available when the timebase setting is between 1 second and 10 seconds.
Preset Selections
These options allow you to select from already configured scope setups for commonly tested
items. Six preset configurations are available; three for Preset A and three for Preset B. These
preset conditions are permanent and cannot be erased or modified. However, you can construct
and store additional presets within the D7 Display Device as explained in the Scope and
Multimeter chapter of this manual.
81
M2 Data Acquisition Device
Digital Multimeter Operations
9'LY
&+
'&
P6
9
7$872
7&+
7
'
1SFTFU"
'
($*4
'
-'"$
'
)'"$
Figure 8-13 Sample preset (Preset A, F2) screen
z
To select a preset:
1. Use the F1 or S key to navigate to either Preset A or Preset B.
2. Press F2, F3, or F4 to load the desired preset.
The selected preset loads and the meter is ready for testing.
The F2, F3, and F4 fields on the screen are acronyms for the type of test the preset is configured
to perform. Interpret as follows:
• Preset A:
– CGI&S—ground controlled injectors and solenoids
– LF AC—low frequency alternating current signals
– HF AC—high frequency alternating current signals
• Preset B:
– PCI&S—power controlled injectors and solenoids
– LF DS—low frequency digital signals
– HF DS—high frequency digital signals
Values for the available presets are shown in the table below.
Selection
Preset A
Preset B
Position
Timebase
Scale
Trigger
Coupling
Slope
F2 (CGIS)
10 mS
50 Volts
8 Volts
DC
Negative
F3 (LF AC)
50 mS
20 Volts
0 Volt
AC
Positive
F4 (HF AC)
10 mS
20 Volts
0 Volt
AC
Positive
F2 (PCI&S)
10 mS
50 Volts
8 Volt
DC
Positive
F3 (LF DS)
50 mS
20 Volts
3 Volt
DC
Positive
F4 (HFDS)
10 mS
20 Volts
3 Volt
DC
Positive
Special Selections
The Special settings allow you to alter the way the trace is displayed in order to readily spot signal
anomalies and to compare signals. A short push of the F2, F3, or F4 key activates the indicated
special mode, a long push of the key cancels the special mode.
82
M2 Data Acquisition Device
Digital Multimeter Operations
9'LY
&+
3
'&
P6
9
7$872
7&+
7
'
4QFDJBM
'
1FBL
'
*OWFSU
'
$PVQMJOH
Figure 8-14 Sample special selections screen with peak capture on
Peak
Pressing the F2 key switches on the peak capture function, which allows you to see very fast
signal transitions or glitches. When peak capture is active, “P1” displays at the top of the screen.
During normal operation, the scope collects just enough data samples to plot a waveform across
the screen. When peak is active the scope samples data at the maximum highest rate, which
collects more data than what is needed to simply construct a waveform across the screen.
Therefore, any signal glitches or fast events are captured.
Invert
Pressing the F3 key inverts, or switches, the polarity of the signal trace so that it appears
upsidedown on the screen. This is typically used to sample amperage or high-voltage signals.
Coupling
Pressing the F4 key switches the input to the meter from DC coupling (default) to AC coupling. In
this mode the average value of the waveform is subtracted so that small signal variations become
apparent. AC coupling blocks the DC portions of an input signal in order to amplify the AC portions
without driving them off of the screen. Use for viewing alternator ripple or fuel pump amperage.
Position Selections
The Position selections allow you to reposition the baselines of the channel 1 and channel 2 traces
vertically on the screen.
83
M2 Data Acquisition Device
Digital Multimeter Operations
9'LY
&+
P6
'&
9
7$872
7&+
7
'
1PTJUJPO
'
7$I
'
7$I
'
Figure 8-15 Sample screen with both traces repositioned
Channel 1 Trace
Use the F2 and Min/Max keys to reposition the channel 1 trace as follows:
•
•
•
•
Short pushes of the F2 key moves the trace incrementally up.
A long push of the F2 key places the trace at the midpoint of the scale.
Short pushes of the Min/Max key moves the trace incrementally down.
A long push of the Min/Max key places the trace at 10% of the scale.
Channel 2 Trace
Use the F3 and Range keys to reposition the channel 2 trace as follows:
•
•
•
•
Short pushes of the F3 key moves the trace incrementally up.
A long push of the F3 key places the trace at the midpoint of the scale.
Short pushes of the Range key moves the trace incrementally down.
A long push of the Range key places the trace at 10% of the scale.
Channel Selections
The channel selection mode allows you to switch the trace on and off. The F2 key controls the
channel 1 trace and the F3 key controls the channel 2 trace. Pressing the key the first time turns
this channel “off” and the sweep signal is removed from the display. Pressing the key a second
time puts this channel back onto the display. The previous characteristics for this channel are
saved during this process. The indicator at the base of the screen appears as inverse video (white
lettering on a black background) when a channel is on.
84
M2 Data Acquisition Device
Digital Multimeter Operations
9'LY
&+
P6
'&
9
7$872
7&+
7
'
'
$IBOOFM
'
$I
$I
'
‰
Figure 8-16 Sample screen with channel 1 on and channel 2 off
Bluetooth Discovery Selection
A special Bluetooth Discovery mode is available when operating in oscilloscope mode. Bluetooth
Discovery allows the M2 unit to be “paired” and connected to a host computer. This function is only
used when the VERDICT M2 has not been previously paired with a host, or if it becomes
necessary to pair with a new host. The VERDICT M2 can only be paired with one host at a time.
When Bluetooth Discovery is enabled, the VERDICT M2 seeks a compatible host computer, such
as the D7 Display Device. If a compatible device is within range, the VERDICT M2 recognizes its
presence, and can initiate pairing if so instructed by the operator. The pairing function requires
active participation of an operator. Once pairing has been established, the operator must exit from
the Bluetooth Discovery mode.
z
To pair the M2 to a D7 Display Device:
1. Power on the D7 Display Device.
2. Set the VERDICT M2 Rotary Switch to the oscilloscope position.
3. Press and hold the F1 key of the VERDICT M2 to open the alternate menu.
9'LY
&+
P6
'&
9
7$872
7&+
7
'
%JTQMBZ
'
$I
'
'
Figure 8-17 Sample Bluetooth Discovery selected
85
M2 Data Acquisition Device
Digital Multimeter Operations
An alternate menu option for the F4 key is now available.
4. Press the F4 key to activate Bluetooth Discovery.
The F4 field on the screen switches to inverse video (white on black) when the Bluetooth
Discovery mode becomes active.
5. With the Bluetooth Discovery active, turn the M2 Rotary Switch to the Remote Functions
position (Figure 8-18).
The VERDICT M2 is now ready to be paired with a display device. If the radio name and the
security code of the VERDICT M2 are recognized as legitimate by the display device, the two
devices automatically pair, bond and connect.
6. After VERDICT M2 has been successfully paired, turn the M2 Rotary Switch to the
oscilloscope position.
7. Press and hold the F1 key to open the alternate menu.
8. Press the F4 key to switch off Bluetooth discovery mode.
The F4 field on the screen switches to normal video (black on white) when the Bluetooth
Discovery mode is inactive.
Once the VERDICT M2 is paired with a display device, additional pairing is not necessary.
Although the discovery mode has been disabled, the two-paired devices automatically seek and
find each other when they are powered on. The VERDICT M2 becomes “invisible” to other
Bluetooth devices whenever discovery is disabled.
8.2.8 Remote Functions
With the Rotary Switch in the Remote Functions position the VERDICT M2 attempts to
communicate with a host computer. This could be either a display device with which the
VERDICT M2 has been paired, or one that it wants to pair to.
Figure 8-18 Sample remote functions selected
If the VERDICT M2 has been paired with a display device, it automatically connects to it. Once
connected to a display device the front panel keys on the VERDICT M2 become inoperative. All
controls of the VERDICT M2 are transferred to the host computer. Turning the Rotary Switch off
of the Remote Functions position returns control to the VERDICT M2 and the front panel keys
regain their functionality.
86
M2 Data Acquisition Device
Updating the Software
8.3 Updating the Software
The VERDICT M2 software can be updated using the VERDICT D7 Display Device. When the
display device is connected to the internet it automatically searches for software updates for all of
the VERDICT components. Any updates that are found are stored on the device, but must be
installed to complete the process. This section describes updating the VERDICT M2 software.
z
To update the software:
1. Connect the VERDICT M2 and D7 Display Device to AC power using their AC/DC Power
Supply units to prevent loss of power during the programming process.
2. Power on the VERDICT D7 Display Device.
3. Verify the VERDICT M2 and D7 Display Device are paired.
4. Power on the VERDICT M2 unit and set the Rotary Switch to the Remote Functions position.
5. From the D7 Display Device Home screen, select Scope Multimeter.
6. Select Lab Scope from the D7 Profile screen.
7. Select 2 Channel Lab Scope from the D7 Lab Scope screen.
A message box opens in the lower-right corner of the scope screen if there is a software
update is available (Figure 8-19).
Figure 8-19 Sample update available message
The message box only remains on the screen momentarily, then disappears. Tap the Record
button on the Record/Playback toolbar to bring the message box back if it closes.
8. Tap on the Message Box.
The program initiation screen opens (Figure 8-20).
87
M2 Data Acquisition Device
Updating the Software
6ZLWFKWKH9(5',&70XQLWRII
6LPXOWDQHRXVO\SUHVVDQGKROGWKH)DQG6VRIWNH\VRQWKH9(5',&70XQLW
7XUQWKH9(5',&705RWDU\6ZLWFKWRDQ\³RQ´SRVLWLRQ$³5H3URJUDP0RGH´PHVVDJHVKRXOGQRZGLVSOD\
Figure 8-20 Sample initiation screen
9. Follow the screen instructions to place the VERDICT M2 into Re-Program Mode:
a. Switch the VERDICT M2 unit off.
b. Simultaneously press and hold the F2 and S soft keys on the VERDICT M2 unit.
c. Turn the VERDICT M2 Rotary Switch to any “on” position.
The VERDICT M2 display should now show a Re-Program Mode message.
10. Tap the OK button on the D7 Display Device toolbar to begin programming.
The update programming takes about five minutes, then the Home screen opens on the
display device. Create a backup of the VERDICT M2 software to complete the process.
8.3.1 Creating a Software Backup
A backup copy of the newly updated software can be created and stored on the VERDICT M2.
This copy can be used in the unlikely event that the original software becomes corrupted.
z
To backup the software:
1. Power off the VERDICT M2 unit.
2. Power on the VERDICT M2 unit and set the Rotary Switch to the Volts DC position.
3. Simultaneously press and hold the F2 and S soft keys for two seconds.
A “set memory recovery” message displays.
4. Press the Range soft key to initiate the backup.
The screen display returns to the Volts DC screen once the procedure is complete. Both tools
are now ready for use.
88
Chapter 9
Scope Multimeter Operations
When used in conjunction with the VERDICT M2 Data Acquisition Device the Scope Multimeter
module provides all the tools needed for performing electrical and electronic circuit tests and for
monitoring signals and circuit activity. The Scope Multimeter works interactively with other
modules. Selecting “View Meter” from a Component Test or Scanner test launches the Scope
Multimeter module.
The M2 Data Acquisition Device is designed to work with the high-voltage hybrid vehicle batteries
and circuits, which makes it a Measurement Category III and IV meter and raises additional safety
concerns. For your safety, adhere to the safety messages posted below and those in the
accompanying Important Safety Information.
:$51 ,1*
Risk of electrical shock.
• This product is intended for Measurement Category III (1000V) and IV (600V).
• Do not exceed voltage limits between inputs as indicated on the rating label.
• Use extreme caution when working with circuits that have greater than 40 volts DC or
24 volts AC.
• Do not connect Inductive RPM Pickup, Secondary Ignition Clip-on Wire Adapter, or any
other probe to a damaged or un-insulated conductors.
• Always wear properly rated rubber insulated gloves when required or appropriate,
particularly when working with voltages exceeding 40 volts DC or 24 volts AC.
• Use only appropriate (Category III or IV) Snap-on components, such as test leads, scope
leads and auxiliary components with meter and scope products. Do not use aftermarket
“equivalents” or alternate leads of unknown origin.
• Use only Snap-on suggested components that are in good working order. Do not use
components that show extreme wear or are visibly damaged. Make sure the
components are properly rated for the task.
• Always examine the instrument for signs of damage before use. Do not use devices that
show cracks or other defects that may allow for high voltage exposure.
Electrical shock can cause personal injury, equipment damage, or circuit damage.
&$87,21
Risk of equipment or circuit damage.
• Read the Safety Information provided for important warnings on the use of this product
• Disconnect test leads from any circuit being tested before changing functions. Always
disconnect the live test lead before disconnecting the common test lead.
• Never perform resistance, diode, or polarity tests on a live circuit.
• Unless specifically directed by the test procedure, make sure the ignition is off before
connecting or disconnecting connectors or any vehicle electrical terminals.
• Remove the amp probe when not in use.
• Do not create an electrical connection between battery terminals with a jumper wire, or
your scopes and/or meters.
• Do not ground any electrical terminal that has or may have power.
• Do not allow battery gases or acid to contact tester housing.
Improper use can cause equipment or circuit damage.
89
Scope Multimeter Operations
Getting Started
9.1 Getting Started
The Scope and Multimeter module enables the VERDICT to function as a digital multimeter
(DMM), a graphing multimeter, and a 2-channel oscilloscope when the Display Device is
wirelessly linked to the Data Acquisition Device.
9.1.1 Capabilities
The following tables detail the software and hardware capabilities.
Table 9-1 Multimeter
Function
Range
40mV
400mV
4V
Volts DC
40V
400V
1000V
400mV
4V
40V
Volts AC
400V
1000V
40 Ohm
400 Ohm
4k Ohm
Resistance
40k Ohm
400k Ohm
4M Ohm
40M Ohm
40nF
400nF
4uF
Capacitance 40uF
400uF
4mF
40mF
40Hz
400Hz
4kHz
Frequency
40kHz
400kHz
2MHz
Duty Cycle
0.1 — 99.9%
Pulse Width 0.1 — 99.9%
Diode Test
3V*
Continuity
3V*
* Test voltage.
Resolution
0.01mV
0.1mV
0.001V
0.01V
0.1V
1V
0.1mV
0.001V
0.01V
0.1V
1V
0.01 Ohm
0.1 Ohm
0.001k Ohm
0.01k Ohm
0.1k Ohm
0.001M Ohm
0.01M Ohm
0.01nF
0.1nF
0.001uF
0.01uF
0.1uF
0.001mF
0.01mF
0.01Hz
0.1Hz
0.001kHz
0.01kHz
0.1kHz
0.001MHz
0.1%
0.1%
N/A
N/A
90
Accuracy
±(1.0% of reading + 3 digits)
Impedance/
Protection
10M Ohm
±(1.5% of reading + 3 digits)
±(1.5% of reading + 4 digits)
10M Ohm
±(2.0% of reading + 4 digits)
±(0.75% of reading + 5 digits)
±(0.5% of reading + 3 digits)
600V DC
or Peak AC
±(0.75% of reading + 5 digits)
±(3.0% of reading + 15 digits)
600V DC
or Peak AC
±(5.0% of reading + 15 digits)
±(0.5% of reading + 2 digits)
N/A
N/A
N/A
Range = 2V
Threshold = 0.1%
N/A
N/A
N/A
N/A
Scope Multimeter Operations
Getting Started
Table 9-2 Scope
Function
Range
Accuracy/Comments
Ch. 1—red banana jack
Signal Measurement
Ch. 2—green banana jack
Each channel input is referenced to
common ground input (GND—black port)
Sample Rate
20 mega samples per second
Continuous sampling,
MSPS = mega samples per second
Update Rate
Real time
Real time
Sweep Rate
50 uS to 20 S
In a 5 step sequence
Band Width
2 MHz
–3 db point
Resolution
8 bit
Coupling
AC/DC
Input Impedance
10 MOhm
Channel 1 and 2
9.1.2 Leads and Adapters
The Scope Multimeter uses standard safety banana plugs that are compatible with many
accessories. The various leads, clips, and adapters that are supplied with or available for the
VERDICT M2 unit explained in this section.
IMPORTANT:
When removing leads from their sockets, do not pull on the wire because it can damage the leads.
Pull on the plug.
Channel 1 Lead
Figure 9-1 Red Channel 1 Lead
The shielded red lead with an integrated probe is used for Channel 1 (Figure 9-1). The lead color
matches the color of socket 1 on the Data Acquisition Device and of trace 1 on the test screens.
Channel 2 Lead
Figure 9-2 Green Channel 2 lead
The shielded green lead (Figure 9-2) with an integrated probe is used for Channel 2. The lead
color matches the color of socket 2 on the Data Acquisition Device and the color of trace 2 on the
test screens.
91
Scope Multimeter Operations
Getting Started
Common Lead
Figure 9-3 Red Channel 4 lead
The black lead (Figure 9-3) with an integrated probe is used when a separate common, or ground,
connection is needed. The lead color matches the color of the COM socket on the Data
Acquisition Device.
Alligator Clips
Three insulated alligator clips that attach to the test leads are included. The insulator boots are
colored to match each test lead. Alligator clips attach to the probe end of the test lead.
z
To install an alligator clip:
1. Remove the collar from the probe by threading it counterclockwise off of the tip (Figure 9-4).
Store the collar in a safe place while not in use.
Figure 9-4 Probe collar
2. Fit the tip of the probe into the alligator clip and thread the clip onto the probe.
Low Amp Current Probe (optional)
The optional Low Amp Current Probe (Figure 9-5) provides accurate and reliable non-intrusive
testing of ignition coils, fuel injectors, fuel pumps, relays, electric motors, and parasitic draw. Use
to measure current from 10 mA to 40 Amps with a resolution of 1 mA.
Figure 9-5 Low Amp Current Probe
92
Scope Multimeter Operations
Navigation
Navigation
The following section describes how to navigate the screen interface when viewing on the Display
Device. When using the Data Acquisition Device as a stand-alone test meter refer to "M2 Data
Acquisition Device Controls and Features‚" on page 19 for navigation instructions.
9.1.3 Screen Layout
The scope multimeter screens typically include the following sections (Figure 9-6):
1— Scope Multimeter toolbar—allows you to configure the tool for the type of test and to
adjust the settings for each channel, or trace.
2— Main body—displays test results. Options on the toolbar let you select how tests display
on the screen.
3— Trace Details—displays trace sampling conditions, which can be adjusted or switched
through the touch screen.
4— Record/Playback Control toolbar—allows you to record and navigate paused data
Figure 9-6 Scope Multimeter screen layout
Scope Multimeter Toolbar
The Scope Multimeter toolbar is used to set up the tool for testing and to configure the settings for
each trace. The table below gives brief descriptions of the control buttons on the toolbar:
Table 9-3 Scope Multimeter toolbar buttons (sheet 1 of 2)
Name
Button
Description
Back
Returns to the previously viewed screen.
Setup
Opens a dialog box that allows you to select
personal preferences for viewing and saving data.
93
Scope Multimeter Operations
Navigation
Table 9-3 Scope Multimeter toolbar buttons (sheet 2 of 2)
Name
Button
Description
Data
Switches the trace information displayed at the base
of the screen on and off.
Cursors
Opens a dialog box that allows you to switch cursors
on and off, and to reposition them on the screen.
Refresh
clears the minimum and maximum digital
values and updates the viewing screen.
File
Opens a dialog box that allows you to select options
for saving data.
Print
Opens a dialog box that allows you to configure and
print data.
Main Body of the Screen
The main body of the screen varies depending on what display options have been selected. Two
traces, along with digital readouts of current signal values, signal status and triggering conditions,
can be displayed simultaneously on the main body of the screen. Adjustments to the display are
made through the scope toolbar as explained above.
Each trace is displayed as voltage over time on a standard oscilloscope screen. Voltage level is
recorded on the vertical, or “y”, axis and time is presented on the horizontal, or “x”, axis of the
screen. Values are shown for each graduation on the scales.
When using the pressure transducers, the pressure the transducer senses is converted into a
voltage signal. However, the values are shown as pressure on the screen rather than voltage.
Similarly, when using the optional Low Amp Current Probe the amperage sensed is converted to
a voltage signal for processing, but displayed as amperage on the screen.
Trace Details
The Trace Details section displayed at the base of the screen can be used to quickly adjust
sampling characteristics for capturing the trace. The Trace details can be hidden by selecting the
Data button on the toolbar.
The Touch and Grow button on the Playback toolbar expands the data viewing area of the screen
and allows you to change the configuration settings for each individual trace. Adjustments are
made by tapping the item to be changed on the touch screen. A dash (–) indicates a function that
is not selected, and an icon displays to indicate an active function (Figure 9-7).
94
Scope Multimeter Operations
Navigation
1— Peak Detect on
2— Inverted trace
3— Coupling AC on
4— Trigger set on the rising edge
5— Touch and Grow button
Figure 9-7 Sample Touch and Grow display
The following trace adjustments and settings are available:
• Profile—switches the trace for the selected channel on and off.
• Probe—opens a dialog box that allows you to select the type of test probe being used.
• Peak Detect—maximizes the signal sampling rate in order to capture fast events, such as
spikes, glitches and other anomalies, that may normally be undetected.
• Inverted—switches the polarity of the displayed signal.
• Coupling AC—subtracts the average value of the waveform by blocking the DC portion of an
input signal in order to amplify the AC portion. This allows small variations in the trace to
become visible.
• Scale—opens a dialog box that allows you to select the scale, which is the total value
displayed on the vertical axis of the display.
• Slope—only active when a trigger is set, indicates whether the trigger is set to activate on the
rising or falling edge of the trace. Tapping the slope icon switches the slope.
Record/Playback Control Toolbar
The record/playback control toolbar at the base of the screen is used for recording data and for
reviewing paused data files. Use the stylus or your finger tip to activate the buttons. A position
counter in the toolbar displays a numerical value of where the current screen is in relation to the entire
recorded file.
Use the slider in the middle of the toolbar to quickly move through paused data.
Figure 9-8 Sample data buffer slider
95
Scope Multimeter Operations
Navigation
Use the toolbar buttons (Table 9-4) to more precisely navigate the data.
Table 9-4 Data buffer toolbar buttons
Name
Button
Description
Snapshot
Arms the VERDICT software to take a snapshot of
the sampled data
Step Back
Moves to the previous point in the recorded data
Back 1Frame
Moves to the previous frame in the recorded buffer
Stop
Stops recording data
Record
Begins recording data
Play Recording
Plays the data recording in a continuous loop at
actual speed
Forward 1 Frame
Moves to the next frame in the recorded buffer
Step Forward
Moves to the next point in the recorded buffer
Frame Counter
Indicates the data buffer frame currently displayed
Touch and Grow
Expands and collapses the Trace Detail area on the
display screen to allow for easier finger tip control
Zoom
Increase or decrease the magnification of the graph
9.1.4 Making Selections
Most selections for setting up and operating the scope are made using a finger or the stylus and
the scope toolbar. The cursor lines, the trace zero line, and the trigger point indicator (+) can be
repositioned by selecting and dragging them in the main body of the screen.
There are two basic types of controls on the toolbar:
• Switches
• Dialog boxes
96
Scope Multimeter Operations
Operations
A Switch changes states when tapped with a finger or the stylus. Changes happen immediately as
the selection is made.
A dialog box opens as a separate window on the screen and typically includes a number of
choices. Changes happen immediately, however, the dialog box must be closed to return to the
main window and continue. Make a selection to close the dialog box.
9.2 Operations
This section describes configuring the scope or meter and performing tests. Selecting “View
Meter” from a Component Test or Scanner screen saves time by automatically configuring the
scope or meter.
9.2.1 Starting the Scope and Multimeter
Use the following procedure to set up the scope multimeter for performing tests.
z
To start the scope multimeter:
1. Select the Scope Multimeter button on the VERDICT Home screen.
The Scope Multimeter main menu, a list of setup options, displays;
–
–
–
–
Lab Scope
Graphing Multimeter
Digital Multimeter
Presets
2. Tap to select the correct main menu option for the tests to be performed.
A submenu of scope or meter configuration displays, see below for additional information.
3. Tap to select the correct configuration for the tests to be performed.
The Scope Multimeter displays configured for the selected test.
Lab Scope Options
The following options are available for testing:
•
•
•
•
•
•
•
•
•
2 Channel Lab Scope
Volts DC
Low Amps (20)
Low Amps (40)
Ignition Probe
100 PSI Vacuum
100 PSI Pressure
500 PSI Pressure
5000 PSI Pressure
97
Scope Multimeter Operations
Operations
Graphing Multimeter Options
The following options are available for testing:
•
•
•
•
•
•
•
•
•
•
•
•
•
Single Graphing Meter
Volts DC
Volts AC RMS
Frequency
Pulse Width
Duty Cycle
Ohms
Low Amps (20)
Low Amps (40)
100 PSI Vacuum
100 PSI Pressure
500 PSI Pressure
5000 PSI Pressure
Digital Multimeter Options
The following options are available for testing:
•
•
•
•
•
•
•
Volts DC
Volts AC RMS
Ohms
Diode/Continuity
Capacitance
Low Amps (20)
Low Amps (40)
Presets
Presets are the personal meter settings that you have saved.
9.2.2 Scope and Multimeter Setup
The following sections explain how to adjust the scope and multimeter for the specific type of
signal being sampled. Most of these setup operations are available from the toolbar.
Trace Controls
The Traces controls are used to adjust individual characteristics of how the signal is sampled and
displayed for each trace. The more commonly used trace settings can also be made from the
Trace Details area of the touch screen (see "Trace Details‚" on page 94). Trace Details offers a
shortcut to some of the operations described in the following sections.
98
Scope Multimeter Operations
z
Operations
To adjust trace controls:
1. Select Setup from the Scope Multimeter toolbar.
The Scope Multimeter Preferences dialog box opens
2. Double tap Traces to open the submenu.
3. Select the tab for the trace to be configured from the submenu
The traces dialog box displays (Figure 9-9).
1— Trace tabs
2— Trace Probe button
3— Trace Scale button
4— Trace characteristics check boxes
5— Baseline position
6— Auto Find button
7— OK button
Figure 9-9 Traces dialog box
4. Select the Trace Probe button to open the menu.
5. Highlight a probe on the list and tap OK close the window.
6. Select the Trace Scale button to adjust the vertical scale, of the display.
A dropdown menu opens, menu options vary depending upon which test lead is selected.
7. Select a trace scale option, then close the window.
8. Select or deselect the trace characteristic items as needed:
–
–
–
–
Displayed—this trace is on screen when checked, and not visible when not checked.
Inverted—signal polarity is reversed when checked, normal when not checked.
Coupling AC—check when sampling an AC signal, do not check for DC signals.
Peak Detect—use when trying to capture a fast event or signal glitch.
9. The scope samples the signal and internally calculates the best scale to fit the signal pattern
on the screen when Auto Find is selected. If run on the same channel as the trigger, the
trigger value is set halfway between the minimum and maximum values of the waveform.
10. The baseline position is the zero line of the trace, use the slider and arrows to adjust it.
99
Scope Multimeter Operations
Operations
11. Select OK to exit the dialog box.
12. Select Back twice to close the Scope Multimeter Preferences dialog box.
Sweep Controls
Sweep is the amount of time represented by the screen, or the horizontal scale of the display.
z
To adjust Sweep controls:
1. Select Setup from the Scope Multimeter toolbar.
The Scope Multimeter Preferences dialog box opens
2. Tap Sweep to open the sweep dialog box (Figure 9-10)
Figure 9-10 Sample Sweep Setup dialog box
3. Choose an option from the list.
4. Select OK to close the dialog box.
5. Select Back twice to close the Scope Multimeter Preferences dialog box.
Trigger Controls
Triggering allows you to set the scope so that it begins sampling and displaying a trace once
predetermined signal conditions, or triggers, are met. Triggering produces a much more stable
waveform. The trace always begins at the trigger point, so the image does not appear to flicker or
drift as it updates. There are three modes of triggering:
• Auto—this automatic triggering mode is the default setting that either constructs the trace
independently of the trigger point or begins the trace as it crosses the trigger.
• Manual—often called normal mode, this option allows the user to set a triggering point and the
trace does not begin to display until the signal reaches the trigger point.
• None—often called Histogram, this is a “no triggering” mode that is automatically engaged
whenever a timebase, or sweep, between 2 seconds and 20 seconds is selected. Triggering
is prevented at slower sweep rates to eliminate screen update delays caused by the way
VERDICT buffers data in order to capture rapidly occurring signal glitches.
100
Scope Multimeter Operations
Operations
The trigger point is indicated by a plus sign (+) on the scope grid. The plus sign can be dragged
across the grid with your finger or the stylus to roughly position it. The trigger controls allow you to
precisely position the trigger.
z
To adjust trigger controls:
1. Select Setup from the Scope Multimeter toolbar.
The Scope Multimeter Preferences dialog box opens
2. Tap Trigger to open the Trigger Setup dialog box (Figure 9-11).
3. Use the dialog box controls to establish the position for triggering.
4. Select OK to close the dialog box.
5. Select Back twice to close the Scope Multimeter Preferences dialog box.
1— Source—selects the triggering event:
- Trace 1—sets conditions for the channel 1 signal.
- Trace 2—sets conditions for the channel 2 signal.
- None—switches triggering off.
2— Mode—sets the method of triggering:
- Auto (automatic)—if a trigger is found, the waveform displays. If a trigger is not found
after several seconds, the waveform and a “trigger not found” message displays.
- Manual—if a trigger is found, the waveform displays. If a trigger is not found nothing
displays (no waveform and no message).
3— Slope—sets triggering to the rising or falling edge of the signal.
4— Vertical position—moves the trigger position up and down on the grid.
5— Horizontal position—moves the trigger timing left and right on the grid
6— OK—exits Trigger Setup
Figure 9-11 Trigger controls
101
Scope Multimeter Operations
Operations
View Controls
Use the view controls to set display attributes.
z
To adjust view controls:
1. Select Setup from the Scope Multimeter toolbar.
The Scope Multimeter Preferences dialog box opens.
2. Tap View to open a submenu.
Three types of adjustment are available on the submenu:
– Display—use to adjust what information displays and how it appears
– Layout—use to set how many and how the traces display on the screen
– Units—use to adjust time and voltage interval settings
Selecting from the submenu opens a dialog box for that item.
3. Make dialog box selections as needed.
4. Select OK to close the dialog box.
5. Select Back twice to close the Scope Multimeter Preferences dialog box.
Display Settings
Selecting Display from the View submenu opens the Display dialog box (Figure 9-12).
Figure 9-12 Sample Display dialog box
The following options are available from the Display dialog box:
• Show RPM—adds a digital engine speed readout near the top of the screen (Figure 9-13).
Figure 9-13 Sample Show RPM selected
• Show Grid—switches grid lines on the screen off and on (Figure 9-14).
102
Scope Multimeter Operations
Operations
Figure 9-14 Sample grid selected
• Invert Colors—switches the screen background to white, this saves ink when printing.
Layout Settings
The selected radio knob on the Layout dialog box shows which setting is active:
• 1 Window—shows all traces on the same screen.
• 2 Windows—shows two separate horizontal traces, one below the other
• 2 Windows—shows two separate vertical traces, side-by-side.
Units Settings
The Units dialog box allows you to switch between Full Scale or Per Division settings for the trace
setup and the display settings. Selecting Full Scale configures the units to the full viewing area of
the screen, while Per Division adjusts the units to a single division (one tenth) of the screen.
Figure 9-15 Sample View Units dialog box
The selected radio knob on the Units dialog box shows which setting is active. Use the stylus to
switch between settings (Figure 9-15).
103
Scope Multimeter Operations
Operations
Setup Controls
Basic tool settings are adjusted here.
z
To adjust setup controls:
1. Select Setup from the Scope Multimeter toolbar.
The Scope Multimeter Preferences dialog box opens
2. Select Setup from the dialog box.
A submenu of options displays:
– Units—use to set how measurement values display, US standard or metric
– Snapshot—use to adjust the percentage of data captured following a trigger event
– Ignition—use to configure the optional ignition scope and to display RPM values
Selecting from the submenu opens a dialog box for that item. Dialog box options for each item
are discussed in the following sections.
3. Make dialog box selections as needed.
4. Select OK to close the dialog box.
5. Select Back twice to close the Scope Multimeter Preferences dialog box.
Units
The units of measurement can be changed between US customary or metric units of measure for
pressure and vacuum readings. Selecting Units opens the Setup dialog box. The selected radio
knobs on the Setup dialog box shows which setting is active. (Figure 9-16)
Abbreviation
bar
Description
bar
inHg
inches of mercury
kg/cm2
kilograms per centimeter squared
kPa
kilopascal
mmHg
millimeters of mercury
psi
pounds per square inch
Figure 9-16 Sample Setup Units dialog box
104
Scope Multimeter Operations
Operations
Snapshot
The Snapshot tab of the Setup dialog box opens a window that allows you to select how much
data is captured after a triggering event (Figure 9-17).
Figure 9-17 Sample Snapshot dialog box
Selections range from ten to ninety percent in increments of ten, the current setting is highlighted.
Select a button, then select OK to close the dialog box.
Refer to "Trigger Controls‚" on page 100 for information on how to setup a trigger.
Cursor Controls
The cursor controls include a Show Cursors check box plus a slide control and arrows for moving
the cursor position left or right. Select Cursors from the toolbar to open the Cursors dialog box
(Figure 9-18).
1— Cursor 1 controls
2— Cursor 2 controls
3— Hide button
4— OK button
Figure 9-18 Cursor controls
105
Scope Multimeter Operations
Operations
Cursor 1, the top slider and arrows, is the left-hand cursor on the screen. Cursor 2, the lower set
of controls, is the right-hand cursor on the screen. Drag the slider or tap the arrows to position the
cursors. Each tap of the stylus moves the cursor incrementally in the direction of the arrow.
Select OK apply the changes and close the dialog box.
Select Hide to conceal the cursors and close the dialog box.
Refresh Controls
Selecting the Refresh button from the Scope Multimeter Toolbar clears the minimum and
maximum digital values and updates the viewing screen.
File Controls
Selecting File from the toolbar opens a window with a menu of save options:
• Save Configuration—saves the current setup values as a preset.
• Save Single Frame—saves the data currently on the screen only.
• Save All Frames—saves the current screen plus all the data stored in the buffer.
Selecting a menu option opens the Save As dialog box and the virtual keyboard. Follow the screen
prompts to name and describe the file you are saving. Basic information from the Vehicle ID, such
as year, make, and model, is saved along with the file. Select OK to close the dialog box.
Once a configuration is saved, it becomes available from the Presets option on the Scope
Multimeter Main menu. Saved files, single frame or all frames, are stored in the Scope Multimeter
Data Folder and can be retrieved through the Data Manager on the VERDICT Home screen.
Print Controls
Selecting Print from the toolbar opens a standard Windows Print dialog box set up to print the
current screen. A printer must be connected and setup on the VERDICT unit. If not, the “Add
Printer Wizard” opens and guides you through the procedure. Select from the menus as needed.
106
Chapter 10
Information Operations
After using the Scanner, Component Test, and Scope Multimeter to diagnose and locate the source of
problem, select Information on the Home screen to link to resources that help you fix the problem and get
the vehicle back in service (Figure 10-1).
Figure 10-1 Sample Home screen Information button
ShopKey5 software is available as an option for North America. An internet connection is required.
When installed, simply tap the Repair information toolbar button to launch the ShopKey5 program.
Refer to the on-line help within the ShopKey5 program for additional information.
107
Chapter 11
Help Operations
Selecting Help from the Home screen opens this manual. Use standard Adobe Acrobat navigation
and operating procedures to view the manual. Refer to Adobe help for additional information.
11.1 Navigating the Help File
The gesture scrolling feature of VERDICT may not be active when the help file is initially opened
due to the default settings of the viewing program. If gesture scrolling is not available, use the
following procedure to enable it.
z
To enable gesture scrolling:
1. Touch and hold pressure on a point in the main viewing area of the screen (right-click) to open
the settings menu.
Figure 11-1 Sample settings menu
2. Tap to select Hand Tool from the menu. A check mark indicates the selected item.
3. Tap anywhere outside the menu box to close it.
Gesture scrolling should now be active, and you should be able to navigate through the entire file.
If you are only able to scroll to the bottom of the page being displayed, the page display
preferences need to be adjusted using the following procedure.
z
To adjust page display preferences:
1. Momentarily touch and hold pressure on a point in the main viewing area of the screen to open
the settings menu.
i
NOTE:
The settings menu does not open until your finger, or the stylus, is lifted off of the touch screen
because the “Hand Tool” is active.
108
Help Operations
Navigating the Help File
2. Tap to select Page Display Preferences from the settings menu to open the Preferences
dialog box.
3. Use the dropdown menus to adjust the Default Layout and Zoom settings as follows:
– Page Layout: Single Page Continuous
– Zoom: Fit Width
Figure 11-2 Sample settings dialog box
4. Select OK to close the dialog box.
11.1.1 Using the VERDICT Hard Keys
The directional arrow and return buttons can also be used to navigate through the help file. The
buttons function as follows:
•
•
•
•
•
i
Right (c)—advances to the next page
Left (e)—returns to the previous page
Up (b)—moves up one line at a time
Down (d)—moves down one line at a time
Return—moves down one screen at a time
NOTE:
The left and right arrows move the screen focus left and right respectively if the Bookmarks panel
is open or if Zoom is set to anything other than Fit Width.
109
Help Operations
Navigating the Help File
11.1.2 Using the Help Toolbar
A toolbar just below the options buttons can also be used to navigate through the file. Toolbar
operations are briefly explained in the table below:
Table 11-1 Help toolbar buttons
Name
Button
Description
Print
Sends the document to a printer.
Save
Saves a copy of the Help file.
Workgroup
Allows you to share the file through a
network or the internet.
Browser
Launches a web browser
Page Up
Returns to the previous page of the
document.
Page Down
Advances to the next page of the
document.
Current Page
Shows what page of the document is
currently on the screen
Zoom Out
Incrementally decreases screen
magnification with each touch.
Zoom In
Incrementally increases screen
magnification with each touch.
Magnification
Show screen magnification as a
percentage, tap to open a dropdown
menu of options.
Fit Width
Resizes the screen image to display
the width of the page.
Fit Page
Resizes the screen image to display an
entire page.
Search
Allows you to search the document for
a specific item. Use the virtual
keyboard to enter search criteria.
The scroll bars at the right side and bottom of each panel are used to move up and down and left
and right within the main display field. Touch and drag the divider bar between the two panels to
resize the panel widths.
110
Chapter 12
System Settings Operations
Selecting System Settings from the Home screen opens the peripheral manager, which allows
you to pair and configure wireless devices to the VERDICT display device.
12.1 Synchronizing Wireless Communications
The S3 Scanner Module is connected wireless to the Display Device so that data is readily
available while working anywhere on the vehicle. The M2 Data Acquisition Device is connected
wireless to the Display Device so that underhood circuits can be monitored while driving. In order
to do this, the modules need to be paired, or synchronized, the first time they are used together.
Detailed information about paired modules can be found by selecting System Settings from the
Home screen.
z
To check paired module details:
1. Tap the System Settings button on the Home screen.
2. Tap the Paired Devices option on the menu.
The paired devices screen opens (Figure 12-1).
Figure 12-1 Sample Paired Devices screen
The Paired Devices screen shows the type and a partial serial number for all of the modules
synchronized to the Display Device, and whether or not there is an active communications link
between the units.
111
System Settings Operations
Synchronizing Wireless Communications
The Hardware Status indicators in the lower-right corner of the Home screen provides a quick
reference of which modules have been paired to the Display Device (Table 12-1):
Table 12-1 Hardware Status indicators
Module
Not Paired
Paired
Scanner
Data Acquisition
12.1.1 Pairing the S3 Scanner Module
The S3 Scanner Module needs to be either connected to a vehicle or connected to a powered
USB port so that it is powered up during the synchronization procedure. Make sure the VERDICT
Display Device has a charged battery or is connected to an AC power supply.
z
To pair the Scanner with the Display Device:
1. Power on the VERDICT Display Device.
2. Connect the 25-pin end of the data cable to the Scanner data cable port.
3. Connect the 16-pin end of the data cable to a live vehicle data link connector (DLC).
The green vehicle power LED should be illuminated.
4. Tap the System Settings button on the Home screen of the Display Device.
5. Select Paired Devices from the menu.
6. From the Paired Devices screen select Add from the toolbar.
7. When prompted select OK from the toolbar.
The Display Device searches for compatible wireless devices, then displays the results. The
Scanner Module is listed as “VERDICT S3-” plus a partial serial number (Figure 12-2).
Figure 12-2 Sample Scanner Module selection
112
System Settings Operations
Synchronizing Wireless Communications
8. Tap to select the Scanner module from the search results list.
A search in progress message displays during the pairing procedure (Figure 12-3), the Paired
Devices screen (Figure 12-1) displays once the procedure completes.
Figure 12-3 Sample pairing in progress message
9. Tap the Home button on the VERDICT toolbar to return to the Home screen.
10. Disconnect the data cable from the vehicle.
The Scanner and Display devices are now synchronized for wireless communication and should
automatically recognize each other when both are powered up.
12.1.2 Pairing the M2 Data Acquisition Device
Make sure the M2 Data Acquisition Device and the D7 Display Device have charged batteries, or
are connected to an AC power supply.
z
To pair the Data Acquisition Device with the Display Device:
1. Power on the VERDICT Display Device.
2. Set the M2 rotary switch to the Remote Functions position (Figure 12-4).
Figure 12-4 Rotary switch Remote functions setting
113
System Settings Operations
Synchronizing Wireless Communications
3. Tap the System Settings button on the Home screen of the Display Device.
4. Select Paired Devices from the menu.
5. From the Paired Devices menu select Add from the toolbar.
6. When prompted select OK from the toolbar.
The Display Device searches for compatible wireless devices, then displays the results. The
Data Acquisition Device is listed as “VERDICT M2-” plus six digits of the unit’s serial number.
7. Tap to select the Data Acquisition Device from the search results list (Figure 12-5).
Figure 12-5 Sample Data Acquisition Device selection
An in progress message displays during the pairing procedure, which takes several seconds.
The Paired Devices screen displays once the procedure completes (Figure 12-6).
Figure 12-6 Sample Paired Devices screen
8. Tap the Home button on the VERDICT toolbar to return to the Home screen.
114
Chapter 13
Data Manager Operations
The Data Manager module is used to store, sort, and review saved files. Most operations are
controlled through the toolbar.
13.1 Screen Layout
Select Data Manager on the Module toolbar to open the file system. Use the toolbar at the top of
the screen to navigate through the data. The folders panel below the toolbar displays the contents
of the Windows “My Documents” folder, which is the Data Manager main screen. The information
panel on the lower-left portion of the screen shows a summary of the saved file when available,
and the preview panel on the lower right displays an image if the selected file is a graphic.
1— Data Manager Toolbar
2— Folders Panel
3— Information Panel
4— Preview Panel
Figure 13-1 Sample Data Manager main screen
The main screen includes folders for saved files from the various VERDICT modules:
•
•
•
•
•
•
Camera Folder—contains photographs taken with the built-in camera.
CTM Data Folder—contains files saved while working in the Component Test module.
Sample Files—contains an assortment of example saved data files.
Scanner Data Folder—contains files saved while working in the Scanner module.
Scope Multimeter Data Folder—contains files saved while working with the Scope Multimeter.
Screenshots—contains images saved by pressing the “S” button.
115
Data Manager Operations
Navigation
13.2 Navigation
Use the toolbar buttons are shown in the table below to navigate through the Data Manager:
Table 13-1 Data Manager toolbar buttons
Name
Button
Description
My Data
Returns to the Data Manager main screen.
Up
Moves the items displayed in the folders
panel up one level in the file structure.
Open
Opens the highlighted folder or file.
New
Creates a new folder.
Delete
Moves the highlighted file or folder to the
recycling bin.
Rename
Opens a dialog box and virtual keyboard for
renaming the selected file or folder.
Save
Saves the selected file.
Properties
Opens a dialog box and virtual keyboard for
renaming the selected file or folder.
More
Opens a menu of additional options.
13.3 Operations
Data Manager operations based on toolbar selections are explained in the following sections.
13.3.1 My Data
The My Data button is a shortcut that quickly returns you to the main Data Manager screen. Tap
the button at any time to instantly return. Note the location of the page being viewed is shown near
the top of the screen just above the toolbar.
13.3.2 Up
This button moves the items shown in the folders panel of the screen up in the file structure one
level at a time. For example; one tap of the Up button when viewing the contents of the Scanner
Data Folder returns you to the main screen. A second tap would display the contents of the “My
Documents” folder.
116
Data Manager Operations
Operations
13.3.3 Open
The Open button is only active (displays in color) when an item in the folders panel is highlighted.
z
To open a folder:
1. Highlight the file to open in the folders panel.
2. Tap the Open button to load the highlighted file.
Figure 13-2 Sample open folder showing information
The screen advances and the contents of the open folder are shown in folders panel. Highlight
an item in the folders panel and the information or preview displays if available (Figure 13-2).
3. To exit the current folder:
– Tap My Data on the toolbar to return to the main Data Manager screen.
– Tap More > Up on the toolbar to return to the previous page.
13.3.4 New
The New button allows you to create a new folder. This option is only available when the button
displays in color.
z
To create a new folder:
1. Tap the New button on the toolbar.
The New Folder Name dialog box opens (Figure 13-3).
2. Touch the entry field on the dialog box to open the virtual keyboard.
3. Type a name for the new folder using the virtual keyboard.
4. Tap the OK button to create the new folder and return to the previous page. The Cancel button
returns you to the previous page without creating a new folder.
117
Data Manager Operations
Operations
Figure 13-3 Sample New Folder name dialog box
13.3.5 Delete
The Delete button moves folders or items within folders to the Recycling bin. A confirmation
displays when a file is selected for deletion. Select Yes to delete the file or No to cancel.
z
To delete an item:
1. Touch to highlight the item or folder to be deleted.
2. Tap the Delete button on the toolbar.
A confirmation message displays (Figure 13-4).
Figure 13-4 Sample delete confirmation message
118
Data Manager Operations
Operations
3. Tap Yes to delete the selected item and return to the previous page. The No button returns
you to the previous page without deleting the selected item.
13.3.6 Rename
The Rename button allows you to change the name of a folder or items within a folder.
z
To rename an item:
1. Touch to highlight the item or folder to be renamed.
2. Tap the Rename button on the toolbar.
The New Name dialog box opens (Figure 13-3).
Figure 13-5 Sample new name dialog box
3. Touch the entry field on the dialog box to open the virtual keyboard.
4. Type the new name into the entry field using the virtual keyboard.
5. Tap the OK button to change the name and return to the previous page. The Cancel button
returns you to the previous page without changing the name.
13.3.7 Save
The Save button is not implemented at this time.
13.3.8 Properties
The Properties button function is the same as the Rename button at this time.
119
Data Manager Operations
Operations
13.3.9 More
Selecting the More button opens a dropdown menu with two options:
• Shortcut—creates a shortcut to the highlighted item on the Data Manager main screen. A
confirmation message displays when this option is selected.
• Email—opens a new e-mail message with the selected file attached. The display device must
have an active e-mail account to use this feature.
120
Chapter 14
Vehicle History Operations
The Vehicle History refers to any work in progress, such as a repair order, estimate or invoice, that
has customer, vehicle, and repair information for a vehicle in your shop. The Vehicle History is the
starting point for using the VERDICT system.
The Scanner and Component Test software get vehicle information from the Vehicle History, and
can only start after a Vehicle History is opened.
14.1 Screen Layout
There are two main parts to the Vehicle History screen:
1— Vehicle History Toolbar—lets you manage the vehicle data
2— Main Body—lists all open Vehicle History records
Figure 14-1 Sample Vehicle History screen
14.1.1 Vehicle History Main Body
The main body of the screen lists all of the available Vehicle History items. By default, items are
shown in the order in which they are entered. However, you can resort them by any of the
categories shown as column headings. You can also resize the individual columns.
121
Vehicle History Operations
z
Screen Layout
To sort Vehicle History items:
1. Tap a category heading.
The listed items resort according to the selected category. A triangle appears alongside the
name of the column that was used for the sort.
2. Select the triangle in the heading to reverse the sort order.
z
To resize a Vehicle History column:
1. Touch the line separating two columns.
A line with arrowheads appears to show the column is ready for resizing.
2. Drag the line left or right to increase or decrease the column width.
14.1.2 Vehicle History Toolbar
The table below gives brief descriptions of the control buttons on the toolbar:
Table 14-1 Toolbar buttons
Name
Button
Description
Activate
Loads the highlighted vehicle history
View
Opens the worksheet for the currently
highlighted vehicle history
Delete
Erases the currently highlighted vehicle
history
Search
Opens a window that allows you to
locate a particular vehicle history
Show All
Available only after a search, use to
return to a complete Vehicle History list
Settings
Opens a window that allows you
configure which fields display on main
Vehicle History screen
Activate
Use this button to load an existing vehicle history when servicing a vehicle that you have
previously worked on. VERDICT uses the identification characteristics stored in the vehicle history
to load the correct database, so you do not need to identify the vehicle to begin testing.
z
To activate a vehicle:
1. Locate and highlight the desired Vehicle History in the main body of the screen.
2. Tap Activate on the Vehicle History toolbar.
The Activate button in removed from the toolbar once a vehicle has been selected.
3. Tap the Home button on the VERDICT toolbar.
The VERDICT Home screen displays and with the activated vehicle shown on the toolbar.
4. Select any module button on the Home screen to begin testing.
122
Vehicle History Operations
Screen Layout
View
Use this selection to open edit, add notes, and print the work sheet for an existing Vehicle History.
z
To modify an existing Vehicle History:
1. Highlight the Vehicle History be opened in the main body of the screen.
2. Tap View on the Vehicle History toolbar.
The worksheet for the selected vehicle opens, and there are now Back and Save & Close
buttons available on the toolbar.
Figure 14-2 Sample vehicle history worksheet
i
NOTE:
The virtual keyboard automatically opens the first time you touch within one of the data fields.
3. Use the virtual keyboard to enter information in the data fields.
4. Tap Save & Close on the toolbar to save the changes you made and return to the Vehicle
History screen.
Use the Back button on the toolbar to return to the Vehicle History screen without saving the
changes you made.
Delete
Use the Delete button to remove unwanted items from the Vehicle History list. Simply highlight the
item to remove, then select Delete.
Search and Show All
Selecting Search opens a dialog box that allows you to search Vehicle History items by category
(Figure 14-3).
123
Vehicle History Operations
Screen Layout
Figure 14-3 Sample Search dialog box
z
To search:
1. Tap Search on the Vehicle History toolbar to open the search window.
2. A dropdown menu allows you to select the field to search:
–
–
–
–
–
–
–
–
Year
Make
Model
Color
Customer
License
State
Technician
3. Use the virtual keyboard to enter search criteria into the text field.
4. Select Search to start the search.
The display returns to the Vehicle History screen with only the records fitting the search
criteria showing.
5. Tap Show All on the toolbar to restore the complete Vehicle History list.
Settings
Use Settings to determine which categories of information display in the main body of the Vehicle
History screen. Selecting the Settings button opens a dialog box.
124
Vehicle History Operations
z
Shop Information
To change Settings:
1. Tap Settings on the Vehicle History toolbar to open the dialog box.
Figure 14-4 Sample Settings dialog box.
2. Tap to highlight the categories that you do not want to display on the main screen, remember:
– Items that are highlighted do not display
– Items that are not highlighted display
3. Select OK on the toolbar to implement the changes, select Cancel to disregard the changes.
The dialog box closes and the screen updates.Vehicle History:
14.2 Shop Information
The Shop Information feature allows you to add personalized shop information that can be
included on printed data files.
z
To access shop information:
1. Select Vehicle History from the Home screen.
2. Tap the Menu button on the VERDICT toolbar.
A submenu of options opens.
3. Select Shop Information from the menu.
The shop information form opens.
4. Use the virtual keyboard to enter information into the fields.
5. Select OK to close the completed form.
The information you entered can now be included a header for printed records.
125
Chapter 15
Maintenance
This section covers how to care for your VERDICT Diagnostic Platform components.
15.1 D7 Display Device
This section covers how to care for your D7 Display Device.
15.1.1 Cleaning the Touch Screen
The touch screen can be cleaned with a soft cloth and alcohol or a mild window cleaner.
IMPORTANT:
Do not use any abrasive cleansers or automotive chemicals on the touch screen.
15.1.2 Calibrating the Touch Screen
The touch screen can be calibrated for accuracy using the PenMount (PM) utility of the unit.
z
To calibrate the touch screen:
1. From the Windows toolbar select Start > PenMount Control Panel.
Figure 15-1 Launching the calibration program
2. In the PM Control Panel; highlight the PenMount 6000 RS232 and select Configure.
3. Select one of two calibration options:
126
Maintenance
D7 Display Device
Figure 15-2 Selecting a calibration option
– Automatic—uses 5 points on the screen to quickly bring the unit into calibration. You can
use your finger to calibrate the screen.
– Advanced—uses 9, 16, or 25 points on the screen to accurately bring the unit into
calibration. Use the dropdown menu to select the number of points, a stylus is required to
calibrate the screen.
4. Touch and hold the center of each red box that displays in sequence.
Figure 15-3 Sample calibration target
5. Select OK to close the dialog boxes once the calibration is complete.
Extended Desktop Touch Screen Calibration
Special consideration must be given to calibrating the touch screen when the Extended Desktop
feature of theD7 Display Device is used with an external monitor and the optional docking cradle.
If the standard calibration method does not restore touch screen accuracy to a unit with extended
desktop, use one of the procedures that follow.
127
Maintenance
z
D7 Display Device
To calibrate the touch screen without the unit installed in docking cradle:
1. From the Windows toolbar select Start > Control Panel > Display.
The Display Properties dialog box opens.
2. From the dialog box select Settings > Advanced.
The Default Monitor and Intel Driver dialog box opens.
3. From the dialog box select the Display Config tab.
4. From the Display Config tab, select LVDS (clone) CRT from the Display Configuration
dropdown menu (Figure 15-4).
Figure 15-4 Sample Display Config tab
5. Select Apply.
6. Close the dialog boxes and the Control Panel window.
7. Calibrate the touch screen using the standard procedure.
i
NOTE:
This method disables the extended desktop. The same calibration issue arises if the extended
desktop is used again.
z
To calibrate the touch screen with the unit installed in docking cradle:
1. With the D7 Display Device installed in the docking cradle, connect a USB keyboard and an
external monitor.
IMPORTANT:
The Intel Graphics Display Config should be set to “LVDS (extended) CRT”, refer to the
procedure above to verify or reset the configuration.
2. From the Windows toolbar select Start > PenMount Control Panel to open the dialog box.
3. From the dialog box, select the Multiple Monitors tab.
128
Maintenance
D7 Display Device
4. With the Multiple Monitor Support box checked, select the Map Touch Screens button
(Figure 15-5).
Figure 15-5 Sample Multiple Monitors tab
5. Follow the screen prompts and touch the screen of the D7 Display Device as requested.
6. Type “S” on the USB keyboard to skip for extended display as requested.
7. Select OK from the Multiple Monitors tab to close the PenMount Control Panel dialog box.
8. Calibrate the touch screen using the standard procedure.
15.1.3 Cleaning and Inspecting the D7 Display Device
When using the VERDICT Display Device, make sure to do the following:
• Check the housing, wiring, and connectors for dirt and damage before and after each use.
• At the end of each work day, wipe the VERDICT Display Device housing, wiring, and
connectors clean with a damp cloth.
IMPORTANT:
Do not use any abrasive cleansers or automotive chemicals on the VERDICT Display Device.
15.1.4 Battery Service
Follow all safety guidelines when handling the battery pack.
:$51 ,1*
Risk of electric shock.
• Prior to recycling the battery pack, protect exposed terminals with heavy insulating tape
to prevent shorting.
• Disconnect all test leads and turn diagnostic tools off before removing the battery pack.
• Do not attempt to disassemble the battery or remove any component projecting from or
protecting the battery terminals.
• Do not expose the unit or battery pack to rain, snow, or wet conditions.
• Do not short circuit the battery terminals.
Electric shock can cause injury.
129
Maintenance
D7 Display Device
:$51 ,1*
Risk of explosion.
• The Lithium battery is factory replaceable only, incorrect replacement or tampering with
the battery pack may cause an explosion.
Explosion can cause death or serious injury.
Battery Safety Guidelines
IMPORTANT:
The battery pack contains no user serviceable components. Tampering with the battery pack
terminals or housing will void the product warranty.
Keep the following in mind when using and handling the VERDICT battery pack:
• Do not short circuit battery pack terminals.
• Do not immerse the VERDICT Display Device or battery pack in water, or allow water to enter
the unit or battery pack.
•
•
•
•
•
•
•
•
•
i
Do not crush, disassemble, or tamper with the battery pack.
Do not heat the battery pack to over 100°C (212°F), or dispose of it in a fire.
Do not expose the battery pack to excessive physical shock or vibration.
Keep the battery pack out of reach of children.
Do not use a battery pack that appears to have suffered abuse or damage.
Charge the battery pack in the appropriate charger only.
Do not use a battery charger that has been modified or damaged.
Use the battery pack for the specified product only.
Store the battery pack in a cool, dry, well ventilated area.
NOTE:
The battery pack should be used within a short period of time (about 30 days) after charging to
prevent loss of capacity due to self-discharging.
If long-term storage of the battery pack is necessary, it should be stored in a in cool, dry, well
ventilated place with a 30 to 75 percent state of charge to prevent loss of characteristics.
To prolong the life of your battery, power off the unit or place it into hibernation mode when not in
use. The VERDICT display Device has a built in charger that recharges the battery on demand
whenever it is connected to a power source.
Replacing the Battery Pack
If the battery pack no longer hold a charge, contact your sales representative to order a new one.
IMPORTANT:
Replace the battery pack with original Snap-on replacement parts only.
130
Maintenance
z
D7 Display Device
To replace the battery pack:
1. Loosen the two captive screws the secure the battery pack to the back of the unit.
2. Insert a fingernail into the recess at the mid point of the top of the battery pack, then gently
raise the battery pack up to release the electrical connector.
1— Captive Screws
2— Lifting Recess
Figure 15-6 Display Device battery pack replacement
3. Lift the battery pack clear of the unit.
4. Fit the three tabs on the bottom of the new battery pack into the slots, then rotate the assembly
into position.
5. Make sure the battery pack is fully seated.
6. Tighten the two captive screws.
Disposing of the Battery Pack
Always dispose of a lithium-ion battery pack according to local regulations, which vary for different
countries and regions. The battery pack, while non-hazardous waste, does contain recyclable
materials. If shipping is required, ship the battery pack to a recyling facility in accordance with
local, national, and international regulations. For additional information contact:
• North America—Rechargeable Battery Recycling Corporation (RBRC) at http://www.rbrc.org
or http://www.call2recycle.org, or call 1(800) 822-8837 (USA)
• United Kingdom—Electrical Waste Recycling Company at http://www.electricalwaste.com
Products bearing the WEEE logo (Figure 15-7) are subject to European Union regulations.
131
Maintenance
S3 Scanner Module
Figure 15-7 sample WEEE logo
i
NOTE:
Always dispose of materials according to local regulations.
Contact your sales representative for details.
15.1.5 Operating System Restore
Snap-on System Restore is a hard disk drive recovery program that allows you recover the hard
disk drive files in the event of a failure. Running the program replaces all of the C drive data with
the original factory data. Be aware, all new or modified files on the C drive will be lost.
The directional arrow buttons on the D7 Display Device are used to navigate when performing a
system restore. Use the Enter button to make selections.
z
To restore the operating system
1. Power on the D7 Display Device.
2. Wait for the “Press Up Arrow to run Snap-on System Restore” message to display, then Press
the Up Arrow button.
A progress indicator displays while the program loads.
3. Select OK from the confirmation message.
A progress indicator displays while the files are being restored.
4. Select OK from the confirmation message.
The D7 Display Device shuts down, then reboots and the system recovery portion of the
operation begins. Follow any on-screen prompts.
The D7 Display Device shuts down and reboots a second time. When the VERDICT Home
screen displays, the procedure is complete and the D7 Display Device is ready for use.
15.2 S3 Scanner Module
This section covers how to care for your VERDICT S3 Scanner module.
15.2.1 Cleaning and Inspecting the S3 Scanner Module
When using the VERDICT S3 Scanner, make sure to do the following:
• Check the housing, wiring, and connectors for dirt and damage before and after each use.
• At the end of each work day, wipe the housing, wiring, and connectors clean with a slightly
damp cloth.
132
Maintenance
M2 Data Acquisition Device
IMPORTANT:
Do not use any abrasive cleansers or automotive chemicals on the Scanner module.
15.2.2 Replacing the Protective Handgrip
The soft protective handgrip that covers the outer edges of the Scanner is easily replaced should
it become worn or damaged. Contact your sales representative for replacement parts.
z
To replace the protective handgrip:
1. Disconnect the data cable, and any other cables, if attached to the Scanner.
2. From the bottom of the Scanner, gently lift up and out on one side of the handgrip to free it
from Scanner housing.
3. Repeat step 2 to loosen the other side of the handgrip.
4. Lift the handgrip off of the Scanner housing.
i
NOTE:
The handgrip tapers toward the front of the Scanner housing. Make sure the replacement
handgrip is correctly oriented before attempting to install it.
5. Fit the new handgrip over the top, data cable end, of the Scanner housing.
6. With your fingers, work the new handgrip onto the Scanner housing from top to bottom. Make
sure the tabs on the handgrip fit into the grooves on the housing.
15.3 M2 Data Acquisition Device
This section covers how to care for your M2 Data Acquisition Device.
15.3.1 Cleaning and Inspecting the M2 Data Acquisition Device
When using the VERDICT M2, make sure to do the following:
• Check the housing, wiring, and connectors for dirt and damage before and after each use.
• At the end of each work day, wipe the housing, wiring, and connectors clean with a slightly
damp cloth.
IMPORTANT:
Do not use any abrasive cleansers or automotive chemicals to clean the unit, cables, or probes.
15.3.2 Replacing the Battery Pack
If the battery pack no longer hold a charge, contact your sales representative to order a new one.
IMPORTANT:
The battery pack contains no user serviceable components. Tampering with the battery pack
terminals or housing will void the product warranty.
133
Maintenance
M2 Data Acquisition Device
Replace the battery pack with the exact replacement rechargeable nickel-metal hydride (Ni-MH)
type battery only. Do not attempt to use standard (lead/zinc) batteries as they do not provide
sufficient power to operate the Data Acquisition Device, and may leak and damage the tool.
:$51 ,1*
Risk of electric shock.
• Prior to recycling the battery pack, protect exposed terminals with heavy insulating tape
to prevent shorting.
• Disconnect all test leads and turn diagnostic tools off before removing the battery pack.
• Do not attempt to disassemble the battery or remove any component projecting from or
protecting the battery terminals.
• Do not expose the unit or battery pack to rain, snow, or wet conditions.
• Do not short circuit the battery terminals.
Electric shock can cause injury.
IMPORTANT:
Be aware of all applicable safety considerations when replacing, handling, and recycling batteries.
Refer to "Battery Safety Guidelines‚" on page 130 for details.
z
To replace the battery pack:
1. Press to release the hanger catch on the back of the M2 unit (Figure 15-8), then swing the
hanger up (180º) so that it is fully extended.
1— Hanger Catch
2— Captive Screw
Figure 15-8 M2 unit battery pack replacement
2. Loosen the captive screw that secures the battery cover (Figure 15-8).
3. Remove the battery cover.
134
Maintenance
M2 Data Acquisition Device
4. Remove the battery pack from the M2 unit housing to access the electrical connector.
5. Separate the battery pack electrical connector.
6. Connect the new battery pack electrical connector to the M2 unit.
7. Fit the battery into the battery compartment.
8. Fit the battery compartment cover.
9. Tighten the captive screw and fold down the hanger.
135
Appendix A
Software License
SNAP-ON INCORPORATED LICENSE AGREEMENT
YOU SHOULD CAREFULLY READ THE FOLLOWING TERMS AND CONDITIONS BEFORE INSTALLING THIS SOFTWARE
PACKAGE. WHOEVER INSTALLS THIS SOFTWARE PACKAGE MUST EITHER BE THE PERSON WHO ACQUIRED THE
SOFTWARE OR A PERSON AUTHORIZED BY THE PERSON OR ENTITY WHO ACQUIRED THE SOFTWARE TO ACCEPT
THE FOLLOWING TERMS ON SUCH PERSON'S OR ENTITY'S BEHALF. “YOU” AND “YOUR” SHALL REFER TO THE
PERSON OR ENTITY WHO ACQUIRED THIS PRODUCT. INSTALLING THIS SOFTWARE PACKAGE INDICATES YOUR
ACCEPTANCE OF THESE TERMS AND CONDITIONS. IF YOU DO NOT AGREE WITH THEM, YOU SHOULD PROMPTLY
RETURN THE SOFTWARE PACKAGE, UNINSTALLED, TO THE PLACE OF PURCHASE.
LICENSE Upon your acceptance of this License Agreement (the “Agreement”), Snap-on Incorporated (“Snap-on”) grants, subject
to the terms and conditions of this Agreement, to the person or business entity who originally acquired the Software Products
(“Software”) a non-exclusive, non-transferable (except as permitted below), personal license to use the Software (“License”). The
Software in this package is a proprietary product of Snap-on and is protected by copyright law, as well as other intellectual
property laws. Snap-on retains title and ownership of the Software, and it is being licensed to you and not sold. All rights, not
expressly granted to you, are reserved by Snap-on.
CONSENT Each time you use this Software, you consent to the collection, use, disclosure, and processing of Personal
Information in accordance with the Privacy Policy attached as Exhibit A. In particular, if you are located in a jurisdiction outside
the United States, you consent to the transfer of this information to our servers and computer systems in the United States, a
country that may not provide an “adequate” level of data protection within the meaning of the laws in your country. You may
withdraw your consent at any time, subject to any applicable legal or contractual restrictions and prior written notice to Snap-on.
If you wish to withdraw your consent, please contact Snap-on using our information below.
You may contact us at:
Snap-on Incorporated
2801 80th Street
P.O. Box 1410
Kenosha, WI 53141-1410
PERMITTED USES YOU MAY: (i) install the Software on a single automotive diagnostic computer provided you keep the original
solely for backup or archival purposes; (ii) transfer the Software and License to another party if the other party agrees to accept
the terms and conditions of this Agreement, you retain no copies of the Software, and you transfer all of the Software to such other
party.
PROHIBITED USES YOU MAY NOT: (i) copy the Software into any machine readable or printed form for backup or archival
purposes; (ii) modify, merge, translate, decompile, reverse engineer, disassemble, decode, or otherwise alter or attempt to derive
the source code of the Software; (iii) use the Software on more than one computer at the same time; (iv) separate the Software's
component parts for use on more than one computer; (v) transfer, assign, rent, lease, sell, or otherwise dispose of the Software
on temporary or permanent basis except as expressly provided herein; (vi) use the Software in any outsourcing, timesharing or
service bureau arrangement; and/or (vii) provide, disclose, divulge or make available to, or permit use of the Software by any third
party without Snap-on's prior written consent. You will not remove any proprietary notices from the Software and will include such
notices on any authorized copies of the Software.
TERM The License is effective until terminated. You may terminate it at any time by destroying the Software. The License will also
terminate automatically without notice from Snap-on if you fail to comply with any provision of this Agreement. You agree upon
such termination to destroy the Software and upon Snap-on's request to certify in writing that you have so destroyed the Software.
LIMITED WARRANTY Snap-on warrants, for a period of sixty (60) days from the date of delivery to you as evidenced by a copy
of your sales receipt, that the Software will perform substantially in accordance with the accompanying technical specifications in
the documentation, under normal use. THIS LIMITED WARRANTY IS PROVIDED IN LIEU OF ANY OTHER EXPRESS
WARRANTIES (IF ANY), ALL OF WHICH ARE DISCLAIMED BELOW. THIS LIMITED WARRANTY IS THE ONLY EXPRESS
WARRANTY THAT IS PROVIDED TO YOU AND IS NOT TRANSFERABLE OR ASSIGNABLE.
© 2010 Snap-on Incorporated. All rights reserved.
8-13963A03 Rev. C
136
Software License
SNAP-ON INCORPORATED LICENSE AGREEMENT
WARRANTY DISCLAIMER EXCEPT AS SET FORTH IN THE ABOVE LIMITED WARRANTY AND TO THE MAXIMUM
EXTENT PERMITTED BY APPLICABLE LAW, THE SOFTWARE IS PROVIDED “AS IS”, WITH ALL FAULTS AND WITHOUT
WARRANTY, EITHER EXPRESS, IMPLIED OR STATUTORY, INCLUDING, BUT NOT LIMITED TO THE IMPLIED
WARRANTIES OF MERCHANTABILITY AND FITNESS FOR A PARTICULAR PURPOSE, OF LACK OF VIRUSES, AND OF
LACK OF NEGLIGENCE OR LACK OF WORKMANLIKE EFFORT AND ALL SUCH WARRANTIES ARE HEREBY EXPRESSLY
DISCLAIMED.
SNAP-ON AND ITS AFFILIATED COMPANIES DO NOT WARRANT, GUARANTEE, OR MAKE ANY REPRESENTATIONS
REGARDING THE USE, OR THE RESULTS OF THE USE, OF THE SOFTWARE OR WRITTEN MATERIALS IN TERMS OF
CORRECTNESS, ACCURACY, RELIABILITY, CURRENTNESS, OR IN TERMS OF YOUR REQUIREMENTS. ALSO, THERE
IS NO WARRANTY OF TITLE OR NONINFRINGEMENT IN THE SOFTWARE. NO ORAL OR WRITTEN INFORMATION OR
ADVICE GIVEN BY SNAP-ON OR ITS AFFILIATED COMPANIES, OR THEIR RESPECTIVE AGENTS, DISTRIBUTORS,
DEALERS AND EMPLOYEES, SHALL CREATE A WARRANTY OR IN ANY WAY INCREASE THE SCOPE OF THIS
WARRANTY, AND YOU MAY NOT RELY ON ANY SUCH INFORMATION OR ADVICE. SNAP-ON DOES NOT WARRANT THE
OPERATION OF THE SOFTWARE TO BE UNINTERRUPTED OR ERROR-FREE, NOR DOES SNAP-ON MAKE ANY
WARRANTY OR REPRESENTATION REGARDING THE USE OR OUTPUT OF THE SOFTWARE IN TERMS OF
CORRECTNESS, ACCURACY, COMPLETENESS, TIMELINESS, SEQUENCE, RELIABILITY OR OTHERWISE OR THAT THE
SOFTWARE WILL MEET YOUR REQUIREMENTS. SOME JURISDICTIONS DO NOT ALLOW THE EXCLUSION OF IMPLIED
WARRANTIES, SO THE ABOVE EXCLUSIONS MAY NOT APPLY TO YOU TO THE EXTENT SUCH EXCLUSION IS NOT
ALLOWED BY APPLICABLE LAW. THE LIMITED WARRANTY GIVES YOU SPECIFIC LEGAL RIGHTS, AND YOU ALSO MAY
HAVE OTHER RIGHTS THAT VARY BY JURISDICTION.
YOUR EXCLUSIVE REMEDY If, during the sixty (60) day warranty period, the Software fails to comply with the limited warranty
set forth above, provided you notify Snap-on within such sixty (60) day warranty period, Snap-on shall, at Snap-on's sole option,
either: (i) the return the price paid (if any) for the Software; or (ii) repair or replace at no charge, the Software not meeting the
Limited Warranty, and which is returned to Snap-on at your expense with a copy of the sales receipt. THE FOREGOING IS SNAPON'S ENTIRE LIABILITY AND YOUR SOLE AND EXCLUSIVE REMEDY RELATING TO BREACH OF THE LIMITED
WARRANTY. If failure of the Software has resulted from accident, abuse, misuse or misapplication, Snap-on shall have no
responsibility whatsoever. Any replacement Software will be warranted for the remainder of the original warranty period of sixty
(60) days.
EXCLUSION OF CONSEQUENTIAL, INCIDENTAL AND CERTAIN OTHER DAMAGES TO THE MAXIMUM EXTENT
PERMITTED BY APPLICABLE LAW, NEITHER SNAP-ON NOR ANY ONE ELSE WHO HAS BEEN INVOLVED IN THE
CREATION, PRODUCTION, OR DELIVERY OF THE SOFTWARE, INCLUDING BUT NOT LIMITED TO SNAP-ON'S
AFFILIATED COMPANIES, DISTRIBUTORS OR DEALERS SHALL BE LIABLE TO YOU FOR ANY INDIRECT,
CONSEQUENTIAL, EXEMPLARY, SPECIAL, INCIDENTAL OR PUNITIVE DAMAGES WHATSOEVER (INCLUDING BUT NOT
LIMITED TO DAMAGES FOR LOSS OF BUSINESS OR PERSONAL PROFITS, BUSINESS INTERRUPTION, LOSS OF
BUSINESS OR PERSONAL OR CONFIDENTIAL INFORMATION, OR ANY OTHER PECUNIARY LOSS, DAMAGES FOR
LOSS OF PRIVACY, OR FOR FAILURE TO MEET ANY DUTY, INCLUDING ANY DUTY OF GOOD FAITH OR TO EXERCISE
COMMERICALLY REASONABLE CARE OR FOR NEGLIGENCE) ARISING OUT OF OR IN ANY WAY RELATED TO THE USE
OR INABILITY TO USE SUCH SOFTWARE, EVEN IF SNAP-ON HAS BEEN ADVISED OF THE POSSIBILITY OF SUCH
DAMAGES. IN NO EVENT WILL SNAP-ON'S OR ITS AFFILIATED COMPANIES' TOTAL LIABILITY FOR ANY AND ALL
DAMAGES, LOSSES AND CAUSES OF ACTION, WHETHER IN CONTRACT, TORT (INCLUDING NEGLIGENCE), STRICT
LIABILITY OR OTHERWISE, EXCEED THE AMOUNT PAID BY YOU FOR THE SOFTWARE. SOME STATES/
JURISDICTIONS DO NOT ALLOW THE EXCLUSION OR LIMITATION OF INCIDENTAL OR CONSEQUENTIAL DAMAGES,
SO CERTAIN OF THE ABOVE LIMITATION OR EXCLUSION MAY NOT APPLY TO YOU.
TAXES AND CHARGES You will be responsible for all applicable federal, state or local taxes, tariffs or duties, now or hereafter
imposed except for those taxes related to the income of Snap-on.
EXPORT ADMINISTRATION COMPLIANCE This Agreement is made subject to any restrictions concerning the export of the
Software from the United States of America or the country in which you are located. You will comply fully with all relevant export
laws and regulations of the United States and any local country, and you will not export, directly or indirectly, the Software nor any
other technical data received from Snap-on, nor any part thereof, in violation of such laws.
RESTRICTED RIGHTS The Software is provided with RESTRICTED RIGHTS. Use, duplication, or disclosure by or on behalf of
any unit or agency of the United States Government (the “Government”) is subject to restrictions as set forth in subparagraph
137
Software License
SNAP-ON INCORPORATED LICENSE AGREEMENT
(c)(1) of the Rights in Technical Data and Computer Licensed Software clause at DFARS 252.227-7013 or subparagraphs (c)(1)
and (2) of the Commercial Computer Licensed Software---Restricted Rights at 48 CFR 52.227-19, as applicable. Manufacturer is
Snap-on Incorporated or one of its affiliates, 2801 80th Street, Kenosha, WI 53143.
GOVERNING LAW; EXCLUSIVE JURISDICTION This Agreement will be governed by the laws of the State of Wisconsin
(excluding its choice of laws principles). YOU CONSENT TO EXCLUSIVE JURISDICTION AND VENUE IN THE FEDERAL
COURTS SITTING IN MILWAUKEE COUNTY, WISCONSIN, UNLESS NO FEDERAL JURISDICTION EXISTS, IN WHICH
CASE YOU CONSENT TO EXCLUSIVE JURISDICTION AND VENUE IN ANY STATE COURT LOCATED IN MILWAUKEE
COUNTY, WISCONSIN. YOU WAIVE ALL DEFENSES OF LACK OF PERSONAL JURISDICTION AND FORUM NON
CONVENIENS. THE PARTIES HEREBY EXPRESSLY AGREE THAT THIS AGREEMENT SHALL NOT BE GOVERNED BY
THE UNITED NATIONS CONVENTION ON CONTRACTS FOR THE INTERNATIONAL SALE OF GOODS.
GENERAL You agree that this Agreement is the complete and exclusive statement of the Agreement between you and Snap-on
which supersedes any proposal or prior agreement, oral or written, and any other communications between you and Snap-on
relating to the subject of this Agreement. If for any reason a court of competent jurisdiction finds any provision of this Agreement
to be unenforceable, that provision will be enforced to the maximum extent permissible so as to effect the intent of the parties,
and the remainder of this Agreement will continue in full force and effect. Any failure by either party to require strict performance
by the other of any provision of this Agreement will not constitute a waiver of such provision or thereafter affect the party's full
rights to require strict performance. This Agreement may only be amended by specific written amendment signed by authorized
representatives of both parties.
YOU ACKNOWLEDGE THAT YOU HAVE READ THIS AGREEMENT, UNDERSTAND IT AND AGREE TO BE BOUND BY ITS
TERMS AND CONDITIONS.
138
Software License
EXHIBIT A: SNAP-ON INCORPORATED PRIVACY POLICY
The privacy of your personally identifiable information is important to us. As part of our commitment to the privacy of your
personally identifiable information (“Personal Information”) that we collect through the Software Product (“Software”), we provide
this notice explaining our information practices and the choices you can make about the way your Personal Information is
collected and used with the Software. To make this notice easy to find, we make it available with the Software. This revised
Privacy Policy is effective as of January 1, 2006.
The privacy practices set forth in this Privacy Policy are for this Software only. Other Snap-on Incorporated (“Snap-on”) affiliate
Software may have different practices. If you use other Snap-on Software, please review the privacy policies, if any, provided with
that Software. Also, if you are an employee of Snap-on or its affiliates, please note that other internal company policies apply to
you related to employee use of company computer systems and networks.
CONSENT Please read this policy carefully. Your use of this Software constitutes your consent to the collection, use, disclosure
and processing of Personal Information in the United States as described below.
FOREIGN VISITORS The Software maybe used by persons located in jurisdictions worldwide. Please review the Foreign Users
Notices section near the end of this Privacy Policy, where we may provide additional notices regarding the collection, use,
disclosure, and processing of your Personal Information in accordance with the laws in your country.
ACTIVE COLLECTION OF PERSONAL INFORMATION When you use the Software you provide Personal Information to
register, order products or services, contact Snap-on, and conduct other transactions via the Software. The types of Personal
Information actively collected in the Software may include any or all of the following, depending on your activities using the
Software:
Date of sale, franchisee name, franchisee address, e-mail, invoice number, product number, quantity, device serial number,
customer name, customer address, customer phone number, Snap-on customer number (if applicable), Software training
requested and received, and other Personal Information that you actively provide to us via the Software.
Snap-on agrees not to disclose or use any Customer's specific company or end customer data shared with Snap-on except to the
extent necessary to carry out its obligations under this Agreement, which may include sharing such Customer's specific company
or end customer data with Third Party Providers. Snap-on reserves the right to aggregate and market general data collected from
a Customer for the purposes of benchmarking, research and data analysis.
PURPOSE FOR WHICH WE USE AND DISCLOSE PERSONAL INFORMATION We use and disclose Personal Information
obtained when you purchase the product/software and agree to provide this information to the Snap-on Franchise.
We also use Personal Information to communicate with you, for example, to answer the e-mail and correspondence we receive,
to confirm your order, to send more information about becoming a dealer, to send renewal notices, and to notify you of important
changes in the functionality of the Software or other notices related to the handling of your Personal Information.
We may use Personal Information to make recommendations for additional products or special offers, and to provide you with
updates on new products that we believe may be of interest to you, in situations where you expressly request such
communications.
From time to time, we may share certain Personal Information with select third parties including other Snap-on affiliates and
independent Snap-on dealers in your area to enable them to offer products or services that may be of interest to you. If you do
not want us to share such Personal Information in the future, please contact us by using our information below and we will take
reasonable measures to avoid sharing such information in the future. Please note that such third parties are usually independent
from Snap-on, and if you wish to stop all communications from such parties, you will need to address such issues with the third
parties directly.
We may disclose Personal Information in response to legal process or when we believe in good faith that the law requires it, for
example, in response to a court order, subpoena or a law enforcement agency's request. We also reserve the right to disclose
Personal Information to protect the security of the Software, to protect ourselves and our affiliated companies against liability, and/
or in connection with any sale, assignment, or other transfer of all or a part of our business.
We may share Personal Information with our consultants or service providers to help us serve you better. We also contract other
companies and individuals (collectively “Suppliers”) to perform functions on our behalf, including without limitation, fulfilling and
processing orders, handling shipping and returns, sending communications to you, and providing customer services. We require
139
Software License
EXHIBIT A: SNAP-ON INCORPORATED PRIVACY POLICY
the Suppliers to agree to abide by Snap-on's privacy policy and only use your Personal Information, only until payment for your
order is processed, and only to the extent necessary to perform their functions, and may not use it for any other purpose.
We will not use or share the Personal Information provided to us in the Software in ways unrelated to the ones described above
without first providing you an opportunity to opt out or otherwise prohibit such unrelated uses.
CUSTOMIZATION AND AGGREGATE DATA We use non-identifying and aggregate information to better design our Software
and gather information for product management and development at Snap-on. For example, we may tell our sales and marketing
staff that X number of individuals using the Software, or that Y number of software licenses were ordered during a particular time
period, but we would not disclose anything that could be used to identify those individuals. This aggregate information may also
be shared with Snap-on's affiliates and independent dealers.
CHILDREN'S PRIVACY Snap-on has no intention of collecting personal information from children in this Software.
HOW YOU CAN ACCESS OR CORRECT YOUR INFORMATION If you are a registered user of the Software, you can access
and correct certain Personal Data that we collect through the Software and maintain by using the contact information below. You
may also contact us using the information below to ask us to remove your Personal Information from our records, electronic or
otherwise. However, we will need to maintain certain Personal Information about your product purchases in our records for
purposes such as warranty and product information. We will usually be glad to update your information, but we reserve the right
to use Personal Information obtained previously to verify your identity, administer our warranty program, or to take other actions
that we believe are appropriate.
COLLECTION OF PERSONAL INFORMATION BY THIRD PARTIES Sometimes we may offer promotions or specials that are
sponsored by or co-sponsored with identified third parties. By virtue of their sponsorship, these third parties may obtain Personal
Information that you submit to participate in the promotion or special. Snap-on has no control over the third-party sponsors' use
of this information. We will notify you at the time of requesting Personal Information if third-party sponsors will obtain such
information, and obtain your express consent for such disclosures.
CHANGES TO THE POLICY Our privacy practices are subject to change. We reserve the right to change this policy from time to
time in our sole discretion. Please review this policy before you submit additional Personal Information via the Software. All
revisions to this Privacy Policy will be communicated to you through updates to the License Agreement. Your continued use of
the Software constitutes acceptance of such changes in the Privacy Policy, except where further steps are required by applicable
law.
FOREIGN USERS NOTICES Please contact us at the address below to obtain Privacy Policy information for your country.
HOW TO CONTACT US Please feel free to contact us with any comments, questions, or suggestions you may have regarding
the information practices described in this Privacy Policy. Please also contact us to report any known or suspected privacy or
security breaches.
You may contact us at:
Snap-on Incorporated
2801 80th Street
P.O. Box 1410
Kenosha, WI 53141-1410
140
Index
A
AC/DC power supply 6
actuator tests 32
Alarms 46
alligator clips 92
amp probe 92
B
battery pack 6, 10
disposal 131
handling 130
replacing 130, 133
specifications 5, 10
battery recycling 131
battery service 129
C
cables
channel 1 91
channel 2 91
common (GND) 92
camera 19
capabilities, scope multimeter 90
Clear Codes 32
clear codes 52
clearing codes 38
Codes Menu 32
codes. See diagnostic trouble codes (DTCs)
communication protocol 57
Component Information 62
component information 62–63
Component Test 58–66
custom configure 58
favorites 59
operations 62–66
performing tests 66
vehicle identification 58–61
component tests 40, 63–64
connecting to a vehicle 27, 33, 66
Connector Information 52–53
Current Probe 92
Data Acquisition Device
battery replacement 133
cleaning 133
navigation 19–21
wireless connection 113–114
Data Display 32, 33
data display 32
Data Manager 115–120
operations 117–120
properties 119
screen layout 115
toolbar 116
data parameters
displaying 32, 37
delete 123
demonstration programs 22
diagnostic connector 52–53
location 52
diagnostic trouble codes (DTCs) 32
dimensions, unit 5, 8, 10
Disconnecting from the vehicle 23
Display Device
battery replacement 129
cleaning 129
connecting wireless devices 111–114
controls 18–19
display settings, scope 102
display, specifications 5
docking cradle 6
DTC status 39
E
Emergency shutdown 17
F
Fast-Track Troubleshooter 33, 42
Freeze Frame/Failure Records 39
functional tests 32, 40
G
Generic Functions 33, 41
H
D
D7 Display Device
functional description 3–4
introduction 3
specifications 5
help 108–110
141
Index
I
identifying a test vehicle 33
information tests 40
L
Power on 11
power sources 6, 8, 10
AC/DC power supply 6, 10
pressure units 15
Properties 45
layout settings, scope 103
R
M
M2 Data Acquisition Device
controls and features 67–69
functional description 9
introduction 9
multimeter operations 69–86
soft keys 68–69
specifications 10
wireless communication 9
Making Selections
Scanner 31
manual conventions
description 1
notes 2
Memory Resets 32
menu button 13
Messages
confirmation 31
error 31
warning 31
messages
safety iii–iv
meter capabilities 90
Modules 12
O
OBD Diagnose 53–57
OBD Health Check 50–53
operating temperature 5, 8
Operations
Component Tests 63
operations
connecting to a vehicle 27, 33
identifying a test vehicle 33
selecting a system to test 33
selecting tests 33
options
digital multimeter 98
graphing meter 98
scope 97
oxygen sensor tests 42
P
parameters. See data parameters
PIDs. See data parameters
Power off 17
readiness monitors 52
recording data 95
Repair Information 107
reset tests 40
S
S3 Scanner Module
introduction 7
specifications 8
wireless communication 7
Safety iii–iv
Scale 44
Scanner
actuator tests 32
alarms 46
checking codes 51
cleaning 132
clear codes 32, 52
codes menu 32, 37–40
communication protocol 57
component tests 40
connecting 27
custom data list 43
data 33–37
demonstration program 22
disconnecting 23
exiting 47
functional tests 32, 40
generic functions 33, 41, 50–57
handgrip replacement 133
memory resets 32
OBDII testing 50–57
operations 22–47
pending codes 51
properties 45
readiness monitors 52
scale 44
screen 30
screen layout 28
screen messages 31
sweep 45
system selecting 33
system tests 33
toolbar 29, 43–46
trigger 36
Troubleshooter 33, 42
vehicle ID 33
wireless connection 112–113
142
Index
Scope
record/playback controls 95
sweep controls 100
trace controls 98
trigger controls 100
view controls 102
Scope Layout 93
Scope Multimeter
configuring 97
cursor controls 105
file controls 106
leads 91–92
making selections 96
operations 89–106
playback toolbar 95
presets 98
print controls 106
refresh controls 106
safety 89
screen layout 94
setup 98
setup controls 104
toolbar 93
traces 98
scope screen layout 94
screen colors 45
screen main body 30
screen messages 31
search 123
selecting a system to test 33
selecting tests 33
ShopKey5 107
software
Troubleshooter 42
speed units 15
stand, the 19
storage temperature 6, 8
subsystem tests 40
Sweep 45
System Settings 111–114
system tests 33, 40
T
temperature
operating 5, 8
storage 6, 8
temperature units 15
test leads 91–92
tests
actuator 32
component 40
functional 32, 40
selecting 33
subsystem 40
system 33, 40
toggle tests 40
Toolbar
scope multimeter 93
Vehicle History 122
VERDICT 13
toolbar
record/playback controls 95
Scanner 29, 43
scope multimeter 93
Trace Controls, scope 98
trigger
condition 36
Triggers
setting 35
trouble codes. See diagnostic trouble codes (DTCs)
Troubleshooter 33, 42
Troubleshooter software. See software
U
units settings, scope 103
Units Setup 104
V
variable control tests 40
vehicle diagnostic connectors 27
Vehicle History 121–125
activate 122
delete 123
operations 122–125
screen layout 121
search 123
settings 124
toolbar 122
view 123
vehicle identification 121–122
VERDICT
toolbar 13–17
View 123
Viewing component information 62
W
weight, unit 5, 8
wireless
synchronizing devices 111–114
wireless communication 7, 9
143