1
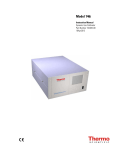
Model 49i
Instruction Manual
UV Photometric O3 Analyzer
Part number 102434-00
17Nov2011
© 2007 Thermo Fisher Scientific Inc. All rights reserved.
Specifications, terms and pricing are subject to change. Not all products are available in all countries. Please consult
your local sales representative for details.
Thermo Fisher Scientific
Air Quality Instruments
27 Forge Parkway
Franklin, MA 02038
1-508-520-0430
www.thermo.com/aqi
WEEE Compliance
This product is required to comply with the European Union’s Waste
Electrical & Electronic Equipment (WEEE) Directive 2002/96/EC. It is
marked with the following symbol:
Thermo Fisher Scientific has contracted with one or more recycling/disposal
companies in each EU Member State, and this product should be disposed
of or recycled through them. Further information on Thermo Fisher
Scientific’s compliance with these Directives, the recyclers in your country,
and information on Thermo Fisher Scientific products which may assist the
detection of substances subject to the RoHS Directive are available at:
www.thermo.com/WEEERoHS.
Thermo Fisher Scientific
WEEE Compliance
Equivalent Method Designation
The Thermo Scientific Model 49i is designated by the United States
Environmental Protection Agency (USEPA) as an Equivalent Method for
the measurement of ambient concentrations of ozone pursuant with the
requirements defined in the Code of Federal Regulations, Title 40, Part 53.
Designated Equivalent Method Number: EQOA-0880-047
EPA Designation Date: August 27, 1980 (amended for Model 49i)
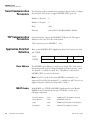
The Model 49i meets EPA designation requirements when operated as
follows:
Range
50 to 1000 ppb
Averaging Time
10 to 300 seconds
Temperature Range
20 to 30 °C
Line Voltage
90 to 110 Vac @50/60 Hertz
105 to 125 Vac @50/60 Hertz
210 to 250 Vac @50/60 Hertz
Pressure Compensation
ON or OFF
Temperature Compensation
ON or OFF
Flow Rate
1 to 3 LPM
RS-232/RS-485 Interface
With or without the following options:
Teflon Particulate Filter
Rack Mounts
Internal Ozonator with Remote Activation
Internal Zero Air Scrubber
I/O Expansion Board
Thermo Fisher Scientific
Equivalent Method Designation
Contents
Thermo Fisher Scientific
Chapter 1
Introduction......................................................................................1-1
Principle of Operation ............................................................1-2
Specifications ..........................................................................1-3
Chapter 2
Installation .......................................................................................2-1
Lifting.....................................................................................2-1
Unpacking and Inspection ......................................................2-1
Setup Procedure ......................................................................2-3
Connecting External Devices ..................................................2-5
Terminal Board PCB Assemblies..........................................2-5
Startup ....................................................................................2-9
Chapter 3
Operation ..........................................................................................3-1
Display....................................................................................3-2
Pushbuttons ............................................................................3-3
Soft Keys..............................................................................3-4
Software Overview ..................................................................3-4
Power-Up Screen .................................................................3-6
Run Screen...........................................................................3-6
Main Menu..........................................................................3-7
Range Menu ...........................................................................3-8
Single Range Mode ..............................................................3-8
Dual Range Mode..............................................................3-10
Auto Range Mode..............................................................3-11
Gas Units ...........................................................................3-14
O3 Range ...........................................................................3-14
Set Custom Ranges ............................................................3-16
Averaging Time.....................................................................3-17
Calibration Factors Menu .....................................................3-18
O3 Background..................................................................3-18
O3 Span Coefficient...........................................................3-20
Calibration Menu .................................................................3-21
Calibrate Zero....................................................................3-22
Calibrate O3 Coefficient ....................................................3-22
Zero/Span Check ...............................................................3-23
Model 49i Instruction Manual
vii
Contents
Instrument Controls Menu ...................................................3-27
Custom Levels....................................................................3-27
Pump .................................................................................3-28
Ozonator Solenoid .............................................................3-29
Cycle Time ........................................................................3-29
Temperature Compensation...............................................3-30
Pressure Compensation ......................................................3-30
Datalogging Settings ..........................................................3-31
Communication Settings....................................................3-41
I/O Configuration..............................................................3-49
Screen Contrast..................................................................3-62
Service Mode .....................................................................3-63
Date/Time .........................................................................3-63
Diagnostics Menu .................................................................3-64
Program Version ................................................................3-64
Voltages .............................................................................3-65
Temperatures .....................................................................3-67
Pressure..............................................................................3-67
Flows .................................................................................3-67
Cell A/B O3 .......................................................................3-68
Intensities...........................................................................3-68
Analog Input Readings.......................................................3-69
Analog Input Voltages........................................................3-69
Digital Inputs.....................................................................3-69
Relay States ........................................................................3-70
Test Analog Outputs..........................................................3-70
Instrument Configuration ..................................................3-71
Contact Information ..........................................................3-72
Alarms Menu ........................................................................3-72
O3 Lamp Temperature.......................................................3-73
Lamp Temperature ............................................................3-74
Bench Temperature............................................................3-75
Pressure..............................................................................3-76
Flow A and B .....................................................................3-77
Intensity A and B ...............................................................3-78
Zero and Span Check.........................................................3-79
Zero and Span Auto Calibration ........................................3-80
Ozonator Level 1-5 Check .................................................3-80
O3 Concentration ..............................................................3-81
Service Menu ........................................................................3-83
Pressure Check...................................................................3-83
Lamp Setting......................................................................3-85
Detector Calibration ..........................................................3-86
Intensity Check..................................................................3-86
viii
Model 49i Instruction Manual
Thermo Fisher Scientific
Contents
Range Mode Select................................................................3-87
Pressure Calibration ...........................................................3-88
Flow A and B Calibration ..................................................3-90
Temperature Calibration....................................................3-92
Analog Output Calibration ................................................3-93
Analog Input Calibration ...................................................3-94
Dilution Ratio....................................................................3-96
Display Pixel Test ..............................................................3-96
Restore User Defaults.........................................................3-97
Password Menu.....................................................................3-97
Set Password ......................................................................3-98
Lock Instrument ................................................................3-98
Change Password ...............................................................3-99
Remove Password...............................................................3-99
Unlock Instrument ..........................................................3-100
Thermo Fisher Scientific
Chapter 4
Calibration........................................................................................4-1
Equipment Required...............................................................4-1
Zero Air Generator ..............................................................4-1
Calibration Photometer System............................................4-2
Instrument Preparation ...........................................................4-3
Calibration Photometer System Preparation............................4-3
System Check.......................................................................4-3
Ozone Loss Test...................................................................4-4
Linearity Check....................................................................4-5
Intercomparability Test........................................................4-7
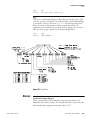
Calibration Procedure .............................................................4-8
Connect Instrument.............................................................4-9
Zero Adjust ..........................................................................4-9
Span Adjust........................................................................4-10
Additional Concentration Standards ..................................4-10
Calibration Curve ..............................................................4-11
Periodic Zero and Span Checks.............................................4-11
Internal Ozonator Adjustment (Option) ...............................4-13
Chapter 5
Preventive Maintenance ...............................................................5-1
Safety Precautions ...................................................................5-2
Replacement Parts...................................................................5-2
Outside Case Cleaning............................................................5-2
Optical Bench Cleaning ..........................................................5-2
Lamp Replacement .................................................................5-3
Monitoring Detector Frequencies and Noise...........................5-4
Increasing Lamp Output......................................................5-4
Monitoring Lamp Noise ......................................................5-4
Model 49i Instruction Manual
ix
Contents
Capillary Service......................................................................5-5
Pump Rebuilding....................................................................5-6
Leak Test and Pump Checkout ...............................................5-7
External Leaks ......................................................................5-7
Solenoid Leaks ....................................................................5-8
Solenoid Leak Test...............................................................5-9
Ozone Scrubber Test.............................................................5-10
x
Model 49i Instruction Manual
Chapter 6
Troubleshooting.............................................................................. 6-1
Safety Precautions ...................................................................6-1
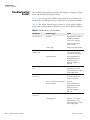
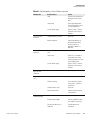
Troubleshooting Guides..........................................................6-2
Board-Level Connection Diagrams .........................................6-6
Connector Pin Descriptions ....................................................6-8
Service Locations...................................................................6-21
Chapter 7
Servicing .......................................................................................... 7-1
Safety Precautions ...................................................................7-3
Firmware Updates...................................................................7-4
Accessing the Service Mode.....................................................7-4
Replacement Parts List ............................................................7-4
Cable List................................................................................7-6
External Device Connection Components ..............................7-6
Removing the Measurement Bench and
Lowering the Partition Panel...................................................7-8
Fuse Replacement ...................................................................7-9
Pump Replacement ...............................................................7-10
Fan Replacement...................................................................7-11
Analog Output Testing .........................................................7-12
Analog Output Calibration ...................................................7-14
Analog Input Calibration ......................................................7-15
Calibrating the Input Channels to Zero Volts ....................7-15
Calibrating the Input Channels to Full Scale......................7-16
I/O Expansion Board Replacement (Optional) .....................7-17
Digital Output Board Replacement.......................................7-19
Motherboard Replacement....................................................7-20
Measurement Interface Board Replacement ..........................7-21
Front Panel Board Replacement............................................7-22
LCD Module Replacement ...................................................7-23
Optical Bench Replacement ..................................................7-24
Optical Bench Temperature Calibration ...............................7-26
Photometer Lamp Replacement ............................................7-27
Photometer Lamp Voltage Adjustment .................................7-28
Photometer Board Replacement............................................7-29
Detector Replacement...........................................................7-30
Thermo Fisher Scientific
Contents
Ozone Scrubber Replacement ...............................................7-31
Sample/Reference Solenoid Replacement ..............................7-32
Zero/Span Solenoid Replacement (Optional)........................7-33
Pressure Transducer Replacement .........................................7-33
Pressure Transducer Calibration ...........................................7-34
Flow Transducer Replacement ..............................................7-36
Flow Transducer Calibration ................................................7-37
Ozonator Lamp Replacement (Optional)..............................7-38
Ozonator Lamp Heater Replacement (Optional) ..................7-40
Ozonator Replacement (Optional)........................................7-41
Ozonator Board Replacement (Optional)..............................7-41
Service Locations...................................................................7-42
Chapter 8
Thermo Fisher Scientific
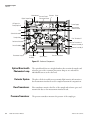
System Description.........................................................................8-1
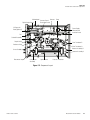
Hardware ................................................................................8-1
Optical Bench with Photometer Lamp.................................8-2
Detector System...................................................................8-2
Flow Transducers.................................................................8-2
Pressure Transducer .............................................................8-2
Ozonator Assembly ..............................................................8-3
Ozonator Lamp Power Supply .............................................8-3
Photometer Lamp Power Supply..........................................8-3
Optical Bench Temperature Thermistor ..............................8-3
Pump ...................................................................................8-3
Sample/Reference Solenoid Valves .......................................8-3
Software ..................................................................................8-3
Instrument Control..............................................................8-4
Monitoring Signals...............................................................8-4
Measurement Calculations ...................................................8-4
Output Communication ......................................................8-5
Electronics ..............................................................................8-5
Motherboard........................................................................8-5
Measurement Interface Board ..............................................8-6
Digital Output Board...........................................................8-7
I/O Expansion Board (Optional) .........................................8-7
Front Panel Connector Board ..............................................8-8
I/O Components ....................................................................8-8
Analog Voltage Outputs.......................................................8-8
Analog Current Outputs (Optional) ....................................8-9
Analog Voltage Inputs (Optional) ........................................8-9
Digital Relay Outputs ..........................................................8-9
Digital Inputs.......................................................................8-9
Model 49i Instruction Manual
xi
Contents
Serial Ports ............................................................................8-10
RS-232 Connection ...........................................................8-11
RS-485 Connection ...........................................................8-11
Ethernet Connection..........................................................8-12
External Accessory Connector ............................................8-12
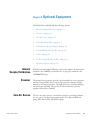
Chapter 9
Optional Equipment........................................................................ 9-1
Internal Sample/Calibration....................................................9-1
Ozonator.................................................................................9-1
Zero Air Source.......................................................................9-1
Teflon Particulate Filter ..........................................................9-2
I/O Expansion Board Assembly...............................................9-2
Terminal Block and Cable Kits ...............................................9-2
Cables .....................................................................................9-2
25-Pin Terminal Board Assembly............................................9-4
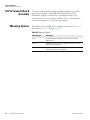
Mounting Options..................................................................9-4
Appendix A Warranty .........................................................................................A-1
Appendix B C-Link Protocol Commands .........................................................B-1
Instrument Identification Number......................................... B-2
Entering Units in PPB ........................................................... B-2
Accessing Streaming Data ...................................................... B-2
Commands ............................................................................ B-2
Measurements ........................................................................ B-8
Alarms.................................................................................. B-11
Diagnostics .......................................................................... B-16
Datalogging ......................................................................... B-17
Calibration........................................................................... B-24
Keys/Display ........................................................................ B-26
Measurement Configuration ................................................ B-29
Hardware Configuration ...................................................... B-33
Communications Configuration .......................................... B-35
I/O Configuration................................................................ B-39
Record Layout Definition .................................................... B-43
Format Specifier for ASCII Responses............................... B-44
Format Specifier for Binary Responses .............................. B-44
Format Specifier for Front-Panel Layout .......................... B-45
Appendix C MODBUS Protocol.........................................................................C-1
Serial Communication Parameters ......................................... C-2
TCP Communication Parameters .......................................... C-2
xii
Model 49i Instruction Manual
Thermo Fisher Scientific
Contents
Application Data Unit Definition .......................................... C-2
Slave Address....................................................................... C-2
MBAP Header .................................................................... C-2
Function Code.................................................................... C-3
Data.................................................................................... C-3
Error Check ........................................................................ C-3
Function Codes...................................................................... C-3
(0x01/0x02) Read Coils / Read Inputs ............................... C-3
(0x03/0x04) Read Holding Registers / Read Input RegistersC-5
(0x05) Force (Write) Single Coil......................................... C-7
MODBUS Commands Supported......................................... C-8
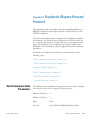
Appendix D Geysitech (Bayern-Hessen) Protocol........................................D-1
Serial Communication Parameters .........................................D-1
TCP Communication Parameters ..........................................D-2
Instrument Address ................................................................D-2
Abbreviations Used ................................................................D-2
Basic Command Structure .....................................................D-2
Block Checksum <BCC> .......................................................D-3
Geysitech Commands ............................................................D-3
Instrument Control Command (ST)...................................D-3
Data Sampling/Data Query Command (DA) .....................D-4
Measurements Reported in Response to
DA Command for 49i and 49i PS.......................................D-7
Operating and Error Status .................................................D-7
Thermo Fisher Scientific
Model 49i Instruction Manual
xiii
Contents
xiv
Model 49i Instruction Manual
Thermo Fisher Scientific
Figures
Figures
Model 49i Flow Schematic ......................................................1-3
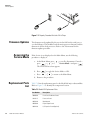
Remove the Packing Material ..................................................2-2
Remove the Shipping Screws ...................................................2-2
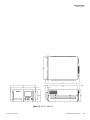
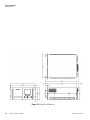
Model 49i Rear Panel ..............................................................2-4
Atmospheric Dump Bypass Plumbing .....................................2-4
I/O Terminal Board Views ......................................................2-6
D/O Terminal Board Views ....................................................2-7
25-Pin Terminal Board Views .................................................2-8
49i Front Panel Display ...........................................................3-2
Front Panel Pushbuttons .........................................................3-3
Flowchart of Menu-Driven Software .......................................3-5
Pin-Out of Rear Panel Connector in Single Range Mode ........3-9
Pin-Out of Rear Panel Connector in Dual Range Mode ........3-10
Analog Output in Auto Range Mode ....................................3-12
Pin-Out of Rear Panel Connector in Auto Range Mode ........3-13
Model 49i Connected as Calibrator .........................................4-3
Model 49i Connected to Calibration Photometer
and External Ozonator ............................................................4-9
Ozonator Flow Scheme .........................................................4-13
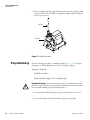
Capillary Location ...................................................................5-6
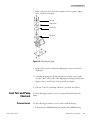
Rebuilding the Pump ..............................................................5-7
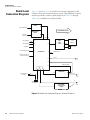
Board-Level Connection Diagram - Common Electronics .......6-6
Board-Level Connection Diagram - Measurement System ......6-7
Properly Grounded Antistatic Wrist Strap ...............................7-4
Component Layout .................................................................7-7
Removing the Measurement Bench and
Lowering the Partition Panel ...................................................7-8
Replacing the Pump ..............................................................7-10
Replacing a Fan .....................................................................7-12
Rear Panel Analog Input and Output Pins ............................7-13
Replacing the I/O Expansion Board (Optional) ....................7-18
Rear Panel Board Connectors ................................................7-19
Replacing the Measurement Interface Board .........................7-22
Replacing the Front Panel Board and the LCD Module ........7-23
Replacing the Optical Bench .................................................7-25
Replacing the Detectors .........................................................7-30
Ozonator Board Location ......................................................7-39
Hardware Components ...........................................................8-2
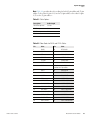
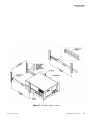
Rack Mount Option Assembly ................................................9-5
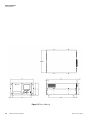
Bench Mounting .....................................................................9-6
EIA Rack Mounting ................................................................9-7
Retrofit Rack Mounting ..........................................................9-8
Thermo Fisher Scientific
Model 49i Instruction Manual
xv
Figures
Flag Status ............................................................................ B-11
xvi
Model 49i Instruction Manual
Thermo Fisher Scientific
Tables
Tables
Model 49i Specifications .......................................................................... 1-3
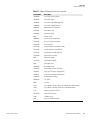
I/O Terminal Board Pin Descriptions ...................................................... 2-6
D/O Terminal Board Pin Descriptions .................................................... 2-7
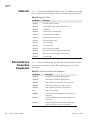
25-Pin Terminal Board Pin Descriptions ................................................. 2-8
Front Panel Pushbuttons .......................................................................... 3-3
Default Analog Outputs in Single Range Mode ....................................... 3-9
Default Analog Outputs in Dual Range Mode ....................................... 3-11
Default Analog Outputs in Auto Range Mode ....................................... 3-13
Operating Ranges ................................................................................... 3-15
Analog Output Zero to Full-Scale Table ................................................ 3-56
Signal Type Group Choices ................................................................... 3-58
Troubleshooting - General Guide ............................................................ 6-2
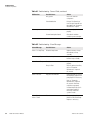
Troubleshooting - Alarm Messages ........................................................... 6-4
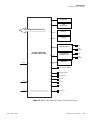
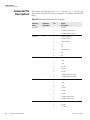
Motherboard Connector Pin Descriptions ............................................... 6-8
Front Panel Board Connector Pin Diagram ........................................... 6-13
I/O Expansion Board (Optional) Connector Pin Descriptions ............... 6-15
Digital Output Board Connector Pin Descriptions ................................ 6-16
Measurement Interface Board Connector Pin Descriptions .................... 6-17
Ozonator Power Supply Connector Pin Descriptions ............................. 6-19
Photometer Power Supply Connector Pin Descriptions ......................... 6-20
Model 49i Replacement Parts ................................................................... 7-4
Model 49i Cables ..................................................................................... 7-6
External Device Connection Components ............................................... 7-6
Analog Output Channels and Rear Panel Pin Connections .................... 7-14
Analog Input Channels and Rear Panel Pin Connections ....................... 7-14
RS-232 DB Connector Pin Configurations ............................................ 8-11
RS-485 DB Connector Pin Configuration ............................................. 8-11
Cable Options .......................................................................................... 9-3
Color Codes for 25-Pin and 37-Pin Cables .............................................. 9-3
Mounting Options ................................................................................... 9-4
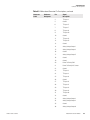
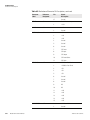
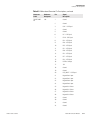
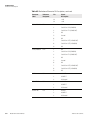
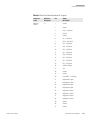
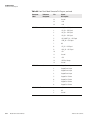
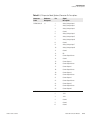
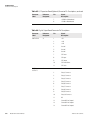
C-Link Protocol Commands ....................................................................B-3
Averaging Times ......................................................................................B-9
Alarm Trigger Values .............................................................................B-16
Record Output Formats .........................................................................B-20
Stream Time Values ...............................................................................B-24
Range Settings ........................................................................................B-29
Contrast Levels .......................................................................................B-33
Reply Termination Formats ...................................................................B-38
Analog Current Output Range Values ...................................................B-40
Analog Voltage Output Range Values ....................................................B-40
Default Output Assignment ...................................................................B-42
Read Coils for 49i ....................................................................................C-8
Thermo Fisher Scientific
Model 49i Instruction Manual
xvii
Tables
Read Registers for 49i ..............................................................................C-9
Write Coils for 49i .................................................................................C-10
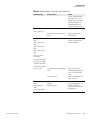
Operating Status for Model 49i and 49i Primary Standard ..................... D-7
Error Status for Model 49i and 49i Primary Standard ............................. D-8
xviii
Model 49i Instruction Manual
Thermo Fisher Scientific
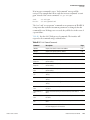
About This Manual
This manual provides information about operating, maintaining, and
servicing the analyzer. It also contains important alerts to ensure safe
operation and prevent equipment damage. The manual is organized into the
following chapters and appendices to provide direct access to specific
operation and service information:
Thermo Fisher Scientific
•
Chapter 1 “Introduction” provides an overview of product features,
describes the principles of operation, and lists the specifications.
•
Chapter 2 “Installation” describes how to unpack, setup, and startup the
analyzer.
•
Chapter 3 “Operation” describes the front panel display, the front panel
pushbuttons, and the menu-driven software.
•
Chapter 4 “Calibration” provides the procedures for calibrating the
analyzer and describes the required equipment.
•
Chapter 5 “Preventive Maintenance” provides maintenance procedures
to ensure reliable and consistent instrument operation.
•
Chapter 6 “Troubleshooting” presents guidelines for diagnosing analyzer
failures, isolating faults, and includes recommended actions for restoring
proper operation.
•
Chapter 7 “Servicing” presents safety alerts for technicians working on
the analyzer, step-by-step instructions for repairing and replacing
components, and a replacement parts list. It also includes contact
information for product support and technical information.
•
Chapter 8 “System Description” describes the function and location of
the system components, provides an overview of the software structure,
and includes a description of the system electronics and input/output
connections.
•
Chapter 9 “Optional Equipment” describes the optional equipment that
can be used with this analyzer.
•
Appendix A “Warranty” is a copy of the warranty statement.
Model 49i Instruction Manual
xix
Preface
•
Appendix B “C-Link Protocol Commands” provides a description of the
C-Link protocol commands that can be used to remotely control an
analyzer using a host device such as a PC or a datalogger.
•
Appendix C “MODBUS Protocol” provides a description of the
MODBUS Protocol Interface and is supported both over RS-232/485
(RTU protocol) as well as TCP/IP over Ethernet.
•
Appendix D “Geysitech (Bayern-Hessen) Protocol” provides a
description of the Geysitech (Bayern-Hessen) Protocol Interface and is
supported over RS-232/485 and TCP/IP over Ethernet.
Safety
Review the following safety information carefully before using the analyzer.
This manual provides specific information on how to operate the analyzer,
however if the analyzer is used in a manner not specified by the
manufacturer, the protection provided by the equipment may be impaired.
Safety and Equipment
Damage Alerts
This manual contains important information to alert you to potential safety
hazards and risks of equipment damage. Refer to the following types of
alerts you may see in this manual.
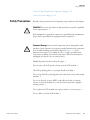
Safety and Equipment Damage Alert Descriptions
Alert
xx
Model 49i Instruction Manual
Description
DANGER
A hazard is present that will result in death or serious
personal injury if the warning is ignored. WARNING
A hazard is present or an unsafe practice can result in
serious personal injury if the warning is ignored. CAUTION
The hazard or unsafe practice could result in minor to
moderate personal injury if the warning is ignored. Equipment Damage
The hazard or unsafe practice could result in property
damage if the warning is ignored. Thermo Fisher Scientific
Preface
Safety and Equipment Damage Alerts in this Manual
Alert
Description
WARNING
If the equipment is operated in a manner not specified by
the manufacturer, the protection provided by the
equipment may be impaired. The service procedures in this manual are restricted to
qualified service personnel only. The Model 49i is supplied with a three-wire grounding
cord. Under no circumstances should this grounding
system be defeated. CAUTION
If the LCD panel breaks, do not to let the liquid crystal
contact your skin or clothes. If the liquid crystal contacts
your skin or clothes, wash it off immediately using soap
and water. Equipment Damage
Do not attempt to lift the analyzer by the cover or other
external fittings. Some internal components can be damaged by small
amounts of static electricity. A properly grounded
antistatic wrist strap must be worn while handling any
internal component. This adjustment should only be performed by an
instrument service technician. Handle all printed circuit boards by the edges only. Do not remove the panel or frame from the LCD module.
The LCD module polarizing plate is very fragile, handle it
carefully. Do not wipe the LCD module polarizing plate with a dry
cloth, it may easily scratch the plate. Do not use Ketonics solvent or aromatic solvent to clean
the LCD module, use a soft cloth moistened with a
naphtha cleaning solvent. Do not place the LCD module near organic solvents or
corrosive gases. Do not shake or jolt the LCD module. Thermo Fisher Scientific
Model 49i Instruction Manual
xxi
Preface
FCC Compliance
Changes or modifications to this unit not expressly approved by the party
responsible for compliance could void the user's authority to operate the
equipment.
Note This equipment has been tested and found to comply with the limits
for a Class A digital device, pursuant to Part 15 of the FCC Rules. These
limits are designed to provide reasonable protection against harmful
interference when the equipment is operated in a commercial environment.
This equipment generates, uses, and can radiate radio frequency energy and,
if not installed and used in accordance with the instruction manual, may
cause harmful interference to radio communications. Operation of this
equipment in a residential area is likely to cause harmful interference in
which case the user will be required to correct the interference at his own
expense. WEEE Symbol
The following symbol and description identify the WEEE marking used on
the instrument and in the associated documentation.
Symbol
Description
Marking of electrical and electronic equipment which applies to
electrical and electronic equipment falling under the Directive
2002/96/EC (WEEE) and the equipment that has been put on the market
after 13 August 2005.
Where to Get Help
Service is available from exclusive distributors worldwide. Contact one of
the phone numbers below for product support and technical information or
visit us on the web at www.thermo.com/aqi.
1-866-282-0430 Toll Free
1-508-520-0430 International
Thermo Fisher Scientific
Model 49i Instruction Manual
xxii
Chapter 1
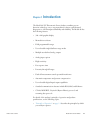
Introduction
The Model 49i UV Photometric Ozone Analyzer combines proven
detection technology, easy to use menu-driven software, and advanced
diagnostics to offer unsurpassed flexibility and reliability. The Model 49i has
the following features:
•
320 x 240 graphics display
•
Menu-driven software
•
Field programmable ranges
•
User-selectable single/dual/auto range modes
•
Multiple user-defined analog outputs
•
Analog input options
•
High sensitivity
•
Fast response time
•
Linearity through all ranges
•
Dual cell measurement cancels potential interference
•
Automatic temperature and pressure compensation
•
User-selectable digital input/output capabilities
•
Standard communications features include RS232/485 and Ethernet
•
C-Link, MODBUS, Geysitech (Bayern-Hessen) protocol, and
streaming data protocols
For details of the analyzer’s principle of operation and product
specifications, see the following topics:
•
Thermo Fisher Scientific
“Principle of Operation” on page 1-2 describes the principles by which
your analyzer operates.
Model 49i Instruction Manual
1-1
Introduction
Principle of Operation
•
“Specifications” on page 1-3 is a list of the analyzer’s performance
specifications.
Thermo Fisher Scientific is pleased to supply this UV photometric ozone
analyzer. We are committed to the manufacture of instruments exhibiting
high standards of quality, performance, and workmanship. Service personnel
are available for assistance with any questions or problems that may arise in
the use of this analyzer. For more information on servicing, see Chapter 7,
“Servicing”.
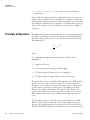
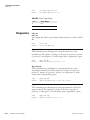
Principle of Operation
The Model 49i operates on the principle that ozone (O3) molecules absorb
UV light at a wavelength of 254 nm. The degree to which the UV light is
absorbed is directly related to the ozone concentration as described by the
Beer-Lambert Law:
−KLC
I
=e
Io
where:
K = molecular absorption coefficient, 308 cm-1 (at 0°C and 1
atmosphere)
L = length of cell, 38 cm
C = ozone concentration in parts per million (ppm)
I = UV light intensity of sample with ozone (sample gas)
Io = UV light intensity of sample without ozone (reference gas)
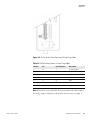
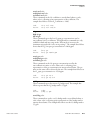
The sample is drawn into the Model 49i through the sample bulkhead and is
split into two gas streams, as shown in Figure 1-1. One gas stream flows
through an ozone scrubber to become the reference gas (Io). The reference
gas then flows to the reference solenoid valve. The sample gas (I) flows
directly to the sample solenoid valve. The solenoid valves alternate the
reference and sample gas streams between cells A and B every 10 seconds.
When cell A contains reference gas, cell B contains sample gas and vice
versa.
The UV light intensities of each cell are measured by detectors A and B.
When the solenoid valves switch the reference and sample gas streams to
opposite cells, the light intensities are ignored for several seconds to allow
the cells to be flushed. The Model 49i calculates the ozone concentration for
1-2
Model 49i Instruction Manual
Thermo Fisher Scientific
Introduction
Specifications
each cell and outputs the average concentration to the front panel display,
the analog outputs, and also makes the data available over the serial or
ethernet connection.
Figure 1-1. Model 49i Flow Schematic
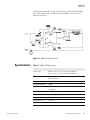
Specifications
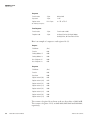
Table 1-1. Model 49i Specifications
Preset ranges
0-0.05, 0.1, 0.2, 0.5, 1, 2, 5, 10, 20, 50, 100, 200 ppm
0-0.1, 0.2, 0.5, 1, 2, 5, 10, 20, 50, 100, 200, 400 mg/m3
Custom ranges
0-0.05 to 200 ppm
0-0.1 to 400 mg/m3
Zero roise
0.25 ppb RMS (60 second averaging time)
Lower detectable limit
1.0 ppb
Zero drift
< 1 ppb/24 hour
< 2 ppb/7 day
Thermo Fisher Scientific
Span drift
less than 1% per month (including drift of transducers)
Response time
20 seconds (10 seconds lag time)
Linearity
± 1% of full-scale
Sample flow rate
1–3 LPM
Operating temperature
20–30 °C (may be safely operated over the range of 0–45 °C)*
Model 49i Instruction Manual
1-3
Introduction
Specifications
Power requirements
100 VAC @ 50/60 Hz
115 VAC @ 50/60 Hz
220-240 VAC @ 50/60 Hz
150 watts
Physical dimensions
16.75” (W) X 8.62” (H) X 23” (D)
Weight
Approximately 35 lbs.
Analog outputs
6 voltage outputs; 0–100 mV, 1, 5, 10 V (user selectable), 5% of
full-scale over/under range, 12 bit resolution, user selectable for
measurement input
Digital outputs
1 power fail relay Form C, 10 digital relays Form A, user selectable
alarm output, relay logic, 100 mA @ 200 VDC
Digital inputs
16 digital inputs, user select programmable, TTL level, pulled high
Serial Ports
1 RS-232 or RS-485 with two connectors, baud rate 1200–115200,
data bits, parity, and stop bits, protocols: C-Link, MODBUS, and
streaming data (all user selectable)
Ethernet connection
RJ45 connector for 10Mbs Ethernet connection, static or dynamic
TCP/IP addressing
* In non condensing environments. Performance specifications based on operation within 20–30 °C range.
1-4
Model 49i Instruction Manual
Thermo Fisher Scientific
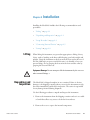
Chapter 2
Installation
Installing the Model 49i includes the following recommendations and
procedures:
Lifting
•
“Lifting” on page 2-1
•
“Unpacking and Inspection” on page 2-1
•
“Setup Procedure” on page 2-3
•
“Connecting External Devices” on page 2-5
•
“Startup” on page 2-9
When lifting the instrument, use procedure appropriate to lifting a heavy
object, such as, bending at the knees while keeping your back straight and
upright. Grasp the instrument at the bottom in the front and at the rear of
the unit. Although one person can lift the unit, it is desirable to have two
persons lifting, one by grasping the bottom in the front and the other by
grasping the bottom in the rear.
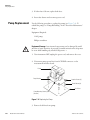
Equipment Damage Do not attempt to lift the instrument by the cover or
other external fittings. Unpacking and
Inspection
The Model 49i is shipped complete in one container. If there is obvious
damage to the shipping container when you receive the instrument, notify
the carrier immediately and hold for inspection. The carrier is responsible
for any damage incurred during shipment.
Use the following procedure to unpack and inspect the instrument.
1. Remove the instrument from the shipping container and set it on a table
or bench that allows easy access to both the front and rear.
2. Remove the cover to expose the internal components.
Thermo Fisher Scientific
Model 49i Instruction Manual
2-1
Installation
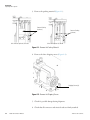
Unpacking and Inspection
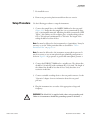
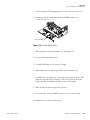
3. Remove the packing material (Figure 2-1).
Remove Packing
(2 pieces)
Units without Optional I/O Board
Remove Packing
(2 pieces)
Units with Optional I/O Board
Figure 2-1. Remove the Packing Material
4. Remove the three shipping screws (Figure 2-2).
Shipping Screws (3)
Figure 2-2. Remove the Shipping Screws
5. Check for possible damage during shipment.
6. Check that all connectors and circuit boards are firmly attached.
2-2
Model 49i Instruction Manual
Thermo Fisher Scientific
Installation
Setup Procedure
7. Re-install the cover.
8. Remove any protective plastic material from the case exterior.
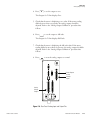
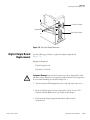
Setup Procedure
Use the following procedure to setup the instrument.
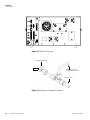
1. Connect the sample line to the SAMPLE bulkhead on the rear panel
(Figure 2-3). Ensure that the sample line is not contaminated by dirty,
wet, or incompatible materials. All tubing should be constructed of FEP
Teflon®, 316 stainless steel, borosilicate glass, or similar tubing with an
OD of 1/4-inch and a minimum ID of 1/8-inch. The length of the
tubing should be less than 10 feet.
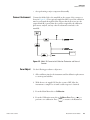
Note Gas must be delivered to the instrument free of particulates. It may be
necessary to use the Teflon particulate filter as described in “Teflon
Particulate Filter” on page 9-2. Note Gas must be delivered to the instrument at atmospheric pressure. It
may be necessary to use an atmospheric bypass plumbing arrangement as
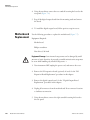
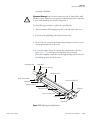
shown in Figure 2-4 if gas pressure is greater than atmospheric pressure. 2. Connect the EXHAUST bulkhead to a suitable vent. The exhaust line
should be 1/4-inch OD with a minimum ID of 1/8-inch. The length of
the exhaust line should be less than 10 feet. Verify that there is no
restriction in this line.
3. Connect a suitable recording device to the rear panel connector. See the
“Operation” chapter for more information about the rear panel
pin-outs.
4. Plug the instrument into an outlet of the appropriate voltage and
frequency.
WARNING The Model 49i is supplied with a three-wire grounding cord.
Under no circumstances should this grounding system be defeated. Thermo Fisher Scientific
Model 49i Instruction Manual
2-3
Installation
Setup Procedure
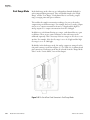
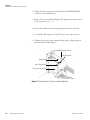
Figure 2-3. Model 49i Rear Panel
Instrument Bulkhead
SAMPLE
Vent to Exhaust Line
at Atmospheric Pressure
Input Gas Line
Figure 2-4. Atmospheric Dump Bypass Plumbing
2-4
Model 49i Instruction Manual
Thermo Fisher Scientific
Installation
Connecting External Devices
Connecting External
Devices
Several components are available for connecting external devices to iSeries
instruments.
These connection options include:
•
Individual terminal board PCB assemblies
•
Terminal block and cable kits (optional)
•
Individual cables (optional)
For detailed information on the optional connection components, refer to
the “Optional Equipment” chapter. For associated part numbers, refer to
“External Device Connection Components” in the “Servicing” chapter.
Terminal Board PCB
Assemblies
I/O Terminal Board
The following terminal board PCB assemblies are available for iSeries
instruments:
•
I/O terminal board PCB assembly, 37 pin (standard)
•
D/O terminal board PCB assembly, 37 pin (standard)
•
25-pin terminal board PCB assembly, (included with optional I/O
Expansion Board)
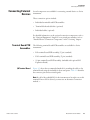
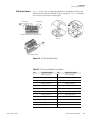
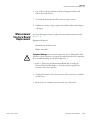
Figure 2-5 shows the recommended method for attaching the cable to the
terminal board using the included tie-down and spacer. Table 2-1 identifies
the connector pins and associated signals.
Note Not all of the available I/O for the instrument are brought out on this
terminal. If more I/O is desired, you must use an alternative connection
method. Thermo Fisher Scientific
Model 49i Instruction Manual
2-5
Installation
Connecting External Devices
See Detail “A”
See Detail “B”
Component Side Viewed from Top of Board
Detail “A”
Detail “B”
Assembled Connector
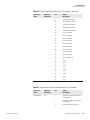
Figure 2-5. I/O Terminal Board Views
Table 2-1. I/O Terminal Board Pin Descriptions
2-6
Model 49i Instruction Manual
Pin
Signal Description
Pin
Signal Description
1
Analog1
13
Power_Fail_NC
2
Analog ground
14
Power_Fail_COM
3
Analog2
15
Power_Fail_NO
4
Analog ground
16
TTL_Input1
5
Analog3
17
TTL_Input2
6
Analog ground
18
TTL_Input3
7
Analog4
19
TTL_Input4
8
Analog ground
20
Digital ground
9
Analog5
21
TTL_Input5
10
Analog ground
22
TTL_Input6
11
Analog6
23
TTL_Input7
12
Analog ground
24
Digital ground
Thermo Fisher Scientific
Installation
Connecting External Devices
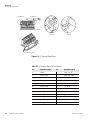
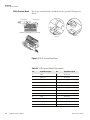
D/O Terminal Board
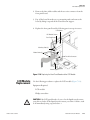
Figure 2-6 shows the recommended method for attaching the cable to the
terminal board using the included tie-down and spacer. Table 2-2 identifies
the connector pins and associated signals.
See Detail “A”
See Detail “B”
Component Side Viewed from Top of Board
Detail “B”
Detail “A”
Assembled Connector
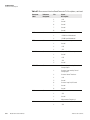
Figure 2-6. D/O Terminal Board Views
Table 2-2. D/O Terminal Board Pin Descriptions
Thermo Fisher Scientific
Pin
Signal Description
Pin
Signal Description
1
Relay1_ContactA
13
Relay7_ContactA
2
Relay1_ContactB
14
Relay7_ContactB
3
Relay2_ContactA
15
Relay8_ContactA
4
Relay2_ContactB
16
Relay8_ContactB
5
Relay3_ContactA
17
Relay9_ContactA
6
Relay3_ContactB
18
Relay9_ContactB
7
Relay4_ContactA
19
Relay10_ContactA
8
Relay4_ContactB
20
Relay10_ContactB
9
Relay5_ContactA
21
Solenoid_Drive_Output1
10
Relay5_ContactB
22
+24V
11
Relay6_ContactA
23
Solenoid_Drive_Output2
12
Relay6_ContactB
24
+24V
Model 49i Instruction Manual
2-7
Installation
Connecting External Devices
25-Pin Terminal Board
See Detail “A”
The 25-pin terminal board is included with the optional I/O Expansion
Board.
See Detail “B”
Component Side Viewed from Top of Board
Detail “B”
Detail “A”
Assembled Connector
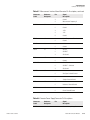
Figure 2-7. 25-Pin Terminal Board Views
Table 2-3. 25-Pin Terminal Board Pin Descriptions
2-8
Model 49i Instruction Manual
Pin
Signal Description
Pin
Signal Description
1
IOut1
13
Analog_In1
2
GND_ISO
14
Analog_In2
3
IOut2
15
Analog_In3
4
GND_ISO
16
GNDD
5
IOut3
17
Analog_In4
6
GND_ISO
18
Analog_In5
7
IOut4
19
Analog_In6
8
GND_ISO
20
GNDD
9
IOut5
21
Analog_In7
10
GND_ISO
22
Analog_In8
11
IOut6
23
GNDD
12
GND_ISO
24
GNDD
Thermo Fisher Scientific
Installation
Startup
Startup
Use the following procedure when starting the instrument.
1. Turn the power ON.
2. Allow 90 minutes for the instrument to stabilize.
3. Set instrument parameters such as operating ranges and averaging times
to appropriate settings. For more information about instrument
parameters, see the “Operation” chapter.
4. Before beginning actual instrument monitoring, perform a multipoint
calibration as described in the “Calibration” chapter.
Thermo Fisher Scientific
Model 49i Instruction Manual
2-9
Installation
Startup
2-10
Model 49i Instruction Manual
Thermo Fisher Scientific
Chapter 3
Operation
This chapter describes the front panel display, front panel pushbuttons, and
menu-driven software.
Thermo Fisher Scientific
•
“Display” on page 3-2 describes the LCD graphics display.
•
“Pushbuttons” on page 3-3 describes the various front panel
pushbuttons and the expected key actions for each.
•
“Software Overview” on page 3-4 describes the menu-driven software
and submenus.
•
“Range Menu” on page 3-8 describes the gas units, O3 ranges, and
custom ranges.
•
“Averaging Time” on page 3-17 describes the averaging period applied
to O3 measurements.
•
“Calibration Factors Menu” on page 3-18 describes the calibration
factors used to correct O3 measurement readings.
•
“Calibration Menu” on page 3-21 describes calibration of zero and span.
•
“Instrument Controls Menu” on page 3-27 describes the instrument
hardware control and configuration.
•
“Diagnostics Menu” on page 3-64 describes the diagnostic information
and functions.
•
“Alarms Menu” on page 3-72 describes a list of items that are monitored
by the analyzer.
•
“Service Menu” on page 3-83 describes service related menu items.
•
“Password Menu” on page 3-97 describes how to enter/change a
password, lock and unlock the instrument.
Model 49i Instruction Manual
3-1
Operation
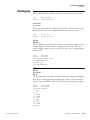
Display
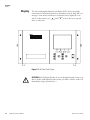
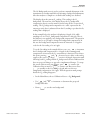
Display
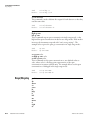
The 320 x 240 graphics liquid-crystal display (LCD) shows the sample
concentrations, instrument parameters, instrument controls, help, and error
messages. Some menus contain more items than can be displayed at one
time. For these menus, use
and
to move the cursor up and
down to each item.
Figure 3-1. 49i Front Panel Display
CAUTION If the LCD panel breaks, do not let the liquid crystal contact your
skin or clothes. If the liquid crystal contacts your skin or clothes, wash it off
immediately using soap and water. 3-2
Model 49i Instruction Manual
Thermo Fisher Scientific
Operation
Pushbuttons
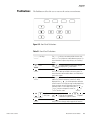
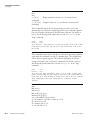
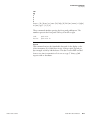
Pushbuttons
The Pushbuttons allow the user to traverse the various screens/menus.
Figure 3-2. Front Panel Pushbuttons
Table 3-1. Front Panel Pushbuttons
= Soft Keys
The
soft keys are used to provide shortcuts that
allow the user to jump to user-selectable menu screens. For
more information on processing soft keys, see “Soft Keys”
below.
= Run
The
is used to display the Run screen. The Run
screen normally displays the O3 concentration.
= Menu
The
is used to display the Main Menu when in the
Run screen, or back up one level in the menu system. For
more information about the Main Menu, see “Main Menu”
later in this chapter.
= Help
The
is context-sensitive, that is, it provides
additional information about the screen that is being
displayed. Press
for a brief explanation about the
current screen or menu. Help messages are displayed using
lower case letters to easily distinguish them from the
operating screens. To exit a help screen, press
or
to return to the previous screen, or
to
return to the Run screen.
= Up, Down
= Left, Right
= Enter
Thermo Fisher Scientific
The four arrow pushbuttons (
,
,
,
and
) move the cursor up, down, left, and right or
change values and states in specific screens.
The
is used to select a menu item,
accept/set/save a change, and/or toggle on/off functions.
Model 49i Instruction Manual
3-3
Operation
Software Overview
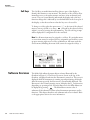
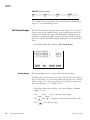
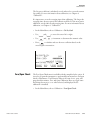
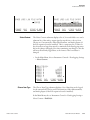
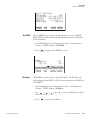
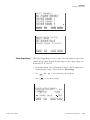
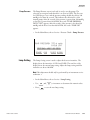
Soft Keys
The Soft Keys are multi-functional keys that use part of the display to
identify their function at any moment. The function of the soft keys allow
immediate access to the menu structure and most often used menus and
screens. They are located directly underneath the display and as the keys'
functions change this is indicated by user-defined labels in the lower part of
the display, so that the user knows what the keys are to be used for.
To change a soft key, place the menu cursor “>” on the item of the selected
menu or screen you wish to set. Press
followed by the selected soft key
within 1 second of pressing the right-arrow key. The edit soft key prompt
will be displayed for configuration for the new label.
Note Not all menu items may be assigned to soft keys. If a particular menu
or screen item cannot be assigned, the key assignment screen will not come
up upon entering right-arrow-soft key combinations. All items under the
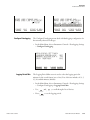
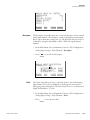
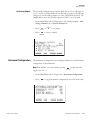
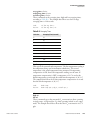
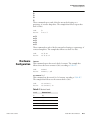
Service menu (including the menu itself ) cannot be assigned soft keys. EDIT SOFT KEY PROMPT:
CURRENTLY: RANGE
RANGE
ABCDEFGHIJKLMN BKSP
OPQRSTUVWXYZ
PAGE
0123456789 ./- SAVE
RANGE
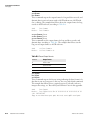
Software Overview
3-4
Model 49i Instruction Manual
AVG
DIAGS ALARM
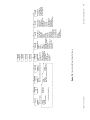
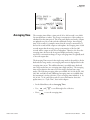
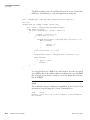
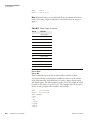
The Model 49i utilizes the menu-driven software illustrated by the
flowchart in Figure 3-3. The Power-Up screen, shown at the top of the
flowchart, is displayed each time the instrument is turned on. This screen is
displayed while the instrument is warming up and performing self-checks.
After the warm-up period, the Run screen is automatically displayed. The
Run screen is the normal operating screen. It displays the O3 concentration,
depending on operating mode. From the Run screen, the Main Menu can
be displayed by pressing
. The Main Menu contains a list of
submenus. Each submenu contains related instrument parameters and/or
functions. This chapter describes each submenu and screen in detail. Refer
to the appropriate sections for more information.
Thermo Fisher Scientific
*K#XI6KOG
.Q#XI6KOG
)CU7PKVU
*K4CPIG
.Q4CPIG
5GV%WUVQO4CPIGU
Thermo Fisher Scientific
(QT&WCNQT#WVQ4CPIG1PN[
#XI6KOG
#XGTCIKPI
6KOG
)CU7PKVU
4CPIG
5GV%WUVQO4CPIGU
4CPIG
%CNKDTCVKQP
%WUVQO.GXGNU
2WOR
1\QPCVQT5QNGPQKF
%[ENG6KOG
6GOR%QORGPUCVKQP
2TGU%QORGPUCVKQP
&CVCNQIIKPI5GVVKPIU
%QOO5GVVKPIU
+1%QPHKI
5ETGGP%QPVTCUV
5GTXKEG/QFG
&CVG6KOG
+PUVTWOGPV
%QPVTQNU
Figure 3-3. Flowchart of Menu-Driven Software
1$MI
%CN<GTQ
1*K%QGH
%CN1*K%QGH
1.Q%QGH
4GUGV7UGT%CN&GHCWNVU %CN1.Q%QGH
1$MI
%CN<GTQ
1%QGH
%CN1%QGH
4GUGV7UGT%CN&GHCWNVU <GTQ5RCP%JGEM
%CNKDTCVKQP
(CEVQTU
/CKP/GPW
4WP5ETGGP
5GNH6GUV
5ETGGP
2QYGTÄWR
5ETGGP
2TQITCO8GTUKQP
8QNVCIGU
6GORU
2TGUUWTG
(NQYU
%GNN#$1
+PVGPUKVKGU
#PCNQI+PRWV4GCFKPIU
#PCNQI+PRWV8QNVCIGU
&KIKVCN+PRWVU
4GNC[5VCVGU
6GUV#PCNQI1WVRWVU
+PUVTWOGPV%QPHKI
%QPVCEV+PHQ
&KCIPQUVKEU
#NCTOU&GVGEVGF
1.COR6GOR
.COR6GOR
$GPEJ6GOR
2TGUUWTG
(NQY#
(NQY$
+PVGPUKV[#
+PVGPUKV[$
<GTQ%JGEM
5RCP%JGEM
<GTQ#WVQECN
5RCP#WVQECN
1<.GXGN%JGEM
1<.GXGN%JGEM
1<.GXGN%JGEM
1<.GXGN%JGEM
1%QPE
/$5VCVWU
+PV$F5VCVWU
+1'ZR$F5VCVWU
#NCTOU
5GV2CUUYQTF
.QEM+PUVTWOGPV
%JCPIG2CUUYQTF
4GOQXG2CUUYQTF
7PNQEM+PUVTWOGPV
2CUUYQTF
Model 49i Instruction Manual
2TGUUWTG%JGEM
.COR5GVVKPI
&GVGEVQT%CN
+PVGPUKV[%JGEM
4CPIG/QFG5GNGEV
2TGUUWTG%CN
(NQY#%CN
(NQY$%CN
6GOR%CN
#PCNQI1WVRWV%CN
#PCNQI+PRWV%CN
&KNWVKQP4CVKQ
&KURNC[2KZGN6GUV
4GUVQTG7UGT&GHCWNVU
5GTXKEG
3-5
Operation
Software Overview
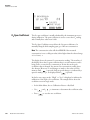
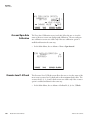
Power-Up Screen
The Power-Up screen is displayed on power up of the Model 49i. The
Self-Test is displayed while the internal components are warming up and
diagnostic checks are performed.
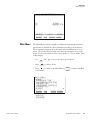
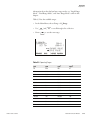
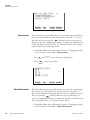
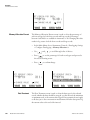
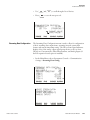
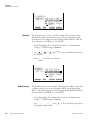
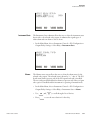
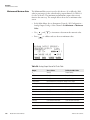
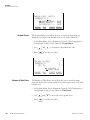
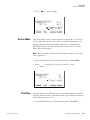
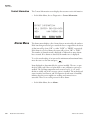
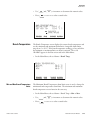
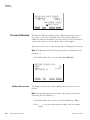
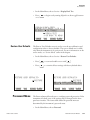
Run Screen
The Run screen displays the O3 concentration. The status bar displays
optional sample/cal solenoid valve or internal ozonator, if installed, time,
and alarm status. The word “SAMPLE” on the bottom left of the display
indicates the analyzer has the sample/cal valve option and is in sample
mode. Other modes appear in the same area of the display as “ZERO”,
“LEVEL 1”, “LEVEL 2”, LEVEL 3”, “LEVEL 4” or “LEVEL 5.” Press
to scroll through sample, zero, or custom levels. For more
information about the optional solenoid valve or internal ozonator, see
Chapter 9, “Optional Equipment”.
When operating in dual or auto range mode two sets of coefficients are used
to calculate the O3 “LOW” and “HIGH” concentrations. Also, two
averaging times are used—one for each range. The title bar indicates which
range concentrations are displayed. The words “LOW RANGE
CONCENTRATION” on the top of the display indicates that the low
concentration is displayed. In dual range mode, pressing
and
will toggle between high and low concentrations. The example below shows
the Run screen in single range mode.
3-6
Model 49i Instruction Manual
Thermo Fisher Scientific
Operation
Software Overview
X
CONCENTRATION
NO
28.7
PPB
600
PPB
O3
SAMPLE
RANGE
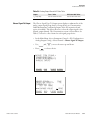
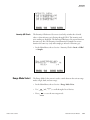
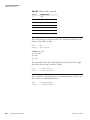
Main Menu
12:34
AVG
W
ALARMx
DIAGS ALARM
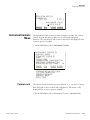
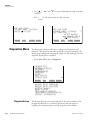
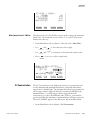
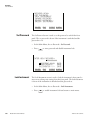
The Main Menu contains a number of submenus. Instrument parameters
and features are divided into these submenus according to their function.
The concentration appears above the main menu and submenus in every
screen. The Service menu is visible only when the instrument is in service
mode. For more information on the service mode, see “Service Mode” later
in this chapter.
•
Use
and
to move the cursor up and down.
•
Press
to select a choice.
•
Press
screen.
to return to the Main Menu or
MAIN MENU:
>RANGE
AVERAGING TIME
CALIBRATION FACTORS
CALIBRATION
INSTRUMENT CONTROLS
DIAGNOSTICS
ALARMS
RANGE
AVG
to return to the Run
ª
DIAGS ALARM
SERVICE
PASSWORD
Thermo Fisher Scientific
Model 49i Instruction Manual
3-7
Operation
Range Menu
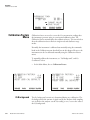
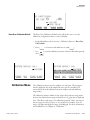
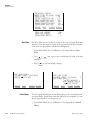
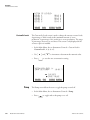
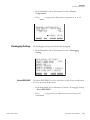
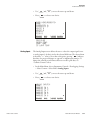
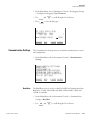
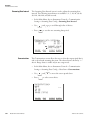
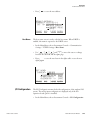
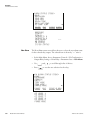
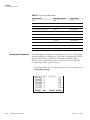
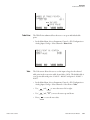
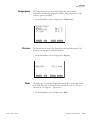
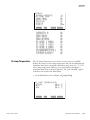
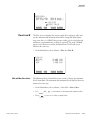
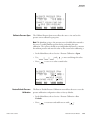
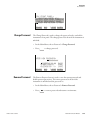
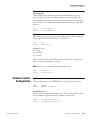
Range Menu
The Range menu allows the operator to select the gas units, O3 ranges, and
to set the custom ranges. The screens below show the range menu in single
range mode and dual/auto range modes. For more information about the
single, dual and auto range modes, see “Single Range Mode”, “Dual Range
Mode”, and “Auto Range Mode” below.
•
RANGE:
>GAS UNITS
RANGE
SET CUSTOM RANGES
RANGE
AVG
In the Main Menu, choose Range.
PPB
500
DIAGS ALARM
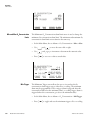
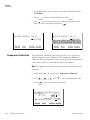
Single Range Mode
RANGE:
>GAS UNITS
HI RANGE
LO RANGE
SET CUSTOM RANGES
RANGE
AVG
PPB
1000
500
DIAGS ALARM
In the single range mode, there is one range, one averaging time, and one
span coefficient.
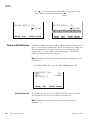
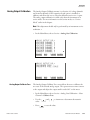
By default, the analog outputs are arranged on the rear panel connector as
shown in Figure 3-4. See Table 3-2 for channels and pin connections. Single
range mode may be selected from the “Range Mode Select” in the “Service
Menu”, later in this chapter.
3-8
Model 49i Instruction Manual
Thermo Fisher Scientific
Operation
Range Menu
Figure 3-4. Pin-Out of Rear Panel Connector in Single Range Mode
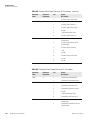
Table 3-2. Default Analog Outputs in Single Range Mode
Channel
Pin
I/O Terminal Pin
Description
1
14
1
O3 Analog Output
2
33
3
O3 Analog Output
3
15
5
None
4
34
7
None
5
17
9
None
6
36
11
None
Ground
16, 18, 19, 35, 37
2, 4, 6, 8, 10, 12
Signal Ground
Note All channels are user definable. If any customization has been made to
the analog output configuration, the default selections may not apply. Thermo Fisher Scientific
Model 49i Instruction Manual
3-9
Operation
Range Menu
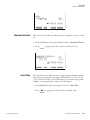
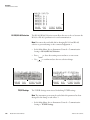
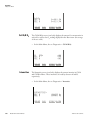
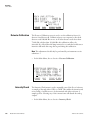
Dual Range Mode
In the dual range mode, there are two independent channels defined for
each compound being measured. These are labeled simply as the “High
Range” and the “Low Range”. Each channel has its own analog output
range, averaging time and span coefficient.
This enables the sample concentration reading to be sent to the analog
outputs using two different ranges. For example, the low O3 analog output
can be set to output concentrations from 0 to 50 ppb and the high O3
analog output set to output concentrations from 0 to 200 ppb.
In addition to each channel having two ranges, each channel has two span
coefficients. There are two span coefficients so that each range can be
calibrated separately. This is necessary if the two ranges are not close to one
another. For example, if the low O3 range is set to 0–50 ppb and the high
O3 range is set to 0–1,000 ppb.
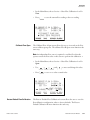
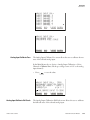
By default, in the dual range mode, the analog outputs are arranged on the
rear panel connector as shown in Figure 3-5. See Table 3-3 for channels and
pin connections. Dual range mode may be selected from the “Range Mode
Select” in the “Service Menu”, later in this chapter.
Figure 3-5. Pin-Out of Rear Panel Connector in Dual Range Mode
3-10
Model 49i Instruction Manual
Thermo Fisher Scientific
Operation
Range Menu
Table 3-3. Default Analog Outputs in Dual Range Mode
Channel
Pin
I/O Terminal Pin
Description
1
14
1
O3 Low Range
2
33
3
O3 High Range
3
15
5
None
4
34
7
None
5
17
9
None
6
36
11
None
Ground
16, 18, 19, 35, 37
2, 4, 6, 8, 10, 12
Signal Ground
Note All channels are user definable. If any customization has been made to
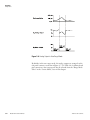
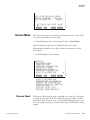
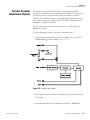
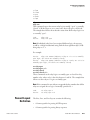
the analog output configuration, the default selections may not apply. Auto Range Mode
The auto range mode switches the O3 analog outputs between high and low
ranges, depending on the concentration level. The high and low ranges are
defined in the Range menu.
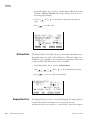
For example, suppose the low range is set to 500 ppb and the high range is
set to 1000 ppb (Figure 3-6). Sample concentrations below 500 ppb are
presented to the low ranges analog output and sample concentrations above
500 ppb are presented to the high ranges analog outputs. When the low
range is active, the status output is at 0 volts. When the high range is active,
the status output is at half of full-scale.
When the high range is active, the concentration must drop to 85% of the
low O3 range for the low range to become active.
In addition, each O3 analog output has a span coefficient. There are two
span coefficients so that each range can be calibrated separately. This is
necessary if the two ranges are not close to one another. For example, if the
low O3 range is set to 0–50 ppb and the high O3 range is set to 0–20,000
ppb.
Thermo Fisher Scientific
Model 49i Instruction Manual
3-11
Operation
Range Menu
Figure 3-6. Analog Output in Auto Range Mode
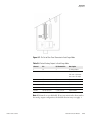
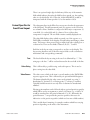
By default, in the auto range mode, the analog outputs are arranged on the
rear panel connector as shown in Figure 3-7. See Table 3-4 for channels and
pin connections. Auto range mode may be selected from the “Range Mode
Select” in the “Service Menu”, later in this chapter.
3-12
Model 49i Instruction Manual
Thermo Fisher Scientific
Operation
Range Menu
Figure 3-7. Pin-Out of Rear Panel Connector in Auto Range Mode
Table 3-4. Default Analog Outputs in Auto Range Mode
Channel
Pin
I/O Terminal Pin
Description
1
14
1
O3 Analog Output
2
33
3
Range Status:
half scale = high range
zero scale = low range
3
15
5
None
4
34
7
None
5
17
9
None
6
36
11
None
Ground
16, 18, 19, 35, 37
2, 4, 6, 8, 10, 12
Signal Ground
Note All channels are user definable. If any customization has been made to
the analog output configuration, the default selections may not apply. Thermo Fisher Scientific
Model 49i Instruction Manual
3-13
Operation
Range Menu
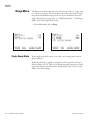
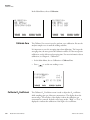
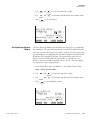
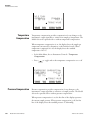
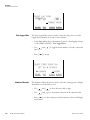
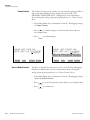
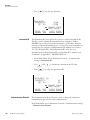
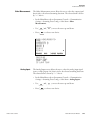
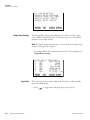
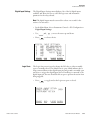
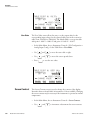
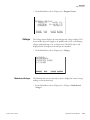
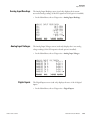
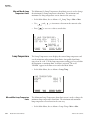
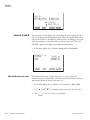
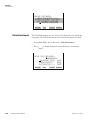
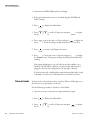
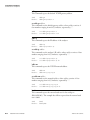
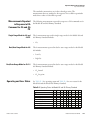
Gas Units
The Gas Units screen defines how the O3 concentration reading is
expressed. Gas units of parts per billion (ppb), parts per million (ppm),
micrograms per cubic meter (μg/m3), or milligrams per cubic meter
(mg/m3) are available. The μg/m3 and mg/m3 gas concentration modes are
calculated using a standard pressure of 760 mmHg and a standard
temperature of 20 °C.
When switching the selected units from ppb or ppm to μg/m3 or mg/m3,
the analog ranges all default to the highest range in that mode. For example,
when switching from mg/m3 to ppm, all the ranges default to 200 ppm.
Therefore, whenever you change units, you should also check the range
settings.
•
In the Main Menu, choose Range > Gas Units.
•
Use
•
Press
and
to scroll through a list of choices.
to save the new units.
Note If the units change from ppb/ppm to μg/m3/mg/m3 or vice-versa, the
instrument should be re-calibrated, particularly if the user’s standard
temperature is different from 20 °C. A display warning will appear that
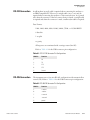
ranges will be defaulted and calibration parameters reset. GAS UNITS:
CURRENTLY:
PPB
SET TO:
UG/M3 ?
AND SET RANGES AND CAL TOX
DEFAULT SETTINGSXXXXXXXXXX
©ª CHANGE VALUE
SAVE
RANGE
O3 Range
AVG
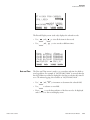
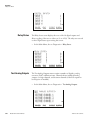
DIAGS ALARM
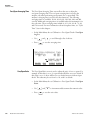
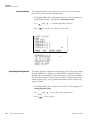
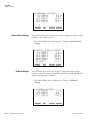
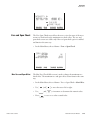
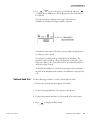
The O3 Range screen defines the concentration range of the analog outputs.
For example, an O3 range of 0–500 ppb restricts the analog output to
concentrations between 0 and 500 ppb.
The display shows the current O3 range. The next line of the display is used
to change the range. The range screen is similar for the single, dual, and auto
range modes. The only difference between the screens are the words “High”
or “Low” displayed to indicate which range is displayed. For more
3-14
Model 49i Instruction Manual
Thermo Fisher Scientific
Operation
Range Menu
information about the dual and auto range modes, see “Single Range
Mode”, “Dual Range Mode”, and “Auto Range Mode” earlier in this
chapter.
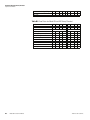
Table 3-5 lists the available ranges.
•
In the Main Menu, choose Range > O3 Range.
•
Use
•
Press
and
to scroll through a list of choices.
to save the new range.
O3 RANGE:
CURRENTLY:
SET TO:
500.0
1000.0 ?
©ª CHANGE VALUE
SAVE VALUE
RANGE
AVG
DIAGS ALARM
Table 3-5. Operating Ranges
Thermo Fisher Scientific
ppb
ppm
μg/m3
mg/m3
50
0.05
100
0.1
100
0.10
200
0.2
200
0.20
500
0.5
500
0.50
1,000
1
1,000
1
2,000
2
2,000
2
5,000
5
5,000
5
10,000
10
10,000
10
20,000
20
20,000
20
50,000
50
50,000
50
100,000
100
100,000
100
200,000
200
200,000
200
400,000
400
C1
C1
C1
C1
C2
C2
C2
C2
Model 49i Instruction Manual
3-15
Operation
Range Menu
Table 3-5. Operating Ranges
ppb
ppm
μg/m3
mg/m3
C3
C3
C3
C3
C1, C2, and C3 are custom ranges. For more information about custom
ranges, see “Set Custom Ranges” below.
Set Custom Ranges
The Set Custom Ranges menu lists three custom ranges: C1, C2, and C3.
Custom ranges are user-defined ranges. In the standard range mode, any
value between 50 ppb (0.05 ppm) and 200,000 ppb (200 ppm) can be
specified as a range. In the μg/m3(mg/m3) mode, any value between 100
μg/m3 (0.1 mg/m3) and 400,000 μg/m3 (400 mg/m3) can be specified as a
range.
•
In the Main Menu, choose Range > Set Custom Ranges.
CUSTOM RANGES:
>CUSTOM RANGE 1
CUSTOM RANGE 2
CUSTOM RANGE 3
RANGE
Custom Ranges
AVG
550.0
650.0
750.0
DIAGS ALARM
The Custom Ranges screen is used to define the custom ranges.
The display shows the current custom range. The next line of the display is
used to set the range. To use the custom full-scale range, be sure to select it
(Custom range 1, 2, or 3) in the O3 Range screen. For more information
about selecting ranges, see “O3 Range” above.
3-16
Model 49i Instruction Manual
•
In the Main Menu, choose Range > Set Custom Ranges > Custom
range 1, 2, or 3.
•
Use
and
to move the cursor left or right.
•
Use
and
to increment or decrement the numeric value.
•
Press
to save the new range.
Thermo Fisher Scientific
Operation
Averaging Time
CUSTOM RANGE 1:
CURRENTLY:
550.0
SET TO:
000550.1 ?
§¨ MOVE CURSOR
©ª CHANGE VALUE
SAVE
RANGE
Averaging Time
AVG
DIAGS ALARM
The averaging time defines a time period (10 to 300 seconds) over which
O3 measurements are taken. The average concentration of the readings are
calculated for that time period. The front panel display and analog outputs
are updated every 10 seconds with the calculated averages. An averaging
time of 10 seconds, for example, means that the average concentration of
the last 10 seconds will be output at each update. An averaging time of 300
seconds means that the moving average concentration of the last 300
seconds will be output at each 10-second update. Therefore, the lower the
averaging time, the faster the front panel display and analog outputs
respond to concentration changes. Longer averaging times are typically used
to smooth output data.
The Averaging Time screen for the single range mode is shown below. In the
dual and auto range modes, an averaging time menu is displayed before the
averaging time screen. This additional menu is needed because dual and
auto range modes have two averaging times (high and low). The averaging
time screens function the same way in the single, dual and auto range
modes. The following averaging times are available: 10, 20, 30, 60, 90, 120,
180, 240, and 300 seconds. Additional averaging times are available when
the instrument is in fast cycle time. These averaging times include 4, 8, 12,
24, 36, 48, 72, 96, and 120 seconds. For more information about fast
update times, see “Cycle Time”, later in this chapter.
Thermo Fisher Scientific
•
In the Main Menu, choose Averaging Time.
•
Use
•
Press
and
to scroll through a list of choices.
to save the averaging time.
Model 49i Instruction Manual
3-17
Operation
Calibration Factors Menu
AVERAGING TIME:
CURRENTLY:
SET TO:
30 SEC
10 SEC ?
©ª CHANGE VALUE
SAVE VALUE
RANGE
Calibration Factors
Menu
AVG
DIAGS ALARM
Calibration factors are used to correct the O3 concentration readings that
the instrument generates using its own internal calibration data. The
Calibration Factors menu displays the calibration factors. The screens below
show the calibration factors menu in single mode and dual/auto range
modes.
Normally, the instrument is calibrated automatically using the commands
listed in the Calibration menu described later in this chapter. However, the
instrument can also be calibrated manually using the Calibration Factors
menu.
To manually calibrate the instrument, see “O3 Background”, and O3
Coefficients” below.
•
In the Main Menu, choose Calibration Factors
CALIBRATION FACTORS:
>O3 BKG
0.0
O3 COEF
1.000
RESET USER CAL DEFAULTS
RANGE
AVG
DIAGS ALARM
O3 Background
3-18
Model 49i Instruction Manual
CALIBRATION FACTORS:
>O3 BKG
0.0
O3 HI COEF
1.000
O3 LO COEF
1.000
RESET USER CAL DEFAULTS
RANGE
AVG
DIAGS ALARM
The O3 background correction is determined during zero calibration. The
O3 background is the amount of signal read by the analyzer while sampling
zero air. Before the analyzer sets the O3 reading to zero, it stores the value as
the O3 background.
Thermo Fisher Scientific
Operation
Calibration Factors Menu
The O3 Background screen is used to perform a manual adjustment of the
instruments zero background. Before performing a background adjustment,
allow the analyzer to sample zero air until stable readings are obtained.
The display shows the current O3 reading. This reading is the O3
background. The next line of the display shows the O3 background
compensation that is stored in memory and is being used to correct the O3
reading. The O3 background compensation is a value, expressed in the
current gas units, that is subtracted from the O3 reading to produce the O3
reading that is displayed.
In the example below, the analyzer is displaying 4.4 ppb of O3 while
sampling zero air. The O3 background compensation is 0.0 ppb. That is,
the analyzer is not applying a zero background compensation. The question
mark is used to as a prompt to change the background compensation. In
this case the background compensation must be increased to 4.4 ppb in
order for the O3 reading to be at 0 ppb.
To set the O3 reading in the example below to zero, use
to increment
the O3 background compensation to 4.4 ppb. As the O3 background
compensation is increased, the O3 concentration is decreased. Note that at
this point, pressing
and
however, has no affect on the analog
output or the stored O3 background correction of 0.0 ppb. A question mark
following both O3 reading and the O3 background correction indicates that
these are proposed changes as opposed to implemented changes. To escape
this screen without saving any changes, press
to return to the
Calibration Factors menu or
to return to the Run screen. Press
to actually set the O3 reading to 0 ppb and store the new
background compensation of 4.4 ppb. Then the question mark prompt
beside the O3 reading disappears.
Thermo Fisher Scientific
•
In the Main Menu, choose Calibration Factors > O3 Background.
•
Use
and
background value.
•
Press
to increment or decrement the proposed
to save the new background.
Model 49i Instruction Manual
3-19
Operation
Calibration Factors Menu
O3 BACKGROUND:
O3:
SET BKG TO:
4.4
0.0
©ª INC/DEC
SAVE VALUE
RANGE
O3 Span Coefficient
AVG
DIAGS ALARM
The O3 span coefficient is usually calculated by the instrument processor
during calibration. The span coefficient is used to correct the O3 reading
and normally have values near 1.000.
The O3 Span Coefficient screen allows the O3 span coefficient to be
manually changed while sampling span gas of known concentration.
Note The concentration value will show ERROR if the measured
concentration is not a valid span value (either higher than the selected range,
or 0 or lower). The display shows the current O3 concentration reading. The next line of
the display shows the O3 span coefficient that is stored in memory and is
being used to correct the O3 concentration. Notice that as the span
coefficient value is changed, the current O3 concentration reading above
also changes. However, no real changes are made to the value stored in
memory until
is pressed. Only proposed changes, as indicated by a
question mark prompt, are displayed until
is pressed.
In dual or auto range modes, “High” or “Low” is displayed to indicate the
calibration of the high or low coefficient. The example below shows the
coefficient screen in single mode.
3-20
Model 49i Instruction Manual
•
In the Main Menu, choose Calibration Factors > O3 Coef.
•
Use
•
Press
and
to increment or decrement the coefficient value.
to save the new coefficient.
Thermo Fisher Scientific
Operation
Calibration Menu
O3 COEFFICIENT:
O3:
SET COEF TO:
600
1.000
©ª INC/DEC
SAVE VALUE
RANGE
Reset User Calibration Default
•
In the Main Menu, choose Service > Calibration Factors > Reset User
Cal Defaults.
•
Press
•
Use
after
RESTORE
AVG
DIAGS ALARM
Calibration Menu
DIAGS ALARM
The Reset User Calibration Default screen allows the user to reset the
calibration configuration values to factory defaults.
RESTORE DEFAULT CAL:
RANGE
AVG
to warn user and enable restore with
.
to reset the calibration pressure reference value when pressed
.
RESTORE DEFAULT CAL:
RESTORE
ARE YOU SURE YOU WANT TO?x
PRESS ¨ TO CONFIRM RESTORE
RANGE
AVG
DIAGS ALARM
The Calibration menu is used to calibrate zero and span. The zero/span
check is displayed only if the sample/cal valve option is installed. The
screens below show the calibration menu in single mode and dual/auto
range modes.
The calibration menu is similar for the single, dual, and auto range mode,
however, the dual and auto range modes have two O3 span factors (high and
low). This allows each range to be calibrated separately. This is necessary if
the two ranges used are not close to one another. For example, a low O3
range of 50 ppb and a high O3 range of 20,000 ppb. For more information
about calibration, see Chapter 4, “Calibration”.
Thermo Fisher Scientific
Model 49i Instruction Manual
3-21
Operation
Calibration Menu
In the Main Menu, choose Calibration.
CALIBRATION:
>CAL ZERO
CAL O3 COEF
ZERO/SPAN CHECK
RANGE
AVG
CALIBRATION:
>CAL ZERO
CAL O3 HI COEF
CAL O3 LO COEF
DIAGS ALARM
Calibrate Zero
RANGE
AVG
DIAGS ALARM
The Calibrate Zero screen is used to perform a zero calibration. Be sure the
analyzer samples zero air until the readings stabilize.
It is important to note the averaging time when calibrating. The longer the
averaging time, the more precise the calibration will be. For the most precise
calibration, use the 300-second averaging time. For more information about
calibration, see Chapter 4, “Calibration”.
•
In the Main Menu, choose Calibration > Calibrate Zero.
•
Press
to set the new reading to zero.
O3 BACKGROUND:
O3:
CURRENTLY:
4.4
0.0 ?
SET O3 TO ZERO
RANGE
Calibrate O3 Coefficient
3-22
Model 49i Instruction Manual
AVG
DIAGS ALARM
The Calibrate O3 Coefficient screen is used to adjust the O3 coefficient
while sampling span gas of known concentrations. The display shows the
current range. The next line of the display is where the calibration gas
concentration is entered. In dual or auto range modes, “High” or “Low” is
displayed to indicate the calibration of the high or low coefficient.
Thermo Fisher Scientific
Operation
Calibration Menu
The O3 span coefficient is calculated, stored, and used to correct the current
O3 reading. For more information about calibration, see Chapter 4,
“Calibration”.
It is important to note the averaging time when calibrating. The longer the
averaging time, the more precise the calibration will be. For the most precise
calibration, use the 300-second averaging time. For more information about
calibration, see Chapter 4, “Calibration”.
•
In the Main Menu, choose Calibration > Cal O3 Coef.
•
Use
and
to move the cursor left or right.
•
Use
and
to increment or decrement the numeric value.
•
Press
to calculate and save the new coefficient based on the
entered span concentration.
CALIBRATE O3:
O3:
SPAN CONC:
803
00000804 ?
§¨ MOVE CURSOR
©ª CHANGE VALUE
SAVE
RANGE
Zero/Span Check
DIAGS ALARM
The Zero/Span Check menu is available with the sample/cal valve option. It
is used to program the instrument to perform fully automated zero and span
check or adjustments. Total Duration Hour is the sum of zero, span, and
purge duration minutes. Zero and Span Calibration Reset are toggle items
that change between yes or no when selected, and displayed if auto
calibration is installed.
•
Thermo Fisher Scientific
AVG
In the Main Menu, choose Calibration > Zero/Span Check.
Model 49i Instruction Manual
3-23
Operation
Calibration Menu
ZERO/SPAN CHECK:
>NEXT TIME 01Jan05 12:00
PERIOD HR
24
TOTAL DURATION HR
1.5
ZERO DURATION MIN
30
SPAN DURATION MIN
30
PURGE DURATION MIN
30
ZERO/SPAN AVG SEC
60 ª
RANGE
AVG
DIAGS ALARM
ZERO CAL RESET
SPAN CAL RESET
ZERO/SPAN RATIO
Next Time
The Next Time screen is used to view and set the next zero/span check date
and time. Once the initial zero/span check is performed, the date and time
of the next zero/span check is calculated and displayed.
•
In the Main Menu, choose Calibration > Zero/Span Check > Next
Time.
•
Use
,
and time.
•
Press
DATE AND TIME:
19 MAR 2005 12:34:56
PRESS TO EDIT
RANGE
AVG
DIAGS ALARM
Period Hours
Model 49i Instruction Manual
and
to move and change the value of the date
to edit and accept a change.
DATE AND TIME:
19 MAR 2005 12:34:56
?
SETTING: DAYS
¨ SET MONTHS
©ª CHANGE VALUE
SAVE VALUE
RANGE
AVG
DIAGS ALARM
The Zero/Span Period Hours screen defines the period or interval between
zero/span checks. Periods between 0 and 999 hours are acceptable. To turn
the zero/span check off, set the period to 0.
•
3-24
ON
OFF
1
In the Main Menu, choose Calibration > Zero/Span Check > Period
Hours.
Thermo Fisher Scientific
Operation
Calibration Menu
•
Use
and
to move the cursor left or right.
•
Use
and
to increment and decrement the numeric value.
•
Press
to save the period.
ZERO/SPAN PERIOD:
CURRENTLY:
024 HRS
SET TO:
025 HRS ?
§¨ MOVE CURSOR
©ª CHANGE VALUE
SAVE
RANGE
Zero/Span/Purge Duration
Minutes
AVG
DIAGS ALARM
The Zero Duration Minutes screen defines how long zero air is sampled by
the instrument. The span and purge duration screens look and function the
same way as the zero duration screen, and are used to set how long the span
gas and sample gas are sampled by the instrument. Durations between 0 and
60 minutes are acceptable. Each time a zero/span check occurs the zero
check is done first, followed by the span check. To perform just a zero
check, set the span and purge duration screen to 0 (off ). The same applies
to perform just a span or purge check.
•
In the Main Menu, choose Calibration > Zero/Span Check > Zero,
Span or Purge Duration Min.
•
Use
and
to move the cursor left or right.
•
Use
and
to increment and decrement the numeric value.
•
Press
to save the duration value.
ZERO DURATION:
CURRENTLY:
SET TO:
30 MIN
31 MIN ?
§¨ MOVE CURSOR
©ª CHANGE VALUE
SAVE
RANGE
Thermo Fisher Scientific
AVG
DIAGS ALARM
Model 49i Instruction Manual
3-25
Operation
Calibration Menu
Zero/Span Averaging Time
The Zero/Span Averaging Time screen allows the user to adjust the
zero/span averaging time. The zero/span averaging time is used by the
analyzer only when performing an automatic zero or span check. The
analyzer’s averaging time is used for all other functions. The following
averaging times are available: 10, 20, 30, 60, 90, 120, 180, 240, and 300
seconds. Additional averaging times are available when the instrument is in
fast cycle time. These averaging times include 4, 8, 12, 24, 36, 48, 72, 96,
and 120 seconds. For more information about fast update times, see “Cycle
Time”, later in this chapter.
•
In the Main Menu, choose Calibration > Zero/Span Check > Zero/Span
Avg Sec.
•
Use
•
Press
and
to scroll through a list of choices.
to save the averaging time.
ZERO/SPAN AVERAGING TIME:
CURRENTLY:
60 SEC
SET TO:
90 SEC ?
©ª CHANGE VALUE
SAVE VALUE
RANGE
Zero/Span Ratio
3-26
Model 49i Instruction Manual
AVG
DIAGS ALARM
The Zero/Span Ratio screen is used to adjust the ratio of zeros to spans. For
example, if this value is set to 1, a span check will follow every zero check. If
this value is set to 3, there will be two zero checks between each zero/span
check. This value may be set from 1 to 10, with 1 as default.
•
In the Main Menu, choose Calibration > Zero/Span Check > Zero/Span
Ratio.
•
Use
•
Press
and
to increment and decrement the numeric value.
to save the ratio value.
Thermo Fisher Scientific
Operation
Instrument Controls Menu
ZERO/SPAN RATIO:
CURRENTLY:
SET TO:
1 :1
2 :1 ?
©ª CHANGE VALUE
SAVE VALUE
RANGE
Instrument Controls
Menu
AVG
DIAGS ALARM
The Instrument Controls menu contains a number of items. The software
controls listed in this menu enable control of the listed instrument
functions. The custom levels and ozonator solenoid are only displayed if the
ozonator option is installed.
•
In the Main Menu, choose Instrument Controls.
INSTRUMENT CONTROLS:
>CUSTOM LEVELS
OZONATOR SOLENOID
PUMP
CYCLE TIME
TEMPERATURE COMPENSATION
PRESSURE COMPENSATION
ª
DATALOGGING SETTINGS
RANGE
AVG
DIAGS ALARM
COMMUNICATION SETTINGS
I/O CONFIGURATION
SCREEN CONTRAST
SERVICE MODE
DATE/TIME
Custom Levels
The Custom Levels menu lists four custom levels: 1, 2, 3, 4, and 5. Custom
levels deal with ozonator control and configuration. This menu is only
displayed if the ozonator option is installed.
•
Thermo Fisher Scientific
In the Main Menu, choose Instrument Controls > Custom Levels.
Model 49i Instruction Manual
3-27
Operation
Instrument Controls Menu
CUSTOM
>LEVEL
LEVEL
LEVEL
LEVEL
LEVEL
RANGE
Custom O3 Levels
O3 LEVELS:
1
2
3
4
5
AVG
90.0
75.0
50.0
25.0
10.0
%
%
%
%
%
DIAGS ALARM
The Custom O3 Levels screen is used to change the custom ozonator levels.
A percentage of 100% results in the maximum amount of ozone
production. A percentage of 0% results in no ozone production. The range
of percentages, however, are not linear. This screen is only displayed if the
ozonator option is installed.
•
In the Main Menu, choose Instrument Controls > Custom Levels >
Custom Level 1, 2, 3, 4, or 5.
•
Use
•
Press
and
to increment or decrement the numeric value.
to save the new concentration setting.
CUSTOM O3 LEVEL 1:
LAMP SETTING:
10.0% ?
©ª INC/DEC
SAVE VALUE
RANGE
Pump
3-28
Model 49i Instruction Manual
AVG
DIAGS ALARM
The Pump screen allows the user to toggle the pump on and off.
•
In the Main Menu, choose Instrument Controls > Pump.
•
Press
to toggle and set the pump on or off.
Thermo Fisher Scientific
Operation
Instrument Controls Menu
PUMP:
CURRENTLY:
SET TO:
OFF
ON ?
TOGGLE VALUE
RANGE
Ozonator Solenoid
AVG
DIAGS ALARM
The Ozonator Solenoid screen allows the user to toggle the ozonator on and
off.
•
In the Main Menu, choose Instrument Controls > Ozonator Solenoid.
•
Press
to toggle and set the ozonator solenoid on or off.
OZONATOR SOLENOID:
CURRENTLY:
SET TO:
OFF
ON ?
TOGGLE VALUE
RANGE
Cycle Time
Thermo Fisher Scientific
AVG
DIAGS ALARM
The Cycle Time screen allows the user to toggle between standard averaging
time and fast averaging. Fast averaging times include 4, 8, 12, 24, 36, 48,
72, 96, and 120 seconds. For more information on normal averaging times
available, see “Averaging Time” earlier in the this chapter.
•
In the Main Menu, choose Instrument Controls > Cycle Time.
•
Press
to toggle and set the cycle time standard or fast.
Model 49i Instruction Manual
3-29
Operation
Instrument Controls Menu
CYCLE TIME:
CURRENTLY:
SET TO:
STANDARD
FAST ?
TOGGLE VALUE
RANGE
Temperature
Compensation
AVG
DIAGS ALARM
Temperature compensation provides compensation for any changes to the
instrument's output signal due to variations in sample gas temperature. The
Model 49i can be operated with or without temperature compensation.
When temperature compensation is on, the display shows the sample gas
temperature (measured by a thermistor on the Interface board). When
temperature compensation is off, the display shows the standard
temperature of 0.0 °C.
•
In the Main Menu, choose Instrument Controls > Temperature
Compensation.
•
Press
to toggle and set the temperature compensation on or off.
TEMPERATURE COMPENSATION:
o
C
COMP TEMP:
0.0
CURRENTLY:
OFF
SET TO:
ON ?
TOGGLE VALUE
RANGE
Pressure Compensation
AVG
DIAGS ALARM
Pressure compensation provides compensation for any changes to the
instrument's output signal due to variations of sample pressure. The Model
49i can be operated with or without pressure compensation.
When pressure compensation is on, the first line of the display represents
the current sample pressure. When pressure compensation is off, the first
line of the display shows the standard pressure of 760 mmHg.
3-30
Model 49i Instruction Manual
Thermo Fisher Scientific
Operation
Instrument Controls Menu
•
In the Main Menu, choose Instrument Controls > Pressure
Compensation.
•
Press
to toggle and set the pressure compensation on or off.
PRESSURE COMPENSATION:
COMP PRES:
760.0 mmHg
CURRENTLY:
OFF
SET TO:
ON ?
TOGGLE VALUE
RANGE
Datalogging Settings
AVG
DIAGS ALARM
The Datalogging Settings menu deals with datalogging.
•
In the Main Menu, choose Instrument Controls > Datalogging
Settings.
DATALOGGING SETTINGS:
>SELECT SREC/LREC
SREC
VIEW LOGGED DATA
ERASE LOG
SELECT CONTENT
COMMIT CONTENT
RESET TO DEFAULT CONTENT
CONFIGURE DATA LOGGING
RANGE
Select SREC/LREC
Thermo Fisher Scientific
AVG
DIAGS ALARM
The Select SREC/LREC is used to select short record or long record format
for other operations in this menu.
•
In the Main Menu, choose Instrument Controls > Datalogging Settings
> Select SREC/LREC.
•
Press
format.
to toggle and set to either short record or long record
Model 49i Instruction Manual
3-31
Operation
Instrument Controls Menu
SELECT LOG TYPE:
CURRENTLY:
SET TO:
SREC
LREC ?
TOGGLE VALUE
RANGE
View Logged Data
AVG
DIAGS ALARM
The View Logged Data screen is used to select the start point to view the
logged data by number of records or date and time.
•
In the Main Menu, choose Instrument Controls > Datalogging Settings
> Select SREC or LREC > View Logged Data.
•
Use
time.
•
Press
and
to toggle between number of records or date and
to accept.
SELECT START POINT BY:
SET TO: # OF RECS
©ª CHANGE
RANGE
Number of Records
3-32
Model 49i Instruction Manual
AVG
ACCEPT
DIAGS ALARM
The Number of Records screen is used to select the starting point to display
the number of records back to view.
•
Use
and
to move the cursor left or right.
•
Use
and
to increment or decrement the numeric value.
•
Press
screen.
to set the starting record and continue to the record display
Thermo Fisher Scientific
Operation
Instrument Controls Menu
SET # BACK FROM CURRENT:
0000000
TOTAL LRECS:
20
§¨ MOVE CURSOR
©ª CHANGE VALUE
SAVE
RANGE
AVG
DIAGS ALARM
The Record Display screen (read only) displays the selected records.
•
Use
and
to view all the items in the record.
•
Use
and
to view records at different times.
time
date
10:00 06/20/05
11:00 06/20/05
12:00 06/20/05
13:00 06/20/05
©ª PGUP/DN
§¨
RANGE
Date and Time
Thermo Fisher Scientific
AVG
flags
FC0088900
FC0088900
FC0088900
FC0088900
PAN L/R
DIAGS ALARM
The Date and Time screen is used to set a start date and time for which to
view logged data. For example, if “20 JUN 2005 10:00” is entered, then the
first logged data record that is displayed is the first record after this time. If
set to one minute logging, this would be at “20 JUN 2005 10:01”.
•
Use
and
to increment or decrement the selected field.
•
Use
to advance to next field.
•
Press
to set the date and time of the first record to be displayed
and continue to the record display screen.
Model 49i Instruction Manual
3-33
Operation
Instrument Controls Menu
DATE AND TIME:
20 JUN 2005 10:00
©ª CHG
DAYS
¨ SET CURSOR TO MONTHS
ACCEPT AS SHOWN
RANGE
AVG
DIAGS ALARM
The Record Display screen (read only) displays the selected records.
•
Use
and
to view all the items in the record.
•
Use
and
to view records at different times.
time
date
10:01 06/20/05
10:02 06/20/05
10:03 06/20/05
10:04 06/20/05
©ª PGUP/DN
§¨
RANGE
Erase Log
3-34
Model 49i Instruction Manual
AVG
flags
FC0088900
FC0088900
FC0088900
FC0088900
PAN L/R
DIAGS ALARM
The Erase Log is used to erase all saved data for the selected record type (not
all short records and long records).
•
In the Main Menu, choose Instrument Controls > Datalogging Settings
> Erase Log.
•
Press
to erase all data.
•
Press
to confirm erasure.
Thermo Fisher Scientific
Operation
Instrument Controls Menu
ERASE LREC LOG FILE DATA?
ERASE LREC LOG FILE DATA?
ERASE
RANGE
AVG
ERASE
ARE YOU SURE YOU WANT TO?x
PRESS ¨ TO CONFIRM ERASURE
DIAGS ALARM
Select Content
RANGE
DIAGS ALARM
The Select Content submenu displays a list of 32 record fields to use and a
submenu list of the analog output signal group choices to choose from.
Choices are Concentrations, Other Measurements, and Analog Inputs (if
the I/O expansion board is installed). This is a temporary list of items for
the selected record type that must be committed via the datalogging menu
before the changes will apply. Note that committing any changes to this list
will erase all currently logged data, as the format of the stored data is
changed.
•
In the Main Menu, choose Instrument Controls > Datalogging Settings
> Select Content.
LREC FIELDS:
>FIELD 1
FIELD 2
FIELD 3
FIELD 4
FIELD 5
FIELD 6
FIELD 7
RANGE
Choose Item Type
AVG
AVG
O3
HIO3
CELLAI
CELLBI
BNCHT
LMPT
NONE ª
DIAGS ALARM
The Choose Item Type submenu displays a list of data that can be logged
for the current field. Choices and Concentrations, Other Measurements,
and Analog Inputs (if the I/O expansion board is installed).
In the Main Menu, choose Instrument Controls > Datalogging Settings >
Select Content > Field 1-32.
Thermo Fisher Scientific
Model 49i Instruction Manual
3-35
Operation
Instrument Controls Menu
DATA IN LREC FIELD 1:
>CONCENTRATIONS
OTHER MEASUREMENTS
ANALOG INPUTS
RANGE
Concentrations
AVG
DIAGS ALARM
The Concentrations screen allows the user to select the output signal that is
tied to the selected field item. The selected item is shown by “<--” after it.
Note that at this point, pressing
indicates that these are proposed
changes as opposed to implemented changes. To change the selected record
format and erase record log file data, see “Commit Content” below. Range
status is visible only in auto range mode.
•
In the Main Menu, choose Instrument Controls > Datalogging Settings
> Select Content > Select Field > Concentrations.
•
Use
•
Press
and
to move the cursor up and down.
to select a new choice.
CONCENTRATIONS:
>NONE
O3
LO O3
HI O3
RANGE STATUS
RANGE
Other Measurements
Model 49i Instruction Manual
DIAGS ALARM
The Other Measurements screen allows the user to select the output signal
that is tied to the selected field item. The selected item is shown by “<--”
after it. Items displayed are determined by the options installed. Note that at
this point, pressing
indicates that these are proposed changes as
opposed to implemented changes. To change the selected record format and
erase record log file data, see “Commit Content” below.
•
3-36
AVG
<--
In the Main Menu, choose Instrument Controls > Datalogging Settings
> Select Content > Select Field > Other Measurements.
Thermo Fisher Scientific
Operation
Instrument Controls Menu
•
Use
•
Press
and
to move the cursor up and down.
to select a new choice.
OTHER MEASUREMENTS:
>NONE
INTENSITY A
INTENSITY B
NOISE A
NOISE B
FLOW A
FLOW B
RANGE
AVG
ª
DIAGS ALARM
PRESSURE
BENCH TEMP
LAMP TEMP
O3 LAMP TEMP
Analog Inputs
The Analog Inputs screen allows the user to select the output signal (none
or analog inputs 1-8) that is tied to the selected field item. The selected item
is shown by “<--” after it. Note that at this point, pressing
indicates
that these are proposed changes as opposed to implemented changes. To
change the selected record format and erase record log file data, see
“Commit Content” below.
•
In the Main Menu, choose Instrument Controls > Datalogging Settings
> Select Content > Select Field > Analog Inputs.
•
Use
•
Press
and
to move the cursor up and down.
to select a new choice.
ANALOG INPUTS:
>NONE
ANALOG IN 1
ANALOG IN 2
ANALOG IN 3
ANALOG IN 4
ANALOG IN 5
ANALOG IN 6
RANGE
Thermo Fisher Scientific
AVG
ª
DIAGS ALARM
Model 49i Instruction Manual
3-37
Operation
Instrument Controls Menu
Commit Content
The Commit Content screen is used to save the selected output signal that is
tied to the selected field item. If no changes have been made “NO
CHANGES TO RECORD LIST!” will appear. For more information
about selecting the analog output signal group choices, see “Select Content”
above.
•
In the Main Menu, choose Instrument Controls > Datalogging Settings
> Commit Content.
•
Press
to commit changes to selected record format and erase
record log file data.
•
Press
CHANGE LREC DATA AND
ERASE LREC LOG FILE DATA?
COMMIT
RANGE
AVG
Reset to Default Content
3-38
Model 49i Instruction Manual
DIAGS ALARM
to confirm changes.
CHANGE LREC FORMAT AND
ERASE LREC LOG FILE DATA?
COMMIT
ARE YOU SURE YOU WANT TO?x
PRESS ¨ TO CONFIRM CHANGES
RANGE
AVG
DIAGS ALARM
The Reset to Default Content screen is used to reset all of the datalogging
field items to default values. For more information about selecting the
analog output signal group choices, see “Select Content” above.
•
In the Main Menu, choose Instrument Controls > Datalogging Settings
> Reset to Default Content.
•
Press
to reset selected record format and erase record log file data.
•
Press
to confirm reset.
Thermo Fisher Scientific
Operation
Instrument Controls Menu
RESET LREC FORMAT AND
ERASE LREC LOG FILE DATA?
RESET
RANGE
AVG
RESET LREC FORMAT AND
ERASE LREC LOG FILE DATA?
RESET
ARE YOU SURE YOU WANT TO?x
PRESS ¨ TO CONFIRM RESETXX
DIAGS ALARM
Configure Datalogging
RANGE
AVG
DIAGS ALARM
The Configure Datalogging menu deals with datalogging configuration for
the currently selected record type.
•
In the Main Menu, choose Instrument Controls > Datalogging Settings
> Configure Datalogging.
DATALOGGING SETTINGS:
>LOGGING PERIOD MIN
OFF
MEMORY ALLOCATION %
50
DATA TREATMENT
AVG
RANGE
Logging Period Min
Thermo Fisher Scientific
AVG
DIAGS ALARM
The Logging Period Min screen is used to select the logging period in
minutes for the record format (srec or lrec). List of choices include: off, 1, 5,
15, 30, and 60 minutes (default).
•
In the Main Menu, choose Instrument Controls > Datalogging Settings
> Configure Datalogging > Logging Period Min.
•
Use
•
Press
and
to scroll through a list of choices.
to set the logging period.
Model 49i Instruction Manual
3-39
Operation
Instrument Controls Menu
SET PERIOD FOR SREC:
CURRENTLY:
OFF MIN
SET TO:
60 MIN ?
©ª CHANGE VALUE
RANGE
Memory Allocation Percent
RANGE
AVG
Data Treatment
3-40
Model 49i Instruction Manual
DIAGS ALARM
The Memory Allocation Percent screen is used to select the percentage of
each record type for both short records and long records. Percentages
between 0 and 100% are available in increments of 10. Changing this value
results in log erasure for both short records and long records.
•
In the Main Menu, choose Instrument Controls > Datalogging Settings
> Configure Datalogging > Memory Allocation %.
•
Use
•
Press
to set the percentage for both record types and proceed to
the erasure warning screen.
•
Press
SET PERCENT SRECS:
CURRENTLY:
SET TO:
ª CHANGE VALUE
AVG
SAVE
50 %
60 % ?
SAVE
DIAGS ALARM
and
to scroll through a list of choices.
to confirm change.
SET PERCENT SRECS:
CURRENTLY:
SET TO:
THIS WILL ERASE ALL
PRESS ¨ TO CONFIRM
RANGE
AVG
50 %
60 % ?
LOGS!x
CHANGE
DIAGS ALARM
The Data Treatment screen is used to select the data type for the selected
record: whether the data should be averaged over the interval, the minimum
or maximum used, or the current value logged. Data treatment doesn’t apply
to all data, just to the concentration measurement. All other data points log
the current value at the end of the interval.
Thermo Fisher Scientific
Operation
Instrument Controls Menu
•
In the Main Menu, choose Instrument Controls > Datalogging Settings
> Configure Datalogging > Data Treatment.
•
Use
•
Press
and
to scroll through a list of choices.
to save the data type.
SET LREC DATA TYPE:
CURRENTLY: AVG
SET TO: CUR
©ª CHANGE VALUE
RANGE
Communication Settings
AVG
?
SAVE
DIAGS ALARM
The Communication Settings menu is used with communications control
and configuration.
•
In the Main Menu, choose Instrument Controls > Communication
Settings.
COMMUNICATION SETTINGS:
>BAUD RATE
INSTRUMENT ID
COMMUNICATION PROTOCOL
STREAMING DATA CONFIG
RS-232/RS-485 SELECTION
TCP/IP SETTINGS
RANGE
Baud Rate
Thermo Fisher Scientific
AVG
DIAGS ALARM
The Baud Rate screen is used to set the RS-232/RS-485 interface baud rate.
Baud rates of 1200, 2400, 4800, and 9600, 19200, 38400, 57600, and
115200 are available.
•
In the Main Menu, choose Instrument Controls > Communication
Settings > Baud Rate.
•
Use
and
to scroll through a list of choices.
Model 49i Instruction Manual
3-41
Operation
Instrument Controls Menu
•
Press
to save the new baud rate.
BAUD RATE:
CURRENTLY:
SET TO:
9600
19200
?
©ª CHANGE VALUE
SAVE VALUE
RANGE
Instrument ID
AVG
DIAGS ALARM
The Instrument ID screen allows the operator to edit the instrument ID.
The ID is used to identify the instrument when using the C-Link or
MODBUS protocols to control the instrument or collect data. It may be
necessary to edit the ID number if two or more of the same instrument are
connected to one computer. Valid Instrument ID numbers are from 0 to
127. The Model 49i has a default Instrument ID of 49. For more
information about the Instrument ID, see Appendix B “C-Link Protocol
Commands” or Appendix C “MODBUS Protocol”.
•
In the Main Menu, choose Instrument Controls > Communication
Settings > Instrument ID.
•
Use
•
Press
and
to increment or decrement the ID value.
to save the new instrument ID.
INSTRUMENT ID:
CURRENTLY:
SET TO:
49
50 ?
©ª CHANGE VALUE
SAVE VALUE
RANGE
Communication Protocol
AVG
DIAGS ALARM
The Communication Protocol screen is used to change the instrument
communication protocol for serial communications.
In the Main Menu, choose Instrument Controls > Communication Settings
> Communication Protocol.
3-42
Model 49i Instruction Manual
Thermo Fisher Scientific
Operation
Instrument Controls Menu
•
Use
•
Press
and
to scroll through a list of choices.
to save the new protocol.
COMMUNICATION PROTOCOL:
CURRENTLY:
CLINK
SET TO:
STREAMING ?
©ª CHANGE VALUE
SAVE VALUE
RANGE
Streaming Data Configuration
AVG
DIAGS ALARM
The Streaming Data Configuration menu is used to allow for configuration
of the 8 streaming data output items, streaming interval, current data
format, and current timestamp setting. The Choose Item Signal submenu
displays a list of the analog output signal group choices to choose from.
Choices are Concentrations, Other Measurements, and Analog Inputs (if
the I/O expansion board option is installed).
•
In the Main Menu, choose Instrument Controls > Communication
Settings > Streaming Data Config.
STREAMING DATA CONFIG:
>INTERVAL
10 SEC
ADD LABELS
NO
PREPEND TIMESTAMP
YES
ITEM 1
O3
ITEM 2
CELLAI
ITEM 3
CELLBI
ITEM 4
NONE ª
RANGE
AVG
DIAGS ALARM
CHOOSE STREAM DATA:
>CONCENTRATIONS
OTHER MEASUREMENTS
ANALOG INPUTS
RANGE
Thermo Fisher Scientific
AVG
DIAGS ALARM
Model 49i Instruction Manual
3-43
Operation
Instrument Controls Menu
Streaming Data Interval
The Streaming Data Interval screen is used to adjust the streaming data
interval. The following interval times are available: 1, 2, 5, 10, 20, 30, 60,
90, 120, 180, 240, and 300 seconds.
•
In the Main Menu, choose Instrument Controls > Communication
Settings > Streaming Data Config > Streaming Data Interval.
•
Use
•
Press
and
to scroll through a list of choices.
to save the new streaming data period.
STREAMING DATA INTERVAL:
CURRENTLY:
10 SEC
SET TO:
20 SEC ?
©ª CHANGE VALUE
SAVE VALUE
RANGE
Concentrations
AVG
DIAGS ALARM
The Concentrations screen allows the user to select the output signal that is
tied to the selected streaming data item. The selected item is shown by “<--”
after it. Range Status is visible only in auto range mode
•
In the Main Menu, choose Instrument Controls > Communication
Settings > Streaming Data Config > Select Item > Concentrations.
•
Use
•
Press
and
to move the cursor up and down.
to select a new choice.
CONCENTRATIONS:
>NONE
O3
LO O3
HI O3
RANGE STATUS
RANGE
3-44
Model 49i Instruction Manual
AVG
<--
DIAGS ALARM
Thermo Fisher Scientific
Operation
Instrument Controls Menu
Other Measurements
The Other Measurements screen allows the user to select the output signal
that is tied to the selected streaming data item. The selected item is shown
by “<--” after it.
•
In the Main Menu, choose Instrument Controls > Communication
Settings > Streaming Data Config > Select Item > Other
Measurements.
•
Use
•
Press
and
to move the cursor up and down.
to select a new choice.
OTHER MEASUREMENTS:
>NONE
INTENSITY A
INTENSITY B
NOISE A
NOISE B
FLOW A
FLOW B
RANGE
AVG
ª
DIAGS ALARM
PRESSURE
BENCH TEMP
LAMP TEMP
O3 LAMP TEMP
Analog Inputs
Thermo Fisher Scientific
The Analog Inputs screen allows the user to select the analog input signal
(none or analog inputs 1-8) that is tied to the selected streaming data item.
The selected item is shown by “<--” after it.
•
In the Main Menu, choose Instrument Controls > Communication
Settings > Streaming Data Config > Select Item > Analog Inputs.
•
Use
•
Press
and
to move the cursor up and down.
to select a new choice.
Model 49i Instruction Manual
3-45
Operation
Instrument Controls Menu
ANALOG INPUTS:
>NONE
ANALOG IN 1
ANALOG IN 2
ANALOG IN 3
ANALOG IN 4
ANALOG IN 5
ANALOG IN 6
RANGE
RS-232/RS-485 Selection
AVG
ª
DIAGS ALARM
The RS-232/RS-485 Selection screen allows the user to choose between the
RS-232 or RS-485 specification for serial communication.
Note Disconnect the serial cable before changing RS-232 and RS-485
selection to prevent damage to the connected equipment. •
In the Main Menu, choose Instrument Controls > Communication
Settings > RS-232/RS-485 Selection.
•
Press
•
Use
to leave the warning screen and move to next screen.
to confirm and save the new selection change.
RS-232/RS-485 SELECTION:
XXXXXX** WARNING **XXXXXXX
DISCONNECT THE SERIALX X
CABLES BEFORE CHANGING X
THE SELECTION!XXXXXX
TO CONTINUE
RANGE
AVG
TCP/IP Settings
DIAGS ALARM
RS-232/RS-485 SELECTION:
CURRENTLY:
RS-232
SET TO:
RS-485 ?
MAKE SURE THAT THE CABLEXX
IS OFF: PRESS ¨ TO CONFIRM
TOGGLE VALUE
RANGE
AVG
DIAGS ALARM
The TCP/IP Settings menu is used for defining TCP/IP settings
Note The instrument power must be cycled after this parameter has been
changed for the change to take effect. •
3-46
Model 49i Instruction Manual
In the Main Menu, choose Instrument Controls > Communication
Settings > TCP/IP Settings.
Thermo Fisher Scientific
Operation
Instrument Controls Menu
TCP/IP SETTINGS:
>USE DHCP
OFF
IP ADDRESS 192.168.1.151
NETMASK
255.255.255.0
GATEWAY
192.168.1.1
HOST NAME
iSeries
RANGE
Use DHCP
AVG
DIAGS ALARM
The Use DHCP screen is used to specify whether or not to use DHCP.
When DHCP is enabled, the network dynamically provides an IP address
for the instrument.
•
In the Main Menu, choose Instrument Controls > Communication
Settings > TCP/IP Settings > Use DCHP.
•
Press
to toggle and set DHCP on or off.
DHCP:
CURRENTLY:
SET TO:
OFF
ON ?
TOGGLE VALUE
CYCLE POWER TO CHANGE DHCP
RANGE
IP Address
Thermo Fisher Scientific
AVG
DIAGS ALARM
The IP Address screen is used to edit the IP address. The IP address can
only be changed when DHCP is OFF. For more information on DHCP, see
“Use DHCP.”
•
In the Main Menu, choose Instrument Controls > Communication
Settings > TCP/IP Settings > IP Address.
•
Use
,
the IP address.
•
Press
,
and
to move and change the value of
to save the new address.
Model 49i Instruction Manual
3-47
Operation
Instrument Controls Menu
IP ADDRESS:
CURRENT: 192.168.1.151
SET TO: 192.168.1.151 1
§¨ MOVE CURSOR
©ª CHANGE VALUE
SAVE
RANGE
Netmask
AVG
DIAGS ALARM
The Netmask screen is used to edit the netmask. The netmask is used to
determine the subnet the instrument uses to directly communicate with
other devices. The netmask can only be changed when DHCP is OFF. For
more information on DHCP, see “Use DHCP.”
•
In the Main Menu, choose Instrument Controls > Communication
Settings > TCP/IP Settings > Netmask.
•
Use
,
the netmask.
•
Press
,
and
to move and change the value of
to save the new netmask.
NETMASK:
CURRENT: 255.255.255.0
SET TO: 255.255.255.000
§¨ MOVE CURSOR
©ª CHANGE VALUE
SAVE
RANGE
Defalt Gateway
3-48
Model 49i Instruction Manual
AVG
DIAGS ALARM
The Default Gateway screen is used to edit the gateway address. Any traffic
to addresses that are not on the local subnet will be routed through this
address. The default gateway can only be changed when DHCP is OFF. For
more information on DHCP, see “Use DHCP.”
•
In the Main Menu, choose Instrument Controls > Communication
Settings > TCP/IP Settings > Gateway.
•
Use
,
,
the gateway address.
and
to move and change the value of
Thermo Fisher Scientific
Operation
Instrument Controls Menu
•
Press
to save the new address.
DEFAULT GATEWAY:
CURRENT: 192.168.1.1
SET TO: 192.168.1.1
1
§¨ MOVE CURSOR
©ª CHANGE VALUE
SAVE
RANGE
Host Name
AVG
DIAGS ALARM
The host name screen is used to edit the host name. When DHCP is
enabled, this name is reported to the DHCP server.
•
In the Main Menu, choose Instrument Controls > Communication
Settings > TCP/IP Settings > Host Name.
•
Use
,
,
and
to move the cursor or change
between the edit field and the alpha page.
•
Press
to save the new letter in the alpha table or save the new
alpha page.
HOST NAME:
CURRENT: ISERIES
ISERIES SSSSSS?
ABCDEFGHIJKLMN BKSP
OPQRSTUVWXYZ
PAGE
0123456789 ./- SAVE
RANGE
I/O Configuration
DIAGS ALARM
The I/O Configuration menu deals with configuration of the analyzer’s I/O
system. The analog input configuration is displayed only if the I/O
expansion board option is installed.
•
Thermo Fisher Scientific
AVG
In the Main Menu, choose Instrument Controls > I/O Configuration.
Model 49i Instruction Manual
3-49
Operation
Instrument Controls Menu
I/O CONFIGURATION:
>OUTPUT RELAY SETTINGS
DIGITAL INPUT SETTINGS
ANALOG OUTPUT CONFIG
ANALOG INPUT CONFIG
RANGE
Output Relay Settings
AVG
DIAGS ALARM
The Output Relay Settings menu displays a list of the 10 analog output
relays available, and allows the user to select the logic state or instrument
parameter for the relay selected.
Note The digital outputs may take up to one second after the assigned state
occurs to show up on the outputs. •
In the Main Menu, choose Instrument Controls > I/O Configuration >
Output Relay Settings.
OUTPUT RELAY SETTINGS:
>1
NOP
CONC ALARM
2
NOP
NONE
3
NOP
UNITS
4
NOP
GEN ALARM
5
NOP
ZERO MODE
6
NOP
OZ LEVEL 1
7
NOP
OZ LEVEL 2 ª
RANGE
Logic State
Model 49i Instruction Manual
DIAGS ALARM
The Logic State screen is used to change the I/O relay to either normally
open or normally closed.
•
3-50
AVG
Press
to toggle and set the logic state open or closed.
Thermo Fisher Scientific
Operation
Instrument Controls Menu
OUTPUT RELAY SETUP:
>LOGIC STATE
INSTRUMENT STATE
RANGE
Instrument State
AVG
OPEN
DIAGS ALARM
The Instrument State submenu allows the user to select the instrument state
that is tied to the selected relay output. A submenu lists signal types of
either alarm and non-alarm to choose from.
•
In the Main Menu, choose Instrument Controls > I/O Configuration >
Output Relay Settings > Select Relay > Instrument State.
CHOOSE SIGNAL TYPE:
>ALARMS
NON-ALARM
RANGE
Alarms
Thermo Fisher Scientific
AVG
DIAGS ALARM
The Alarms status screen allows the user to select the alarm status for the
selected relay output. The selected item is shown by “<--” after it. The I/O
board status alarm is present only if the I/O expansion board is installed.
The zero and span check/calibration alarms are present only if the zero/span
valve option is installed and the instrument is operating in manual mode.
•
In the Main Menu, choose Instrument Controls > I/O Configuration >
Output Relay Settings > Select Relay > Instrument State > Alarms.
•
Use
•
Press
and
to scroll through a list of choices.
to save the new selection for the relay.
Model 49i Instruction Manual
3-51
Operation
Instrument Controls Menu
ALARM STATUS ITEMS:
>NONE
GEN ALARM
CONC MAX
CONC MIN
BENCH TEMP
BNCH LMP TEMP
OZ LAMP TEMP
RANGE
AVG
DIAGS ALARM
PRESSURE
FLOW A
FLOW B
INTENSITY A
INTENSITY B
CONC ALARM
MB STATUS
IB STATUS
I/O BD STATUS
Non-Alarm
ª
<--
The Non-Alarm status screen allows the user to select the non-alarm status
for the selected relay output. The selected item is shown by “<--” after it.
•
In the Main Menu, choose Instrument Controls > I/O Configuration >
Output Relay Settings > Select Relay > Instrument State > Non-Alarm.
•
Use
•
Press
and
to scroll through a list of choices.
to save the new selection for the relay.
NON ALARM STATUS ITEMS:
>NONE
AUTORANGE
SERVICE
UNITS
ZERO MODE
SPAN MODE
SAMPLE MODE
RANGE
AVG
ª
DIAGS ALARM
OZ LEVEL 1
OZ LEVEL 2
OZ LEVEL 3
OZ LEVEL 4
OZ LEVEL 5
PURGE MODE
3-52
Model 49i Instruction Manual
Thermo Fisher Scientific
Operation
Instrument Controls Menu
Digital Input Settings
The Digital Input Settings menu displays a list of the 16 digital inputs
available, and allows the user to select the logic state and instrument
parameter for the relay selected.
Note The digital inputs must be asserted for at least one second for the
action to be activated. •
In the Main Menu, choose Instrument Controls > I/O Configuration >
Digital Input Settings.
•
Use
•
Press
and
to move the cursor up and down.
to select a choice.
DIGITAL INPUT SETTINGS:
>1
NOP SET BACKGROUND
2
NOP OZONATOR LVL 1
3
NOP OZONATOR LVL 2
4
NOP
AOUTS TO ZERO
5
NOP
AOUTS TO FS
6
NOP
NONE
7
NOP
NONE ª
RANGE
Logic State
AVG
DIAGS ALARM
The Logic State screen is used to change the I/O relay to either normally
open or normally closed. The default state is open, which indicates that a
relay connected between the digital input pin and ground is normally open
and closes to trigger the digital input action. If nothing is connected to the
digital input pin, the state should be left at open to prevent the action from
being triggered.
•
Press
to toggle and set the logic state open or closed.
DIGITAL INPUT SETUP:
>LOGIC STATE
OPEN
INSTRUMENT ACTION
RANGE
Thermo Fisher Scientific
AVG
DIAGS ALARM
Model 49i Instruction Manual
3-53
Operation
Instrument Controls Menu
Instrument Action
The Instrument Action screen allows the user to choose the instrument
action that is tied to the selected digital input.
•
In the Main Menu, choose Instrument Controls > I/O Configuration >
Digital Input Settings > Select Relay > Instrument Action.
•
Use
•
Press
and
to scroll through a list of choices.
to save the new selection for the relay.
CHOOSE ACTION:
>NONE
ZERO MODE
SPAN MODE
OZONATOR LVL 1
OZONATOR LVL 2
OZONATOR LVL 3
OZONATOR LVL 4
RANGE
AVG
DIAGS ALARM
OZONATOR LVL 5
SET BACKGROUND
CAL TO LO SPAN
CAL TO HI SPAN
OZONATOR SLND
AOUTS TO ZERO
AOUTS TO FS
Analog Output Configuration
3-54
Model 49i Instruction Manual
ª
<--
The Analog Output Configuration menu displays a list of the analog output
channels available for configuration. Channel choices include all voltage
channels, all current channels, voltage channels 1-6, and current channels
1-6 (if the I/O expansion board option is installed). Configuration choices
include selecting range, setting minimum/maximum values, and choosing
signal to output.
•
In the Main Menu, choose Instrument Controls > I/O Configuration >
Analog Output Config.
•
Use
•
Press
and
to move the cursor up and down.
to select a choice.
Thermo Fisher Scientific
Operation
Instrument Controls Menu
OUTPUT CHANNELS:
>ALL VOLTAGE CHANNELS
ALL CURRENT CHANNELS
VOLTAGE CHANNEL 1
VOLTAGE CHANNEL 2
VOLTAGE CHANNEL 3
VOLTAGE CHANNEL 4
VOLTAGE CHANNEL 5
RANGE
AVG
ª
DIAGS ALARM
ANALOG OUTPUT CONFIG:
>SELECT RANGE
SET MINIMUM VALUE
SET MAXIMUM VALUE
CHOOSE SIGNAL TO OUTPUT
RANGE
Select Output Range
AVG
DIAGS ALARM
The Select Output Range screen is used to select the hardware range for the
selected analog output channel. Possible ranges for the voltage outputs are:
0-100 mV, 0-1, 0-5, 0-10 V.
•
In the Main Menu, choose Instrument Controls > I/O Configuration >
Analog Output Config > Select Channel > Select Range.
•
Use
•
Press
and
to move the cursor up and down.
to save the new range.
SELECT OUTPUT RANGE:
SELECTED OUTPUT:
V ALL
CURRENTLY:
0-10V
SET TO:
0-5V
?
©ª CHANGE VALUE
RANGE
Thermo Fisher Scientific
AVG
SAVE
DIAGS ALARM
Model 49i Instruction Manual
3-55
Operation
Instrument Controls Menu
Minimum and Maximum Value
The MinimumValue screen is used to edit the zero (0) to full-scale (100)
value in percentages for the selected analog output channel. See Table 3-6
for a list of choices. The minimum and maximum output value screens
function the same way. The example below shows the set minimum value
screen.
•
In the Main Menu, choose Instrument Controls > IO Configuration >
Analog Output Config > Select Channel > Set Minimum or Maximum
Value.
•
Use
•
Press
and
to increment or decrement the numeric value.
to validate and save the new minimum value.
MINIMUM OUTPUT PERCENT:
SELECTED OUTPUT:
V ALL
CURRENTLY:
N/A %
SET TO:
0000.5 % ?
©ª CHANGE VALUE
RANGE
AVG
SAVE
DIAGS ALARM
Table 3-6. Analog Output Zero to Full-Scale Table
3-56
Model 49i Instruction Manual
Output
Zero % Value
Full-Scale 100% Value
O3
Zero (0)
Range Setting
LO O3
Zero (0)
Range Setting
HI O3
Zero (0)
Range Setting
Range Status
Recommend not to change the setting for this output
Intensity A
User-set alarm min value
User-set alarm max value
Intensity B
User-set alarm min value
User-set alarm max value
Noise A
Zero (0)
Range Setting
Noise B
Zero (0)
Range Setting
Flow A
User-set alarm min value
User-set alarm max value
Flow B
User-set alarm min value
User-set alarm max value
Pressure
User-set alarm min value
User-set alarm max value
Bench Temp
User-set alarm min value
User-set alarm max value
Lamp Temp
User-set alarm min value
User-set alarm max value
Thermo Fisher Scientific
Operation
Instrument Controls Menu
Table 3-6. Analog Output Zero to Full-Scale Table
Choose Signal To Output
Output
Zero % Value
Full-Scale 100% Value
O3 Lamp Temp
User-set alarm min value
User-set alarm max value
The Choose Signal Type To Output screen displays a submenu list of the
analog output signal group choices. Group choices are Concentrations,
Other Measurements, and Analog Inputs (if the I/O expansion board
option is installed). This allows the user to select the output signal to the
selected output channel. The Concentrations screen is shown below. See
Table 3-7 below for a list of items for each signal group choice.
•
In the Main Menu, choose Instrument Controls > I/O Configuration >
Analog Output Config > Select Channel > Choose Signal To Output.
•
Use
•
Press
and
to move the cursor up and down.
to select a choice.
CHOOSE ITEM SIGNAL:
CONCENTRATIONS
OTHER MEASUREMENTS
ANALOG INPUTS
RANGE
DIAGS ALARM
CHOOSE SIGNAL SELECTED OUTPUT:
CURRENTLY: O3
SET TO: NONE
CONC
V1
©ª CHANGE VALUE
SAVE
RANGE
Thermo Fisher Scientific
AVG
AVG
?
DIAGS ALARM
Model 49i Instruction Manual
3-57
Operation
Instrument Controls Menu
Table 3-7. Signal Type Group Choices
Concentrations
Other Measurements
Analog Inputs
None
None
None
O3 (single range only)
Intensity A
Analog Input 1
LO O3 (dual/auto range only)
Intensity B
Analog Input 2
HI O3 (dual/auto range only)
Noise A
Analog Input 3
Range Status (auto range only
Noise B
Analog Input 4
Flow A
Analog Input 5
Flow B
Analog Input 6
Pressure
Analog Input 7
Bench Temp
Analog Input 8
Lamp Temp
O3 Lamp Temp
Analog Input Configuration
The Analog Input Configuration menu displays a list of the 8 analog input
channels available for configuration. This screen is only displayed if the I/O
expansion board option is installed. Configuration includes entering
descriptor, units, decimal places, choice of 1-10 points in the table, and
corresponding number of points selected.
•
In the Main Menu, choose Instrument Controls > I/O Configuration >
Analog Input Config.
ANALOG INPUT CONFIG:
>CHANNEL 1
CHANNEL 2
CHANNEL 3
CHANNEL 4
CHANNEL 5
CHANNEL 6
CHANNEL 7
RANGE
3-58
Model 49i Instruction Manual
AVG
IN1
IN2
IN3
IN4
IN5
IN6
IN7ª
DIAGS ALARM
Thermo Fisher Scientific
Operation
Instrument Controls Menu
ANALOG INPUT 01 CONFIG:
>DESCRIPTOR
IN1
UNITS
V
DECIMAL PLACES
2
TABLE POINTS
2
POINT 1
POINT 2
RANGE
Descriptor
AVG
DIAGS ALARM
The Descriptor screen allows the user to enter the descriptor for the selected
analog input channel. The descriptor is used in datalogging and streaming
data to report what data is being sent out. The descriptor may be from 1 to
3 characters in length, and defaults to IN1 to IN8 (user input channel
number).
•
In the Main Menu, choose Instrument Controls > I/O Configuration >
Analog Input Config > Select Channel > Descriptor.
•
Press
to save the new descriptor.
ANALOG INPUT DESCRIPTOR:
CURRENTLY: IN1
IN1
ABCDEFGHIJKLMN BKSP
OPQRSTUVWXYZ
PAGE
0123456789 ./- SAVE
RANGE
Units
Thermo Fisher Scientific
AVG
DIAGS ALARM
The Units screen allows the user to enter the units for the selected analog
input channel. The units are displayed on the diagnostic screen and in
datalogging and streaming data. The units may be from 1 to 3 characters in
length, and defaults to V (volts).
•
In the Main Menu, choose Instrument Controls > I/O Configuration >
Analog Input Config > Select Channel > Units.
•
Press
to save the new value.
Model 49i Instruction Manual
3-59
Operation
Instrument Controls Menu
ANALOG INPUT UNITS:
CURRENTLY: V
VSS
ABCDEFGHIJKLMN
OPQRSTUVWXYZ
0123456789 ./RANGE
Decimal Places
AVG
BKSP
PAGE
SAVE
DIAGS ALARM
The Decimal Places screen allows the user to select how many digits are
displayed to the right of the decimal, from 0 to 6, with a default of 2.
•
In the Main Menu, choose Instrument Controls > I/O Configuration >
Analog Input Config > Select Channel > Decimal Places.
•
Use
•
Press
and
to increment or decrement the value.
to save the new value.
DECIMAL PLACES:
CURRENTLY:
SET TO:
2
3 ?
©ª INC/DEC
SAVE VALUE
RANGE
Number of Table Points
3-60
Model 49i Instruction Manual
AVG
DIAGS ALARM
The Number of Table Points screen allows the user to select how many
points are used in the conversion table. The points range from 2 to 10, with
a default of 2.
•
In the Main Menu, choose Instrument Controls > I/O Configuration >
Analog Input Config > Select Channel > Table Points.
•
Use
•
Press
and
to move the cursor up and down.
to save the new value.
Thermo Fisher Scientific
Operation
Instrument Controls Menu
NUMBER OF TABLE POINTS:
CURRENTLY:
2
SET TO:
10 ?
©ª INC/DEC
SAVE VALUE
RANGE
Table Point
AVG
DIAGS ALARM
The Table Point submenu allows the user to set up an individual table
point.
•
In the Main Menu, choose Instrument Controls > I/O Configuration >
Analog Input Config > Select Channel > Point 1-10.
TABLE POINT 01 CONFIG:
>VOLTS
0.00
USER VALUE
0.00
RANGE
Volts
Thermo Fisher Scientific
AVG
DIAGS ALARM
The Volts screen allows the user to set the input voltage for the selected
table point in the conversion table, from 0.00 to 10.50. The default table is
a two-point table with point 1: 0.00 V = 000.0 U and point 2: 10.00 V =
10.0 U.
•
In the Main Menu, choose Instrument Controls > I/O Configuration >
Analog Input Config > Select Channel > Select Point > Volts.
•
Use
and
to move the cursor left or right.
•
Use
and
to move the cursor up and down.
•
Press
to save the new value.
Model 49i Instruction Manual
3-61
Operation
Instrument Controls Menu
TABLE POINT 01 VOLTS:
CURRENTLY:
0.00
SET TO:
00.00
§¨ MOVE CURSOR
©ª CHANGE VALUE
SAVE
RANGE
User Value
AVG
DIAGS ALARM
The User Value screen allows the user to set the output value for the
corresponding input voltage for the selected table point in the conversion
table, from -9999999 to 99999999. The default table is a two-point table
with point 1: 0.00 V = 000.0 U and point 2: 10.00 V = 10.0 U.
•
In the Main Menu, choose Instrument Controls > I/O Configuration >
Analog Input Config > Select Table Point > User Value.
•
Use
and
to move the cursor left or right.
•
Use
and
to move the cursor up and down.
•
Press
to save the new value.
TABLE POINT 01 USER VAL:
CURRENTLY:
0.00
SET TO:
00000.00
§¨ MOVE CURSOR
©ª CHANGE VALUE
SAVE
RANGE
Screen Contrast
3-62
Model 49i Instruction Manual
AVG
DIAGS ALARM
The Screen Contrast screen is used to change the contrast of the display.
Intensities between 0 and 100% in increments of 10 are available. Changing
the screen contrast may be necessary if the instrument is operated at extreme
temperatures.
•
In the Main Menu, choose Instrument Controls > Screen Contrast.
•
Use
and
to increment or decrement the screen contrast.
Thermo Fisher Scientific
Operation
Instrument Controls Menu
•
Press
to accept a change.
SCREEN CONTRAST:
CURRENTLY:
SET TO:
50 %
60 % ?
©ª CHANGE VALUE
SAVE VALUE
RANGE
Service Mode
AVG
DIAGS ALARM
The Service Mode screen is used to turn the service mode on or off. The
service mode locks out any remote actions and includes parameters and
functions that are useful when making adjustments or diagnosing the
Model 49i. For more information about the service mode, see “Service
Menu” later in this chapter.
Note The service mode should be turned off when finished, as it prevents
remote operation. •
In the Main Menu, choose Instrument Controls > Service Mode.
•
Press
to toggle and set the service mode on or off.
SERVICE MODE:
CURRENTLY:
SET TO:
OFF
ON ?
TOGGLE VALUE
RANGE
Date/Time
DIAGS ALARM
The Date/Time screen allows the user to view and change the system date
and time (24-hour format). The internal clock is powered by its own battery
when instrument power is off.
•
Thermo Fisher Scientific
AVG
In the Main Menu, choose Instrument Controls > Date/Time.
Model 49i Instruction Manual
3-63
Operation
Diagnostics Menu
•
Use
,
and time.
•
Press
and
to edit and save the new date and time.
DATE AND TIME:
19 MAR 2005 12:34:56
PRESS TO EDIT
RANGE
AVG
DATE AND TIME:
19 MAR 2005 12:34:56
?
SETTING: DAYS
¨ SET MONTHS
©ª CHANGE VALUE
SAVE VALUE
DIAGS ALARM
Diagnostics Menu
to move and change the value of the date
RANGE
AVG
DIAGS ALARM
The Diagnostics menu provides access to diagnostic information and
functions. This menu is useful when troubleshooting the instrument. The
analog input readings and analog input voltages are only displayed if the I/O
expansion board option is installed.
•
In the Main Menu, choose Diagnostics.
DIAGNOSTICS:
>PROGRAM VERSION
VOLTAGES
TEMPERATURES
PRESSURE
FLOWS
CELL A/B O3
INTENSITIES
RANGE
AVG
ª
DIAGS ALARM
ANALOG INPUT READINGS
ANALOG INPUT VOLTAGES
DIGITAL INPUTS
RELAY STATES
TEST ANALOG OUTPUTS
INSTRUMENT CONFIGURATION
CONTACT INFORMATION
Program Version
3-64
Model 49i Instruction Manual
The Program Version screen (read only) shows the version number of the
program installed. Prior to contacting the factory with any questions
regarding the instrument, please note the program version number.
Thermo Fisher Scientific
Operation
Diagnostics Menu
•
In the Main Menu, choose Diagnostics > Program Version.
PROGRAM VERSION:
PRODUCT:
MODEL 49i
VERSION: 01.04.02.137
FIRMWARE:
00.06.19
RANGE
Voltages
AVG
DIAGS ALARM
The Voltages menu displays the current diagnostic voltage readings. This
screen enables the power supply to be quickly read for low or fluctuating
voltages without having to use a voltage meter. The I/O board is only
displayed if the I/O expansion board option is installed.
•
In the Main Menu, choose Diagnostics > Voltages.
VOLTAGES:
>MOTHERBOARD
INTERFACE BOARD
I/O BOARD
RANGE
Motherboard Voltages
DIAGS ALARM
The Motherboard screen (read only) is used to display the current voltage
readings on the motherboard.
•
Thermo Fisher Scientific
AVG
In the Main Menu, choose Diagnostics > Voltages > Motherboard
Voltages.
Model 49i Instruction Manual
3-65
Operation
Diagnostics Menu
MOTHERBOARD VOLTAGES:
3.3 SUPPLY
3.3
5.0 SUPPLY
5.0
15.0 SUPPLY
15.0
24.0 SUPPLY
24.0
-3.3 SUPPLY
-3.3
RANGE
Interface Board Voltages
AVG
V
V
V
V
V
DIAGS ALARM
The Interface Board screen (read only) is used to display the current voltage
readings on the interface board.
•
In the Main Menu, choose Diagnostics > Voltages > Interface Board
Voltages.
INTERFACE BOARD VOLTAGES:
3.3 SUPPLY
3.3 V
5.0 SUPPLY
5.0 V
15.0 SUPPLY
15.0 V
-15.0 SUPPLY
-15.0 V
24.0 SUPPLY
24.0 V
PHOTO LAMP
9.6 V
O3 LAMP
17.2 V
RANGE
I/O Board Voltages
AVG
DIAGS ALARM
The I/O Board screen (read only) is used to display the current voltage
readings on the I/O expansion board. This menu is only displayed if the I/O
expansion board option is installed.
•
In the Main Menu, choose Diagnostics > Voltages > I/O Board
Voltages.
I/O BOARD VOLTAGES:
3.3 SUPPLY
3.3
5.0 SUPPLY
5.0
24.0 SUPPLY
24.0
-3.3 SUPPLY
-3.3
RANGE
3-66
Model 49i Instruction Manual
AVG
V
V
V
V
DIAGS ALARM
Thermo Fisher Scientific
Operation
Diagnostics Menu
Temperatures
The Temperatures screen (read only) displays the current bench
temperature, bench lamp temperature, and O3 lamp temperature (if the
ozonator option is installed).
•
In the Main Menu, choose Diagnostics > Temperatures.
TEMPERATURES:
>BENCH
BENCH LAMP
O3 LAMP
RANGE
Pressure
AVG
C
C
o
C
o
DIAGS ALARM
In the Main Menu, choose Diagnostics > Pressure.
PRESSURE:
RANGE
AVG
753.4 mmHg
DIAGS ALARM
The Flows screen (read only) displays the current flow rate through Cell A
and Cell B. These flows are measured by internal flow sensors. For more
information, see Chapter 1, “Operations”.
•
Thermo Fisher Scientific
o
The Pressure screen (read only) displays the current bench pressure. The
pressure is measured by a pressure transducer.
•
Flows
32.3
55.2
68.8
In the Main Menu, choose Diagnostics > Flows.
Model 49i Instruction Manual
3-67
Operation
Diagnostics Menu
FLOWS:
CELL A
CELL B
RANGE
Cell A/B O3
0.608 LPM
0.612 LPM
AVG
The Cell A/B O3 screen (read only) displays the current O3 concentration in
each cell, as well as the O3 reading displayed in the Run screen (the average
of the two cells).
•
In the Main Menu, choose Diagnostics > Cell A/B O3.
O3
PPB:
CELL A
CELL B
RANGE
Intensities
AVG
DIAGS ALARM
In the Main Menu, choose Diagnostics > Intensities.
INTENSITIES:
CELL A
CELL B
RANGE
Model 49i Instruction Manual
600
598
602
The Intensities screen (read only) displays the current intensity in Cell A
and Cell B in Hertz. These intensities are read by detectors A and B,
respectively.
•
3-68
DIAGS ALARM
AVG
100425 Hz
100465 Hz
DIAGS ALARM
Thermo Fisher Scientific
Operation
Diagnostics Menu
Analog Input Readings
The Analog Input Readings screen (read only) displays the 8 current
user-scaled analog readings (if the I/O expansion board option is installed).
•
In the Main Menu, choose Diagnostics > Analog Input Readings.
ANALOG INPUT READINGS:
>CO
10.2 PPM
SO2
18.2 PPB
CO2
250 PPM
FL1
20.42 LPM
WND
9.86
V
FL2
1.865 LPM
IO7
0.0
Vª
RANGE
Analog Input Voltages
AVG
DIAGS ALARM
The Analog Input Voltages screen (read only) displays the 8 raw analog
voltage readings (if the I/O expansion board option is installed).
•
In the Main Menu, choose Diagnostics > Analog Input Voltages.
ANALOG INPUT VOLTAGES:
>ANALOG IN 1
6.24
ANALOG IN 2
4.28
ANALOG IN 3
0.00
ANALOG IN 4
0.00
ANALOG IN 5
0.00
ANALOG IN 6
0.00
ANALOG IN 7
0.00
RANGE
Digital Inputs
DIAGS ALARM
The Digital Inputs screen (read only) displays the state of the 16 digital
inputs.
•
Thermo Fisher Scientific
AVG
V
V
V
V
V
V
Vª
In the Main Menu, choose Diagnostics > Digital Inputs.
Model 49i Instruction Manual
3-69
Operation
Diagnostics Menu
DIGITAL INPUTS:
>INPUT 1
INPUT 2
INPUT 3
INPUT 4
INPUT 5
INPUT 6
INPUT 7
RANGE
Relay States
AVG
DIAGS ALARM
The Relay States screen displays the state of the 10 digital outputs and
allows toggling of the state to either on (1) or off (0). The relays are restored
to their original states upon exiting this screen.
•
In the Main Menu, choose Diagnostics > Relay States.
RELAY STATE:
>OUTPUT
1
OUTPUT
2
OUTPUT
3
OUTPUT
4
OUTPUT
5
OUTPUT
6
OUTPUT
7
RANGE
Test Analog Outputs
AVG
0
0
0
1
0
0
0ª
DIAGS ALARM
The Test Analog Outputs menu contains a number of digital to analog
converter (DAC) calibration items. Channel choices include all analog
outputs, 6 voltage channels, and 6 current channels (if the I/O expansion
board option is installed).
•
In the Main Menu, choose Diagnostics > Test Analog Outputs.
TEST ANALOG OUTPUTS:
>ALL
VOLTAGE CHANNEL 1
VOLTAGE CHANNEL 2
VOLTAGE CHANNEL 3
VOLTAGE CHANNEL 4
VOLTAGE CHANNEL 5
VOLTAGE CHANNEL 6
RANGE
3-70
Model 49i Instruction Manual
1
1
1
1
1
1
1ª
AVG
ª
DIAGS ALARM
Thermo Fisher Scientific
Operation
Diagnostics Menu
Set Analog Outputs
The Set Analog Outputs screen contains three choices: Set to full-scale, set
to zero, or reset to normal. Full-scale sets the analog outputs to the full-scale
voltage, zero sets the analog outputs to 0 volts, and normal operation. The
example below shows the selected output state “ALL” is set to normal.
•
In the Main Menu, choose Diagnostics > Test Analog Outputs > ALL,
Voltage Channel 1-6, or Current Channel 1-6.
•
Press
or
•
Press
to reset to normal.
to set output.
SET ANALOG OUTPUTS:
SETTING:
ALL
OUTPUT SET TO:
NORMAL
© SET TO FULL SCALE
ª SET TO ZERO
§ RESET TO NORMAL
RANGE
Instrument Configuration
AVG
DIAGS ALARM
The Instrument Configuration screen displays information on the hardware
configuration of the instrument.
Note If the analyzer is in service mode, pressing
toggle it yes or no. on the item will
•
In the Main Menu, choose Diagnostics > Instrument Configuration.
•
Press
to toggle instrument configuration (in service mode only).
INSTRUMENT CONFIGURATION:
>I/O EXPANSION BOARD YES
SAMPLE/CAL VALVE
YES
OZONATOR
YES
DILUTION RATIO
NO
AUTO CALIBRATION
NO
RANGE
Thermo Fisher Scientific
AVG
DIAGS ALARM
Model 49i Instruction Manual
3-71
Operation
Alarms Menu
Contact Information
The Contact Information screen displays the customer service information.
•
In the Main Menu, choose Diagnostics > Contact Information.
CONTACT INFORMATION:
CALL CENTER: 508-520-0430
WEB:
RANGE
Alarms Menu
WWW.THERMO.COM
AVG
DIAGS ALARM
The alarms menu displays a list of items that are monitored by the analyzer.
If the item being monitored goes outside the lower or upper limit, the status
of that item will go from “OK” to either “LOW” or “HIGH”, respectively.
If the alarm is not a level alarm, the status will go from “OK” to “FAIL”.
The number of alarms detected is displayed to indicate how many alarms
have occurred. If no alarms are detected, the number zero is displayed.
To see the actual reading of an item and its minimum and maximum limits,
move the cursor to the item and press
.
Items displayed are determined by the options installed. The zero or span
check is visible only if the zero/span check or auto calibration options are
enabled. The O3 lamp temperature and ozonator level 1, 2, 3, 4, and 5
checks are visible only if the ozonator option is installed. The motherboard
status, interface board status, and I/O expansion board status (if installed)
indicates that the power supplies are working and connections are
successful. There are no setting screens for these alarms.
•
3-72
Model 49i Instruction Manual
In the Main Menu, choose Alarms.
Thermo Fisher Scientific
Operation
Alarms Menu
ALARMS:
ALARMS DETECTED
>O3 LAMP TEMP
LAMP TEMP
BENCH TEMP
PRESSURE
FLOW A
FLOW B
RANGE
AVG
DIAGS ALARM
INTENSITY A
INTENSITY B
ZERO CHECK
SPAN CHECK
ZERO AUTOCAL
SPAN AUTOCAL
OZ LEVEL 1 CHECK
OZ LEVEL 2 CHECK
OZ LEVEL 3 CHECK
OZ LEVEL 4 CHECK
OZ LEVEL 5 CHECK
O3 CONCENTRATION
MOTHERBOARD STATUS
INTERFACE STATUS
I/O EXP STATUS
O3 Lamp Temperature
OK
OK
OK
OK
OK
OK
OK
OK
OK
OK
OK
OK
OK
OK
OK
The O3 Lamp Temperature screen (if the ozonator option is installed)
displays the current ozonator lamp temperature and sets the minimum and
maximum alarm limits. Acceptable alarm limits range from 65 to 75 °C. If
the O3 lamp temperature reading goes beyond either the minimum or
maximum alarm limit, an alarm is activated. The word “ALARM” appears
in the Run screen and in the Main Menu.
•
In the Main Menu, choose Alarms > O3 Lamp Temp.
O3 LAMP TEMPERATURE:
ACTUAL
68.8
>MIN
60.0
MAX
80.0
RANGE
Thermo Fisher Scientific
0
OK
OK
OK
OK
OK
OKª
AVG
o
C
C
o
C
o
DIAGS ALARM
Model 49i Instruction Manual
3-73
Operation
Alarms Menu
Min and Max O3 Lamp
Temperature Limits
The Minimum O3 Lamp Temperature alarm limit screen is used to change
the minimum O3 Lamp temperature alarm limit. The minimum and
maximum O3 Lamp temperature screens function the same way.
•
In the Main Menu, choose Alarms > O3 Lamp Temp > Min or Max.
•
Use
•
Press
and
to increment or decrement the numeric value.
to save set to value as actual value.
O3 LAMP TEMPERATURE:
ACTUAL MIN:
60.0
SET MIN TO:
65.0
o
C
C ?
o
©ª INC/DEC
SAVE VALUE
RANGE
Lamp Temperature
AVG
DIAGS ALARM
The Lamp Temperature screen displays the current lamp temperature and
sets the minimum and maximum alarm limits. Acceptable alarm limits
range from 50 to 60 °C. If the lamp temperature reading goes beyond either
the minimum or maximum limit, an alarm is activated. The word
“ALARM” appears in the Run screen and in the Main Menu.
•
In the Main Menu, choose Alarms > Lamp Temp.
LAMP TEMPERATURE:
ACTUAL
55.2
>MIN
50.0
MAX
60.0
RANGE
Min and Max Lamp Temperature
Limits
Model 49i Instruction Manual
C
C
o
C
o
DIAGS ALARM
The Minimum Lamp Temperature alarm limit screen is used to change the
minimum lamp temperature alarm limit. The minimum and maximum
lamp temperature screens function the same way.
•
3-74
AVG
o
In the Main Menu, choose Alarms > Lamp Temp > Min or Max.
Thermo Fisher Scientific
Operation
Alarms Menu
•
Use
•
Press
and
to increment or decrement the numeric value.
to save set to value as actual value.
LAMP TEMPERATURE:
ACTUAL MIN:
50.0
SET MIN TO:
52.0
o
C
C ?
o
©ª INC/DEC
SAVE VALUE
RANGE
Bench Temperature
AVG
DIAGS ALARM
The Bench Temperature screen displays the current bench temperature and
sets the minimum and maximum alarm limits. Acceptable alarm limits
range from 5 to 50 °C. If the bench temperature reading goes beyond either
the minimum or maximum limit, an alarm is activated. The word
“ALARM” appears in the Run screen and in the Main Menu.
•
In the Main Menu, choose Alarms > Bench Temp.
BENCH TEMPERATURE:
ACTUAL
32.3
>MIN
15.0
MAX
40.0
RANGE
Min and Max Bench Temperature
Limits
Thermo Fisher Scientific
AVG
o
C
C
o
C
o
DIAGS ALARM
The Minimum Bench Temperature alarm limit screen is used to change the
minimum bench temperature alarm limit. The minimum and maximum
bench temperature screens function the same way.
•
In the Main Menu, choose Alarms > Bench Temp > Min or Max.
•
Use
•
Press
and
to increment or decrement the numeric value.
to save set to value as actual value.
Model 49i Instruction Manual
3-75
Operation
Alarms Menu
BENCH TEMPERATURE:
ACTUAL MIN:
15.0
SET MIN TO:
16.0
o
C
C ?
o
©ª INC/DEC
SAVE VALUE
RANGE
Pressure
AVG
The Pressure screen displays the current pressure and sets the minimum and
maximum alarm limits. Acceptable alarm limits range from 200 to 1,000
mmHg. If the pressure reading goes beyond either the minimum or
maximum limit, an alarm is activated. The word “ALARM” appears in the
Run screen and in the Main Menu.
•
In the Main Menu, choose Alarms > Pressure.
PRESSURE:
ACTUAL
>MIN
MAX
RANGE
Min and Max Pressure Limits
3-76
Model 49i Instruction Manual
DIAGS ALARM
AVG
753.4 mmHg
200.0 mmHg
1000.0 mmHg
DIAGS ALARM
The Minimum Pressure alarm limit screen is used to change the minimum
pressure alarm limit. The minimum and maximum pressure screens
function the same way.
•
In the Main Menu, choose Alarms > Pressure > Min or Max.
•
Use
•
Press
and
to increment or decrement the numeric value.
to save set to value as actual value.
Thermo Fisher Scientific
Operation
Alarms Menu
PRESSURE:
ACTUAL MIN:
SET MIN TO:
200.0 mmHg
250.0 mmHg ?
©ª INC/DEC
SAVE VALUE
RANGE
Flow A and B
AVG
The Flow A screen displays the current sample flow reading in cell A and
sets the minimum and maximum alarm limits. Acceptable alarm limits
range from 0.4 to 1.6 LPM. If the pressure reading goes beyond either the
minimum or maximum limit, an alarm is activated. The word “ALARM”
appears in the Run screen and in the Main Menu. The Flow B screen
functions the same way.
•
In the Main Menu, choose Alarms > Flow A or Flow B.
FLOW A:
ACTUAL
>MIN
MAX
RANGE
Min and Max Flow Limits
Thermo Fisher Scientific
DIAGS ALARM
0.608 LPM
0.400 LPM
1.400 LPM
AVG
DIAGS ALARM
The Minimum Flow A alarm limit screen is used to change the minimum
flow A alarm limit. The minimum and maximum flow A and flow B screens
function the same way.
•
In the Main Menu, choose Alarms > Select Flow > Min or Max.
•
Use
•
Press
and
to increment or decrement the numeric value.
to save set to value as actual value.
Model 49i Instruction Manual
3-77
Operation
Alarms Menu
FLOW A:
ACTUAL MIN:
SET MIN TO:
0.400 LPM
0.500 LPM ?
©ª INC/DEC
SAVE VALUE
RANGE
Intensity A and B
AVG
The Intensity A screen displays the current lamp intensity reading in Cell A
and sets the minimum and maximum alarm limits. Acceptable alarm limits
range from 45,000 to 150,000 Hertz. If the intensity A reading goes beyond
either the minimum or maximum limit, an alarm is activated. The word
“ALARM” appears in the Run screen and in the Main Menu.
•
In the Main Menu, choose Alarms > Intensity A or Intensity B.
INTENSITY A:
ACTUAL
>MIN
MAX
RANGE
Min and Max Intensity Limits
3-78
Model 49i Instruction Manual
DIAGS ALARM
AVG
98425 Hz
45000 Hz
150000 Hz
DIAGS ALARM
The Minimum Intensity A alarm limit screen is used to change the
minimum intensity A alarm limit. The minimum and maximum intensity A
and intensity B screens function the same way.
•
In the Main Menu, choose Alarms > Select Intensity > Min or Max.
•
Use
•
Press
and
to increment or decrement the numeric value.
to save set to value as actual value.
Thermo Fisher Scientific
Operation
Alarms Menu
INTENSITY A:
ACTUAL MIN:
SET MIN TO:
45000 HZ
55000 HZ ?
©ª INC/DEC
SAVE VALUE
RANGE
Zero and Span Check
AVG
The Zero Span Check screen allows the user to view the status of the most
recent zero check and set the maximum zero check offset. The zero and
span check screens are visible only if the zero/span check option is enabled
and function the same way.
•
In the Main Menu, choose Alarms > Zero or Span Check.
ZERO CHECK:
ALARM:
RESPONSE:
>MAX OFFSET:
RANGE
Max Zero and Span Offset
Thermo Fisher Scientific
DIAGS ALARM
AVG
OK
0.0
10.0
DIAGS ALARM
The Max Zero Check Offset screen is used to change the maximum zero
check offset. The maximum zero and span offset screens function the same
way.
•
In the Main Menu, choose Alarms > Zero or Span Check > Max Offset.
•
Use
and
to move the cursor left or right.
•
Use
and
to increment or decrement the numeric value.
•
Press
to save set to value as actual value.
Model 49i Instruction Manual
3-79
Operation
Alarms Menu
MAX ZERO CHECK OFFSET:
CURRENTLY:
10.0
SET TO:
000011.0 ?
§¨ MOVE CURSOR
©ª CHANGE VALUE
SAVE
RANGE
Zero and Span Auto
Calibration
AVG
DIAGS ALARM
The Zero Auto Calibration screen (read only) allow the user to view the
status of the most recent auto background calibration. The zero and span
auto calibration screens are visible only if the auto calibration option is
enabled and function the same way.
•
In the Main Menu, choose Alarms > Zero or Span Autocal.
ZERO AUTO CALIBRATION:
ALARM:
OK
RESPONSE:
5.0
RANGE
Ozonator Level 1-5 Check
Model 49i Instruction Manual
DIAGS ALARM
The Ozonator Level 1 Check screen allows the user to view the status of the
most recent ozonator level 1 check and set the maximum check offset. The
ozonator level 1, 2, 3, 4 and 5 check screens are visible only if the ozonator
option is enabled and function the same way.
•
3-80
AVG
In the Main Menu, choose Alarms > Oz Level 1, 2, 3, 4 or 5 Check.
Thermo Fisher Scientific
Operation
Alarms Menu
OZ LEVEL 1 CHECK:
ALARM:
LVL 1 CONC:
RESPONSE:
>MAX OFFSET:
RANGE
Max Ozonator Level 1-5 Offset
AVG
OK
0.0
0.0
10.0
DIAGS ALARM
The Ozonator Level 1 Check Offset screen is used to change the maximum
check offset. The maximum ozonator level 1, 2, 3, 4 and 5 offset screens
function the same way.
•
In the Main Menu, choose Alarms > Select Oz Level > Max Offset.
•
Use
and
to move the cursor left or right.
•
Use
and
to increment or decrement the numeric value.
•
Press
to save set to value as actual value.
LEVEL 1 CHECK OFFSET:
CURRENTLY:
10.0
SET TO:
000011.0 ?
§¨ MOVE CURSOR
©ª CHANGE VALUE
SAVE
RANGE
O3 Concentration
DIAGS ALARM
The O3 Concentration screen displays the current O3 concentration and
sets the minimum and maximum alarm limits. Acceptable alarm limits
range from 0 to 200,000 ppb. The minimum alarm may be programmed as
a floor trigger (alarm is triggered when the concentration falls below the
minimum value) or a ceiling trigger (alarm is triggered when the
concentration goes above the minimum value). If the O3 concentration
goes beyond either the minimum or maximum limit, an alarm is activated.
The word “ALARM” appears in the Run screen and in the Main Menu.
•
Thermo Fisher Scientific
AVG
In the Main Menu, choose Alarms > O3 Concentration.
Model 49i Instruction Manual
3-81
Operation
Alarms Menu
O3 CONCENTRATION:
ACTUAL
600
>MIN
0.0
MAX
200000
MIN TRIGGER
CEILING
RANGE
Min and Max O3 Concentration
Limits
AVG
DIAGS ALARM
The Minimum O3 Concentration alarm limit screen is used to change the
minimum O3 concentration alarm limit. The minimum and maximum O3
concentration alarm limit screens function the same way.
•
In the Main Menu, choose Alarms > O3 Concentration > Min or Max.
•
Use
and
to move the cursor left or right.
•
Use
and
to increment or decrement the numeric value.
•
Press
to save set to value as actual value.
O3 CONCENTRATION:
ACTUAL MIN:
0.0
SET MIN TO:
000020.0 ?
§¨ MOVE CURSOR
©ª INC/DEC
SAVE VALUE
RANGE
Min Trigger
3-82
Model 49i Instruction Manual
AVG
DIAGS ALARM
The Minimum Trigger screen allows the user to view and set the O3
concentration alarm trigger type to either floor or ceiling. The minimum
alarm may be programmed as a floor trigger (alarm is triggered when the
concentration falls below the minimum value) or a ceiling trigger (alarm is
triggered when the concentration goes above the minimum value).
•
In the Main Menu, choose Alarms > O3 Concentration > MinTrigger.
•
Press
to toggle and save the minimum trigger to floor or ceiling.
Thermo Fisher Scientific
Operation
Service Menu
MIN TRIG(CEILING/FLOOR):
ACTUAL TRIGGER: CEILING
SET TRIGGER TO:
FLOOR ?
TOGGLE AND SAVE VALUE
RANGE
Service Menu
AVG
DIAGS ALARM
The Service menu appears only when the instrument is in the service mode.
To put the instrument into service mode:
•
In the Main Menu, choose Instrument Controls > Service Mode.
Advanced diagnostic functions are included in the service mode.
Meaningful data should not be collected when the instrument is in the
service mode.
•
In the Main Menu, choose Service.
SERVICE:
>PRESSURE CHECK
LAMP SETTING
DETECTOR CALIBRATION
INTENSITY CHECK
RANGE MODE SELECT
PRESSURE CALIBRATION
FLOW A CALIBRATION
RANGE
AVG
ª
DIAGS ALARM
FLOW B CALIBRATION
TEMPERATURE CALIBRATION
ANALOG OUT CALIBRATION
ANALOG INPUT CALIBRATION
DILUTION RATIO
DISPLAY PIXEL TEST
RESTORE USER DEFAULTS
Pressure Check
Thermo Fisher Scientific
The Pressure Check menu is used to manually control the flow of reference
or sample gas through Cell B. This enables the pressure reading of Cell B,
with either sample or reference gas, to be determined. Pump pressure is used
to test the pump. Selecting any of these menu items will disturb the analog
outputs.
Model 49i Instruction Manual
3-83
Operation
Service Menu
•
In the Main Menu, choose Service > Pressure Check.
PRESSURE CHECK:
>SAMPLE PRESSURE
REFERENCE PRESSURE
PUMP PRESSURE
RANGE
Sample Pressure
AVG
DIAGS ALARM
The Sample Pressure screen (read only) displays the pressure of the sample
gas in Cell B.
•
In the Main Menu, choose Service > Pressure Check > Sample Pressure.
SAMPLE PRESSURE:
753.4 mmHg
RANGE
Reference Pressure
AVG
DIAGS ALARM
The Reference Pressure screen (read only) displays the pressure of the
reference gas in Cell B.
•
In the Main Menu, choose Service > Pressure Check > Reference
Pressure.
REFERENCE PRESSURE:
753.4 mmHg
RANGE
3-84
Model 49i Instruction Manual
AVG
DIAGS ALARM
Thermo Fisher Scientific
Operation
Service Menu
Pump Pressure
The Pump Pressure screen (read only) is used to test the pump. The
solenoids are energized such that there is no flow in Cell B. The flow rate
for Cell B drops to zero and the pressure reading should drop below 390
mmHg in less than 20 seconds. This indicates the effectiveness of the
internal pump. After 20 seconds, if the pressure is greater than 390 mmHg
or the flow is greater than 0.010 LPM, the words “PUMP PROBLEM
DETECTED” appears. After 20 seconds, if the pressure is less than 390
mmHg and the flow is less than 0.010 LPM, the words “PUMP OK”
appears.
•
In the Main Menu, choose Service > Pressure Check > Pump Pressure.
PUMP PRESSURE: 753.4 mmHg
0.010 LPM
TESTING, WAIT 20 SECS
RANGE
Lamp Setting
AVG
DIAGS ALARM
The Lamp Setting screen is used to adjust the detector intensities. The
display shows the intensities of Cell A and Cell B. The next line of the
display shows the current lamp setting. Adjust the lamp setting until the
intensities are about 100 kHz.
Note This adjustment should only be performed by an instrument service
technician. Thermo Fisher Scientific
•
In the Main Menu, choose Service > Lamp Setting.
•
Use
•
Press
and
to increment or decrement the numeric value.
to save the new lamp setting.
Model 49i Instruction Manual
3-85
Operation
Service Menu
BENCH
CELL
CELL
LAMP
LAMP SETTING:
A INT:
98425 Hz
B INT:
97465 Hz
SETTING:
72.9 %
©ª INC/DEC
SAVE VALUE
RANGE
Detector Calibration
AVG
DIAGS ALARM
The Detector Calibration screen is used to set the calibration factors for
detector A and detector B. Calibration factors are computed so that both
detectors read 100,000 Hz on zero air. If either detector reads lower than
75,000 Hz or higher than 125,000 Hz, this calibration will not be
successful. It is crucial that the lamp intensity be set such that both detector
intensities fall inside this range before performing this calibration.
Note This adjustment should only be performed by an instrument service
technician. •
In the Main Menu, choose Service > Detector Calibration.
DETECTOR CALIBRAITON:
CELL A RAW INT: 76988 HZ
CELL B RAW INT: 67079 HZ
CELL A FACTOR: 1.000
CELL B FACTOR: 1.000
CALC/SAVE NEW RECORDS
RANGE
Intensity Check
Model 49i Instruction Manual
DIAGS ALARM
The Intensity Check menu is used to manually control the flow of reference
or sample gas through either Cell A or Cell B. This enables the intensity and
noise reading of each detector to be determined with either reference or
sample gas flow. Selecting any of these menu items will disturb the analog
outputs.
•
3-86
AVG
In the Main Menu, choose Service > Intensity Check.
Thermo Fisher Scientific
Operation
Service Menu
INTENSITY CHECK:
>INT A REFERENCE GAS
INT A SAMPLE GAS
INT B REFERENCE GAS
INT B SAMPLE GAS
RANGE
Intensity A/B Check
AVG
DIAGS ALARM
The Intensity A Reference Gas screen (read only) switches the solenoid
valves so that reference gas is flowing through Cell A. The intensity and
noise reading are displayed. The Intensity B Reference Gas screen functions
the same way. Also, the Intensity A and Intensity B Sample Gas screens
function the same way (only with sample gas instead of reference gas).
•
In the Main Menu, choose Service > Intensity Check > Int A or B Ref
or Sample.
CELL A REFERENCE GAS:
INTENSITY:
98425. Hz
NOISE:
1.4
RANGE
Range Mode Select
Thermo Fisher Scientific
AVG
DIAGS ALARM
The Range Mode Select screen is used to switch between the various range
modes: single, dual, and auto range.
•
In the Main Menu, choose Service > Range Mode Select.
•
Use
•
Press
and
to scroll through a list of choices.
to save the new range mode.
Model 49i Instruction Manual
3-87
Operation
Service Menu
SINGLE/DUAL/AUTO RANGE:
CURRENTLY:
SINGLE
SET TO:
DUAL ?
©ª CHANGE VALUE
SAVE VALUE
RANGE
Pressure Calibration
AVG
DIAGS ALARM
The Pressure Calibration menu is used to calibrate the pressure sensor to
zero, span, or restore factory default values. The pressure calibration is
visible only when the instrument is in service mode. For more information
on the service mode, see “Service Mode” earlier in this chapter.
The pressure sensor’s zero counts and span slope are displayed on the menu.
Note This adjustment should only be performed by an instrument service
technician. •
In the Main Menu, choose Service > Pressure Calibration.
PRESSURE SENSOR CAL:
>ZERO
72
SPAN
1.1447
SET DEFAULTS
RANGE
Calibrate Pressure Zero
AVG
DIAGS ALARM
The Calibrate Pressure Zero screen calibrates the pressure sensor at zero
pressure.
Note A vacuum pump must be connected to the pressure sensor before
performing the zero calibration. 3-88
Model 49i Instruction Manual
•
In the Main Menu, choose Service > Pressure Calibration > Zero.
•
Press
to save the current pressure reading as the zero reading.
Thermo Fisher Scientific
Operation
Service Menu
CALIBRATE PRESSURE ZERO:
CURRENTLY:
753.4 mmHg
SET TO:
0.0 mmHg ?
CONNECT VACUUM PUMP AND
SAVE ZERO PRESSURE
RANGE
Calibrate Pressure Span
AVG
DIAGS ALARM
The Calibrate Pressure Span screen allows the user to view and set the
pressure sensor calibration span point.
Note The plumbing going to the pressure sensor should be disconnected so
the sensor is reading ambient pressure before performing the span
calibration. The operator should use an independent barometer to measure
the ambient pressure and enter the value on this screen before calibrating. •
In the Main Menu, choose Service > Pressure Calibration > Span.
•
Use
•
Press
,
,
and
to move and change the value.
to save set to value as actual value.
CALIBRATE PRESSURE SPAN:
CURRENTLY:
753.4 mmHg
SET TO:
760.0 mmHg ?
§¨ MOVE CURSOR
©ª CHANGE VALUE
SAVE
RANGE
Restore Default Pressure
Calibration
Thermo Fisher Scientific
AVG
DIAGS ALARM
The Restore Default Pressure Calibration screen allows the user to reset the
pressure calibration configuration values to factory defaults.
•
In the Main Menu, choose Service > Pressure Calibration > Set
Defaults.
•
Press
to warn user and enable restore with
.
Model 49i Instruction Manual
3-89
Operation
Service Menu
•
Use
to overwrite pressure sensor calibration parameters with
factory default values when pressed after
.
RESTORE DEFAULT CAL:
RESTORE DEFAULT CAL:
RESTORE
RANGE
AVG
RESTORE
ARE YOU SURE YOU WANT TO?x
PRESS ¨ TO CONFIRM RESTORE
DIAGS ALARM
Flow A and B Calibration
RANGE
AVG
DIAGS ALARM
The Flow A Calibration menu is used to calibrate the flow A sensor to zero,
span, or restore factory default values. The flow A calibration is visible only
when the instrument is in service mode. For more information on the
service mode, see “Service Mode” earlier in the chapter. The Flow B
Calibration menu functions the same way.
Note This adjustment should only be performed by an instrument service
technician. •
In the Main Menu, choose Service > Flow Calibration A or B.
FLOW SENSOR CAL:
>ZERO
SPAN
SET DEFAULTS
RANGE
Calibrate Flow Zero
AVG
200
1.0000
DIAGS ALARM
The Calibrate Flow A Zero screen calibrates the flow sensor at zero flow.
The Calibrate Flow B Zero screen functions the same way.
Note The pump must be disconnected before performing the zero
calibration. 3-90
Model 49i Instruction Manual
Thermo Fisher Scientific
Operation
Service Menu
•
In the Main Menu, choose Service > Select Flow Calibration A or B >
Zero.
•
Press
to save the current flow reading as the zero reading.
CALIBRATE FLOW A ZERO:
CURRENTLY:
0.608 LPM
SET TO:
0.000 LPM ?
DISCONNECT PUMP AND
SAVE ZERO PRESSURE
RANGE
Calibrate Flow Span
AVG
DIAGS ALARM
The Calibrate Flow A Span screen allows the user to view and set the flow
sensor calibrate span point. The calibrate Flow B Span screen functions the
same way.
Note An independent flow sensor is required to read the flow, then the
operator enters the flow value on this screen to perform the calibration. •
In the Main Menu, choose Service > Select Flow Calibration A or B >
Span.
•
Use
•
Press
,
,
and
to move and change the value.
to save set to value as actual value.
CALIBRATE FLOW A SPAN:
CURRENTLY:
0.608 LPM
SET TO:
0.800 LPM ?
§¨ MOVE CURSOR
©ª CHANGE VALUE
SAVE
RANGE
Restore Default Flow Calibration
Thermo Fisher Scientific
AVG
DIAGS ALARM
The Restore Default Flow Calibration A screen allows the user to reset the
flow calibration configuration values to factory defaults. The Restore
Default Calibration B screen functions the same way.
Model 49i Instruction Manual
3-91
Operation
Service Menu
•
In the Main Menu, choose Service > Select Flow Calibration A or B >
Set Defaults.
•
Press
•
Use
to overwrite pressure sensor calibration parameters with
factory default values when pressed after
.
to warn user and enable restore with
RESTORE DEFAULT CAL A:
RESTORE DEFAULT CAL A:
RESTORE
RANGE
AVG
RESTORE
ARE YOU SURE YOU WANT TO?x
PRESS ¨ TO CONFIRM RESTORE
DIAGS ALARM
Temperature Calibration
.
RANGE
AVG
DIAGS ALARM
The Temperature calibration screen allows the user to view and set the
ambient temperature sensor calibration. The temperature calibration is
visible only when the instrument is in service mode. For more information
on the service mode, see “Service Mode” earlier in the chapter.
Note This adjustment should only be performed by an instrument service
technician. •
In the Main Menu, choose Service > Temperature Calibration.
•
Use
•
Press
,
,
and
to move and change the value.
to save set to value as actual value.
CALIBRATE AMBIENT TEMP:
CURRENTLY:
32.3 oC
SET TO:
030.0 oC
§¨ MOVE CURSOR
©ª CHANGE VALUE
SAVE
RANGE
3-92
Model 49i Instruction Manual
AVG
DIAGS ALARM
Thermo Fisher Scientific
Operation
Service Menu
Analog Output Calibration
The Analog Output Calibration menu is a selection of 6 voltage channels
and 6 current channels (if I/O expansion board option is installed) to
calibrate, and allows the user to select the calibration action zero or span.
The analog output calibration is visible only when the instrument is in
service mode. For more information on the service mode, see “Service
Mode” earlier in the chapter.
Note This adjustment should only be performed by an instrument service
technician. •
In the Main Menu, choose Service > Analog Out Calibration.
ANALOG OUTPUT CAL:
>VOLTAGE CHANNEL 1
VOLTAGE CHANNEL 2
VOLTAGE CHANNEL 3
VOLTAGE CHANNEL 4
VOLTAGE CHANNEL 5
VOLTAGE CHANNEL 6
CURRENT CHANNEL 1
RANGE
AVG
ª
DIAGS ALARM
ANALOG OUTPUT CAL:
>CALIBRATE ZERO
CALIBRATE FULL SCALE
RANGE
Analog Output Calibrate Zero
Thermo Fisher Scientific
AVG
DIAGS ALARM
The Analog Output Calibrate Zero screen allows the user to calibrate the
zero state of the selected analog output. The operator must connect a meter
to the output and adjust the output until it reads 0.0 V on the meter.
•
In the Main Menu, choose Service > Analog Out Calibration > Select
Channel > Calibrate Zero.
•
Use the
value.
•
Press
and
to increment or decrement the numeric
to save the value.
Model 49i Instruction Manual
3-93
Operation
Service Menu
ANALOG OUTPUT CAL:
ZERO
CONNECT METER TO OUTPUT!
SELECTED OUTPUT:
V1
SET TO:
100
SAVE VALUE
©ª INC/DEC
SET OUTPUT TO:
0.0 V
RANGE
Analog Output Calibrate
Full-Scale
AVG
DIAGS ALARM
The Analog Output Calibrate Full-Scale screen allows the user to calibrate
the full-scale state of the selected analog output. The operator must connect
a meter to the output and adjust output until it reads the value shown in the
set output to: field.
•
In the Main Menu, choose Service > Analog Out Calibration > Select
Channel > Calibrate Full Scale.
•
Use the
value.
•
Press
and
to increment or decrement the numeric
to save the value.
ANALOG OUTPUT CAL:
SPAN
CONNECT METER TO OUTPUT!
SELECTED OUTPUT:
V1
SET TO:
3697
SAVE VALUE
©ª INC/DEC
SET OUTPUT TO:
10 V
RANGE
Analog Input Calibration
AVG
DIAGS ALARM
The Analog Input Calibration menu is a selection of 8 analog inputs (if the
I/O expansion board option is installed) to calibrate, and allows the user to
select the calibration action zero or span. The analog input calibration is
visible only when the instrument is in service mode. For more information
on the service mode, see “Service Mode” earlier in the chapter.
Note This adjustment should only be performed by an instrument service
technician. •
3-94
Model 49i Instruction Manual
In the Main Menu, choose Service > Analog Input Calibration.
Thermo Fisher Scientific
Operation
Service Menu
ANALOG
>INPUT
INPUT
INPUT
INPUT
INPUT
INPUT
INPUT
RANGE
INPUT CAL:
CHANNEL 1
CHANNEL 2
CHANNEL 3
CHANNEL 4
CHANNEL 5
CHANNEL 6
CHANNEL 7
AVG
ª
DIAGS ALARM
ANALOG INPUT CAL:
>CALIBRATE ZERO
CALIBRATE FULL SCALE
RANGE
Analog Input Calibrate Zero
AVG
DIAGS ALARM
The Analog Input Calibrate Zero screen allows the user to calibrate the zero
state of the selected analog input.
In the Main Menu, choose Service > Analog Input Calibration > Select
Channel > Calibrate Zero. (Hook up a voltage source of 0 V to the analog
input channel.)
•
Press
to save the value.
ANALOG INPUT CAL:
ZERO
DISCONNECT SELECTED INPUT!
SELECTED INPUT:
INPUT 1
CURRENTLY:
6.24 V ?
CALIBRATE INPUT TO ZERO
RANGE
Analog Input Calibrate Full-Scale
Thermo Fisher Scientific
AVG
DIAGS ALARM
The Analog Input Calibration Full-Scale screen allows the user to calibrate
the full-scale state of the selected analog input.
Model 49i Instruction Manual
3-95
Operation
Service Menu
•
In the Main Menu, choose Service > Analog Input Calibration > Select
Channel > Calibrate Full Scale. (Hook up a voltage source of 10 V to
the analog input channel.)
•
Use the
value.
•
Press
and
to increment or decrement the numeric
to save the value.
ANALOG INPUT CAL:
SPAN
PROVIDE VOLTAGE TO INPUT!
SELECTED INPUT:
INPUT 1
CURRENTLY:
6.24 V
SET TO:
10.00 V ?
CALIBRATE TO VALUE
RANGE
Dilution Ratio
AVG
DIAGS ALARM
The Dilution Ratio screen allows the user to view and set the dilution ratio.
Acceptable values are 1–500: 1. The default is 1:1. When this value is set,
the dilution ratio is applied to all concentration measurements. This screen
is only accessible if the dilution ratio option is installed.
•
In the Main Menu, choose Service > Dilution Ratio.
•
Use
•
Press
,
,
and
to move and change the value.
to save set to value as actual value.
DILUTION RATIO:
CURRENTLY:
001.0 :1
SET TO :
002.0 :1 ?
§¨ MOVE CURSOR
©ª CHANGE VALUE
Ü SAVE
RANGE
Display Pixel Test
3-96
Model 49i Instruction Manual
AVG
DIAGS ALARM
The Display Pixel Test is used to test the LCD display. The display pixel test
is visible only when the instrument is in service mode. For more
information on the service mode, see “Service Mode” earlier in the chapter.
Thermo Fisher Scientific
Operation
Password Menu
•
In the Main Menu, choose Service > Display Pixel Test.
•
Press
on or off.
to begin test by turning all pixels on, then toggle between
DISPLAY PIXEL TEST:
DURING TEST PRESS OR fXX
TO EXIT, TO TOGGLEXXXXXX
BEGIN TEST
GO BACK TO MENU
RANGE
Restore User Defaults
•
In the Main Menu, choose Service > Restore User Defaults.
•
Press
to warn and enable restore with
•
Press
to overwrite all user settings with factory default values.
RESTORE
AVG
DIAGS ALARM
Password Menu
.
RESTORE USER DEFAULTS:
RESTORE
ARE YOU SURE YOU WANT TO?x
PRESS ¨ TO CONFIRM RESTORE
RANGE
AVG
DIAGS ALARM
The Password menu allows the user to configure password protection. If the
instrument is locked, none of the settings may be changed via the front
panel user interface. The items visible under the password menu are
determined by the instrument’s password status.
•
Thermo Fisher Scientific
DIAGS ALARM
The Restore User Defaults screen is used to reset the user calibration and
configuration values to factory defaults. The restore default user is visible
only when the instrument is in service mode. For more information on the
service mode, see “Service Mode” earlier in the chapter.
RESTORE USER DEFAULTS:
RANGE
AVG
In the Main Menu, choose Password.
Model 49i Instruction Manual
3-97
Operation
Password Menu
PASSWORD MENU:
>SET PASSWORD
LOCK INSTRUMENT
CHANGE PASSWORD
REMOVE PASSWORD
UNLOCK INSTRUMENT
RANGE
Set Password
AVG
DIAGS ALARM
The Set Password screen is used to set the password to unlock the front
panel. The set password is shown if the instrument is unlocked and the
password not set.
•
In the Main Menu, choose Password > Set Password.
•
Press
to enter password and disable instrument lock.
ENTER NEW PASSWORD:
ASSSSSSSSS
ABCDEFGHIJKLMN
OPQRSTUVWXYZ
0123456789 ./RANGE
Lock Instrument
3-98
Model 49i Instruction Manual
AVG
BKSP
PAGE
SAVE
DIAGS ALARM
The Lock Instrument screen is used to lock the instrument’s front panel so
users can not change any settings from the front panel. The lock instrument
is shown if the instrument is unlocked and the password set.
•
In the Main Menu, choose Password > Lock Instrument.
•
Press
to enable instrument lock and returns to main menu.
Thermo Fisher Scientific
Operation
Password Menu
LOCK FRONT PANEL:
xxxPRESSING ENTER WILLxxxx
PREVENT USER FROM CHANGING
xCONFIG FROM FRONT PANELxx
LOCK AND RETURN TO RUN
RANGE
Change Password
AVG
DIAGS ALARM
The Change Password is used to change the password used to unlock the
instrument’s front panel. The change password is shown if the instrument is
unlocked.
•
In the Main Menu, choose Password > Change Password.
•
Press
to change password.
ENTER NEW PASSWORD:
ASSSSSSSSS
ABCDEFGHIJKLMN
OPQRSTUVWXYZ
0123456789 ./RANGE
Remove Password
Thermo Fisher Scientific
AVG
BKSP
PAGE
SAVE
DIAGS ALARM
The Remove Password screen is used to erase the current password and
disable password protection. The remove password is shown if the
instrument is unlocked and the password set.
•
In the Main Menu, choose Password > Remove Password.
•
Press
to remove password and returns to main menu.
Model 49i Instruction Manual
3-99
Operation
Password Menu
REMOVE PASSWORD:
xxxPRESSING ENTER WILLxxxx
xREMOVE CURRENT PASSWORDxx
xxxAND DISABLE LOCKINGxxxx
REMOVE PASSWORD
RANGE
Unlock Instrument
AVG
DIAGS ALARM
The Unlock Instrument screen is used to enter the password to unlock the
front panel. The Unlock Instrument is shown if the instrument is locked.
•
In the Main Menu, choose Password > Unlock Instrument.
•
Press
to disable instrument lock and returns to main menu.
ENTER THE PASSWORD:
ASSSSSSSSS
ABCDEFGHIJKLMN
OPQRSTUVWXYZ
0123456789 ./RANGE
3-100
Model 49i Instruction Manual
AVG
BKSP
PAGE
SAVE
DIAGS ALARM
Thermo Fisher Scientific
Chapter 4
Calibration
This chapter describes how to perform a multipoint calibration of the
photometric ozone analyzer. It is based upon the current EPA approved
procedure using a UV photometer as a calibration standard. The
information described here should be adequate to perform the calibration.
However, for more information refer to the Code of Federal Regulations
(Title 40, Part 50, Appendix D) and the EPA's “Technical Assistance
Document for the Calibration of Ambient Ozone Monitors.”
This chapter includes the following sections:
Equipment Required
Zero Air Generator
Thermo Fisher Scientific
•
“Equipment Required” on page 4-1
•
“Instrument Preparation” on page 4-3
•
“Calibration Photometer System Preparation” on page 4-3
•
“Calibration Procedure” on page 4-8
•
“Periodic Zero and Span Checks” on page 4-11
•
“Internal Ozonator Adjustment (Option)” on page 4-13
The following equipment is required to calibrate the analyzer:
•
Zero air generator
•
Calibration photometer system
Zero air can be obtained either from compressed cylinders or from scrubbed
ambient air. If cylinder air is used, it should be actual and not synthetic. If
ambient air is used, the following compounds must be removed: ozone,
nitric oxide, nitrogen dioxide, sulfur dioxide, and hydrocarbons. The
following scheme is recommended by the EPA in its technical assistance
document:
Model 49i Instruction Manual
4-1
Calibration
Equipment Required
1. Irradiate the air with an ozone generating UV lamp to convert nitric
oxide to nitrogen dioxide. Alternatively, pass air through Purafil® which
oxidizes nitric oxide to nitrogen dioxide and scrubs nitrogen dioxide.
2. Pass air through a large column of activated charcoal to remove residual
nitrogen dioxide, ozone, sulfur dioxide, hydrocarbons, and so on.
3. Pass air through a molecular sieve.
4. Pass air through a final particulate filter to remove particulates which
originate in scrubbing columns.
Note An important requirement for the calibration photometer operation is
that the zero air used to reference the photometer come from the same
source as the zero air used in the ozonator. This is to effectively cancel
impurities present in the zero air source. Calibration Photometer
System
4-2
Model 49i Instruction Manual
A UV photometer calibration system which includes an ozone generator, an
output port or manifold, a photometer, and a source of zero air is required.
The Thermo Scientific Model 49i Ozone Photometric Primary Standard
satisfies the calibration photometer system requirement in a single
convenient package. In addition, the Model 49i can be modified to operate
as a calibration photometer by removing the ozone scrubber and plumbing
zero air into the common port of the ozone-free solenoid valve, as shown in
Figure 4-1. If the Model 49i is modified to operate as a calibration
photometer, it must be dedicated for calibration and not be used for
monitoring ozone at any time.
Thermo Fisher Scientific
Calibration
Instrument Preparation
Figure 4-1. Model 49i Connected as Calibrator
Instrument
Preparation
Use the following procedure to prepare the instrument prior to calibration.
1. Turn on the instrument and allow it to stabilize for a minimum of one
hour. Perform the service checks in the “Preventive Maintenance”
chapter.
2. Connect the Model 49i to the ozone manifold. If a Teflon® particulate
filter is being used, it must be installed prior to calibration.
Calibration
Photometer System
Preparation
System Check
Thermo Fisher Scientific
As indicated in the EPA Technical Assistance Document there are several
tests that should be performed prior to the use of an ozone UV photometer
as a calibrator to ensure the accuracy of the measurements. These tests
include:
•
System check
•
Ozone loss test
•
Linearity check
•
Intercomparability test
A step-by-step checkout procedure to verify proper operation of a Model
49i Primary Standard (or a Model 49i modified as described earlier) is as
follows:
Model 49i Instruction Manual
4-3
Calibration
Calibration Photometer System Preparation
1. Turn the calibration photometer on.
2. Turn on the ozonator.
3. Allow the calibration photometer and ozonator to stabilize for one hour.
4. Perform service checks of Chapter 5 “Preventive Maintenance.”
Ozone Loss Test
If the calibration photometer passes the leak test in the “Preventive
Maintenance” chapter, it is highly unlikely that the system is destroying
ozone. If desired, a rigorous test is as follows (this check follows the EPA's
Technical Assistance Document with the appropriate change for a
time-shared, dual cell system). For this test, if the internal ozonator of the
Model 49i Primary Standard is being used, make sure it is in the manual
mode.
1. Calibrate an ozone analyzer using the calibration photometer. Assume
the photometer is correct.
2. Generate a stable level of ozone and with the calibrated ozone analyzer
measure and note reading as Rm.
3. Unplug the pump of the calibration photometer from the AC power
source and plug the exhaust line and zero-air inlet line.
4. Connect the calibrated ozone analyzer to the access port on the inlet of
Cell A.
5. From the Service Mode menu, select Intensity Check. From the
Intensity Check menu, select Int B Reference Gas. Wait for a steady
reading and record the intensity as R(a)input.
6. Connect the calibrated ozone analyzer to the access port on the inlet of
cell B. From the Service Mode menu, select Intensity Check. From the
Intensity Check menu, select Int A Reference Gas. Wait for a steady
reading and record the intensity as R(b)input.
4-4
Model 49i Instruction Manual
Thermo Fisher Scientific
Calibration
Calibration Photometer System Preparation
7. Replace access fittings used in steps 4 and 6 above and make sure they
are leak tight.
8. Connect the calibrated ozone analyzer to the access port on the outlet of
absorption cell of Cell A.
9. From the Service Mode menu, select Intensity Check. From the
Intensity Check menu, select Int B Reference Gas. Wait for a steady
reading and record the intensity as R(a)out.
10. Connect the calibrated ozone analyzer to the access port on the outlet of
absorption cell of Cell B. From the Service Mode menu, select Intensity
Check. From the Intensity Check menu, select Int A Reference Gas.
Wait for a steady reading and record the intensity as R(b)out.
11. Replace access fittings used in steps 8 and 10, and make sure they are
leak tight.
12. Compute percent of ozone loss from the following equation:
Percent of Ozone Loss =
R m 1/4[R(a) input R(a) out R(b) input R(b) out ]
Rm
u 100%
(1)
If the ozone loss is greater than 2%, check that the absorption cells and
Teflon® tubing have not become contaminated by dirt. See “Optical Bench
Cleaning” in the “Preventive Maintenance” chapter for more information.
If the cells and Teflon® tubing are clean, recondition the optical bench by
setting the ozone generator for maximum ozone and adjust the pressure
regulator for minimum dump flow (about 1/2 liter per minute). Let the
calibration photometer run overnight sampling the high level of ozone.
Then repeat ozone loss test.
Linearity Check
Thermo Fisher Scientific
Since the Model 49i is inherently linear over the range of interest
(0-1 ppm), a linearity test is an effective overall test that the instrument is
operating properly. The checks above should identify whether any causes of
non-linearity are present. The possible causes of non-linearity are:
Model 49i Instruction Manual
4-5
Calibration
Calibration Photometer System Preparation
•
Dirty or contaminated cell, lines, or manifold
•
Inadequate conditioning of system
•
Leaks in system
•
Contamination in zero air
•
Non-linear detectors in photometer
•
Faulty electronics
To demonstrate linearity, generate a concentration of ozone near the upper
range limit of the calibration photometer and accurately dilute the ozonated
air with zero air. To do this test accurately, two calibrated flow meters and a
mixing chamber are needed: one flow meter to measure the flow into the
ozonator, and the other to measure the flow of the dilutant zero air. The
percent of non-linearity is calculated as follows:
R
Fo
Fo Fd
A1 E
(2)
A2
R u 100%
A1
(3)
where:
Fo = Ozonator flow
Fd = Dilutant zero air flow
E = Linearity error, in percent
A1 = Assay of original concentration
A2 = Assay of diluted concentration
R = Dilution ratio
Note that the inherent linearity accuracy of the Model 49i Primary Standard
(or modified Model 49i) is greater than the accuracy measurements of the
mass flow meters.
4-6
Model 49i Instruction Manual
Thermo Fisher Scientific
Calibration
Calibration Photometer System Preparation
Use the following procedure to check that the calculations are complete and
accurate.
1. With the ozone generator in the manual mode (gain set to zero), adjust
ozone level to generate a level in excess of 0.5 ppm. Wait until ozone
concentration is stable.
2. From the Service Mode menu, select Intensity Check. From the
Intensity Check menu, select Int A Reference Gas. Wait for stable
frequency reading and note as Io(A). Press
to return to the
Intensity Check menu.
3. From the Intensity Check menu, select Int A Sample Gas. Wait for
stable frequency reading, note as I(A). Press
to return to the
Intensity Check menu.
4. From the Intensity Check menu, select Int B Reference Gas. Wait for
stable frequency reading, note as Io(B). Press
three times to
return to the Main Menu.
5. From the Main Menu choose Diagnostics. From the Diagnostics menu
choose Temperatures to get the current bench temperature and Pressure
to get the current pressure reading.
6. Compute C(A) and C(B) from Equation 4.
C
§
·§ 760 273 T · § I o ·
10 6
¨¨
¸¸¨
¸ ln¨ ¸
273P
¹ © I ¹
© 308 37.84 ¹©
(4)
This value should agree with the value noted in the Run screen. Note that
the concentration determined in this manner does not correct for lamp
fluctuation and thus will be noisier than the concentration determined in
the Run screen.
Intercomparability Test
Thermo Fisher Scientific
To perform an intercomparability test of a Model 49i Primary Standard, it
may be necessary to have the Model 49i Primary Standard sample ozone
from a source other than the one contained in the instrument. Use the
following procedure to accomplish this.
Model 49i Instruction Manual
4-7
Calibration
Calibration Procedure
1. Set ozone level thumb wheel to zero.
2. At the Teflon® distribution manifold, disconnect the line from the
ozonator to the manifold and cap fitting.
3. Cap bulkhead labeled VENT.
4. Connect Teflon® line from bulkhead labeled OZONE to manifold of
ozone source being utilized for intercomparability study.
5. Make sure the same zero air is feeding both the Model 49i Primary
Standard and the second photometer being used in study.
6. If it is desired to hold usage of zero air to a minimum, adjust the
pressure regulator feeding the ozonator to zero pressure.
7. Perform intercomparability test.
8. After completion of test, reconnect ozonator and leak check following
the “Leak Test and Pump Checkout” procedure in the “Preventive
Maintenance” chapter.
Note If an ozone analyzer is available in addition to the two ozone
photometers being checked for intercomparability, an easier
intercomparability check is to calibrate the ozone analyzer against each
photometer individually and then compare the two ozone calibration
curves. If a calibration photometer other than a Model 49i Primary Standard or
modified Model 49i is being used, follow the checkout procedure given in
the Manual for the calibration photometer, or follow the procedure in the
Technical Assistance Document.
Calibration Procedure
To generate data of the highest confidence, it is recommended that a
multipoint calibration be performed:
•
4-8
Model 49i Instruction Manual
every three months
Thermo Fisher Scientific
Calibration
Calibration Procedure
•
Connect Instrument
after performing a major component disassembly
Connect the Model 49i to the manifold on the output of the ozonator, as
shown in Figure 4-2. If an optional sample line filter is used, the calibration
must be performed through this filter. Ensure that the flow rate into the
output manifold is greater than the total flow required by the calibration
photometer, analyzer, and any other flow demand connected to the
manifold.
Model 49i
Figure 4-2. Model 49i Connected to Calibration Photometer and External
Ozonator
Zero Adjust
Use the following procedure to adjust zero.
1. Allow sufficient time for the instrument and the calibration photometer
to warm up and stabilize.
2. With the zero air supply ON, but the ozonator OFF, allow the
instrument to sample zero air until a stable response is obtained.
3. From the Main Menu choose Calibration.
4. From the Calibration menu choose Calibrate Zero. Press
to
perform a zero calibration. Press
to return to the Run screen.
Thermo Fisher Scientific
Model 49i Instruction Manual
4-9
Calibration
Calibration Procedure
If a strip chart recorder is used, it is recommended that it be adjusted to
obtain a record of zero drift and/or zero noise. This can be achieved by
using the zero offset capability of the recorder.
5. Record the stable zero air response as Z.
Span Adjust
Use the following procedure to adjust span.
1. Generate an ozone concentration standard of approximately 80% of the
upper range limit (URL) of the ozone analyzer (such as, 0.4 or 0.8 ppm
for the 0.5 and 1.0 ppm ranges respectively).
2. Allow the instrument to sample this ozone concentration standard until
a stable response is obtained.
3. From the Main Menu choose Calibration > Calibrate Span. Use
and
to increment/decrement the known span gas concentration.
Press
to calibrate the instrument.
The recorder response will equal:
RecorderResponse (%Scale)
(O 3 ) out
u 100 Z
URL
(5)
where:
URL = Upper range limit of the Model 49i, ppm
Z = Recorder response with zero air, % scale
[O3]out = Ozone concentration as determined by the calibration photometer, ppm
4. Record the ozone concentration as determined by the calibration
photometer and the corresponding analyzer response.
Additional Concentration
Standards
4-10
Model 49i Instruction Manual
1. Generate several other ozone concentration standards (at least five others
are recommended) over the scale range of the instrument.
Thermo Fisher Scientific
Calibration
Periodic Zero and Span Checks
2. For each ozone concentration standard, record the ozone concentration
as determined by the calibration photometer and record the
corresponding Model 49i analyzer response.
If a Model 49i Primary Standard is being used as the calibration
photometer, use the ozone concentration as determined by the
photometer and not the value of the ozone level thumbwheel.
Calibration Curve
Use the following procedure to plot the calibration curve.
1. Plot the Model 49i Analyzer responses versus the corresponding ozone
concentrations.
2. Connect the experimental points by using a straight line, preferably
determined by linear regression techniques.
Points that lie more than ±4% from this line are an indication of an
error in determining the calibration curve. The error may be due to a
malfunction of the calibration photometer, or a malfunction of the
analyzer being calibrated. The most likely malfunctions in both the
analyzer and calibration photometer which can give non-linear results
are leaks, a malfunctioning ozone scrubber, a dirty solenoid, or dirt in
the optical system. The calibration curve is used to reduce subsequent
ambient data.
Note To generate data of the highest confidence, it is recommended that a
multipoint calibration be performed every three months, any time major
disassembly of components is performed, or any time the zero or span
checks give results outside the limits described in “Periodic Zero and Span
Checks” that follow. Periodic Zero and
Span Checks
In order to achieve data of the highest confidence, it is suggest that periodic
zero and air span checks be performed. These checks can be performed by:
1. Periodically challenge the instrument with zero air.
The output flow of the zero air supply should be greater than the flow
demand of the instrument. In addition, an atmospheric dump bypass
should be used to ensure that the zero air gas flow is being delivered at
atmospheric pressure.
Thermo Fisher Scientific
Model 49i Instruction Manual
4-11
Calibration
Periodic Zero and Span Checks
2. Record the analyzer response in percent of scale as Ao. Compute the zero
drift from the following equation:
ZeroDrift %
Ao Z
(6)
where:
Z = Recorder response obtained at the last calibration for zero air, % scale
3. Periodically challenge the instrument with an ozone level of
approximately 80% URL from a previously calibrated stable ozone
generator.
The output flow from this generator should be greater than the flow
demand of the instrument. In addition, an atmospheric dump bypass
should be used to ensure the span gas flow is being delivered at
atmospheric pressure.
4. Record the analyzer response in % of scale as A80. Compute the span
error from the following equation:
ªReported CO Concentration Actual CO Concentration º
«
» x 100
Actual CO Concentration
¬
¼
where:
Z = Recorder response obtained at the last calibration for zero air, % scale
[O3] = Generated span concentration, ppm
A zero drift in excess of ±4% of full scale, or a span drift in excess of
±6% of full scale is an indication of a malfunction either of the zero air
supply, ozone source, recorder, or analyzer. Since the Model 49i is a ratio
instrument and thus does not have an electronic span or zero drift, it is
not recommended that any zero adjustment or span adjustment be
performed as the result of a zero or span check. If values are obtained
outside of the limits of ±4% for zero and ±6% for span drift, the
multipoint calibration described previously is indicated to isolate the
problem.
For detailed guidance in setting up a quality assurance program, refer to
the code of Federal Regulations, and the EPA Handbook on Quality
Assurance.
4-12
Model 49i Instruction Manual
Thermo Fisher Scientific
Calibration
Internal Ozonator Adjustment (Option)
Internal Ozonator
Adjustment (Option)
The internal ozonator has been designed to satisfy the current EPA
regulations on biweekly precision and span checks. Before this option can
be used for precision or span checks, it must be certified as a transfer
standard. For detailed information on qualification and certification of an
ozone generating transfer standard, refer to the EPA Technical Assistance
Document on Transfer Standards.
For more information about the internal ozonator, see the “Optional
Equipment” chapter.
Use the following procedure to adjust the internal ozonator.
1. Connect a transfer standard or primary standard to the ozone OUT
bulkhead fitting of the instrument (see Figure 4-3).
Figure 4-3. Ozonator Flow Scheme
2. If an optional remote interface is installed, place the instrument in the
Local mode.
3. From the Main Menu choose Instrument Controls > O3 Level 1.
Thermo Fisher Scientific
Model 49i Instruction Manual
4-13
Calibration
Internal Ozonator Adjustment (Option)
4. Adjust Level 1 for the desired level (typically 80% URL).
5. Allow this value to stabilize.
6. Record the value as [O3]80 to be used in the span error equation of Step
2 in the “Periodic Zero and Span Checks” section described previously.
Note Level 1 setting.
7. Press
to return to the Instrument Controls menu.
8. From the Instrument Control menu choose O3 Level 2.
9. Adjust Level 2 for the desired level (typically 90 ppb).
10. Allow this value to stabilize.
11. Record the value as [O3]20 to be used in the following error equation:
URL
] [O 3 ]20
100
u 100
[O 3 ]20
[(A 20 Z)
% Error
(8)
where:
A20 = Recorder response of Model 49i with precision level, % scale
Z= Recorder response obtained at the last calibration for zero air, % scale
Note The expected stability of the analyzer section of the Model 49i is
greater than the expected stability of the internal ozonator. 4-14
Model 49i Instruction Manual
Thermo Fisher Scientific
Chapter 5
Preventive Maintenance
This chapter describes the periodic maintenance procedures that should be
performed on the instrument to ensure proper operation.
Since usage and environmental conditions vary greatly, you should inspect
the components frequently until an appropriate maintenance schedule is
determined. This includes the sample pump and solenoid valves which have
a limited life.
Other operations such as cleaning the optics and checking the calibration of
the pressure should be performed on a regular basis.
This chapter includes the following maintenance information and
replacement procedures:
Thermo Fisher Scientific
•
“Safety Precautions” on page 5-2
•
“Replacement Parts” on page 5-2
•
“Outside Case Cleaning” on page 5-2
•
“Optical Bench Cleaning” on page 5-2
•
“Lamp Replacement” on page 5-3
•
“Monitoring Detector Frequencies and Noise” on page 5-4
•
“Capillary Service” on page 5-5
•
“Pump Rebuilding” on page 5-6
•
“Leak Test and Pump Checkout” on page 5-7
•
“Ozone Scrubber Test” on page 5-10
Model 49i Instruction Manual
5-1
Preventive Maintenance
Safety Precautions
Safety Precautions
Read the safety precautions before beginning any procedures in this chapter.
WARNING If the equipment is operated in a manner not specified by the
manufacturer, the protection provided by the equipment may be impaired.
WARNING The Model 49i Primary Standard is supplied with a three-wire
grounding cord. Under no circumstances should this grounding system be
defeated. Equipment Damage Some internal components can be damaged by small
amounts of static electricity. A properly grounded antistatic wrist strap must
be worn while handling any internal component. For more information
about appropriate safety precautions, see the “Servicing” chapter. Replacement Parts
Outside Case
Cleaning
See the “Servicing” chapter for a list of replacement parts.
Clean the outside case using a damp cloth being careful not to damage the
labels on the case.
Equipment Damage Do Not use solvents or other cleaning products to
clean the outside case. Optical Bench
Cleaning
Best results are obtained when the optical bench is cleaned prior to
recalibration. The cleanliness of the bench should also be checked any time
the detector frequencies drop below 65 kHz, since one source of low output
is light attenuation due to dirt in the cell. Dirt particulates are usually
effective ozone removers.
Use the following procedure to clean the optical bench.
CAUTION Some internal components can be damaged by small amounts of
static electricity. A properly grounded antistatic wrist strap must be worn
while handling any internal component. For more information about
appropriate safety precautions, see the “Servicing” chapter. 5-2
Model 49i Instruction Manual
Thermo Fisher Scientific
Preventive Maintenance
Lamp Replacement
1. Turn off the power and disconnect the power line.
2. Loosen the knurled nut around the tube and carefully slide out tube.
3. Push a piece of lens paper down the tube using a 1/4-inch piece of
Teflon® tubing so as not to damage the tube. Use a cotton swab to clean
the window surfaces through the holes that the tube fits into.
4. Both absorption tubes are identical, so they can be replaced in either
position. Replacement of absorption cells is opposite to that of removal.
Since the Model 49i is a ratio instrument, and cleaning the absorption
tubes does not affect the calibration, it is not necessary to recalibrate the
instrument every time the cells are cleaned.
5. Re-install the instrument cover.
If windows are severely contaminated, they are best cleaned by removing the
windows from the bench. The windows on the detector side can be removed
by removing the detector block and carefully removing the windows. The
windows on the source side can be removed by removing the source block to
gain access to the windows. It is recommended that the Model 49i be
recalibrated if the optical bench has been completely disassembled. Always
leak-check the system after any component removal.
Lamp Replacement
The lamp control system of the Model 49i has been designed to operate the
lamp conservatively to increase its life. However, the lamp should be
replaced when any one of the following conditions occur:
•
No light output.
•
Inability to adjust lamp position to obtain an output detection
frequency of 65 kHz.
•
Noisy output signal, which has been traced to an unstable lamp (see the
“Troubleshooting” chapter).
It is not necessary to recalibrate the Model 49i since it is a ratio instrument
and replacing the lamp does not affect the calibration.
Thermo Fisher Scientific
Model 49i Instruction Manual
5-3
Preventive Maintenance
Monitoring Detector Frequencies and Noise
Monitoring Detector
Frequencies and
Noise
The Model 49i measures intensity ratios and not absolute values. Therefore,
a large range of detector frequencies are acceptable for proper operation of
the instrument. The nominal values are 65 to 120 kHz. These frequencies
can be monitored from the Intensities screen in the Diagnostics menu.
1. Press
to display the Main Menu.
2. Use
to scroll to Diagnostics, press
scroll to Intensities and press
.
>
to
The Intensities screen appears.
Degradation of detector frequencies to below 65 kHz indicates either a dirty
cell or low lamp output. In addition to degrading the measured detector
frequency, dirt in the cells can decompose the ozone and give erroneous
readings. Therefore, the cells should first be cleaned and the frequency
re-measured.
Increasing Lamp Output
If the frequencies are still low, the lamp output can be increased by using the
Lamp Setting screen in the Service mode. If the frequency cannot be set
above 65 kHz, replace the lamp.
1. Press
to display the Main Menu.
2. Use
to scroll to Service, press
Lamp Setting and press
.
>
to scroll to
The Lamp Setting screen appears.
If the Service Mode is not displayed on the Main Menu, use the
following procedure to display it.
a. At the Main Menu, press
to scroll to Instrument Controls >
press
>
to scroll to Service Mode > and press
.
The Service Mode screen appears.
Monitoring Lamp Noise
5-4
Model 49i Instruction Manual
b. Press
to toggle the Service Mode to ON.
c. Press
>
to return to the Main Menu.
To monitor the lamp noise, display Intensity Check from the Service mode
menu.
Thermo Fisher Scientific
Preventive Maintenance
Capillary Service
1. Press
to display the Main Menu.
2. Use
to scroll to Service, press
Intensity Check and press
.
>
to scroll to
The Intensity Check screen appears.
The noise value displayed after 20 seconds should be below 4.0 Hz for a
fully warmed-up lamp (see the “Troubleshooting” chapter if the noise is
excessive).
Capillary Service
The capillaries normally only require inspection when performance
indicates there may be a flow problem. Use the following procedure to
service the capillaries (Figure 5-1).
Equipment Required:
Capillary
Wire, less than 0.015-inch OD
Equipment Damage Some internal components can be damaged by small
amounts of static electricity. A properly grounded antistatic wrist strap must
be worn while handling any internal component. 1. Turn instrument OFF, unplug the power cord, and remove the cover.
Thermo Fisher Scientific
Model 49i Instruction Manual
5-5
Preventive Maintenance
Pump Rebuilding
2. Remove capillary, check for particulate deposits, clear any blockage with
a wire less than 0.015-inch OD, or replace the capillary by following the
above steps in reverse.
Capillary
Capillary
Figure 5-1. Capillary Location
Pump Rebuilding
Use the following procedure to rebuild the pump (Figure 5-2). To replace
the pump, see “Pump Replacement” in the “Servicing” chapter.
Equipment Required:
Flatblade screwdriver
Pump rebuild kit (flapper valve and diaphragm)
Equipment Damage Some internal components can be damaged by small
amounts of static electricity. A properly grounded antistatic wrist strap must
be worn while handling any internal component. 1. Turn instrument OFF, unplug the power cord, and remove the cover.
2. Loosen the fittings and remove both lines going to the pump.
5-6
Model 49i Instruction Manual
Thermo Fisher Scientific
Preventive Maintenance
Leak Test and Pump Checkout
3. Remove the four screws from the top plate, remove top plate, flapper
valve, and the bottom plate.
Top Plate
Flapper Plate
Bottom Plate
Diaphragm
Figure 5-2. Rebuilding the Pump
4. Remove the screw the securing the diaphragm to piston and remove
diaphragm.
5. Assemble the pump by following the previous steps in reverse, make
sure the Teflon® (white) side of the diaphragm is facing up and that the
flapper valves cover the holes of the top and bottom plate.
6. Perform “Leak Test and Pump Checkout” procedure that follows.
Leak Test and Pump
Checkout
External Leaks
Use the following procedures to test for system leaks and checkout the
pump.
Use the following procedure to test for leaks around the fittings.
1. Disconnect the SAMPLE input line and plug the SAMPLE fitting.
Thermo Fisher Scientific
Model 49i Instruction Manual
5-7
Preventive Maintenance
Leak Test and Pump Checkout
2. Disconnect the ZERO AIR input lines and plug.
3. If the optional internal ozonator is installed, plug the OZONE and
VENT outputs.
4. Press
to display the Main Menu.
5. Press
to scroll to Diagnostics and press
the Diagnostics menu.
to display
6. Press
to move the cursor to Flows and press
to display the
Flows screen. The flow readings should slowly decrease to zero flow.
7. Press
to return to the Diagnostics menu.
8. Press
to move the cursor to Pressure and press
to display
the Pressure screen. The pressure reading should drop to less than 250
mm Hg.
If the pump diaphragm is in good condition and the capillary is not
blocked, it should take less than 20 seconds from the time the inlet is
plugged to the time the reading below 250 mm Hg is obtained.
If a leak is suspected, carefully tighten each fitting until the leak is found
and check to see that none of the input lines are cracked or broken.
Solenoid Leaks
Leaks across the solenoid valve can be caused by Teflon cold-flowing across
the valve seat or by particulates on the seat.
Use the following procedure to check for solenoid leaks.
1. Generate an ozone concentration of approximately 0.5 ppm.
2. Press
to display the Main Menu.
3. Press
to scroll to Diagnostics and press
the Diagnostics menu.
5-8
Model 49i Instruction Manual
to display
Thermo Fisher Scientific
Preventive Maintenance
Leak Test and Pump Checkout
4. Use
to move the cursor to Cell A/B O3 and press
to display the O3 PPB screen. This display presents the concentration
for each cell.
Once the instrument stabilizes, the average of 10 successive
simultaneous readings should agree within ±3 percent.
A balanced measurement of less than 3 percent indicates that there are
no leaks across the solenoid.
A constant low reading from one cell indicates an imbalance. The
imbalance can be caused by a dirty cell, dirty lines to that cell, or by a
leaky valve. Refer to the “Solenoid Leak Test” procedure that follows to
check for a leaky solenoid.
To check if the imbalance is caused by an absorption cell, interchange
the cells. If the imbalanced side switches, the imbalance is caused by the
cell.
Solenoid Leak Test
Use the following procedure to test the solenoid valve for leaks.
1. Remove the solenoid valve that appears to be faulty.
2. Connect the pump directly to the common solenoid port.
3. Connect the pressure transducer to the normally open solenoid port.
4. Press
Thermo Fisher Scientific
to display the Main Menu.
Model 49i Instruction Manual
5-9
Preventive Maintenance
Ozone Scrubber Test
5. Press
to scroll to Diagnostics and press
the Diagnostics menu.
6. Use
Pressure screen.
to scroll to Pressure and press
to display
to display the
7. Note the pressure as PNO.
8. Connect the pressure transducer to the normally closed solenoid port.
9. Plug the solenoid power line into the appropriate connector on the
measurement interface board. Make sure the solenoid is activated by
choosing Pressure from the Diagnostics menu.
10. Note the pressure as PNC the solenoid is faulty
11. The solenoid is faulty if either PNO or PNC is greater than the pressure
determined in the “External Leaks” section described previously.
Ozone Scrubber Test
Use the following procedure to determine the efficiency of the ozone
scrubber. To replace the scrubber, refer to the “Ozone Scrubber
Replacement” procedure in the “Servicing” chapter.
1. Generate a source of ozone of about 0.5 ppm and feed into the
instrument. Note the concentration as C.
2. Press
to display the Main Menu.
3. Press
to scroll to Service > press
to scroll to
Intensity Check > press
to choose Int A Reference Gas.
4. When the frequency stabilizes, note the frequency as FREQ 1.
5. Turn ozonator off and when the frequency stabilizes, note the frequency
as FREQ 2.
5-10
Model 49i Instruction Manual
Thermo Fisher Scientific
Preventive Maintenance
Ozone Scrubber Test
6. Determine pressure and temperature, note as P and T.
7. The approximate efficiency is given as follows:
8. Repeat for Cell B with sample flowing in Cell A.
9. If the instrument passes the balance test of the “Solenoid Leak Test”
described previously and the measured efficiency is low, replace the
ozone scrubber.
If the balance test indicates a leaky valve, and if the efficiency test shows
a low efficiency in the same cell that was low in the balance test, replace
sample solenoid.
If the efficiency test shows a low efficiency in the opposite cell that was
low in the balance test, replace the reference solenoid.
Thermo Fisher Scientific
Model 49i Instruction Manual
5-11
Preventive Maintenance
Ozone Scrubber Test
5-12
Model 49i Instruction Manual
Thermo Fisher Scientific
Chapter 6
Troubleshooting
This instrument has been designed to achieve a high level of reliability. In
the event of problems or failure, the troubleshooting guidelines, board-level
connection diagrams, connector pin descriptions, and testing procedures
presented in this chapter should be helpful in isolating and identifying
problems.
For additional fault location information refer to the “Preventive
Maintenance” chapter in this manual.
The service mode in the “Operation” chapter includes parameters and
functions that are useful when making adjustments or diagnosing problems.
The Technical Support Department at Thermo Fisher Scientific can also be
consulted in the event of problems. See “Service Locations” at the end of
this chapter for contact information. In any correspondence with the
factory, please note both the serial number and program number of the
instrument.
This chapter provides the following troubleshooting and service support
information:
Safety Precautions
Thermo Fisher Scientific
•
“Safety Precautions” on page 6-1
•
“Troubleshooting Guides” on page 6-2
•
“Board-Level Connection Diagrams” on page 6-6
•
“Connector Pin Descriptions” on page 6-8
•
“Service Locations” on page 6-21
Read the safety precautions in the Preface and the “Servicing” chapter before
performing any actions listed in this chapter.
Model 49i Instruction Manual
6-1
Troubleshooting
Troubleshooting Guides
Troubleshooting
Guides
The troubleshooting guides presented in this chapter are designed to help
isolate and identify instrument problems.
Table 6-1 provides general troubleshooting information and indicates the
checks that you should perform if you experience an instrument problem.
Table 6-2 lists all the alarm messages you may see on the graphics display
and provides recommendations about how to resolve the alarm condition.
Table 6-1. Troubleshooting - General Guide
Malfunction
Possible Cause
Action
Does not start up
No power
Check that the instrument is
plugged into the proper
source (115 or 220 volts)
Check instrument fuses
using a voltmeter
Power supply
Check power supply voltages
Light adjustment
Readjust Lamp Setting.
From the Service Mode
menu choose Lamp Setting.
Defective detector
Interchange detectors at
Measurement Interface
Board connectors to
determine if detector is
defective.
Cell A and B frequency
high
Lamp supply
Check for 1.7 volt peak to
peak waveform at lamp
current check point on Lamp
Power Supply Board
Cell A or B frequency
low or zero
Light adjustment
Readjust lamp setting. From
the Service Mode menu
choose Lamp Setting.
One cell excessively contaminated
Clean cell
Defective detector
Interchange detectors at
Measurement Interface
Board connectors to
determine if detector is
defective
Dirty cells
Clean cells
Light adjustment
Check for 1.7 volt peak to
peak waveform at lamp
current check point on Lamp
Power Supply Board
Cell A or B
frequency high
Cell A and B frequency
low or zero
6-2
Model 49i Instruction Manual
Thermo Fisher Scientific
Troubleshooting
Troubleshooting Guides
Table 6-1. Troubleshooting - General Guide, continued
Malfunction
Cell A or B noise
excessive
Cell A and B noise
excessive
Possible Cause
Action
Lamp
Remove one cell and look for
blue light in hole of input
block
Lamp heater
Check lamp temperature.
From the Diagnostics menu
choose Temperatures.
±15 volt power supply
Check ±15 volts. From the
Diagnostics menu choose
Voltages.
Foreign material in one cell
Clean cell.
Defective detector
Interchange detectors at
Measurement Interface
Board connectors to
determine if detector is
defective.
Foreign material in
Clean cells
cells
Lamp failure
Check for 1.7 volt peak to
peak waveform at lamp
current check point on Lamp
Power Supply Board
±15 volt power supply
Check ±15 volts. From the
Diagnostics menu choose
Voltages.
Pressure transducer
does not hold
calibration
Pressure transducer
Replace pressure transducer
Output signal
Recorder
Replace or repair recorder
Sample is varying
Run instrument on stable
ozone source. If quiet, no
malfunction.
Foreign material in cell
Clean cell
Sticky solenoid valve
Replace with known good
solenoid valve.
Leak
Perform leak test
Contaminated scrubber
Perform scrubber efficiency
test. Replace if necessary.
Pressure transducer out of
calibration
Recalibrate pressure
transducer
noisy
Analyzer does not
calibrate properly
Thermo Fisher Scientific
Model 49i Instruction Manual
6-3
Troubleshooting
Troubleshooting Guides
Table 6-1. Troubleshooting - General Guide, continued
Malfunction
Slow response
Possible Cause
Action
Dirty system
Clean cells and flow
components
Solenoid defective
Perform “Confirmation of
Leak Through Solenoid” test
described in the “Preventive
Maintenance” chapter.
Averaging time
Verify averaging time is set
properly
Contaminated optical bench
Clean bench and then
condition system overnight
Table 6-2. Troubleshooting - Alarm Messages
Alarm Message
Possible Cause
Action
Alarm - O3 Lamp Temp
Defective lamp heater
Replace ozonator, or lamp
driver board, or lamp
assembly.
Alarm - Lamp Temp
Defective lamp heater
Replace bench lamp driver
board or lamp assembly.
Alarm - Bench Temp
Faulty fan
Replace fan if not operating
properly.
Dirty fan filter
Clean or replace foam filter,
refer to “Preventive
Maintenance” chapter in
this manual.
High pressure indication
Check the pump for a tear in
the diaphragm, replace with
pump repair kit if necessary.
Alarm - Pressure
Refer to “Preventive
Maintenance” chapter in
this manual. Check that
capillaries are properly
installed and O-rings are in
good shape. Replace if
necessary. Check flow
system for leaks.
Alarm - Flow A
Alarm - Flow B
6-4
Model 49i Instruction Manual
Flow low
Check sample capillary
(0.015 inch ID) for blockage.
Replace as necessary.
Thermo Fisher Scientific
Troubleshooting
Troubleshooting Guides
Table 6-2. Troubleshooting - Alarm Messages, continued
Alarm Message
Possible Cause
Action
If using sample particulate
filter make sure it is not
blocked. Disconnect sample
particulate filter from the
sample bulkhead, if flow
increases, replace the filter.
Alarm - Intensity A
Pre-amp Gain not set properly
Check Gain adjustment.
Defective measurement interface
board
Replace measurement
interface board.
Instrument out of calibration
Recalibrate instrument.
Alarm - Intensity B
Alarm - Zero Check
(Opt)
Check gas supply. Perform
manual calibration.
Alarm - Span Check
(Opt)
Alarm - Zero Autocal
(Opt)
Alarm - Span Autocal
(Opt)
Alarm - Oz Level 1
Check (Opt)
Oz Level 2 Check (Opt)
Oz Level 3 Check (Opt)
Oz Level 4 Check (Opt)
Oz Level 5 Check (Opt)
Alarm - O3 Conc.
Concentration has exceeded range
limit
Check to insure range
corresponds with expected
value. If not select proper
range.
Concentration low
Check user-defined low set
point, set to zero.
Alarm - Motherboard
Status
Internal cables not connected
properly
Alarm - Interface
Status
Board is defective
Check that all internal cables
are connected properly.
Recycle AC power to
instrument. If still alarming,
change board.
Alarm - I/O Exp Status
Thermo Fisher Scientific
Model 49i Instruction Manual
6-5
Troubleshooting
Board-Level Connection Diagrams
Board-Level
Connection Diagrams
Figure 6-1 and Figure 6-2 are board-level connection diagrams for the
common electronics and measurement system. These illustrations can be
used along with the connector pin descriptions in Table 6-3 through
Table 6-9 to troubleshoot board-level faults.
I/OEXPANSION
BOARD
EXPANSION I/O
25 Pin
J1
TOMEASUREMENT SYSTEM
DIGITAL OUTPUT
BOARD
DIGITAL
OUTPUTS 37 Pin
J2
11 Pin 8 Pin
J14
J3
RS232/RS485
RS232/RS485
10-BASE-T
9 Pin
P1:A
J18
9 Pin P1:B
8 Pin
EXPANSION RS485
J1
34 Pin
FRONT
PANEL
BOARD
J2
14 Pin
J4
3 Pin
J3
J2
LCD
DISPLAY
8 Pin
KEY PANEL
J15
15 Pin
MOTHERBOARD
J4
8 Pin
SPARE DATA
ANALOG OUTPUTS
/DIGITAL INPUTS 37 Pin J5
J1
J10
J17
PJ1
PJ3
DATA
3 Pin
2 Pin
POWER_GOOD
2 Pin
PJ2
3 Pin 3 Pin 3 Pin
REAR PANEL
AC INPUT
J4
3 Pin
AC
24VDC
POWERSUPPLY
24VDC
AC
3 Cond
J3
2 Pin
AC
FRONT PANEL
POWER SW
J1
TRANSFORMER
(90VACor 240VAC
OPTIONS)
3 Pin
Figure 6-1. Board-Level Connection Diagram - Common Electronics
6-6
Model 49i Instruction Manual
Thermo Fisher Scientific
Troubleshooting
Board-Level Connection Diagrams
J9
J10
4 Pin
CH A
DETECTOR
4 Pin
CH B
DETECTOR
TO COMMON ELECTRONICS
J7
J8
J5
49i MEASUREMENT
INTERFACE BOARD
DATA
3 Pin
J6
J12
J4
J11
J13
J14
J15
24V
2 Pin
J3
J16
J17
AC
3 Pin
J1
J2
FLOW A
5 Pin
FLOW B
5 Pin
J3
8 Pin
OZONATOR
POWER SUPPLY
J1
J2
J3
8 Pin
PHOTOMETER
POWER SUPPLY
J1
J2
2 Pin
LAMP
LAMP
HEATER
6 Pin
2 Pin
LAMP
6 Pin
LAMP
HEATER
PRESSURE
4 Pin
BENCH TEMP. THERM.
2 Pin
2 Pin
SAMPLE SOL.
2 Pin
REF SOL.
2 Pin
OZ SOL.
2 Pin
FAN
2 Pin
AC
3 Pin
ZERO/SPAN SOL.
PUMP AC
Figure 6-2. Board-Level Connection Diagram - Measurement System
Thermo Fisher Scientific
Model 49i Instruction Manual
6-7
Troubleshooting
Connector Pin Descriptions
Connector Pin
Descriptions
The connector pin descriptions in Table 6-3 through Table 6-9 can be used
along with the board-level connection diagrams to troubleshoot board-level
faults.
Table 6-3. Motherboard Connector Pin Descriptions
Connector
Label
Reference
Designator
Pin
Signal
Description
INTF DATA
J1
1
Ground
2
+RS485 to Interface Board
3
-RS485 to Interface Board
1
Ethernet Output (+)
2
Ethernet Output (-)
3
Ethernet Input (+)
4
NC
5
NC
6
Ethernet Input (-)
7
NC
8
NC
1
+5V
2
+24V
3
+24V
4
Ground
5
Ground
6
Ground
7
+RS485 to Expansion Board
8
-RS485 to Expansion Board
1
+5V
2
+24V
3
+24V
4
Ground
5
Ground
6
Ground
7
+RS485 to Spare Board
8
-RS485 to Spare Board
1
Power Fail Relay N.C. Contact
2
Ground
3
TTL Input 1
10-BASE-T
EXPANSION BD
SPARE DATA
I/O
6-8
Model 49i Instruction Manual
J2
J3
J4
J5
Thermo Fisher Scientific
Troubleshooting
Connector Pin Descriptions
Table 6-3. Motherboard Connector Pin Descriptions, continued
Connector
Label
Thermo Fisher Scientific
Reference
Designator
Pin
Signal
Description
4
TTL Input 2
5
Ground
6
TTL Input 5
7
TTL Input 7
8
TTL Input 8
9
TTL Input 10
10
Ground
11
TTL Input 13
12
TTL Input 15
13
Ground
14
Analog Voltage Output 1
15
Analog Voltage Output 3
16
Ground
17
Analog Voltage Output 5
18
Ground
19
Ground
20
Power Fail Relay COM
21
Power Fail Relay N.O. Contact
22
Ground
23
TTL Input 3
24
TTL Input 4
25
TTL Input 6
26
Ground
27
TTL Input 9
28
TTL Input 11
29
TTL Input 12
30
TTL Input 14
31
TTL Input 16
32
Ground
33
Analog Voltage Output 2
34
Analog Voltage Output 4
35
Ground
36
Analog Voltage Output 6
Model 49i Instruction Manual
6-9
Troubleshooting
Connector Pin Descriptions
Table 6-3. Motherboard Connector Pin Descriptions, continued
Connector
Label
SER EN
24V IN
DIGITAL I/O
EXT. RS485
24V MONITOR
6-10
Model 49i Instruction Manual
Reference
Designator
J7
J10
J14
J15
J17
Pin
Signal
Description
37
Ground
1
Serial Enable Jumper
2
+3.3V
1
+24V
2
Ground
1
+5V
2
+24V
3
+24V
4
Ground
5
Ground
6
Ground
7
SPI Reset
8
SPI Input
9
SPI Output
10
SPI Board Select
11
SPI Clock
1
-RS485 to Rear Panel
2
+RS485 to Rear Panel
3
+5V
4
+5V
5
+5V
6
Ground
7
Ground
8
Ground
9
NC
10
NC
11
+24V
12
+24V
13
+24V
14
+24V
15
+24V
1
24V Power Monitor
2
Ground
Thermo Fisher Scientific
Troubleshooting
Connector Pin Descriptions
Table 6-3. Motherboard Connector Pin Descriptions, continued
Thermo Fisher Scientific
Connector
Label
Reference
Designator
Pin
Signal
Description
FRONT PANEL
BD
J18
1
Ground
2
Ground
3
LCLK – LCD Signal
4
Ground
5
Ground
6
LLP – LCD Signal
7
LFLM – LCD Signal
8
LD4 – LCD Signal
9
LD0 – LCD Signal
10
LD5 – LCD Signal
11
LD1 – LCD Signal
12
LD6 – LCD Signal
13
LD2 – LCD Signal
14
LD7 – LCD Signal
15
LD3 – LCD Signal
16
LCD Bias Voltage
17
+5V
18
Ground
19
Ground
20
LCD_ONOFF – LCD Signal
21
Keypad Row 2 Input
22
Keypad Row 1 Input
23
Keypad Row 4 Input
24
Keypad Row 3 Input
25
Keypad Col 2 Select
26
Keypad Col 1 Select
27
Keypad Col 4 Select
28
Keypad Col 3 Select
29
Ground
30
Ground
31
Ground
32
Ground
Model 49i Instruction Manual
6-11
Troubleshooting
Connector Pin Descriptions
Table 6-3. Motherboard Connector Pin Descriptions, continued
Connector
Label
RS232/RS485:A
RS232/RS485:B
AC IN
AC 24VPWR
AC INTF BD
6-12
Model 49i Instruction Manual
Reference
Designator
P1:A
P1:B
PJ1
PJ2
PJ3
Pin
Signal
Description
33
+24V
34
+24V
1
NC
2
Serial Port 1 RX (-RS485 IN)
3
Serial Port 1 TX (-RS485 OUT)
4
NC
5
Ground
6
NC
7
Serial Port 1 RTS (+RS485 OUT)
8
Serial Port 1 CTS (+RS485 IN)
9
NC
1
NC
2
Serial Port 2 RX (-RS485 IN)
3
Serial Port 2 TX (-RS485 OUT)
4
NC
5
Ground
6
NC
7
Serial Port 2 RTS (+RS485 OUT)
8
Serial Port 2 CTS (+RS485 IN)
9
NC
1
AC-HOT
2
AC-NEUT
3
AC-Ground
1
AC-HOT
2
AC-NEUT
3
AC-Ground
1
AC-HOT
2
AC-NEUT
3
AC-Ground
Thermo Fisher Scientific
Troubleshooting
Connector Pin Descriptions
Table 6-4. Front Panel Board Connector Pin Diagram
Thermo Fisher Scientific
Connector
Label
Reference
Designator
Pin
Signal
Description
MOTHER
BOARD
J1
1
Ground
2
Ground
3
LCLK – LCD Signal
4
Ground
5
Ground
6
LLP – LCD Signal
7
LFLM – LCD Signal
8
LD4 – LCD Signal
9
LD0 – LCD Signal
10
LD5 – LCD Signal
11
LD1 – LCD Signal
12
LD6 – LCD Signal
13
LD2 – LCD Signal
14
LD7 – LCD Signal
15
LD3 – LCD Signal
16
LCD Bias Voltage
17
+5V
18
Ground
19
Ground
20
LCD_ONOFF – LCD Signal
21
Keypad Row 2 Input
22
Keypad Row 1 Input
23
Keypad Row 4 Input
24
Keypad Row 3 Input
25
Keypad Col 2 Select
26
Keypad Col 1 Select
27
Keypad Col 4 Select
28
Keypad Col 3 Select
29
Ground
30
Ground
31
Ground
Model 49i Instruction Manual
6-13
Troubleshooting
Connector Pin Descriptions
Table 6-4. Front Panel Board Connector Pin Diagram, continued
Connector
Label
LCD DATA
KEYBOARD
LCD BACKLIGHT
6-14
Model 49i Instruction Manual
Reference
Designator
J2
J3
J4
Pin
Signal
Description
32
Ground
33
+24V
34
+24V
1
LD0_5V – LCD Signal
2
LD1_5V – LCD Signal
3
LD2_5V – LCD Signal
4
LD3_5V – LCD Signal
5
LCD_ONOFF_5V – LCD Signal
6
LFLM_5V – LCD Signal
7
NC
8
LLP_5V – LCD Signal
9
LCLK_5V – LCD Signal
10
+5V
11
Ground
12
-25V
13
LCD Bias Voltage
14
Ground
1
Keypad Row 1 Input
2
Keypad Row 2 Input
3
Keypad Row 3 Input
4
Keypad Row 4 Input
5
Keypad Col 1 Select
6
Keypad Col 2 Select
7
Keypad Col 3 Select
8
Keypad Col 4 Select
1
+5V
2
NC
3
Ground
Thermo Fisher Scientific
Troubleshooting
Connector Pin Descriptions
Table 6-5. I/O Expansion Board (Optional) Connector Pin Descriptions
Connector
Label
Reference
Designator
Pin
Signal
Description
EXPANSION I/O
J1
1
Analog Voltage Input 1
2
Analog Voltage Input 2
3
Analog Voltage Input 3
4
Ground
5
Analog Voltage Input 4
6
Analog Voltage Input 5
7
Analog Voltage Input 6
8
Ground
9
Analog Voltage Input 7
10
Analog Voltage Input 8
11
Ground
12
NC
13
Current Output Return
14
Ground
15
Current Output 1
16
Current Output Return
17
Current Output 2
18
Current Output Return
19
Current Output 3
20
Current Output Return
21
Current Output 4
22
Current Output Return
23
Current Output 5
24
Current Output Return
25
Current Output 6
1
+5V
2
+24V
3
+24V
4
Ground
5
Ground
6
Ground
MOTHER BD
Thermo Fisher Scientific
J2
Model 49i Instruction Manual
6-15
Troubleshooting
Connector Pin Descriptions
Table 6-5. I/O Expansion Board (Optional) Connector Pin Descriptions, continued
Connector
Label
Reference
Designator
Pin
Signal
Description
7
+RS485 to Motherboard
8
-RS485 to Motherboard
Table 6-6. Digital Output Board Connector Pin Descriptions
Connector
Label
Reference
Designator
Pin
Signal
Description
MOTHER BD
J1
1
+5V
2
+24V
3
+24V
4
Ground
5
Ground
6
Ground
7
SPI Reset
8
SPI Input
9
SPI Output
10
SPI Board Select
11
SPI Clock
1
Relay 1 Contact a
2
Relay 2 Contact a
3
Relay 3 Contact a
4
Relay 4 Contact a
5
Relay 5 Contact a
6
Relay 6 Contact a
7
Relay 7 Contact a
8
Relay 8 Contact a
9
Relay 9 Contact a
10
Relay 10 Contact a
11
NC
12
Solenoid Drive Output 1
13
Solenoid Drive Output 2
14
Solenoid Drive Output 3
DIGITAL
OUTPUTS
6-16
Model 49i Instruction Manual
J2
Thermo Fisher Scientific
Troubleshooting
Connector Pin Descriptions
Table 6-6. Digital Output Board Connector Pin Descriptions, continued
Connector
Label
Reference
Designator
Pin
Signal
Description
15
Solenoid Drive Output 4
16
Solenoid Drive Output 5
17
Solenoid Drive Output 6
18
Solenoid Drive Output 7
19
Solenoid Drive Output 8
20
Relay 1 Contact b
21
Relay 2 Contact b
22
Relay 3 Contact b
23
Relay 4 Contact b
24
Relay 5 Contact b
25
Relay 6 Contact b
26
Relay 7 Contact b
27
Relay 8 Contact b
28
Relay 9 Contact b
29
Relay 10 Contact b
30
+24V
31
+24V
32
+24V
33
+24V
34
+24V
35
+24V
36
+24V
37
+24V
Table 6-7. Measurement Interface Board Connector Pin Descriptions
Thermo Fisher Scientific
Connector
Label
Reference
Designator
Pin
Signal
Description
PHOTOMETER
J6
1
Photometer Lamp Intensity Control
Voltage Output
2
Photometer Lamp Intensity Control
Voltage Input
3
Photometer Heater Thermistor
Model 49i Instruction Manual
6-17
Troubleshooting
Connector Pin Descriptions
Table 6-7. Measurement Interface Board Connector Pin Descriptions, continued
Connector
Label
DATA
PRES
FLOW B
OZONATOR
CHA
CHB
6-18
Model 49i Instruction Manual
Reference
Designator
J4
J12
J8
J5
J9
J10
Pin
Signal
Description
4
+24V
5
Ground
6
Ground
7
Ground
8
Ground
1
Ground
2
+RS485 from Motherboard
3
-RS485 from Motherboard
1
Pressure Sensor Input
2
Ground
3
+15V
4
-15V
1
Sample Flow B Sensor Input
2
Ground
3
+15V
4
-15V
5
Ground
1
Ozonator Lamp Intensity Control
Voltage Output
2
Ozonator Lamp Intensity Control
Voltage Input
3
Ozonator Heater Thermistor
4
+24V
5
Ground
6
Ozonator Lamp On/off Control
7
Ground
8
Ground
1
+15V
2
-15V
3
Ground
4
Measurement Frequency A
1
+15V
2
-15V
Thermo Fisher Scientific
Troubleshooting
Connector Pin Descriptions
Table 6-7. Measurement Interface Board Connector Pin Descriptions, continued
Connector
Label
FLOW A
TEMP
24V IN
AC IN
FAN
AC PUMP
Z/S SOL.
SAMPLE SOL.
REF
OZ SOL.
Reference
Designator
J7
J11
J3
J1
J17
J2
J13
J14
J13
J16
Pin
Signal
Description
3
Ground
4
Measurement Frequency B
1
Sample Flow A Sensor Input
2
Ground
3
+15V
4
-15V
5
Ground
1
Bench Temperature Thermistor
2
Ground
1
+24V
2
Ground
1
AC-HOT
2
AC-NEUT
3
AC-Ground
1
+24V
2
Ground
1
AC-HOT
2
AC-NEUT - Switched
3
AC-Ground
1
+24V
2
Zero/Span Solenoid Control
1
+24V
2
Sample Solenoid Control
1
+24V
2
Reference Solenoid Control
1
+24V
2
Ozone Solenoid Control
Table 6-8. Ozonator Power Supply Connector Pin Descriptions
Thermo Fisher Scientific
Connector
Label
Reference
Designator
Pin
Signal
Description
LAMP
J1
1
Ozonator Lamp Voltage Out
Model 49i Instruction Manual
6-19
Troubleshooting
Connector Pin Descriptions
Table 6-8. Ozonator Power Supply Connector Pin Descriptions, continued
Connector
Label
LAMP HEATER
INTF
Reference
Designator
J2
J3
Pin
Signal
Description
2
Ozonator Lamp Voltage Return
1
Ground
2
Ozonator Lamp Thermistor 1
3
Ozonator Lamp Heater Control
4
Ground
5
+24V Heater Current Sense
6
Ozonator Lamp Thermistor 2
1
Ozonator Lamp Intensity Control
Voltage Input
2
Ozonator Lamp Intensity Control
Voltage Output
3
Ozonator Heater Thermistor
4
+24V
5
Ground
6
Ozonator Lamp On/off Control
7
Ground
8
Ground
Table 6-9. Photometer Power Supply Connector Pin Descriptions
Connector
Label
Reference
Designator
Pin
Signal
Description
LAMP
J1
1
Photometer Lamp Voltage Out
2
Photometer Lamp Voltage Return
1
Ground
2
Photometer Lamp Thermistor 1
3
Photometer Lamp Heater Control
4
Ground
5
+24V Heater Current Sense
6
Photometer Lamp Thermistor 2
1
Photometer Lamp Intensity Control
Voltage Input
2
Photometer Lamp Intensity Control
Voltage Output
LAMP HEATER
INTF
6-20
Model 49i Instruction Manual
J2
J3
Thermo Fisher Scientific
Troubleshooting
Service Locations
Table 6-9. Photometer Power Supply Connector Pin Descriptions, continued
Connector
Label
Service Locations
Reference
Designator
Pin
Signal
Description
3
Photometer Heater Thermistor
4
+24V
5
Ground
6
Photometer Lamp On/off Control
7
Ground
8
Ground
For additional assistance, service is available from exclusive distributors
worldwide. Contact one of the phone numbers below for product support
and technical information or visit us on the web at www.thermo.com/aqi.
1-866-282-0430 Toll Free
1-508-520-0430 International
Thermo Fisher Scientific
Model 49i Instruction Manual
6-21
Troubleshooting
Service Locations
6-22
Model 49i Instruction Manual
Thermo Fisher Scientific
Chapter 7
Servicing
This chapter explains how to replace the Model 49i subassemblies. It
assumes that a subassembly has been identified as defective and needs to be
replaced.
For fault location information refer to the “Preventive Maintenance”
chapter and the “Troubleshooting” chapter in this manual.
The service mode in the “Operation” chapter also includes parameters and
functions that are useful when making adjustments or diagnosing problems.
For additional service assistance, see “Service Locations” at the end of this
chapter.
This chapter includes the following parts information, testing, adjustment,
and calibration procedures, and component replacement procedures:
“Safety Precautions” on page 7-3
“Firmware Updates” on page 7-4
“Replacement Parts List” on page 7-4
“Cable List” on page 7-6
“External Device Connection Components” on page 7-6
“Removing the Measurement Bench and Lowering the Partition Panel” on
page 7-8
“Fuse Replacement” on page 7-9
“Pump Replacement” on page 7-10
“Fan Replacement” on page 7-11
“Analog Output Testing” on page 7-12
“Analog Output Calibration” on page 7-14
Thermo Fisher Scientific
Model 49i Instruction Manual
7-1
Servicing
“Analog Input Calibration” on page 7-15
“I/O Expansion Board Replacement (Optional)” on page 7-17
“Digital Output Board Replacement” on page 7-19
“Motherboard Replacement” on page 7-20
“Measurement Interface Board Replacement” on page 7-21
“Front Panel Board Replacement” on page 7-22
“LCD Module Replacement” on page 7-23
“Optical Bench Replacement” on page 7-24
“Optical Bench Temperature Calibration” on page 7-26
“Photometer Lamp Replacement” on page 7-27
“Photometer Lamp Voltage Adjustment” on page 7-28
“Photometer Board Replacement” on page 7-29
“Detector Replacement” on page 7-30
“Ozone Scrubber Replacement” on page 7-31
“Sample/Reference Solenoid Replacement” on page 7-32
“Zero/Span Solenoid Replacement (Optional)” on page 7-33
“Pressure Transducer Replacement” on page 7-33
“Pressure Transducer Calibration ” on page 7-34
“Flow Transducer Replacement” on page 7-36
“Flow Transducer Calibration” on page 7-37
“Ozonator Lamp Replacement (Optional)” on page 7-38
“Ozonator Lamp Heater Replacement (Optional)” on page 7-40
“Ozonator Replacement (Optional)” on page 7-41
7-2
Model 49i Instruction Manual
Thermo Fisher Scientific
Servicing
Safety Precautions
“Ozonator Board Replacement (Optional)” on page 7-41
“Service Locations” on page 7-42
Safety Precautions
Read the safety precautions before beginning any procedures in this chapter.
WARNING The service procedures in this manual are restricted to qualified
service representatives. If the equipment is operated in a manner not specified by the manufacturer,
the protection provided by the equipment may be impaired. Equipment Damage Some internal components can be damaged by small
amounts of static electricity. A properly grounded antistatic wrist strap must
be worn while handling any internal component (Figure 7-1). If an
antistatic wrist strap is not available, be sure to touch a grounded metal
object before touching any internal components. When the instrument is
unplugged, the chassis is not at earth ground. Handle all printed circuit boards by the edges. Do not remove the LCD panel or frame from the LCD module. The LCD polarizing plate is very fragile, handle it carefully. Do not wipe the LCD polarizing plate with a dry cloth, it may easily scratch
the plate. Do not use alcohol, acetone, MEK or other Ketone based or aromatic
solvents to clean the module, use a soft cloth moistened with a naphtha
cleaning solvent. Do not place the LCD module near organic solvents or corrosive gases. Do not shake or jolt the LCD module. Thermo Fisher Scientific
Model 49i Instruction Manual
7-3
Servicing
Firmware Updates
Figure 7-1. Properly Grounded Antistatic Wrist Strap
Firmware Updates
Accessing the
Service Mode
The firmware can be updated by the user in the field via the serial port or
over the Ethernet. This includes both the main processor firmware and the
firmware in all low-level processors. Refer to the iPort manual for the
firmware update procedure.
If the Service is not displayed on the Main Menu, use the following
procedure to display it.
a. At the Main Menu, press
to scroll to Instrument Controls >
press
>
to scroll to Service Mode > and press
.
The Service Mode screen appears.
b. Press
to toggle the Service Mode to ON.
c. Press
>
to return to the Main Menu.
d. Return to the procedure.
Replacement Parts
List
Table 7-1 lists the replacement parts for the Model 49i major subassemblies.
Refer to Figure 7-2 to identify the component location.
Table 7-1. Model 49i Replacement Parts
7-4
Model 49i Instruction Manual
Part Number
Description
100480-00
Front Panel Pushbutton Board
101491-15
Processor Board
100533-00
Motherboard
100539-00
Digital Output Board
100542-00
I/O Expansion Board (Optional)
Thermo Fisher Scientific
Servicing
Replacement Parts List
Table 7-1. Model 49i Replacement Parts, continued
Thermo Fisher Scientific
Part Number
Description
102340-00
Front Panel Connector Board
102496-00
Front Panel Display
101399-00
Transformer, 220-240VAC (Optional)
101863-00
Transformer, 100VAC (Optional)
100874-00
Measurement Interface Board
102554-00
Photometer Board
102458-00
Ozonator Assembly
8645
Ozonator Lamp
100895-00
Ozonator Power Supply Board
101023-00
Pressure Transducer Assembly
102055-00
Flow Transducer
102441-00
Sample/Reference Solenoid Assembly
102443-00
Sample/Reference Solenoid Valve
102455-00
Air Regulator Assembly (Optional)
102439-00
Optical Bench Assembly
8592
Detector Assembly
102472-00
Lamp Heater Assembly
8540
Photometer Lamp
100554-00
Photometer Board
101426-00
Pump 110VAC w/Plate and Fittings
102464-01
Pump, Zero Air Supply 110V (Optional)
102464-02
Pump, Zero Air Supply 220V (Optional)
101055-00
AC Receptacle Assembly
100907-00
Fan, 24VDC
8630
Fan Filter
4510
Fuse, 250VAC, 3.0 Amp, SloBlow (for 100VAC and 110VAC models)
14007
Fuse, 250VAC, 1.60 Amp, SloBlow (for 220-240VAC models)
4124
Capillary, Purple, 0.015 ID, (2)
102701-00
Teflon Particulate Filter
14697
Scrubber, Ozone
4291
Charcoal Scrubber Assembly
Model 49i Instruction Manual
7-5
Servicing
Cable List
Cable List
Table 7-2 describes the Model 49i cables. See the “Troubleshooting” chapter
for associated connection diagrams and board connector pin descriptions.
Table 7-2. Model 49i Cables
External Device
Connection
Components
Part Number
Description
101036-00
DC Power Supply, 24V Output
101037-00
115VAC Supply to Measurement Interface Board
101048-00
RS-485/Data
101038-00
AC Power Switch to Motherboard
101364-00
DC Power Supply Status Monitor
101054-00
Motherboard to Front Panel Board
101035-00
DC Power Supply AC Input
101033-00
AC from Receptacle
101377-00
AC to Power Switch
101055-00
Main AC Receptacle Assembly
101706-00
Measurement Interface Board to Photometer Board
102446-00
Measurement Interface Board to Ozonator Board
101267-00
Fan Power Cable
Table 7-3 lists the standard and optional cables and components used for
connecting external devices such as PCs and data loggers to an iSeries
instrument.
Table 7-3. External Device Connection Components
7-6
Model 49i Instruction Manual
Part Number
Description
102562-00
Terminal Block and Cable Kit (DB25) (optional)
102556-00
Terminal Block and Cable Kit (DB37) (optional)
102645-00
Cable, DB37M to Open End Cable, Six Feet (optional)
102646-00
Cable, DB37F to Open End, Six Feet (optional)
102659-00
Cable, DB25M to Open End, Six Feet (optional)
6219
Cable, RS-232 (optional)
102888-00
Terminal Board PCB Assembly, DB37F (standard with all
instruments)
102891-00
Terminal Board PCB Assembly, DB37M (standard with all
instruments)
103084-00
Terminal Board PCB Assembly, DB25M (included with
optional I/O Expansion Board in all instruments)
Thermo Fisher Scientific
Servicing
External Device Connection Components
Motherboard
Digital Output Board
Ozonator Board
Photometer Board
Ozonator Pump
I/O Expansion
Board (Optional)
Power Supply
Measurement
Interface Board
Fan
Solenoid Assembly
Sample Valve
Flow Transducer B
Reference Valve
Flow Transducer A
Detector Assembly B
Ozone Scrubber
Detector Assembly A
Photometer Lamp
Lamp Heater
Assembly
Optical Bench
Pressure Transducer
Figure 7-2. Component Layout
Thermo Fisher Scientific
Model 49i Instruction Manual
7-7
Servicing
Removing the Measurement Bench and Lowering the Partition Panel
Removing the
Measurement Bench
and Lowering the
Partition Panel
The measurement bench can be removed and the partition panel can be
lowered to improve access to connectors and components. Refer to the
following steps when a procedure requires lowering the partition panel (see
Figure 7-3).
Remove Screw
REMOVE SCREWS
SLIDE BENCH OUT
Pass Through
Connectors
Partition Panel
Loosen Captive Screw
LOWER PANEL
Remove Screw
Remove Hidden Screw
Remove Screws
Figure 7-3. Removing the Measurement Bench and Lowering the Partition Panel
Equipment Required:
Philips screwdriver
Equipment Damage Some internal components can be damaged by small
amounts of static electricity. A properly grounded antistatic wrist strap must
be worn while handling any internal component. 1. Turn instrument OFF and unplug the power cord.
2. If the instrument is mounted in a rack, remove it from the rack.
7-8
Model 49i Instruction Manual
Thermo Fisher Scientific
Servicing
Fuse Replacement
3. Remove the cover.
4. Disconnect the plumbing connections at the rear of the measurement
bench.
5. Disconnect the connectors that pass through the center of the partition
panel.
6. Remove two screws from the left side of the case (viewed from front).
7. Remove one screw from the bottom front of the case.
8. Remove one screw from the top front of the partition panel.
9. While holding the case securely, loosen the captive screw at the rear of
the measurement bench, and pull the measurement bench from the rear
of the case.
10. Remove the screw at the top rear of the partition panel securing the top
of partition panel to the measurement bench, and lower the panel being
careful not to put excessive tension on the cables.
11. Replace the measurement bench by following the previous steps in
reverse.
Fuse Replacement
Use the following procedure to replace the fuse.
Equipment Required:
Replacement fuses: refer to “Replacement Parts List” on page 7-4.
1. Turn instrument OFF and unplug the power cord.
2. Remove fuse drawer, located on the AC power connector.
Thermo Fisher Scientific
Model 49i Instruction Manual
7-9
Servicing
Pump Replacement
3. If either fuse is blown, replace both fuses.
4. Insert fuse drawer and reconnect power cord.
Pump Replacement
Use the following procedure to replace the pump (see Figure 7-4). To
rebuild the pump, see “Pump Rebuilding” in the “Preventive Maintenance”
chapter.
Equipment Required:
110V pump
Philips screwdriver
Equipment Damage Some internal components can be damaged by small
amounts of static electricity. A properly grounded antistatic wrist strap must
be worn while handling any internal component. 1. Turn instrument OFF, unplug the power cord, and remove the cover.
2. Disconnect pump power line from AC PUMP connector on the
measurement interface board.
Pump
Pump Bracket
Captive Screws (4)
Shock Mounts (4)
Floor Plate
Pump Mounting Screws (2)
(Bottom)
Figure 7-4. Replacing the Pump
3. Remove both lines from pump.
7-10
Model 49i Instruction Manual
Thermo Fisher Scientific
Servicing
Fan Replacement
4. Loosen the four captive screws on the mounting plate and remove the
pump.
5. Install the new pump by following the previous steps in reverse.
Fan Replacement
Use the following procedure to replace the fan (Figure 7-5).
Equipment Required:
Fan
Philips screwdriver
Equipment Damage Some internal components can be damaged by small
amounts of static electricity. A properly grounded antistatic wrist strap must
be worn while handling any internal component. 1. Turn instrument OFF, unplug the power cord, and remove the cover.
2. Remove the fan guard from the fan and remove the filter.
3. Pull the power connector off the fan.
4. Remove the four fan mounting screws and remove the fan.
Thermo Fisher Scientific
Model 49i Instruction Manual
7-11
Servicing
Analog Output Testing
5. Install a new fan following the previous steps in reverse.
Mounting Screws (4)
Filter
Fan Guard
Figure 7-5. Replacing a Fan
Analog Output Testing
The analog outputs should be tested if the concentration value on the front
panel display disagrees with the analog outputs. To check the analog
outputs, you connect a meter to an analog output channel (voltage or
current) and compare the meter reading with the output value displayed on
the Test Analog Outputs screen.
Equipment Required:
Multimeter
Use the following procedure to test the analog outputs.
1. Connect a meter to the channel to be tested. Figure 7-6 shows the
analog output pins and Table 7-4 identifies the associated channels.
2. From the Main Menu, press
to scroll to Diagnostics, press
>
to scroll to Test Analog Outputs, and press
.
The Test Analog Outputs screen displays.
3. Press
to scroll to the channel corresponding to the rear panel
terminal pins where the meter is connected, and press
.
The Set Analog Outputs screen displays.
7-12
Model 49i Instruction Manual
Thermo Fisher Scientific
Servicing
Analog Output Testing
4. Press
to set the output to zero.
The Output Set To line displays Zero.
5. Check that the meter is displaying a zero value. If the meter reading
differs by more than one percent, the analog outputs should be
adjusted. Refer to the “Analog Output Calibration” procedure that
follows.
6. Press
to set the output to full scale.
The Output Set To line displays Full Scale.
7. Check that the meter is displaying the full scale value. If the meter
reading differs by more than one percent, the analog outputs should be
adjusted. Refer to the “Analog Output Calibration” procedure that
follows.
8. Press
to reset the analog outputs to normal.
Current Outputs
Analog
Voltage
Inputs
Analog
Voltage
Outputs
Figure 7-6. Rear Panel Analog Input and Output Pins
Thermo Fisher Scientific
Model 49i Instruction Manual
7-13
Servicing
Analog Output Calibration
Table 7-4. Analog Output Channels and Rear Panel Pin Connections
Voltage
Channel
Pin
Current
Channel
Pin
1
14
1
15
2
33
2
17
3
15
3
19
4
34
4
21
5
17
5
23
6
36
6
25
Ground
16, 18, 19, 35, 37
Current Output Return
13, 16, 18, 20, 22, 24
Table 7-5. Analog Input Channels and Rear Panel Pin Connections
Analog Output
Calibration
Input Channel
Pin
1
1
2
2
3
3
4
5
5
6
6
7
7
9
8
10
Ground
4, 8, 11, 14
Use the following procedure to calibrate the analog outputs if a meter
reading in the “Analog Output Testing” procedure differed by more than
one percent or after replacing the optional I/O expansion board.
Equipment Required:
Multimeter
1. Connect a meter to the channel to be adjusted and set to voltage or
current as appropriate. Figure 7-6 shows the analog output pins and
Table 7-4 identifies the associated channels.
7-14
Model 49i Instruction Manual
Thermo Fisher Scientific
Servicing
Analog Input Calibration
2. From the Main Menu, press
to scroll to Service, press
to scroll to Analog Out Calibration, and press
.
>
The Analog Output Cal screen displays
Note If Service is not displayed, refer to ““Accessing the Service Mode” on
page 7-4, then return to the beginning of this step. 3. At the Analog Output Cal screen, press
to scroll to the voltage
channel or current channel corresponding to the rear panel terminal
pins where the meter is connected, then press
.
4. With the cursor at Calibrate Zero, press
.
The Analog Output Cal line displays Zero
Note When calibrating the analog output, always calibrate zero first and
then calibrate full scale. 5. Use
until the meter reads the value shown in the Set
Output To line, then press
to save the value.
6. Press
7. Press
to return to the previous screen.
to select Calibrate Full Scale.
8. Use
until the meter reads the value shown in the Set
Output To line, then press
to save the value.
Analog Input
Calibration
Calibrating the Input
Channels to Zero Volts
Thermo Fisher Scientific
Use the following procedures to calibrate the analog inputs after replacing
the optional I/O expansion board. These procedures include selecting
analog input channels, calibrating them to zero volts, and then calibrating
them to full scale using a known voltage source.
Use the following procedure to calibrate the input channels to zero volts.
Model 49i Instruction Manual
7-15
Servicing
Analog Input Calibration
1. From the Main Menu, press
to scroll to Service, press
to scroll to Analog Input Calibration, and press
.
>
The Analog Input Cal screen displays.
Note If Service is not displayed, refer to ““Accessing the Service Mode” on
page 7-4, then return to the beginning of this step. 2. At the Analog Input Cal screen, press
press
.
3. With the cursor at Calibrate Zero, press
to scroll to a channel, and
.
The screen displays the input voltage for the selected channel.
4. Make sure that nothing is connected to the channel input pins and press
to calibrate the input voltage on the selected channel to zero
volts.
The screen displays 0.00 V as the voltage setting.
5. Press
>
to return to the Analog Input Cal screen and
repeat Steps 2 through 4 to calibrate other input channels to zero as
necessary.
6. Continue with the “Calibrating the Input Channels to Full Scale”
procedure that follows.
Calibrating the Input
Channels to Full Scale
Use the following procedure to calibrate the input channels to full scale by
applying a known voltage to the channels.
Equipment Required:
DC voltage source (greater than 0 volts and less than 10 volts)
1. Connect the known DC voltage source to the input channel (1-8) to be
calibrated. Figure 7-6 shows the analog input pins and Table 7-5
identifies the associated channels.
7-16
Model 49i Instruction Manual
Thermo Fisher Scientific
Servicing
I/O Expansion Board Replacement (Optional)
2. From the Main Menu, press
to scroll to Service, press
to scroll to Analog Input Calibration, and press
.
>
The Analog Input Cal screen displays input channels 1-8.
3. At the Analog Input Cal screen, press
selected in Step 1, and press
.
4. Press
to scroll to the channel
to scroll to Calibrate Full Scale, and press
.
The screen displays the current input voltage for the selected channel.
5. Use
and
to enter the source voltage, and
press
to calibrate the input voltage for the selected channel to the
source voltage.
6. Press
>
to return to the input channels display and repeat
Steps 3-5 to calibrate other input channels to the source voltage as
necessary.
I/O Expansion Board
Replacement
(Optional)
Use the following procedure to replace the optional I/O expansion board
(Figure 7-7).
Note After replacing the optional I/O expansion board, calibrate the current
outputs and the analog voltage inputs. See the “Analog Output Calibration”
procedure and the “Analog Input Calibration” procedure in this chapter. Equipment Required:
I/O expansion board
Nut driver, 3/16-inch
Equipment Damage Some internal components can be damaged by small
amounts of static electricity. A properly grounded antistatic wrist strap must
be worn while handling any internal component. 1. Turn instrument OFF, unplug the power cord, and remove the cover.
Thermo Fisher Scientific
Model 49i Instruction Manual
7-17
Servicing
I/O Expansion Board Replacement (Optional)
2. Unplug the I/O expansion board cable from the EXPANSION BD
connector on the motherboard.
3. Remove the two standoffs holding the I/O expansion board connector
to the rear panel (Figure 7-8).
4. Pop off the board from the mounting studs and remove the board.
5. To install the I/O expansion board, follow previous steps in reverse.
6. Calibrate the analog current outputs and the analog voltage inputs as
described earlier in this chapter.
Motherboard Support Bracket
Mounting Studs
Motherboard
Digital Output Board
I/O Expansion Board (Opt)
Figure 7-7. Replacing the I/O Expansion Board (Optional)
7-18
Model 49i Instruction Manual
Thermo Fisher Scientific
Servicing
Digital Output Board Replacement
I/O Expansion Board
Motherboard
Digital Output Board
Figure 7-8. Rear Panel Board Connectors
Digital Output Board
Replacement
Use the following procedure to replace the digital output board
(Figure 7-7).
Equipment Required:
Digital output board
Nut driver, 3/16-inch
Equipment Damage Some internal components can be damaged by small
amounts of static electricity. A properly grounded antistatic wrist strap must
be worn while handling any internal component. 1. Turn instrument OFF, unplug the power cord, and remove the cover.
2. Remove the I/O expansion board (optional), if used. See the “I/O
Expansion Board Replacement” procedure in this chapter.
3. Disconnect the digital output board ribbon cable from the
motherboard.
Thermo Fisher Scientific
Model 49i Instruction Manual
7-19
Servicing
Motherboard Replacement
4. Using the nut driver, remove the two standoffs securing the board to the
rear panel (Figure 7-8).
5. Pop off the digital output board from the mounting studs and remove
the board.
6. To install the digital output board, follow previous steps in reverse.
Motherboard
Replacement
Use the following procedure to replace the motherboard (Figure 7-7).
Equipment Required:
Motherboard
Philips screwdriver
Nut driver, 3/16-inch
Equipment Damage Some internal components can be damaged by small
amounts of static electricity. A properly grounded antistatic wrist strap must
be worn while handling any internal component. 1. Turn instrument OFF, unplug the power cord, and remove the cover.
2. Remove the I/O expansion board (optional), if used. See the “I/O
Expansion Board Replacement” procedure in this chapter.
3. Remove the digital output board. See the “Digital Output Board
Replacement” procedure in this chapter.
4. Unplug all connectors from the motherboard. Note connector locations
to facilitate reconnection.
5. Using the nut driver, remove the eight standoffs securing the board to
the rear panel.
7-20
Model 49i Instruction Manual
Thermo Fisher Scientific
Servicing
Measurement Interface Board Replacement
6. Pop off the motherboard from motherboard support bracket, and
remove the motherboard.
7. To install the motherboard, follow previous steps in reverse.
8. Calibrate the analog voltage outputs as described earlier in this chapter
(all ranges).
Measurement
Interface Board
Replacement
Use the following procedure to replace the measurement interface board
(Figure 7-9).
Equipment Required:
Measurement interface board
Philips screwdriver
Equipment Damage Some internal components can be damaged by small
amounts of static electricity. A properly grounded antistatic wrist strap must
be worn while handling any internal component. 1. Refer to “Removing the Measurement Bench and Lowering the
Partition Panel” in this chapter to lower the partition panel, then
proceed to the next step below.
2. Unplug all connectors. Note the locations of the connectors to facilitate
reconnection.
3. Remove the two retaining screws from the top of the board.
Thermo Fisher Scientific
Model 49i Instruction Manual
7-21
Servicing
Front Panel Board Replacement
4. Pop off the measurement interface board from the two mounting studs
at the bottom of the board and remove the board.
Measurement
Interface
Board
Photometer Board
Ozonator Board
Figure 7-9. Replacing the Measurement Interface Board
5. To install the measurement interface board, follow previous steps in
reverse.
6. Re-install the measurement bench. Refer to “Removing the
Measurement Bench and Lowering the Partition Panel” in this chapter.
7. Calibrate the pressure transducer, flow transducers, and bench
temperature sensor as described earlier in this chapter.
Front Panel Board
Replacement
Use the following procedure to replace the front panel board (Figure 7-10).
Equipment Required:
Front panel board
Equipment Damage Some internal components can be damaged by small
amounts of static electricity. A properly grounded antistatic wrist strap must
be worn while handling any internal component. 1. Turn instrument OFF, unplug the power cord, and remove the cover.
7-22
Model 49i Instruction Manual
Thermo Fisher Scientific
Servicing
LCD Module Replacement
2. Remove the three ribbon cables and the two-wire connector from the
front panel board.
3. Pop off the board from the two top mounting studs and remove the
board by lifting it up and off the slotted bottom support.
4. Replace the front panel board by following previous steps in reverse.
LCD Module
LCD Module Screws
Front Panel Board
Mounting Studs (2)
Ribbon Cables (3)
Two-Wire Connector
Bottom Support
Figure 7-10. Replacing the Front Panel Board and the LCD Module
LCD Module
Replacement
Use the following procedure to replace the LCD module (Figure 7-10).
Equipment Required:
LCD module
Philips screwdriver
CAUTION If the LCD panel breaks, do not to let the liquid crystal contact
your skin or clothes. If the liquid crystal contacts your skin or clothes, wash
it off immediately using soap and water. Thermo Fisher Scientific
Model 49i Instruction Manual
7-23
Servicing
Optical Bench Replacement
Equipment Damage Some internal components can be damaged by small
amounts of static electricity. A properly grounded antistatic wrist strap must
be worn while handling any internal component. Do not remove the panel or frame from the LCD module. The LCD polarizing plate is very fragile, handle it carefully. Do not wipe the LCD polarizing plate with a dry cloth, it may easily scratch
the plate. Do not use alcohol, acetone, MEK or other Ketone based or aromatic
solvents to clean the LCD module, use a soft cloth moistened with a
naphtha cleaning solvent. Do not place the LCD module near organic solvents or corrosive gases. Do not shake or jolt the LCD module. 1. Turn instrument OFF, unplug the power cord, and remove the cover.
2. Disconnect the ribbon cable and the two-wire connector from the front
panel board.
3. Remove the four screws at the corners of the LCD module.
4. Slide the LCD module out towards the right and rear of the instrument.
5. Replace the LCD module by following previous steps in reverse.
Optical Bench
Replacement
Use the following procedure to replace the optical bench (Figure 7-11).
Equipment required:
Optical bench
7-24
Model 49i Instruction Manual
Thermo Fisher Scientific
Servicing
Optical Bench Replacement
Screwdriver, flatblade
Equipment Damage Some internal components can be damaged by small
amounts of static electricity. A properly grounded antistatic wrist strap must
be worn while handling any internal component. Use the following procedure to replace the optical bench.
1. Turn instrument OFF, unplug the power cord, and remove the cover.
2. Disconnect the plumbing and electrical connections.
3. Remove the two screws from the photometer lamp access hole cover on
the rear panel and remove the cover.
4. Loosen the captive screws (4) securing the optical bench to the floor
plate (Figure 7-11) and remove the bench by first moving the
photometer slightly towards the rear through the lamp access hole and
then lifting up and towards the front.
Photometer Lamp
Lamp Heater
Access Port Cell B IN
Absorption Cell B
Access Port Cell A IN
Access Port Cell B OUT
Input Block
Captive Screws (4)
Absorption Cell A
Detector B
Access Port Cell A OUT
Output Block
Detector A
Figure 7-11. Replacing the Optical Bench
Thermo Fisher Scientific
Model 49i Instruction Manual
7-25
Servicing
Optical Bench Temperature Calibration
5. Perform the previous steps in reverse to install the new optical bench.
6. Calibrate the instrument. Refer to the “Calibration” chapter in this
manual.
Optical Bench
Temperature
Calibration
Use the following procedure to calibrate the optical bench temperature.
Equipment Required:
Calibrated thermometer or 10K ±1% Resistor
WARNING The service procedures in this manual are restricted to qualified
service representatives. If the equipment is operated in a manner not specified by the manufacturer,
the protection provided by the equipment may be impaired. Equipment Damage Some internal components can be damaged by small
amounts of static electricity. A properly grounded antistatic wrist strap must
be worn while handling any internal component. 1. Remove the instrument cover.
2. Tape the thermistor (plugged into the measurement interface board) to a
calibrated thermometer.
Note Since the thermistors are interchangeable to an accuracy of ±0.2 °C,
and have a value of 10K ohms at 25 °C, an alternate procedure is to connect
an accurately known 10K resistor to the thermistor input (TEMP) on the
measurement interface board, and enter the temperature reading. A 1 °C change corresponds to a ±5% change in resistance, thus this
alternative procedure can be quite accurate as a check; however, it clearly is
not NIST traceable. 3. From the Main Menu, press
to scroll to Service > press
to scroll to Temperature Calibration > and press
.
7-26
Model 49i Instruction Manual
>
Thermo Fisher Scientific
Servicing
Photometer Lamp Replacement
The Calibrate Bench Temp screen appears.
Note If Service is not displayed, refer to ““Accessing the Service Mode” on
page 7-4, then return to the beginning of this step. 4. Wait at least 10 seconds for the reading to stabilize, use
and
to enter the known temperature, and press
save the temperature value.
to
5. Remove thermometer or replace thermistor if removed.
6. Install the cover.
Photometer Lamp
Replacement
Use the following procedure to replace the photometer lamp (Figure 7-11).
Equipment required:
Photometer lamp
Allen wrench, 7/64-inch and 3/32-inch
Philips screwdriver
Equipment Damage Some internal components can be damaged by small
amounts of static electricity. A properly grounded antistatic wrist strap must
be worn while handling any internal component. Use the following procedure to replace the photometer lamp.
1. Turn instrument OFF, unplug the power cord, and remove the cover.
2. Disconnect the photometer lamp cable from the LAMP connector on
the photometer board.
3. Remove the two screws from the photometer lamp access hole cover on
the rear panel and remove the cover.
4. Slide the insulation off the end of the lamp.
Thermo Fisher Scientific
Model 49i Instruction Manual
7-27
Servicing
Photometer Lamp Voltage Adjustment
5. Loosen the Allen screw on the lamp clamp.
6. Loosen the two screws holding the clamp to the optical bench.
7. Carefully slide the lamp out of the bench and instrument case through
the access hole.
8. Carefully slide new lamp into place until it bottoms. Loosely tighten the
Allen screw on the clamp. Tighten two screws holding clamp to optical
bench. Pull lamp out approximately 1/32-inch to 1/16-inch to allow for
expansion when the lamp warms up. Tighten the Allen screw on the
clamp.
9. Plug the new photometer lamp cable into the LAMP connector on the
photometer board.
10. Slide the insulation back on the end of the lamp.
11. Replace access hole cover and secure with the two retaining screws.
12. Re-install the instrument cover.
13. Reconnect power and turn instrument ON.
14. After lamp has stabilized (approximately 15 minutes), refer to the
“Photometer Lamp Voltage Adjustment” procedure that follows to
adjust the photometer lamp voltage.
Photometer Lamp
Voltage Adjustment
Use the following procedure to adjust the photometer lamp voltage until the
output from each detector is approximately 100 kHz.
Note After turning power ON, wait for the lamp to stabilize (approximately
15 minutes) before beginning the following lamp voltage adjustment
procedure. 7-28
Model 49i Instruction Manual
Thermo Fisher Scientific
Servicing
Photometer Board Replacement
1. From the Main Menu, press
to scroll to Service > press
to scroll to Lamp Setting > and press
.
>
The Bench Lamp Setting screen appears.
Note If Service is not displayed, refer to ““Accessing the Service Mode” on
page 7-4, then return to the beginning of this step. 2. At the Bench Lamp Setting screen, use
to
increment/decrement the Lamp Setting % until Cell A Int and Cell B
Int indicate approximately 100,000 Hz.
3. Press
Photometer Board
Replacement
to save the setting.
Use the following procedure to replace the photometer board (Figure 7-9).
Equipment required:
Photometer board
Philips screwdriver
Equipment Damage Some internal components can be damaged by small
amounts of static electricity. A properly grounded antistatic wrist strap must
be worn while handling any internal component. Use the following procedure to replace the photometer board.
1. Turn instrument OFF, unplug the power cord, and remove the cover.
2. Remove the cables from the board. Note the locations to facilitate
reconnection.
3. Remove the two screws from the top of the board.
4. Pop off the board from the bottom mounting studs and remove the
board.
Thermo Fisher Scientific
Model 49i Instruction Manual
7-29
Servicing
Detector Replacement
5. To install the new photometer board, follow previous steps in reverse.
Detector
Replacement
Use the following procedure to replace a detector (Figure 7-11).
Equipment Required:
Detector assembly
Allen wrench, 9/64-inch and 1/16-inch
Equipment Damage Some internal components can be damaged by small
amounts of static electricity. A properly grounded antistatic wrist strap must
be worn while handling any internal component. 1. Turn instrument OFF, unplug the power cord, and remove the cover.
2. Disconnect the detector electrical connections (CHA and CHB) from
the measurement interface board.
3. Loosen the two screws securing the detector clamping block to the
optical bench and remove the clamping block and detectors
(Figure 7-12).
Clamping Block Screws (2)
Detector Screws (2)
Clamping Block
Detectors
Figure 7-12. Replacing the Detectors
7-30
Model 49i Instruction Manual
Thermo Fisher Scientific
Servicing
Ozone Scrubber Replacement
4. Loosen the Allen screw(s) securing the detector(s) in detector block and
remove the detector(s).
5. Install the new detector(s) by following the above steps in reverse.
6. Calibrate the instrument. Refer to the “Calibration” chapter in this
manual.
Ozone Scrubber
Replacement
Use the following procedure to replace the ozone scrubber.
Equipment required:
Ozone scrubber
Open-end wrench, 5/8-inch
Equipment Damage Some internal components can be damaged by small
amounts of static electricity. A properly grounded antistatic wrist strap must
be worn while handling any internal component. Use the following procedure to replace the ozone scrubber.
1. Turn instrument OFF, unplug the power cord, and remove the cover.
2. Loosen fittings on each end of the scrubber and remove the tubing.
3. Remove the scrubber from the spring clip.
4. Replace scrubber by following the previous procedure in reverse. Make
sure that the tube ends have passed through the ferrule of the fitting and
that the fittings are tight.
5. Re-install the instrument cover.
6. Perform a leak test. Refer to the “Ozone Scrubber Test” in the
“Preventive Maintenance” chapter.
Thermo Fisher Scientific
Model 49i Instruction Manual
7-31
Servicing
Sample/Reference Solenoid Replacement
7. Calibrate the instrument. Refer to the “Calibration” chapter in this
manual.
Sample/Reference
Solenoid
Replacement
Use the following procedure to replace a sample/reference solenoid valve.
Equipment required:
Solenoid
Flatblade screwdriver
Open-end wrench, 5/8-inch
Equipment Damage Some internal components can be damaged by small
amounts of static electricity. A properly grounded antistatic wrist strap must
be worn while handling any internal component. 1. Turn instrument OFF, unplug the power cord, and remove the cover.
2. Disconnect the Sample and Ref connection cables from the
measurement interface board.
3. Remove the plumbing from the solenoids.
4. Loosen the four captive screws and lift out the solenoids and the
solenoid plate.
5. Remove the solenoid retaining nuts from the underside of the faulty
solenoid and remove the solenoid.
6. Replace the new solenoid by following the previous steps in reverse
making sure that all connections are tight.
7. Perform a leak test. Refer to the “Solenoid Leaks” procedure in the
“Preventive Maintenance” chapter.
7-32
Model 49i Instruction Manual
Thermo Fisher Scientific
Servicing
Zero/Span Solenoid Replacement (Optional)
Zero/Span Solenoid
Replacement
(Optional)
Use the following procedure to replace the optional zero/span solenoid
valve.
Equipment Required:
Span/zero solenoid valve
Nut driver - 5/16-inch
Equipment Damage Some internal components can be damaged by small
amounts of static electricity. A properly grounded antistatic wrist strap must
be worn while handling any internal component. 1. Turn instrument OFF, unplug the power cord, and remove the cover.
2. Remove tubing from the solenoid fittings.
3. Remove the solenoid bracket assembly by removing the two nuts
holding bracket to rear panel.
4. Remove solenoid from bracket by removing two nuts holding solenoid
to bracket.
5. Install new solenoid by following the above procedure in reverse.
6. Perform a leak test.
Pressure Transducer
Replacement
Use the following procedure to replace the pressure transducer.
Equipment Required:
Pressure transducer assembly
Philips screwdriver
Equipment Damage Some internal components can be damaged by small
amounts of static electricity. A properly grounded antistatic wrist strap must
be worn while handling any internal component. Thermo Fisher Scientific
Model 49i Instruction Manual
7-33
Servicing
Pressure Transducer Calibration
1. Turn instrument OFF, unplug the power cord, and remove the cover.
2. Disconnect plumbing from the pressure transducer assembly. Note the
plumbing connections to facilitate reconnection.
3. Disconnect the pressure transducer PRESS connector from the
measurement interface board.
4. Loosen the two pressure transducer retaining screws and remove the
pressure transducer by sliding it towards the front of the instrument.
5. Install the new pressure transducer assembly by following the previous
steps in reverse.
6. Calibrate the pressure transducer. Refer to the “Pressure Transducer
Calibration” procedure that follows.
Pressure Transducer
Calibration
Use the following procedure to calibrate the pressure transducer.
Equipment Required:
Vacuum pump
WARNING The service procedures in this manual are restricted to qualified
service representatives. If the equipment is operated in a manner not specified by the manufacturer,
the protection provided by the equipment may be impaired. Equipment Damage Some internal components can be damaged by small
amounts of static electricity. A properly grounded antistatic wrist strap must
be worn while handling any internal component. 7-34
Model 49i Instruction Manual
Thermo Fisher Scientific
Servicing
Pressure Transducer Calibration
Note An error in the zero setting of the pressure transducer does not
introduce a measurable error in the output concentration reading.
Therefore, if only a barometer is available and not a vacuum pump, only
adjust the span setting.
A rough check of the pressure accuracy can be made by obtaining the
current barometric pressure from the local weather station or airport and
comparing it to the pressure reading. However, since these pressures are
usually corrected to sea level, it may be necessary to correct the reading to
local pressure by subtracting 0.027 mm Hg per foot of altitude.
Do not try to calibrate the pressure transducer unless the pressure is known
accurately. 1. Remove the cover.
2. Disconnect the tubing from the pressure transducer and connect a
vacuum pump known to produce a vacuum less than 1 mm Hg.
3. From the Main Menu, press
to scroll to Service > press
to scroll to Pressure Calibration > and press
.
>
The Pressure Sensor Cal screen appears.
Note If Service is not displayed, refer to ““Accessing the Service Mode” on
page 7-4, then return to the beginning of this step. 4. At the Pressure Sensor Cal screen, press
to select Zero.
The Calibrate Pressure Zero screen appears.
5. Wait at least 10 seconds for the zero reading to stabilize, then press
to save the zero pressure value.
6. Disconnect the pump from the pressure transducer.
7. Press
Thermo Fisher Scientific
to return to the Pressure Sensor Cal screen.
Model 49i Instruction Manual
7-35
Servicing
Flow Transducer Replacement
8. At the Pressure Sensor Cal screen, press
to select Span.
The Calibrate Pressure Span screen appears.
9. Wait at least 10 seconds for the ambient reading to stabilize, use
and
to enter the known barometric
pressure, and press
to save the pressure value.
10. Reconnect the instrument tubing to the pressure transducer.
11. Install the cover.
Flow Transducer
Replacement
Use the following procedure to replace the flow transducer.
Equipment Required:
Flow transducer
Philips screwdriver
Wrench, 5/16-inch
Equipment Damage Some internal components can be damaged by small
amounts of static electricity. A properly grounded antistatic wrist strap must
be worn while handling any internal component. 1. Turn instrument OFF, unplug the power cord, and remove the cover.
2. Disconnect plumbing from the flow transducer.
3. Disconnect the flow transducer cable (FLOW A or FLOW B) from the
measurement interface board.
4. Loosen the retaining nuts (2) and remove the faulty flow transducer
from the mounting bracket.
7-36
Model 49i Instruction Manual
Thermo Fisher Scientific
Servicing
Flow Transducer Calibration
5. Install the new flow transducer by following the previous steps in
reverse.
6. Calibrate the flow transducer. Refer to the “Flow Transducer
Calibration” procedure that follows.
Flow Transducer
Calibration
Use the following procedure to calibrate the flow transducer.
Equipment Required:
Flow sensor
WARNING The service procedures in this manual are restricted to qualified
service representatives. If the equipment is operated in a manner not specified by the manufacturer,
the protection provided by the equipment may be impaired. Equipment Damage Some internal components can be damaged by small
amounts of static electricity. A properly grounded antistatic wrist strap must
be worn while handling any internal component. 1. Remove the cover.
2. Disconnect the pump cable from AC PUMP connector on the
measurement interface board.
3. From the Main Menu, press
to scroll to Service > press
>
to scroll to Flow A Calibration or Flow B Calibration > and
press
.
Depending on your selection, the Flow A Sensor Cal or Flow B Sensor
Cal screen appears. For this procedure, Flow A Sensor Cal is used.
Note If Service is not displayed, refer to ““Accessing the Service Mode” on
page 7-4, then return to the beginning of this step. Thermo Fisher Scientific
Model 49i Instruction Manual
7-37
Servicing
Ozonator Lamp Replacement (Optional)
4. At the Flow A Sensor Cal screen, press
to select Zero.
The Calibrate Flow A Zero screen appears.
5. Wait at least 10 seconds for the zero reading to stabilize, then press
to save the zero flow value.
6. Reconnect the pump cable to the AC PUMP connector on the
measurement interface board.
7. Connect a calibrated flow sensor at the SAMPLE bulkhead on the rear
panel.
8. Press
to return to the Flow A Sensor Cal screen.
9. At the Flow A Sensor Cal screen, press
to select Span.
The Calibrate Flow A Span screen appears.
10. Wait at least 10 seconds for the reading to stabilize, use
and
to enter the flow sensor reading, and press
save the value.
to
11. Install the cover.
Ozonator Lamp
Replacement
(Optional)
Use the following procedure to replace the ozonator lamp.
Equipment Required:
Ozonator lamp
Allen wrench, 7/64-inch
Equipment Damage Some internal components can be damaged by small
amounts of static electricity. A properly grounded antistatic wrist strap must
be worn while handling any internal component. 7-38
Model 49i Instruction Manual
Thermo Fisher Scientific
Servicing
Ozonator Lamp Replacement (Optional)
1. Turn instrument OFF, unplug the power cord, and remove the cover.
2. Unplug the ozonator lamp cable from the LAMP connector on
ozonator board (Figure 7-13).
Ozonator Board
Figure 7-13. Ozonator Board Location
3. Slide insulation off the lamp handle onto the lamp cord.
4. Loosen both lamp clamp screws.
5. Carefully slide lamp out of ozonator housing.
6. Slide insulation off of old lamp and slide onto new lamp cord.
7. Carefully insert new lamp into ozonator housing until it bottoms. Pull
lamp out approximately 1/16-inch (to allow for expansion when the
lamp warms up) and tighten the Allen screws on the clamp.
8. Slide the lamp insulation against the ozonator.
9. Re-connect the ozonator LAMP connector to the ozonator board.
10. Replace the cover and reconnect power.
Thermo Fisher Scientific
Model 49i Instruction Manual
7-39
Servicing
Ozonator Lamp Heater Replacement (Optional)
Ozonator Lamp Heater
Replacement
(Optional)
Use the following procedure to replace the ozonator lamp heater.
Equipment Required:
Ozonator lamp heater
Allen wrenches: 3/32-inch, 7/64-inch
Philips screwdriver
Heat conductive compound
Equipment Damage Some internal components can be damaged by small
amounts of static electricity. A properly grounded antistatic wrist strap must
be worn while handling any internal component. 1. Turn instrument OFF, unplug the power cord, and remove the cover.
2. Unplug heater cable from the LAMP HEATER and LAMP connectors
on the ozonator board (Figure 7-13).
3. Disconnect plumbing from the ozonator.
4. Remove the ozonator by removing the two screws securing the ozonator
to the floor plate and lifting the ozonator straight up.
5. Remove the ozonator flange by removing three screws securing the
bottom flange and pulling the flange off.
6. Remove the ozonator lamp heater block from the ozonator by removing
four Allen screws.
7. Coat new lamp heater block with thin film of heat conductive
compound.
8. Install new ozonator lamp heater block by following the above
procedure in reverse.
7-40
Model 49i Instruction Manual
Thermo Fisher Scientific
Servicing
Ozonator Replacement (Optional)
9. Re-install the instrument cover.
Ozonator
Replacement
(Optional)
Use the following procedure to replace the ozonator.
Equipment Required:
Philips screwdriver
Equipment Damage Some internal components can be damaged by small
amounts of static electricity. A properly grounded antistatic wrist strap must
be worn while handling any internal component. 1. Turn instrument OFF, unplug the power cord, and remove the cover.
2. Unplug heater cable from the LAMP HEATER and LAMP connectors
on the ozonator board (Figure 7-13).
3. Disconnect plumbing from the ozonator.
4. Remove the ozonator by removing the two screws securing the ozonator
to the floor plate and lifting the ozonator straight up.
5. Install new ozonator by following the above procedure in reverse.
6. Re-install the instrument cover.
Ozonator Board
Replacement
(Optional)
Use the following procedure to replace the ozonator board (Figure 7-13).
Equipment Required:
Ozonator board
Philips screwdriver
Equipment Damage Some internal components can be damaged by small
amounts of static electricity. A properly grounded antistatic wrist strap must
be worn while handling any internal component. Thermo Fisher Scientific
Model 49i Instruction Manual
7-41
Servicing
Service Locations
1. Turn instrument OFF, unplug the power cord, and remove the cover.
2. Remove the connection cables from the board.
3. Remove the two screws from the top of the board.
4. Pop off the board from the bottom mounting studs and remove the
board.
5. To install the new ozonator board, follow previous steps in reverse.
Service Locations
For additional assistance, service is available from exclusive distributors
worldwide. Contact one of the phone numbers below for product support
and technical information or visit us on the web at www.thermo.com/aqi.
1-866-282-0430 Toll Free
1-508-520-0430 International
7-42
Model 49i Instruction Manual
Thermo Fisher Scientific
Chapter 8
System Description
This chapter describes the function and location of the system components,
provides an overview of the software structure, and includes a description of
the system electronics and input/output connections and functions.
Hardware
Thermo Fisher Scientific
•
“Hardware” on page 8-1 describes the analyzer components.
•
“Software” on page 8-3 provides an overview of the software
organization and detailed information on the software tasks.
•
“Electronics” on page 8-5 describes the system boards, assemblies, and
connectors.
•
“I/O Components” on page 8-8 describes the input and output
communication functions and components.
The Model 49i components include (Figure 8-1):
•
Optical bench with photometer lamp
•
Detector system
•
Flow transducers
•
Pressure transducer
•
Ozonator assembly
•
Ozonator lamp power supply
•
Photometer lamp power supply
•
Optical bench temperature thermistor
•
Pump
•
Sample/Reference Solenoid Valves
Model 49i Instruction Manual
8-1
System Description
Hardware
Motherboard
Digital Output Board
Ozonator Board
Photometer Board
Ozonator Pump
I/O Expansion
Board (Optional)
Power Supply
Measurement
Interface Board
Fan
Solenoid Assembly
Sample Valve
Flow Transducer B
Reference Valve
Flow Transducer A
Detector Assembly A
Ozone Scrubber
Detector Assembly B
Photometer Lamp
Lamp Heater
Assembly
Optical Bench
Pressure Transducer
Figure 8-1. Hardware Components
Optical Bench with
Photometer Lamp
The optical bench has two airtight chambers that contain the sample and
reference gases with a common photometer lamp at one end and two
individual detectors at the other end.
Detector System
The photo-diode in each detector transmits light intensity information to
the measurement interface board for sample measurement computations.
Flow Transducers
Pressure Transducer
8-2
Model 49i Instruction Manual
Flow transducers monitor the flow of the sample and reference gases and
transmit the data to the measurement interface board.
The pressure transducer measures the pressure of the sample gas.
Thermo Fisher Scientific
System Description
Software
Ozonator Assembly
Ozonator Lamp Power
Supply
Photometer Lamp Power
Supply
Optical Bench
Temperature Thermistor
Pump
The optional internal ozonator operates on the photolytic principle. The
ozone level produced is a function of light intensity at 185 nm and gas flow.
The light intensity is varied by changing the current into the lamp. The gas
flow is held constant by a pressure regulator followed by a capillary.
The optional ozonator lamp power supply generates high voltage AC and
contains heater control circuits for the ozonator lamp.
The photometer lamp power supply generates high voltage AC and contains
heater control circuits for the photometer lamp.
The optical bench temperature thermistor is used for maintaining the
optical bench at a constant temperature.
The pump draws the zero air through the optical bench.
Note Total flows of less than 1 LPM (2 scfh) should be avoided since the
flush time would be excessive. Total flows of greater than 3 LPM should also
be avoided since there would not be enough residence time in the converter
to ensure greater than 99% conversion of the ozone. Sample/Reference
Solenoid Valves
Software
Thermo Fisher Scientific
The sample/reference solenoid valves allow sample gas to pass through Cell
A and reference gas through Cell B, or vise versa, depending upon which
cycle the instrument is performing.
The processor software tasks are organized into four areas:
•
Instrument Control
•
Monitoring Signals
•
Measurement Calculations
•
Output Communication
Model 49i Instruction Manual
8-3
System Description
Software
Instrument Control
Low-level embedded processors are used to control the various functions on
the boards, such as analog and digital I/O and heater control. These
processors are controlled over a serial interface with a single high-level
processor that also controls the front-panel user interface. The low-level
processors all run a common piece of firmware that is bundled with the
high-level firmware and loaded on power-up if a different version is
detected.
Each board has a specific address that is used to identify to the firmware
what functions are supported on that board. This address is also used for the
communications between the low-level processors and the high-level
processor.
Every tenth of a second the frequency counters, analog I/O, and digital I/O
are read and written to by the low-level processor. The counters are
accumulated over the past second and the analog inputs are averaged over
that second. The high-level processor polls the low-level processors once per
second to exchange the measurement and control data.
Monitoring Signals
The instrument includes a sample solenoid valve and a reference solenoid
valve. The instrument can be configured to measure O3 every ten seconds
(standard cycle) or every four seconds (fast cycle). Every cycle, the two
solenoid valves switch the sample gas and reference gas streams between the
two cells. One cell contains sample gas, the other cell contains reference gas
and vice versa.
During a standard cycle, the cells are purged for seven seconds and
measurements are taken for three seconds. During a fast cycle, the cells are
purged for three seconds and measurements are taken for one second.
Measurement
Calculations
During every cycle, the instrument calculates the natural logarithm of the
sample gas frequency to reference gas frequency ratio in each cell and
averages these results to optimize instrument accuracy. These logarithms
provide the basis for calculating the ozone concentrations. The logarithms
are stored in a rolling stack of 30 logarithms which are averaged by the
instrument’s averaging time function.
The background values for O3 are corrected for temperature, pressure, and
span and are subtracted from the ozone calculated to yield a corrected value.
8-4
Model 49i Instruction Manual
Thermo Fisher Scientific
System Description
Electronics
Output Communication
The front panel display, serial and Ethernet data ports, and analog outputs
are used to communicate the results of the measurement calculations. The
front panel displays the O3 concentration. The display is updated every ten
seconds (standard cycle) or every four seconds (fast cycle).
The analog output ranges are user selectable via software. The analog
outputs are defaulted based on the measurement range. The defaults are
calculated by dividing the data values by the full-scale range for each of the
three parameters and then multiplying each result by the user-selected
output range. Negative concentrations can be represented as long as they are
within -5% of full-scale. The zero and span values may be set by the user to
any desired value.
Electronics
All electronics operate from a universal switching supply, which is capable of
auto-sensing the input voltage and working over the entire operating range.
Internal pumps and heaters all operate on 110VAC. An optional
transformer is required if operating on the 210-250VAC or 90-110VAC
ranges.
An on/off switch controls all power to the instrument, and is accessible on
the front panel.
Motherboard
External Connectors
Thermo Fisher Scientific
The motherboard contains the main processor, power supplies, a
sub-processor and serves as the communication hub for the instrument.
The motherboard receives operator inputs from the front panel mounted
function key panel and/or over I/O connections on the rear panel and sends
commands to the other boards to control the functions of the instrument
and to collect measurement and diagnostic information. The motherboard
outputs instrument status and measurement data to the front-panel
mounted graphics display and to the rear-panel I/O. The motherboard also
contains I/O circuitry and the associated connector to monitor external
digital status lines and to output analog voltages that represent the
measurement data. Connectors located on the motherboard include:
External connectors include:
•
External Accessory
•
RS-232/485 Communications (two connectors)
•
Ethernet Communications
Model 49i Instruction Manual
8-5
System Description
Electronics
•
Internal Connectors
8-6
I/O connector with Power Fail Relay, 16 Digital Inputs, and 6 Analog
Voltage Outputs.
Internal connectors include:
•
Function key panel and Display
•
Measurement Interface Board Data
•
I/O Expansion Board Data
•
Digital Output Board
•
AC distribution
Measurement Interface
Board
The measurement interface board serves as a central connection area for all
measurement electronics in the instrument. It contains power supplies and
interface circuitry for sensors and control devices in the measurement
system. It sends status data to the motherboard and receives control signals
from the motherboard.
Measurement Interface Board
Connectors
Connectors located on the measurement interface board include:
Model 49i Instruction Manual
•
Data communication with the motherboard
•
24V and 120VAC power supply inputs
•
Fan and solenoid outputs
•
120VAC outputs for the pump
•
Flow and pressure sensors inputs
•
Detector board inputs - CH A and CH B
•
Optical bench temperature thermistor
•
Photometer lamp power supply
Thermo Fisher Scientific
System Description
Electronics
Flow Sensor Assembly
The flow sensor assembly consists of a board containing an instrumentation
amplifier and a flow transducer with input and output gas fittings. The flow
transducer output is produced by measuring the pressure difference across a
precision orifice. This unit is used for measuring the flow of sample gas in
the measurement system.
Pressure Sensor Assembly
The pressure sensor assembly consists of a board containing an
instrumentation amplifier and a pressure transducer with a gas input fitting.
The pressure transducer output is produced by measuring the pressure
difference between the sample gas pressure and ambient air pressure.
Ozonator Lamp Power Supply
The ozonator lamp power supply board includes the circuits that generate
high voltage AC to control the lamp heater. A transformer outputting high
voltage at approximately 15 kHz drives the lamp. A resistor in series with
the output limits the lamp current. The voltage output is adjustable under
software control for lamp intensity control. The ozonator lamp can be
switched on and off under software control.
The lamp is heated to a specific temperature to ensure reliable operation.
The oscillator circuit that drives the high voltage output is inhibited until
this operating temperature is reached. A power transistor is used to heat the
lamp housing. Thermistors sense the housing temperature for heater control
and for status information.
Photometer Lamp Power Supply
The photometer lamp power supply is similar to the ozonator power supply
except for the operating temperature set point and the value of the resistor
in series with the output. The photometer is always “on” when the
operating temperature is reached. Software on/off control is not required.
Digital Output Board
The digital output board connects to the motherboard and provides
solenoid driver outputs and relay contact outputs to a connector located on
the rear panel of the instrument. Ten relay contacts normally open (with
power off ) are provided which are electrically isolated from each other.
Eight solenoid driver outputs (open collector) are provided along with a
corresponding +24VDC supply pin on the connector.
I/O Expansion Board
(Optional)
The I/O expansion board connects to the motherboard and adds the
capability to input external analog voltage inputs and to output analog
currents via a connector located on the rear panel of the instrument. It
contains local power supplies, a DC/DC isolator supply, a sub-processor
Thermo Fisher Scientific
Model 49i Instruction Manual
8-7
System Description
I/O Components
and analog circuits. Eight analog voltage inputs are provided with an input
voltage range of 0V to 10VDC. Six current outputs are provided with a
normal operating range of 0 to 20 mA.
Front Panel Connector
Board
I/O Components
The front panel connector board interfaces between the motherboard and
the front panel mounted function key panel and Graphics display. It serves
as central location to tie the three connectors required for the function key
panel, the graphics display control lines, and the graphics display backlight
to a single ribbon cable extending back to the motherboard. This board also
includes signal buffers for the graphics display control signals and a high
voltage power supply for the graphics display backlight.
External I/O is driven from a generic bus that is capable of controlling the
following devices:
•
Analog output (voltage and current)
•
Analog input (voltage)
•
Digital output (TTL levels)
•
Digital input (TTL levels)
Note The instrument has spare solenoid valve drivers and I/O support for
future expansion. Analog Voltage Outputs
The instrument provides six analog voltage outputs. Each may be software
configured for any one of the following ranges, while maintaining a
minimum resolution of 12 bits:
•
0-100mV
•
0-1V
•
0-5V
•
0-10V
The user can calibrate each analog output zero and span point through
firmware. At least 5% of full-scale over and under range are also supported.
8-8
Model 49i Instruction Manual
Thermo Fisher Scientific
System Description
I/O Components
The analog outputs may be assigned to any measurement or diagnostic
channel with a user-defined range in the units of the selected parameter.
The voltage outputs are independent of the current outputs.
Analog Current Outputs
(Optional)
The optional I/O Expansion board includes six isolated current outputs.
These are software configured for any one of the following ranges, while
maintaining a minimum resolution of 11 bits:
•
0-20 mA
•
4-20 mA
The user can calibrate each analog output zero and span point through
firmware. At least 5% of full-scale over and under range are also supported.
The analog outputs may be assigned to any measurement or diagnostic
channel with a user-defined range in the units of the selected parameter.
The current outputs are independent of the voltage outputs. The current
outputs are isolated from the instrument power and ground, but they share
a common return line (Isolated GND).
Analog Voltage Inputs
(Optional)
The optional I/O expansion board includes eight analog voltage inputs.
These inputs are used to gather measurement data from third-party devices
such as meteorological equipment. The user may assign a label, unit, and a
voltage to user-defined unit conversion table (up to 16 points). All voltage
inputs have a resolution of 12 bits over the range of 0 to 10 volts.
Digital Relay Outputs
The instrument includes one power fail relay on motherboard and ten
digital output relays on the digital output board. These are reed relays rated
for at least 500 mA @ 200VDC.
The power fail relay is Form C (both normally opened and normally closed
contacts). All other relays are Form A (normally opened contacts) and are
used to provide alarm status and mode information from the analyzer, as
well as remote control to other devices, such as for controlling valves during
calibration. The user may select what information is sent out each relay and
whether the active state is opened or closed.
Digital Inputs
Sixteen digital inputs are available which may be programmed to signal
instrument modes and special conditions including:
•
Thermo Fisher Scientific
Zero Gas Mode
Model 49i Instruction Manual
8-9
System Description
I/O Components
•
Span Gas Mode
•
Set Background
•
Ozonator Level 1-5
•
Cal to Low Span
•
Cal to High Span
•
Ozonator Solenoid
•
Aouts to Zero
•
Aouts to FS
The actual use of these inputs will vary based on instrument configuration.
The digital inputs are TTL level compatible and are pulled up within the
analyzer. The active state can be user defined in firmware.
Serial Ports
Two serial ports allow daisy chaining so that multiple analyzers may be
linked using one PC serial port.
The standard bi-directional serial interface can be configured for either
RS-232 or RS-485. The serial baud rate is user selectable in firmware for
standard speeds from 1200 to 19,200 baud. The user can also set the data
bits, parity, and stop bits. The following protocols are supported:
•
C-Link
•
Streaming Data
•
Modbus Slave
•
Geysitech (Bayern-Hessen)
The Streaming Data protocol transmits user-selected measurement data via
the serial port in real-time for capture by a serial printer, data logger, or PC.
8-10
Model 49i Instruction Manual
Thermo Fisher Scientific
System Description
I/O Components
RS-232 Connection
A null modem (crossed) cable is required when connecting the analyzer to
an IBM Compatible PC. However, a straight cable (one to one) may be
required when connecting the analyzer to other remote devices. As a general
rule, when the connector of the host remote device is female, a straight cable
is required and when the connector is male, a null modem cable is required.
Data Format:
1200, 2400, 4800, 9600, 19200, 38400, 57600, or 115200 BAUD
8 data bits
1 stop bit
no parity
All responses are terminated with a carriage return (hex 0D)
Refer to Table 8-1 for the DB9 connector pin configuration.
Table 8-1. RS-232 DB Connector Pin Configurations
RS-485 Connection
DB9 Pin
Function
2
RX
3
TX
7
RTS
8
CTS
5
Ground
The instrument uses a four wire RS-485 configuration with automatic flow
control (SD). Refer to Table 8-2 for the DB9 connector pin configuration.
Table 8-2. RS-485 DB Connector Pin Configuration
Thermo Fisher Scientific
DB9 Pin
Function
2
+ receive
8
- receive
7
+ transmit
3
- transmit
5
ground
Model 49i Instruction Manual
8-11
System Description
I/O Components
Ethernet Connection
An RJ45 connector is used for the 10Mbs Ethernet connection supporting
TCP/IP communications via standard IPV4 addressing. The IP address may
be configured for static addressing or dynamic addressing (set using a
DHCP server).
Any serial port protocols may be accessed over Ethernet in addition to the
serial port.
External Accessory
Connector
8-12
Model 49i Instruction Manual
The external accessory connector is not used in the Model 49i analyzer.
This port is used in other models to communicate with smart external
devices that may be mounted hundreds of feet from the analyzer using an
RS-485 electrical interface.
Thermo Fisher Scientific
Chapter 9
Optional Equipment
The Model 49i is available with the following options:
•
“Internal Sample/Calibration” on page 9-1
•
“Ozonator” on page 9-1
•
“Zero Air Source” on page 9-1
•
“Teflon Particulate Filter” on page 9-2
•
“I/O Expansion Board Assembly” on page 9-2
•
“Terminal Block and Cable Kits” on page 9-2
•
“Cables” on page 9-2
•
“25-Pin Terminal Board Assembly” on page 9-4
•
“Mounting Options” on page 9-4
Internal
Sample/Calibration
With the Internal Sample/Calibration option, the sample to be measured is
attached to the SAMPLE port and the zero or span gas is attached to the
CALIBRATION port.
Ozonator
The internal ozone generator provides easy determination of zero, precision,
and Level 1 span checks. The ozone level produced is a function of light
intensity at 185 nm and gas flow. The light intensity is varied by changing
the current into the lamp. The gas flow is held constant by a pressure
regulator followed by a capillary.
Zero Air Source
Thermo Fisher Scientific
The zero air source option is a convenient system for generating pollutant
free zero gas for O3 monitoring requirements. This option includes the
pump, filter, filter holder, and Silastic tubing.
Model 49i Instruction Manual
9-1
Optional Equipment
Teflon Particulate Filter
Teflon Particulate
Filter
A 5-10 micron pore size, two-inch diameter Teflon® element is available for
the Model 49i. This filter should be installed just prior to the SAMPLE
bulkhead. When using a filter, all calibrations and span checks must be
performed through the filter.
I/O Expansion Board
Assembly
The I/O expansion board provides six analog current output channels (0-20
mA or 4-20 mA) and eight analog voltage inputs (0-10V). The DB25
connector on the rear panel provides the interface for these inputs and
outputs.
Terminal Block and
Cable Kits
The optional terminal block and cable kits provide a convenient way to
connect devices to the instrument. These kits break out the signals on the
rear panel connector to individual numbered terminals.
Two types of terminal block and cable kits are available. One kit is for the
DB37 connectors and can be used for either the analog output connector or
the relay output connector. The other kit is for the DB25 connector and can
be used for the optional I/O expansion board. For associated part numbers,
refer to “External Device Connection Components” in the “Servicing”
chapter.
Each kit consists of:
•
one six-foot cable
•
one terminal block
•
one snap track
Note Supporting all of the connections on units with the optional I/O
expansion board requires:
Cables
9-2
Model 49i Instruction Manual
•
two DB37 kits
•
one DB25 kit
Table 9-1 identifies the optional individual cables that are available for the
instrument and Table 9-2 provides the cable color codes. For associated part
numbers, refer to “External Device Connection Components” in the
“Servicing” chapter.
Thermo Fisher Scientific
Optional Equipment
Cables
Note Table 9-2 provides the color coding for both 25-pin cables and 37-pin
cables. Color codes for pins 1-25 are for 25-pin cables; color codes for pins
1-37 are for 37-pin cables. Table 9-1. Cable Options
Description
Cable Length
DB37M to open end
Six feet
DB37F to open end
Six feet
DB25M to open end
Six feet
RS-232
Table 9-2. Color Codes for 25-Pin and 37-Pin Cables
Thermo Fisher Scientific
Pin
Color
Pin
Color
1
BLACK
20
RED/BLACK
2
BROWN
21
ORANGE/BLACK
3
RED
22
YELLOW/BLACK
4
ORANGE
23
GREEN/BLACK
5
YELLOW
24
GRAY/BLACK
6
GREEN
25
PINK/BLACK
7
BLUE
End color codes for 25-pin cables
continue for 37-pin cables.
8
VIOLET
26
PINK/GREEN
9
GRAY
27
PINK/RED
10
WHITE
28
PINK/VIOLET
11
PINK
29
LIGHT BLUE
12
LIGHT GREEN
30
LIGHT BLUE/BROWN
13
BLACK/WHITE
31
LIGHT BLUE/RED
14
BROWN/WHITE
32
LIGHT BLUE/VIOLET
15
RED/WHITE
33
LIGHT BLUE/BLACK
16
ORANGE/WHITE
34
GRAY/GREEN
17
GREEN/WHITE
35
GRAY/RED
18
BLUE/WHITE
36
GRAY/VIOLET
19
VIOLET/WHITE
37
LIGHT GREEN/BLACK
Model 49i Instruction Manual
9-3
Optional Equipment
25-Pin Terminal Board Assembly
25-Pin Terminal Board
Assembly
Mounting Options
The 25-pin terminal board assembly is included with the optional I/O
expansion board. Refer “Terminal Board PCB Assemblies” in the
“Installation” chapter for information on attaching the cable to the
connector board. For associated part numbers, refer to “External Device
Connection Components” in the “Servicing” chapter.
The analyzer can be installed in the configurations described in Table 9-3
and shown in Figure 9-1 through Figure 9-4.
Table 9-3. Mounting Options
9-4
Model 49i Instruction Manual
Mounting Type
Description
Bench
Positioned on bench, includes mounting feet, and front panel
side-trim ears.
EIA rack
Mounted in an EIA-style rack, includes mounting slides, and front
panel EIA-rack mounting ears.
Retrofit rack
Mounted in a Thermo non-EIA rack, includes mounting slides, and
retrofit front panel rack-mounting ears.
Thermo Fisher Scientific
Optional Equipment
Mounting Options
Figure 9-1. Rack Mount Option Assembly
Thermo Fisher Scientific
Model 49i Instruction Manual
9-5
Optional Equipment
Mounting Options
Figure 9-2. Bench Mounting
9-6
Model 49i Instruction Manual
Thermo Fisher Scientific
Optional Equipment
Mounting Options
Figure 9-3. EIA Rack Mounting
Thermo Fisher Scientific
Model 49i Instruction Manual
9-7
Optional Equipment
Mounting Options
Figure 9-4. Retrofit Rack Mounting
9-8
Model 49i Instruction Manual
Thermo Fisher Scientific
Appendix A
Warranty
Seller warrants that the Products will operate or perform substantially in
conformance with Seller's published specifications and be free from defects
in material and workmanship, when subjected to normal, proper and
intended usage by properly trained personnel, for the period of time set
forth in the product documentation, published specifications or package
inserts. If a period of time is not specified in Seller’s product
documentation, published specifications or package inserts, the warranty
period shall be one (1) year from the date of shipment to Buyer for
equipment and ninety (90) days for all other products (the "Warranty
Period"). Seller agrees during the Warranty Period, to repair or replace, at
Seller's option, defective Products so as to cause the same to operate in
substantial conformance with said published specifications; provided that
(a) Buyer shall promptly notify Seller in writing upon the discovery of any
defect, which notice shall include the product model and serial number (if
applicable) and details of the warranty claim; (b) after Seller’s review, Seller
will provide Buyer with service data and/or a Return Material Authorization
(“RMA”), which may include biohazard decontamination procedures and
other product-specific handling instructions; and (c) then, if applicable,
Buyer may return the defective Products to Seller with all costs prepaid by
Buyer. Replacement parts may be new or refurbished, at the election of
Seller. All replaced parts shall become the property of Seller. Shipment to
Buyer of repaired or replacement Products shall be made in accordance with
the Delivery provisions of the Seller’s Terms and Conditions of Sale.
Consumables, including but not limited to lamps, fuses, batteries, bulbs and
other such expendable items, are expressly excluded from the warranty
under this warranty.
Notwithstanding the foregoing, Products supplied by Seller that are
obtained by Seller from an original manufacturer or third party supplier are
not warranted by Seller, but Seller agrees to assign to Buyer any warranty
rights in such Product that Seller may have from the original manufacturer
or third party supplier, to the extent such assignment is allowed by such
original manufacturer or third party supplier.
In no event shall Seller have any obligation to make repairs, replacements or
corrections required, in whole or in part, as the result of (i) normal wear and
tear, (ii) accident, disaster or event of force majeure, (iii) misuse, fault or
negligence of or by Buyer, (iv) use of the Products in a manner for which
they were not designed, (v) causes external to the Products such as, but not
Thermo Fisher Scientific
Model 49i Instruction Manual
A-1
Warranty
limited to, power failure or electrical power surges, (vi) improper storage
and handling of the Products or (vii) use of the Products in combination
with equipment or software not supplied by Seller. If Seller determines that
Products for which Buyer has requested warranty services are not covered by
the warranty hereunder, Buyer shall pay or reimburse Seller for all costs of
investigating and responding to such request at Seller's then prevailing time
and materials rates. If Seller provides repair services or replacement parts
that are not covered by the warranty provided in this warranty, Buyer shall
pay Seller therefor at Seller's then prevailing time and materials rates. ANY
INSTALLATION, MAINTENANCE, REPAIR, SERVICE,
RELOCATION OR ALTERATION TO OR OF, OR OTHER
TAMPERING WITH, THE PRODUCTS PERFORMED BY ANY
PERSON OR ENTITY OTHER THAN SELLER WITHOUT
SELLER'S PRIOR WRITTEN APPROVAL, OR ANY USE OF
REPLACEMENT PARTS NOT SUPPLIED BY SELLER, SHALL
IMMEDIATELY VOID AND CANCEL ALL WARRANTIES WITH
RESPECT TO THE AFFECTED PRODUCTS.
THE OBLIGATIONS CREATED BY THIS WARRANTY
STATEMENT TO REPAIR OR REPLACE A DEFECTIVE PRODUCT
SHALL BE THE SOLE REMEDY OF BUYER IN THE EVENT OF A
DEFECTIVE PRODUCT. EXCEPT AS EXPRESSLY PROVIDED IN
THIS WARRANTY STATEMENT, SELLER DISCLAIMS ALL OTHER
WARRANTIES, WHETHER EXPRESS OR IMPLIED, ORAL OR
WRITTEN, WITH RESPECT TO THE PRODUCTS, INCLUDING
WITHOUT LIMITATION ALL IMPLIED WARRANTIES OF
MERCHANTABILITY OR FITNESS FOR ANY PARTICULAR
PURPOSE. SELLER DOES NOT WARRANT THAT THE
PRODUCTS ARE ERROR-FREE OR WILL ACCOMPLISH ANY
PARTICULAR RESULT.
A-2
Model 49i Instruction Manual
Thermo Fisher Scientific
Appendix B
C-Link Protocol Commands
This appendix provides a description of the C-Link protocol commands
that can be used to remotely control a Model 49i analyzer using a host
device such as a PC or a datalogger. C-Link protocol may be used over
RS-232, RS-485, or Ethernet. C-Link functions can be accessed over
Ethernet using TCP/IP port 9880.
Thermo Fisher Scientific
•
“Instrument Identification Number” on page B-2 describes the C-Link
command format.
•
“Commands” on page B-2 lists all the 49i C-Link commands in
Table B-1.
•
“Measurements” on page B-8 describes and gives examples of the
measurement commands.
•
“Alarms” on page B-11 describes and gives examples of the alarm
commands.
•
“Diagnostics” on page B-16 describes and gives examples of the
diagnostic commands.
•
“Datalogging” on page B-17 describes and gives examples of the
datalogging commands.
•
“Calibration” on page B-24 describes and gives examples of the
calibration commands.
•
“Keys/Display” on page B-26 describes and gives examples of the keys
and display commands.
•
“Measurement Configuration” on page B-29 describes and gives
examples of the measurement configuration commands.
•
“Hardware Configuration” on page B-33 describes and gives examples
of the hardware commands.
•
“Communications Configuration” on page B-35 describes and gives
examples of the communication commands.
Model 49i Instruction Manual
B-1
C-Link Protocol Commands
Instrument Identification Number
•
“I/O Configuration” on page B-39 describes and gives examples of the
I/O commands.
•
“Record Layout Definition” on page B-43 describes and gives examples
of the record layouts.
Instrument
Identification Number
Each command sent to the analyzer must begin with the American Standard
Code for Information Interchange (ASCII) symbol or byte value equivalent
of the instrument's identification number plus 128. For example, if the
instrument ID is set to 25, then each command must begin with the ACSII
character code 153 decimal. The analyzer ignores any command that does
not begin with its instrument identification number. If the instrument ID is
set to 0, then this byte is not required. For more information on changing
Instrument ID, see Chapter 3, “Operation”.
Entering Units in PPB
When interfacing to an instrument via C-link commands, always enter the
concentration values in ppb or μg/m3 units. For example, to set a
background value to 20 ppm, enter 20000 (ppb) as the value for the set
background command.
Accessing Streaming
Data
Streaming data is sent out the serial port or the Ethernet port on a
user-defined periodic basis. Streaming data over Ethernet is only generated
when a connection is made on TCP port 9881.
Commands
The analyzer must be in the remote mode in order to change instrument
parameters via remote. However, the command “set mode remote” can be
sent to the analyzer to put it in the remote mode. Report commands
(commands that don’t begin with “set”) can be issued either in the remote or
local mode. For information on changing modes, see Chapter 3,
“Operation.”
The commands can be sent in either uppercase or lowercase characters. Each
command must begin with the proper instrument identification number
(ASCII) character. The command in the example that follows begins with
the ASCII character code 170 decimal, which directs the command to the
Model 49i, and is terminated by a carriage return “CR” (ASCII character
code 13 decimal).
<ASCII 170>
B-2
Model 49i Instruction Manual
T
I
M
E <CR>
Thermo Fisher Scientific
C-Link Protocol Commands
Commands
If an incorrect command is sent, a “bad command” message will be
received. The example that follows sends the incorrect command “set unit
ppm” instead of the correct command “set gas unit ppm.”
Send:
Receive:
set unit ppm
set unit ppm bad cmd
The “save” and “set save params” commands stores parameters in FLASH. It
is important that each time instrument parameters are changed, that this
command be sent. If changes are not saved, they will be lost in the event of
a power failure.
Table B-1 lists the 49i C-Link protocol commands. The interface will
respond to the command strings outlined below.
Table B-1. C-Link Protocol Commands
Thermo Fisher Scientific
Command
Description
Page
addr dns
Reports/sets domain name server address
B-35
addr gw
Reports/sets default gateway address
B-36
addr ip
Reports/sets IP address
B-36
addr nm
Reports/sets netmask address
B-36
alarm bench lamp
temp max
Reports the bench lamp temperature alarm maximum value
current setting
B-11
alarm bench lamp
temp min
Reports the bench lamp temperature alarm minimum value
current setting
B-11
alarm bench temp
max
Reports the bench lamp temperature alarm maximum value
current setting
B-12
alarm bench temp
min
Reports the bench temperature alarm minimum value current
setting
B-12
alarm conc o3 max
Reports the concentration O3 alarm maximum value current
setting
B-12
alarm conc o3 min
Reports the concentration O3 alarm minimum value current
setting
B-12
alarm intensity a
max
Reports the current setting of maximum intensity alarm level
for cell a
B-13
alarm intensity a
min
Reports the current setting of minimum intensity alarm level for
cell a
B-13
alarm intensity b
max
Reports the current setting of maximum intensity alarm level
for cell b
B-13
alarm intensity b
min
Reports the current setting of minimum intensity alarm level for
cell b
B-13
alarm level 1
Reports current alarm level 1 offset from the concentration as
the alarm trigger point for that level
B-13
Model 49i Instruction Manual
B-3
C-Link Protocol Commands
Commands
Table B-1. C-Link Protocol Commands, continued
B-4
Model 49i Instruction Manual
Command
Description
Page
alarm level 2
Reports current alarm level 2 offset from the concentration as
the alarm trigger point for that level
B-13
alarm level 3
Reports current alarm level 3 offset from the concentration as
the alarm trigger point for that level
B-13
alarm level 4
Reports current alarm level 4 offset from the concentration as
the alarm trigger point for that level
B-13
alarm level 5
Reports current alarm level 5 offset from the concentration as
the alarm trigger point for that level
B-13
alarm oz lamp temp
max
Reports the ozonator lamp temperature alarm maximum value
current setting
B-14
alarm oz lamp temp
min
Reports the ozonator lamp temperature alarm minimum value
current setting
B-14
alarm pressure max
Reports the pressure alarm maximum value current setting
B-14
alarm pressure min
Reports the pressure alarm minimum value current setting
B-14
alarm sample flow
a max
Reports the sample flow a alarm maximum value current
setting
B-15
alarm sample flow
a min
Reports the sample flow a alarm minimum value current
setting
B-15
alarm sample flow
b max
Reports the sample flow b alarm maximum value current
setting
B-15
alarm sample flow
b min
Reports the sample flow b alarm minimum value current
setting
B-15
alarm trig conc o3
Reports the current setting of the concentration O3 alarm
trigger action minimum alarm
B-15
analog iout range
Reports analog current output range per channel
B-39
analog vin
Retrieves analog voltage input data per channel
B-40
analog vout range
Reports analog voltage output range per channel
B-40
avg time
Reports/sets averaging time
B-8
baud
Reports/sets current baud rate
B-36
bench temp
Reports bench temperature
B-9
cal detectors
Balances the output of both detectors
B-26
cal high o3 coef
Sets/auto-calibrates high range O3 coefficient
B-24
cal low o3 coef
Sets/auto-calibrates low range O3 coefficient
B-24
cal o3 bkg
Sets/auto-calibrates O3 background
B-24
cal o3 coef
Sets/auto-calibrates O3 coefficient
B-24
cell a int
Reports the current lamp intensity for cell a
B-16
cell b int
Reports the current lamp intensity for cell b
B-16
Thermo Fisher Scientific
C-Link Protocol Commands
Commands
Table B-1. C-Link Protocol Commands, continued
Thermo Fisher Scientific
Command
Description
Page
clr records
Clears away all logging records that have been saved
B-17
clr srecs
Clears away only short records that have been saved
B-17
contrast
Reports/sets current screen contrast
B-33
copy lrec to sp
Sets/copies current lrec selection into the scratch pad
B-22
copy sp to lrec
Sets/copies current selections in scratch pad into lrec list
B-22
copy sp to srec
Sets/copies current selections in scratch pad into srec list
B-22
copy sp to stream
Sets/copies current selections in scratch pad into stream list
B-22
copy srec to sp
Sets/copies current srec selection into the scratch pad
B-22
copy stream to sp
Sets/copies current streaming data selection into the scratch
pad
B-22
custom
Reports/sets defined custom range concentration
B-30
date
Reports/sets current date
B-34
default params
Sets parameters to default values
B-34
dhcp
Reports/sets state of use of DHCP
B-37
diag volt iob
Reports diagnostic voltage level for I/O expansion board
B-16
diag volt mb
Reports diagnostic voltage level for motherboard
B-16
diag volt mib
Reports diagnostic voltage level for measurement interface
board
B-16
dig in
Reports status of the digital inputs
B-41
din
Reports/sets digital input channel and active state
B-41
do (down)
Simulates pressing down pushbutton
B-26
dout
Reports/sets digital output channel and active state
B-41
dtoa
Reports outputs of the digital to analog converters per channel
B-41
en (enter)
Simulates pressing enter pushbutton
B-26
er
Returns a brief description of the main operating conditions in
the format specified in the commands
B-18
erec
Returns a brief description of the main operating conditions in
the format specified in the command
B-18
erec format
Reports/sets erec format (ASCII or binary)
B-20
erec layout
Reports current layout of erec data
B-20
flags
Reports 8 hexadecimal digits (or flags) that represent the
status of the ozonator, gas mode, and alarms
B-11
flow a
Reports current measured flow in cell a
B-10
flow b
Reports current measured flow in cell b
B-10
format
Reports/sets current reply termination format
B-37
Model 49i Instruction Manual
B-5
C-Link Protocol Commands
Commands
Table B-1. C-Link Protocol Commands, continued
B-6
Model 49i Instruction Manual
Command
Description
Page
gas mode
Reports current mode of sample, zero, or span
B-30
gas unit
Reports/sets current gas units
B-31
he (help)
Simulates pressing help pushbutton
B-26
high avg time
Reports/sets high range averaging time
B-8
high o3
Reports O3 concentration calculated with high range
coefficients
B-9
high o3 coef
Reports/sets high range O3 coefficients
B-24
high range
Reports/selects current O3 high range
B-29
high sp conc
Sets the high span concentration for autocalibration
B-26
host name
Reports/sets host name string
B-38
instr name
Reports instrument name
B-38
instrument id
Reports/sets instrument id
B-38
isc (iscreen)
Retrieves framebuffer data used for the display
B-27
l1
Reports the current custom level 1 setting of ozonator lamp
drive
B-33
l2
Reports the current custom level 2 setting of ozonator lamp
drive
B-33
l3
Reports the current custom level 3 setting of ozonator lamp
drive
B-33
l4
Reports the current custom level 4 setting of ozonator lamp
drive
B-33
l5
Reports the current custom level 5 setting of ozonator lamp
drive
B-33
lamp
Reports/sets the current photometer lamp setting.
B-31
lamp setting
Reports/sets the photometer lamp setting
B-31
lamp temp
Reports the current bench lamp temperature.
B-10
lamp voltage bench
Reports the bench lamp voltage in volts
B-10
lamp voltage oz
Reports the ozonator lamp voltage in volts
B-10
layout ack
Disables stale layout/layout changed indicator (‘*’)
B-39
le (left)
Simulates pressing left pushbutton
B-26
list din
Lists current selection for digital input
B-17
list dout
Lists current selection for digital output
B-17
list lrec
Lists current selection lrec logging data
B-17
list sp
Lists current selection in the scratchpad list
B-17
list srec
Lists current selection srec logging data
B-17
list stream
Lists current selection streaming data output
B-17
Thermo Fisher Scientific
C-Link Protocol Commands
Commands
Table B-1. C-Link Protocol Commands, continued
Thermo Fisher Scientific
Command
Description
Page
list var aout
Reports list of analog output, index numbers, and variables
B-42
list var din
Reports list of digital input, index numbers, and variables
B-42
list var dout
Reports list of digital output, index numbers, and variables
B-42
low avg time
Reports/sets low average time
B-8
low o3
Reports O3 concentration calculated with low range
coefficients
B-9
low o3 coef
Reports/sets low range O3 coefficient
B-24
low range
Reports/sets current O3 low range
B-29
low sp conc
Sets the low span concentration for autocalibration
B-26
lr
Outputs long records in the format specified in the command
B-18
lrec
Outputs long records
B-18
lrec format
Reports/sets output format for long records (ASCII or binary)
B-20
lrec layout
Reports current layout of lrec data
B-20
lrec mem size
Reports maximum number of long records that can be stored
B-21
lrec per
Reports/sets long record logging period
B-21
malloc lrec
Reports/sets memory allocation for long records
B-21
malloc srec
Reports/sets memory allocation for short records
B-21
me (menu)
Simulates pressing menu pushbutton
B-26
mode
Reports operating mode in local, service, or remote
B-39
no of lrec
Reports/sets number of long records stored in memory
B-21
no of srec
Reports/sets number of short records stored in memory
B-21
o3
Reports current 03 concentration
B-9
o3 bkg
Reports/sets current 03 background
B-25
o3 coef
Reports/sets current 03 coefficient
B-24
o3 lamp temp
Reports the current ozonator lamp temperature
B-10
pres
Reports current reaction chamber pressure
B-10
pres comp
Reports/sets pressure compensation on or off
B-31
program no
Reports analyzer program number
B-39
pump
Sets the pump on or off
B-31
push
Simulates pressing a key on the front panel
B-26
range
Reports/sets current 03 range
B-29
range mode
Reports/sets current range mode
B-30
relay
Reports/sets relay logic status of designated relay(s)
B-43
relay stat
Reports/sets relay logic status of designated relay(s)
B-43
Model 49i Instruction Manual
B-7
C-Link Protocol Commands
Measurements
Table B-1. C-Link Protocol Commands, continued
Measurements
Command
Description
Page
resp coef
Reports/sets instrument response
B-26
ri (right)
Simulates pressing right pushbutton
B-26
ru (run)
Simulates pressing run pushbutton
B-26
sample
Sets zero/span valves to sample mode
B-31
save
Stores parameters in FLASH
B-35
save params
Stores parameters in FLASH
B-35
sc (screen)
C-series legacy command that reports a generic response (Use
iscreen instead)
B-28
sp conc
Reports/sets the span concentration for autocalibration
B-26
sp field
Reports/sets item number and name in scratch pad list
B-22
span
Sets zero/span valves to span mode
B-31
sr
Reports last short record stored
B-18
srec
Reports maximum number of short records
B-18
srec format
Reports/sets output format for short records (ASCII or binary)
B-20
srec layout
Reports current layout of short record data
B-20
srec mem size
Reports maximum number of short records
B-21
srec per
Reports/sets short record logging period
B-21
stream per
Reports/sets current set time interval for streaming data
B-23
stream time
Reports/sets a time stamp to streaming data or not
B-23
temp comp
Reports/sets temperature compensation on or off
B-32
time
Reports/sets current time (24-hour time)
B-35
up
Simulates pressing up pushbutton
B-27
zero
Sets zero/span valves to zero mode
B-31
avg time
high avg time
low avg time
These commands report the averaging time in seconds when operating in
single range, or averaging time used with the high and low ranges when
operating in dual or auto range mode. The example that follows shows that
the averaging time is 300 seconds, according to Table B-2.
Send:
Receive:
B-8
Model 49i Instruction Manual
avg time
avg time 11: 300 sec
Thermo Fisher Scientific
C-Link Protocol Commands
Measurements
set avg time selection
set high avg time selection
set low avg time selection
These commands set the averaging time, high and low averaging times,
according to Table B-2. The example that follows sets the low range
averaging time to 120 seconds.
Send:
Receive:
set low avg time 5
set low avg time 5 ok
Table B-2. Averaging Times
Selection
Averaging Time (seconds)
0
10
1
20
2
30
3
60
4
90
5
120
6
180
7
240
8
300
bench temp
This reports the current bench temperature. The first temperature reading is
the temperature being used in instrument calculations. The second
temperature is the actual temperature being measured. If temperature
compensation is ON, then both temperature readings are the same. If
temperature compensation is OFF, a temperature of 0° C is used as the
default temperature even though the actual bench temperature is 32.3° C.
The example that follows shows that temperature compensation is on and
that the bench temperature is 32.3° C.
Send:
Receive:
bench temp
bench temp 032.3 deg C, actual 032.3
o3
high o3
low o3
These commands report the measured O3 concentrations when operating
in single range, or high and low O3 when operating in dual or auto range
mode. The example that follows shows that the O3 concentration is 67.2
ppb.
Thermo Fisher Scientific
Model 49i Instruction Manual
B-9
C-Link Protocol Commands
Measurements
Send:
Receive:
o3
o3 6720E-2 ppb
flow a
flow b
These commands report the sample flow in Cell A and Cell B. The example
that follows reports that the current sample flow in Cell A is 0.608
liters/minute.
Send:
Receive:
flow a
flow a 0.608 l/m
o3 lamp temp
This reports the current ozonator lamp temperature. The example that
follows reports that the current ozonator temperature is 68.7° C.
Send:
Receive:
o3 lamp temp
o3 lamp temp 068.7 deg C
lamp temp
This reports the current bench lamp temperature. The example that follows
reports that the current bench temperature is 55.2° C.
Send:
Receive:
lamp temp
lamp temp 055.2 deg C
lamp voltage bench
This command reports the bench lamp voltage in volts.
Send:
Receive:
lamp voltage bench
lamp voltage bench 10.3 V
lamp voltage oz
This command reports the ozonator lamp voltage in volts.
Send:
Receive:
lamp voltage oz
lamp voltage oz 12.3 V
pres
This reports the current reaction chamber pressure. The first pressure
reading is the pressure reading being used in instrument calculations. The
second pressure is the actual pressure reading being measured. If pressure
compensation is on, then both pressure readings are the same. If pressure
compensation is off, a pressure of 760 mm Hg is used as the default pressure
even though the actual pressure is 753.4 mm Hg. The example that follows
shows that actual reaction chamber pressure is 753.4 mm Hg.
B-10
Model 49i Instruction Manual
Thermo Fisher Scientific
C-Link Protocol Commands
Alarms
Send:
Receive:
pres
pres 760.0 mm Hg, actual 753.4
flags
This reports 8 hexadecimal digits (or flags) that represent the status of the
ozonator, gas mode, and alarms. To decode the flags, each hexadecimal digit
is converted to binary as shown in Figure B-1. It is the binary digits that
define the status of each parameter. In the example that follows, the
instrument is in local mode, the gas mode status is Sample, the ozonator is
OFF, gas units are ppb, and there is an intensity B high alarm.
Send:
Receive:
flags
flags 00008000
Figure B-1. Flag Status
Alarms
Thermo Fisher Scientific
alarm bench lamp temp min
alarm bench lamp temp max
These commands report the bench lamp temperature minimum and
maximum value current settings. The example that follows reports that the
alarm bench lamp temperature minimum value is 52° C.
Model 49i Instruction Manual
B-11
C-Link Protocol Commands
Alarms
Send:
Receive:
alarm bench lamp temp min
alarm bench lamp temp 52.0 deg C
set alarm bench lamp temp min value
set alarm bench lamp temp max value
These commands set the bench lamp temperature minimum and maximum
value to value, where value is a floating-point number representing bench
lamp temperature alarm limits in degrees C. The example that follows sets
the alarm bench lamp temperature maximum value to 58° C.
Send:
Receive:
set alarm bench lamp temp max 58.0
set alarm bench lamp temp max 58.0 ok
alarm bench temp min
alarm bench temp max
These commands report the bench temperature minimum and maximum
value current settings. The example that follows reports that the alarm
bench temperature minimum value is 15.0° C.
Send:
Receive:
alarm bench temp min
alarm bench temp 15.0
set alarm bench temp min value
set alarm bench temp max value
These commands set the bench temperature minimum and maximum value
to value, where value is a floating-point number representing bench
temperature alarm limits in degrees C. The example that follows sets the
alarm bench temperature maximum value to 35° C.
Send:
Receive:
set alarm bench temp max 35
set alarm bench temp max 35 ok
alarm conc o3 min
alarm conc o3 max
These commands report the conc O3 concentrations alarm minimum and
maximum value current settings. The example that follows reports that the
O3 concentration minimum value is 5.2 ppb.
Send:
Receive:
B-12
Model 49i Instruction Manual
alarm conc o3 min
alarm conc o3 min 5.2 ppb
Thermo Fisher Scientific
C-Link Protocol Commands
Alarms
set alarm conc o3 min value
set alarm conc o3 max value
These commands set the O3 concentration alarm minimum and maximum
value to value, where value is a floating-point representation of the
concentration alarm limits. The example that follows sets the O3
concentration alarm maximum value to 150.
Send:
Receive:
set alarm conc o3 max
set alarm conc o3 max 150 ok
alarm intensity a min
alarm intensity a max
alarm intensity b min
alarm intensity b max
These commands report the cell a or b intensity alarm minimum and
maximum value current settings. The example that follows reports that the
cell a minimum value is 45000 Hz.
Send:
Receive:
alarm intensity a min
alarm intensity a min 45000 Hz
set alarm intensity a min value
set alarm intensity a max value
set alarm intensity b min value
set alarm intensity b max value
These commands set the cell a or b intensity alarm minimum and
maximum value to value, where value is a representation of the intensity
alarm limits. The example that follows sets the cell a intensity alarm
maximum value to 150000 Hz.
Send:
Receive:
set alarm intensity a max 150000
set alarm intensity a max 150000 ok
alarm level 1
alarm level 2
alarm level 3
alarm level 4
alarm level 5
These commands report the offset value (in ppb) from the concentration
stored at ozonator level 1-5 as the alarm trigger point for that level. The
example that follows reports that the alarm level 1 offset is 20.5.
Send:
Receive:
Thermo Fisher Scientific
alarm level 1
alarm level 1 20.5
Model 49i Instruction Manual
B-13
C-Link Protocol Commands
Alarms
set alarm level 1 value
set alarm level 2 value
set alarm level 3 value
set alarm level 4 value
set alarm level 5 value
These commands set the offset value (in ppb) from the concentration stored
at ozonator level 1-5 as the alarm trigger point for that level. The example
that follows sets the alarm level 1 offset to 20.5.
Send:
Receive:
set alarm level 1 20.5
set alarm level 1 20.5 ok
alarm oz lamp temp min
alarm oz lamp temp max
These commands report the ozonator lamp temperature minimum and
maximum value current settings. The example that follows reports that the
alarm ozonator lamp temperature minimum value is 52° C.
Send:
Receive:
alarm ozonator lamp temp min
alarm ozonator lamp temp 52.0 deg C
set alarm oz lamp temp min value
set alarm oz lamp temp max value
These commands set the ozonator lamp temperature minimum and
maximum value to value, where value is a floating-point number
representing bench lamp temperature alarm limits in degrees C. The
example that follows sets the alarm ozonator lamp temperature maximum
value to 58° C.
Send:
Receive:
set alarm ozonator lamp temp max 58.0
set alarm ozonator lamp temp max 58.0 ok
alarm pressure min
alarm pressure max
These commands report the pressure alarm minimum and maximum value
current settings. The example that follows reports that the pressure alarm
minimum value is 200 mmHg.
Send:
Receive:
B-14
Model 49i Instruction Manual
alarm pressure min
alarm pressure min 200 mmHg
Thermo Fisher Scientific
C-Link Protocol Commands
Alarms
set alarm pressure min value
set alarm pressure max value
These commands set the pressure alarm minimum and maximum values to
value, where value is a floating-point number representing pressure alarm
limits in millimeters of mercury. The example that follows sets the pressure
alarm maximum value to 1000 mmHg.
Send:
Receive:
set alarm pressure max 1000
set alarm pressure max 1000 ok
alarm sample flow a min
alarm sample flow a max
alarm sample flow b min
alarm sample flow b max
These commands report the cell a and b sample flow alarm minimum and
maximum value current settings. The example that follows reports that the
sample flow alarm minimum value is 0.400 LPM.
Send:
Receive:
alarm sample flow min
alarm sample flow min 0.4 l/min
set alarm sample flow a min value
set alarm sample flow b max value
set alarm sample flow a min value
set alarm sample flow b max value
These commands set the cell a or b sample flow alarm minimum and
maximum values to value, where value is a floating-point number
representing sample flow alarm limits in liters per minute. The example that
follows sets the sample flow alarm maximum value to 1.400 LPM.
Send:
Receive:
set alarm sample flow max 1.4
set alarm sample flow max 1.4 ok
alarm trig conc o3
This command reports the O3 concentration alarm trigger action for
minimum alarm, current setting, to either floor or ceiling. The example that
follows shows the O3 concentration minimum alarm trigger to ceiling,
according to Table B-3.
Send:
Receive:
alarm trig conc 03
alarm trig conc 03 1
set alarm trig conc o3 value
These commands set the O3 concentration alarm minimum value, where
value is set to either floor or ceiling, according to Table B-3. The example
that follows sets the O3 concentration minimum alarm trigger to ceiling.
Thermo Fisher Scientific
Model 49i Instruction Manual
B-15
C-Link Protocol Commands
Diagnostics
Send:
Receive:
set alarm trig conc no 1
set alarm trig conc no 1 ok
Table B-3. Alarm Trigger Values
Diagnostics
Value
Alarm Trigger
0
Floor
1
Ceiling
cell a int
cell b int
The example that follows reports that the lamp intensity in cell A is 98,425
Hz.
Send:
Receive:
cell a int
cell a int 98425 Hz
diag volt mb
This command reports the diagnostic voltage measurements on the
motherboard. The sequence of voltages is: Positive 24, positive 15, positive
5, positive 3.3, and negative 3.3. Each voltage value is separated by a space.
Send:
Receive:
diag volt mb
diag volt mb 24.1 14.9 4.9 3.2 -3.2
diag volt mib
This command reports the diagnostic voltage measurements on the
measurement interface board. The sequence of voltages is: Positive 24,
positive 15, negative 15, positive 5, positive 3.3, and positive 15. Each
voltage value is separated by a space.
Send:
Receive:
diag volt mib
diag volt mib 24.1 14.9 -14.9 4.9 3.2 14.9
diag volt iob
This command reports the diagnostic voltage measurements on the I/O
expansion board. The sequence of voltages is: Positive 24, positive 5,
positive 3.3, and negative 3.3. Each voltage value is separated by a space.
Send:
Receive:
B-16
Model 49i Instruction Manual
diag volt iob
diag volt iob 24.1 4.9 3.2 -3.2
Thermo Fisher Scientific
C-Link Protocol Commands
Datalogging
Datalogging
clr records
This command will clear all long and short records that have been saved.
Send:
Receive:
clear records
clear records ok
set clr lrecs
set clr srecs
These commands will clear only the long records or only the short records
that have been saved. The example that follows clears short records.
Send:
Receive:
set clr srecs
set clr srecs ok
list din
list dout
These commands report the current selection for the digital outputs in the
format. Output no Index number variable name active state. The active
state for digital outputs is open or closed. The active state for digital inputs
is high or low.
Send:
list dout
Receive: list dout
output index variable state
1 23 CONC ALARM open
3 3 UNITS open
4 12 GEN ALARM open
list lrec
list srec
list stream
list sp
These commands report the list of current selections for long record logging
data, short record logging data, streaming data output, or the scratch pad
(sp) list. The example that follows shows the list for streaming data output.
Send:
list stream
Receive: list stream
field index variable
x x time
1 1 o3
2 5 cellai
3 6 cellbi
4 7 noisa
5 8 noisb
6 9 flowa
7 10 flowb
8 11 pres
Thermo Fisher Scientific
Model 49i Instruction Manual
B-17
C-Link Protocol Commands
Datalogging
er xy
lr xy
sr xy
x=|0|1|
: Reply termination format (see “set format format”
command)
y = | 0 | 1 | 2 | : Output format (see “set erec/lrec/srec format format”
command)
These commands report the last long and short records stored or the
dynamic data record. In the example that follows, the command requests a
long record with no checksum, in ASCII format with text. For details on
how to decode the flag fields within these records, see Figure B-1 in the
“flags” command.
Send:
lr01
Receive: lr01
13:00 08-12-05 flags 1C00554A o3 0.000 hio3 0.000 cellai 0.000 cellbi
0.000 bncht 999.900 lmpt 999.900 o3lt 0.000 flowa 0.000 flowb 0.000
pres 0.000
erec
This command returns a brief description of the main operating conditions
at the time the command is issued (i.e. dynamic data). The example that
follows shows a typical response. The format is defined by the current
settings of “format” and “erec format” commands. For details on how to
decode the flag fields within these records, see Figure B-1 in the “flags”
command.
Send:
erec
Receive: erec
13:05 08-12-05 flags 1C00554A o3 0.000 1 lo o3 0.000 1 lampi 0000
bencht 999.900 lampt 999.900 ozlampt 0.000 flowa 0.000 flowb 0.000 Pres
0.000 avgt 10 lo avgt 10 O3bkg 0.000 O3 coef 1.000 lo O3 coef 1.000 O3
range 200000.000 lo O3 range 200000.000 int a 0000 int b 0000
sum 46f6
lrec
srec
lrec xxxx yy
srec xxxx yy
lrec aa:bb oo-pp-qq yy
srec aa:bb oo-pp-qq yy
xxxx = the number of past records
yy = the number of records to return (1 to 10)
aa = hours (01 to 24)
bb = minutes (01 to 59)
oo = month (01 to 12)
B-18
Model 49i Instruction Manual
Thermo Fisher Scientific
C-Link Protocol Commands
Datalogging
pp = day (01 to 31)
qq = year
These commands output long or short records. The output format is
determined by the “set lrec format”, and “set srec format” commands. The
logging time is determined by the “set lrec per” and “set srec per”
commands.
In the following example, there are 100 long records currently stored in
memory. When the command lrec 100 5 is sent, the instrument counts
back 100 records from the last record collected, and then returns 5 records.
For details on how to decode the flag fields within these records, see
Figure B-1 in the “flags” command.
Send:
lrec 100 5
Receive: lrec 100 5
19:00 8/17/05 flags 2coooooo o3 2.504e+02 cellai 100177 cellbi 99747
bncht 3.202e+01 lmpt 5.375e+01 o3lt 6767e+01 flowa 7.278e-01 flowb
7.390e-01 pres 7.557e+02
20:00 8/17/05 flags 2coooooo o3 2.514e+02 cellai 100137 cellbi 99762
bncht 3.262e+01 lmpt 5.325e+01 o3lt 6717e+01 flowa 7.248e-01 flowb
7.310e-01 pres 7.563e+02
21:00 8/17/05 flags 2coooooo o3 2.664e+02 cellai 100115 cellbi 99756
bncht 3.168e+01 lmpt 5.255e+01 o3lt 6597e+01 flowa 7.318e-01 flowb
7.240e-01 pres 7.413e+02
22:00 8/17/05 flags c4ooooo o3 2.582e+02 cellai 100173 cellbi 99780
bncht 3.258e+01 lmpt 5.366e+01 o3lt 6672e+01 flowa 7.318e-01 flowb
7.301e-01 pres 7.515e+02
23:00 8/17/05 flags c4ooooo o3 2.567e+02 cellai 100205 cellbi 99653
bncht 3.291e+01 lmpt 5.372e+01 o3lt 6714e+01 flowa 7.351e-01 flowb
7.362e-01 pres 7.493e+02
where:
cellai = Cell A Intensity
cellbi = Cell B Intensity
bncht = Bench Temperature
lmpt = Lamp Temperature
03lt = Ozonator Lamp Temperature
flowa = Cell A Flow
flowb = Cell B Flow
press = Pressure
Thermo Fisher Scientific
Model 49i Instruction Manual
B-19
C-Link Protocol Commands
Datalogging
erec format
srec format
lrec format
These commands report the output format for long and short records, and
dynamic data in various formats such as ASCII without text, ASCII with
text, or binary. The example that follows shows the output format for long
records is ASCII with text, according to Table B-4.
Send:
Receive:
lrec format
lrec format 1
set erec format format
set lrec format format
set srec format format
These commands set the output format for long and short records, and
dynamic data, according to Table B-4. The example that follows sets the
long record output format to ASCII with text.
Send:
Receive:
set lrec format 1
set lrec format 1 ok
Table B-4. Record Output Formats
Format
Output Format
0
ASCII no text
1
ASCII with text
2
binary data
erec layout
lrec layout
srec layout
These commands reports the layout (string indicating the data formats) for
data that is sent out in response to the erec, lrec, srec, and related commands
The example that follows shows a typical response. For details on how to
interpret the strings, see “Record Layout Definition” later in this appendix.
Send:
lrec layout
Receive: lrec layout %s %s %lx %f %f %f %f %f %f %f %f %f %f %f %f
t D L ffffffffffff
flags no nox hino hinox pres pmtt intt rctt convt smplf ozonf pmtv
B-20
Model 49i Instruction Manual
Thermo Fisher Scientific
C-Link Protocol Commands
Datalogging
lrec mem size
srec mem size
These commands report the long and short records that can be stored with
the current settings and the number of 2K blocks reserved for long and
short records. The example that follows shows the maximum number of
long records that can be stored based on allocated memory and content.
Send:
Receive:
lrec mem size
lrec mem size 1426 recs, 7 blocks
lrec per
srec per
These commands report the long and short records logging period. The
example that follows shows that the short record logging period is 5
minutes.
Send:
Receive:
srec per
srec per 5 min
set srec per value
set srec per value
value = | 1 | 5 | 15 | 30 | 60 |
These commands set the long and short records logging period to value in
minutes. The example that follows sets the long record logging period to 15
minutes.
Send:
Receive:
set lrec per 15
set lrec per 15 ok
no of lrec
no of srec
These commands report the number of long and short records stored in the
long and short records memory. The example that follows shows that 50
long records have been stored in the memory.
Send:
Receive:
no of lrec
no of lrec 50 recs
malloc lrec
malloc srec
These commands report the currently set memory allocation for long and
short records in percent of total memory.
Send:
Receive:
Thermo Fisher Scientific
malloc lrec
malloc lrec 10%
Model 49i Instruction Manual
B-21
C-Link Protocol Commands
Datalogging
set malloc lrec value
set malloc srec value
value = 0 to 100
These commands set the percent of memory space allocated for long and
short records to value, where value is a floating-point number representing
percent. If lrec memory is set to x, srec will be automatically set to (100-x).
The example that follows sets the memory allocation for long records to 10.
Note Issuing these commands will clear all the logging data memory. All the
existing records should be retrieved using appropriate commands, if
required. Send:
Receive:
set malloc lrec 10
set malloc lrec 10 ok
set copy sp to lrec
set copy sp to srec
set copy sp to stream
These commands copy the current selections in scratch pad (sp) into the
long record, short record, or streaming data list. The example that follows
copies the current list in scratch pad into the long records list.
Send:
Receive:
set copy sp to lrec
set copy sp to lrec ok
set copy lrec to sp
set copy srec to sp
set copy stream to sp
These commands copy the current contents of the long record, short record,
or streaming data list into the scratch pad (sp). These commands are useful
in easy modification of current long record, short record, or streaming data
lists. The example that follows copies the current list of long records into the
scratch pad.
Send:
Receive:
set copy lrec to sp
set copy lrec to sp ok
sp field number
This command reports the variable number and name stored at index in the
scratch pad list. The example that follows shows that the field 5 in the
scratch pad is set to index number 11, which is for the variable pres.
Send:
Receive:
B-22
Model 49i Instruction Manual
sp field 5
sp field 5 11 pres
Thermo Fisher Scientific
C-Link Protocol Commands
Datalogging
set sp field number value
number = 1-32 is the maximum number of fields in long and short record
lists.
number = 1-8 is for streaming data lists.
This command sets the scratch pad field number (item number in scratch
pad list) to value, where value is the index number of a variable in the analog
out variable list. Available variables and their corresponding index numbers
may be obtained using the command “list var aout”. The “set sp field”
command is used to create a list of variables which can then be transferred
into the long record, short record, or streaming data lists, using the “set
copy sp to lrec”, “set copy sp to srec”, or “set copy sp to stream” commands.
Send:
Receive:
set sp field 5 11
set sp field 5 11 ok
stream per
This command reports the currently set time interval in seconds for
streaming data.
Send:
Receive:
stream per
stream per 10
set stream per number value
number value = | 1 | 2 | 5 | 10 | 20 | 30 | 60 | 90 |120 | 180 | 240 | 300 |
This command sets the time interval between two consecutive streaming
data strings to number value in seconds. The example that follows sets the
number value to 10 seconds.
Send:
Receive:
set stream per 10
set stream per 10 ok
stream time
This command reports if the streaming data string will have a time stamp
attached to it or not, according to Table B-5.
Send:
Receive:
stream time
stream time 1
set stream time value
This command enables value, where value is to attach or disable time stamp
to streaming data string, according toTable B-5. The example that follows
attaches a time stamp to streaming data.
Thermo Fisher Scientific
Model 49i Instruction Manual
B-23
C-Link Protocol Commands
Calibration
Send:
Receive:
set stream time 0
set stream time 0 ok
Table B-5. Stream Time Values
Calibration
Value
Stream Time
0
Attaches time stamp to streaming data string
1
Does not attach time stamp to streaming data string
set cal o3 coef
set cal high o3 coef
set cal low o3 coef
These commands will auto-calibrate the O3 coefficient based on the O3
span gas concentrations. The high and low commands are only available in
dual and auto range mode. If the mode is incorrect, the instrument responds
with “can’t, wrong settings”. The example that follows shows a successful
auto-calibration of the low O3 coefficient.
Send:
Receive:
set cal low 03 coef
set cal low 03 coef ok
set cal o3 bkg
These commands will auto-calibrate the O3 background. If the instrument
is set to manual O3 mode, the response to “set O3 bkg” will be “can’t, wrong
settings”. The example that follows shows a successful auto-calibration of
the O3 background.
Send:
Receive:
set cal 03 bkg
set cal 03 bkg ok
o3 coef
high o3 coef
low o3 coef
These commands report the O3 coefficient in single range mode, or the high
and low range coefficients in dual or auto range mode. If the mode is
incorrect, the instrument responds with “can’t, wrong settings”. The
example that follows reports that the O3 coefficient is 1.000.
Send:
Receive:
B-24
Model 49i Instruction Manual
o3 coef
o3 coef 1.000
Thermo Fisher Scientific
C-Link Protocol Commands
Calibration
set o3 coef value
set high o3 coef value
set low o3 coef value
These commands set the O3 coefficient to user-defined values to value,
where value is a floating-point representation of the coefficient. The
example that follows sets the O3 coefficient to 1.005.
Send:
Receive:
set o3 coef 1.005
set o3 coef 1.005 ok
o3 gas
high o3 gas
low o3 gas
These commands report the low O3 span gas concentrations used to
auto-calibrate low O3 coefficients. The high and low commands are only
available in dual and auto range mode. If the mode is incorrect, the
instrument responds with “can’t, wrong settings”. The example that follows
shows that the O3 low span gas concentration is 240.0 ppm.
Send:
Receive:
low o3 gas
low o3 gas 2400E-1 ppm
set o3 gas value
set high o3 gas value
set low o3 gas value
These commands set the O3 span gas concentrations used by the
auto-calibration routine to value, where value is a floating-point
representation of the gas concentration in current selected units. The gas
units are the same as those chosen by the user. The example that follows sets
the O3 span gas concentration to 123.4 ppm.
Send:
Receive:
set o3 gas 123.4
set o3 gas 123.4 ok
o3 bkg
These commands report the current O3 background. The example that
follows reports that the O3 background is 5.5 ppb.
Send:
Receive:
o3 bkg
o3 bkg 5.5 ppb
set o3 bkg value
These commands are used to set O3 background to user-defined values to
value, where value is a floating-point representation of the background in
current selected units. The example that follows sets the O3 background to
5.5 ppb.
Thermo Fisher Scientific
Model 49i Instruction Manual
B-25
C-Link Protocol Commands
Keys/Display
Send:
Receive:
set no bkg 5.5
set no bkg 5.5 ok
set cal detectors
This command is used to balance the output for both detectors so that they
read the same value
Send:
Receive:
set cal detectors
set cal detectors ok
sp conc
high sp conc
low sp conc
These commands report span concentration in single range mode, or the
high and low span concentrations in dual or auto range mode. If the mode is
incorrect, the instrument responds with “can’t, wrong settings”. The
example below reports the span gas concentration in single range mode.
Send:
Receive:
sp conc
sp conc 1000
set sp conc value
set high sp conc value
set low sp conc value
These commands set the span concentrations to user-defined values to
value, where value is a floating-point representation of the span
concentration in current selected units. The example below sets the span
concentration to 1000 ppb in the single range mode.
Send:
Receive:
Keys/Display
B-26
Model 49i Instruction Manual
set sp conc 1000
set sp conc 1000 ok
push button
do
down
en
enter
he
help
le
left
me
menu
ri
right
ru
Thermo Fisher Scientific
C-Link Protocol Commands
Keys/Display
run
up
1
2
3
4
button = | do | down | en | enter | he | help | le | left | me | menu | ri | right |
ru | run | up | 1 | 2 | 3 | 4 |
These commands simulates pressing the front panel pushbuttons. The
numbers represent the front-panel soft keys, from left to right.
Send:
Receive:
push enter
push enter ok
isc
iscreen
This command retrieves the framebuffer data used for the display on the
iSeries instrument. It is 19200 bytes in size, 2-bits per pixel, 4 pixels per
byte arranged as 320 by 240 characters. The data is sent in RLE encoded
form to save time in transmission. It is sent as a type '5' binary c_link
response with no checksum.
Thermo Fisher Scientific
Model 49i Instruction Manual
B-27
C-Link Protocol Commands
Keys/Display
The RLE encoding consists of a 0 followed by an 8-bit count of consecutive
0xFF bytes. The following 'c' code will expand the incoming data.
Void
unpackDisplay ( void far* tdib, unsigned char far* rlescreen )
{
int i,j,k;
unsigned char far *sc4bpp, *sc2bpp, *screen, *ptr;
ptr = screen = (unsigned char far *)malloc(19200);
//RLE decode the screen
for (i=0; i<19200 && (ptr - screen) < 19200; i++)
{
*(ptr++) = *(rlescreen + i);
if (*(rlescreen + i) == 0)
{
unsigned char rlecount = *(unsigned char *)(rlescreen + ++i);
while (rlecount)
{
*(ptr++) = 0;
rlecount--;
}
}
else if (*(rlescreen + i) == 0xff)
{
unsigned char rlecount = *(unsigned char *)(rlescreen + ++i);
while (rlecount)
{
*(ptr++) = 0xff;
rlecount--;
}
}
}
To convert this data into a BMP for use with windows, it needs to be turned
into a 4BPP as that is the smallest windows can display. Also note that BMP
files are upside down relative to this data, i.e. the top display line is the last
line in the BMP.
sc
screen
This command is meant for backward compatibility on the C series. Screen
information is reported using the “iScreen” command above.
Send:
screen
Receive: screen This is an I series Instrument. Screen Information
not available
B-28
Model 49i Instruction Manual
Thermo Fisher Scientific
C-Link Protocol Commands
Measurement Configuration
Measurement
Configuration
range
high range
low range
These commands report the O3 range in single range mode, or the high and
low ranges in dual or auto range mode, according to Table B-6. If the mode
is incorrect, the instrument responds with “can’t, wrong settings”. The
example that follows reports that the O3 range is 50 ppb.
Send:
Receive:
range o3
range o3 0: 5000E-2 ppb
set range selection
set high range selection
set low range selection
These commands select the O3 full-scale range, according to Table B-6. The
example that follows sets the O3 full-scale to 2,000 ppb (2 ppm).
Send:
Receive:
set range o3 5
set range o3 5 ok
Table B-6. Range Settings
Thermo Fisher Scientific
Code
ppm
mg/m3
0
0.05
0.1
1
0.1
0.2
2
0.2
0.4
3
0.5
1
4
1
2
5
2
4
6
5
10
7
10
20
8
20
40
9
50
100
10
100
200
11
200
400
12
C1
C1
13
C2
C2
14
C3
C3
Model 49i Instruction Manual
B-29
C-Link Protocol Commands
Measurement Configuration
custom range
range = | 1 | 2 | 3 |
This command reports the user-defined value of custom range 1, 2, or 3.
The example that follows reports that custom range 1 is defined to 55.0
ppm.
Send:
Receive:
custom 1
custom 1 5500E-2 ppm
set custom range value
set custom 1 value
set custom 2 value
set custom 3 value
set custom 1 range value
set custom 2 range value
set custom 3 range value
These commands are used to set the maximum concentration for any of the
three custom ranges 1, 2, or 3 to range value, where value is a floating-point
number representing concentration in ppm or mg/m3. The example that
follows sets the custom 1 range to 55.5 ppm.
Send:
Receive:
set custom 1 range 55.5
set custom 1 range 55.5 ok
range mode
This command reports the current range mode.
Send:
Receive:
range mode
range mode single
set range mode mode
This command sets the current range mode to single, dual, or auto. The
example that follows sets the range mode to single.
Send:
Receive:
set range mode single
set range mode single ok
gas mode
This command reports the current mode of sample, zero, or span. The
example that follows reports that the gas mode is sample.
Send:
Receive:
B-30
Model 49i Instruction Manual
gas mode
gas mode sample
Thermo Fisher Scientific
C-Link Protocol Commands
Measurement Configuration
set sample
set zero
set span
These commands set the current gas mode to sample, zero, or span. The
example that follows sets the instrument to span mode, that is, the
instrument is sampling span gas.
Send:
Receive:
set span
set span ok
gas unit
This command reports the current gas units (ppm or mg/m3). The example
reports that the gas unit is set to ppb.
Send:
Receive:
gas unit
gas unit ppb
set gas unit
unit = | ppm | mg/m3 |
This command sets the gas units to ppm or mg/m3. The example that
follows sets the gas units to mg/m3.
Send:
Receive:
set gas unit mg/m3
set gas unit mg/m3 ok
lamp
This reports the current photometer lamp setting. The example that follows
reports that the lamp setting is 72.9%
Send:
Receive:
lamp setting
lamp setting 72.9%
set lamp ddd.d
This command sets the photometer lamp setting to ddd.d, where ddd.d is a
floating-point number representing a percentage of the photometer lamp
setting. The example that follows sets the photometer lamp to 75.5%.
Send:
Receive:
set lamp 75.5
set lamp 75.5 ok
lamp setting
This command reports the current photometer lamp setting. The example
that follows reports that the lamp setting is 72.9%.
Send:
Receive:
Thermo Fisher Scientific
lamp setting
lamp setting 72.9%
Model 49i Instruction Manual
B-31
C-Link Protocol Commands
Measurement Configuration
set lamp ddd.d
This command sets the photometer lamp setting. The example that follows
sets the photometer lamp to 75.0 %.
Send:
Receive:
set lamp 75.0
set lamp 75.0 ok
pres comp
This command reports whether pressure compensation is on or off. The
example that follows shows that pressure compensation is on.
Send:
Receive:
pres comp
pres comp on
set pres comp onoff
These commands turn the pressure compensation on or off. The example
that follows turns pressure compensation off.
Send:
Receive:
set pres comp off
set pres comp off ok
set pump onoff
This command turns the pump on or off. The example that follows turns the
pump off.
Send:
Receive:
set pump off
set pump off ok
temp comp
This command reports whether temperature compensation is on or off. The
example that follows shows the temperature compensation is off.
Send:
Receive:
temp comp
temp comp off
set temp comp onoff
These commands turn the temperature compensation on or off. The
example that follows turns temperature compensation off.
Send:
Receive:
B-32
Model 49i Instruction Manual
set temp comp off
set temp comp off ok
Thermo Fisher Scientific
C-Link Protocol Commands
Hardware Configuration
l1
l2
l3
l4
l5
These commands report each of the five custom level settings as a
percentage of ozonator lamp drive. The example that follows reports that
level 2 is 20%.
Send:
Receive:
l2
l2 2o.o %
set l1
set l2
set l3
set l4
set l5
These commands set each of the five custom level settings as a percentage of
ozonator lamp drive. The example that follows sets level 4 to 40%.
Send:
Receive:
Hardware
Configuration
set l4 40
set l4 4o ok
contrast
This command reports the screen’s level of contrast. The example that
follows shows the screen contrast is 50%, according to Table B-7.
Send:
Receive:
contrast
contrast 5: 50%
set contrast level
This command sets the screen’s level of contrast, according to Table B-7.
The example that follows sets the contrast level to 50%.
Send:
Receive:
set contrast 5
set contrast 5 ok
Table B-7. Contrast Levels
Thermo Fisher Scientific
Level
Contrast Level
0
0%
1
10%
2
20%
3
30%
4
40%
Model 49i Instruction Manual
B-33
C-Link Protocol Commands
Hardware Configuration
Table B-7. Contrast Levels, continued
Level
Contrast Level
5
50%
6
60%
7
70%
8
80%
9
90%
10
100%
date
This command reports the current date. The example that follows reports
the date as December 1, 2004.
Send:
Receive:
date
date 12-01-04
set date mm-dd-yy
mm = month
dd = day
yy = year
This command sets the date of the analyzer’s internal clock. The example
that follows sets the date to March 19, 2005.
Send:
Receive:
set date 03-19-05
set date 03-19-05 ok
set default params
This command sets all the parameters to their default values. This does not
affect the factory-calibrated parameters.
Send:
Receive:
B-34
Model 49i Instruction Manual
set default params
set default params ok
Thermo Fisher Scientific
C-Link Protocol Commands
Communications Configuration
save
set save params
This command stores all current parameters in FLASH memory. It is
important that each time instrument parameters are changed, that this
command be sent. If changes are not saved, they will be lost in the event of
a power failure. The example that follows saves the parameters to FLASH
memory.
Send:
Receive:
set save params
set save params ok
time
This command reports the current time (24-hour time). The example that
follows reports that the internal time is 2:15:30 pm.
Send:
Receive:
time
time 14:15:30
set time hh:mm:ss
hh = hours
mm = minutes
ss = seconds
This command sets the internal clock (24-hour time). The example that
follows sets the internal time to 2:15 pm.
Note If seconds are omitted, the seconds default to 00. Send:
Receive:
Communications
Configuration
set time 14:15
set time 14:15 ok
addr dns
This command reports the TCP/IP address for the domain name server.
Send:
Receive:
addr dns
addr dns 192.168.1.1
set addr dns address
This command sets the domain name server address, where address consists
of four numbers ranging from 0-255 inclusive, separated by “.”.
Send:
Receive:
Thermo Fisher Scientific
set addr dns 192.168.1.1
set addr dns 192.168.1.1 ok
Model 49i Instruction Manual
B-35
C-Link Protocol Commands
Communications Configuration
addr gw
This command reports the default TCP/IP gateway address.
Send:
Receive:
addr gw
addr gw 192.168.1.1
set addr gw address
This command sets the default gateway address, where address consists of
four numbers ranging from 0-255 inclusive, separated by “.”.
Send:
Receive:
set addr gw 192.168.1.1
set addr gw 192.168.1.1 ok
addr ip
This command reports the IP address of the analyzer.
Send:
Receive:
addr ip
addr ip 192.168.1.15
set addr ip address
This command sets the analyzer’s IP address, where address consists of four
numbers ranging from 0-255 inclusive, separated by “.”.
Send:
Receive:
set addr ip 192.168.1.15
set addr ip 192.168.1.15 ok
addr nm
This command reports the TCP/IP netmask address.
Send:
Receive:
addr nm
addr nm 255.255.255.0
set addr nm address
This command sets the netmask address, where address consists of four
numbers ranging from 0-255 inclusive, separated by “.”.
Send:
Receive:
set addr nm 255.255.255.0
set addr nm 255.255.255.0 ok
baud
This command reports the current baud rate for the serial port
(RS232/RS485). The example that follows reports that the current baud
rate is 9600.
Send:
Receive:
B-36
Model 49i Instruction Manual
baud
baud 9600
Thermo Fisher Scientific
C-Link Protocol Commands
Communications Configuration
set baud rate
rate = | 1200 | 2400 | 4800 | 9600 | 19200 | 38400 | 57600 | 115200 |
This command sets the instrument baud rate. The example that follows sets
the instrument’s baud rate to 115200.
Note After the command is sent, the baud rate of the sending device must
be changed to agree with the instrument. Send:
Receive:
set baud 115200
set baud 115200 ok
dhcp
This command reports the current state of use of DHCP on or off. DHCP
is used to assign an IP address to the analyzer automatically. The example
that follows shows that DHCP is on.
Send:
Receive:
dhcp
dhcp on
set dhcp onoff
These commands enables and disables the DHCP service by either on or off.
Changes to this parameter will only take effect when the analyzer is powered
up. The example that follows sets the DHCP service on.
Note When DHCP is set to on, the user-supplied addr gw, addr dns, addr
ip, and addr nm parameters are not used. Send:
Receive:
set dhcp on
set dhcp on ok
format
This command reports the current reply termination format. The example
that follows shows that the reply format is 00, which means reply with no
checksum, according to Table B-8.
Send:
Receive:
format
format 00
set format format
This command sets the reply termination format, where format is set
according to Table B-8. The example that follows sets the reply termination
format to checksum.
Send:
Receive:
Thermo Fisher Scientific
set format 01
set format 01 ok
Model 49i Instruction Manual
B-37
C-Link Protocol Commands
Communications Configuration
Table B-8. Reply Termination Formats
Format
Reply Termination
00
<CR>
01
<NL> sum xxxx <CR>
where xxxx = 4 hexadecimal digits that represent the sum of all the
characters (bytes) in the message
host name
This command reports the host name string.
Send:
Receive:
host name
host name ISERIES
set host name string
This command sets the host name string, where string is 1-13 alphanumeric
characters.
Send:
Receive:
set host name analyzer01
set host name analyzer01 ok
instr name
This command reports the instrument name.
Send:
instr name
Receive: instr name
o3 Analyzer
03 Analyzer
instrument id
This command reports the instrument id.
Send:
Receive:
instrument id
instrument id 49
set instrument id value
This command sets the instrument id to value, where value is a decimal
number between 0 and 127 inclusive.
Note Sending this command via RS-232 or RS-485 will require the host to
use the new id for subsequent commands. Send:
Receive:
B-38
Model 49i Instruction Manual
set instrument id 50
set instrument id 50 ok
Thermo Fisher Scientific
C-Link Protocol Commands
I/O Configuration
mode
This command reports what operating mode the instrument is in: local,
service, or remote. The example that follows shows that the instrument is in
the remote mode.
Send:
Receive:
mode
mode remote
set mode local
set mode remote
These commands set the instrument to local or remote mode. The example
that follows sets the instrument to the local mode.
Send:
Receive:
set mode local
set mode local ok
program no
This command reports the analyzer’s model information and program
version number, which will be dependant on the current version.
Send:
Receive:
program no
program no iSeries 49i 01.00.01.074
set layout ack
This command disables the stale layout/layout change indicator (‘*’) that is
attached to each response if the layout has changed.
Send:
Receive:
I/O Configuration
set layout ack
set layout ack ok
analog iout range channel
This command reports the analog current output range setting for channels,
where channel must be between 1 and 6, inclusive. The example that follows
reports current output channel 4 to the 4-20 mA range, according to
Table B-9. This command responds with “feature not enabled” if the I/O
expansion board is not detected.
Send:
Receive:
analog iout range 4
analog iout range 4 2
set analog iout range channel range
This command sets analog current output channel to the channel range
where channel is between 1 and 6 inclusive, and range is set according to
Table B-9. The example that follows sets current output channel 4 to the
0-20 mA range. This command responds with “feature not enabled” if the
I/O expansion board is not detected.
Thermo Fisher Scientific
Model 49i Instruction Manual
B-39
C-Link Protocol Commands
I/O Configuration
Send:
Receive:
set analog iout range 4 1
set analog iout range 4 1 ok
Table B-9. Analog Current Output Range Values
Range
Output Range
1
0-20 mA
2
4-20 mA
0 [cannot be set to this, but may report]
Undefined
analog vin channel
This command retrieves the analog voltage input channel data, both the
calculated value and the actual voltage. In the example that follows, the
“calculated” value of channel 1 is 75.325 degrees F, volts are 2.796. This
command responds with “feature not enabled” if the I/O expansion board is
not detected.
Send:
Receive:
analog vin 1
analog vin 1 75.325 2.796
analog vout range channel
This command reports the analog voltage output channel range, where
channel is between 1 and 6 inclusive, according to Table B-10.
Send:
Receive:
analog vout range 2
analog vout range 2 3
set analog vout range channel range
This command sets analog voltage output channel to the range, where
channel is between 1 and 6 inclusive, and range is set according to
Table B-10. The example that follows sets channel 2 to the 0-10 V range.
Send:
Receive:
set analog vout range 2 3
set analog vout range 2 3 ok
Table B-10. Analog Voltage Output Range Values
B-40
Model 49i Instruction Manual
Range
Output Range
1
0-1 V
2
0-100 mV
3
0-10 V
4
0-5 V
0 [cannot be set to this, but may report]
Undefined
Thermo Fisher Scientific
C-Link Protocol Commands
I/O Configuration
dig in
This command reports the status of the digital inputs as a 4-digit
hexadecimal string with the most significant bit (MSB) being input 16.
Send:
Receive:
dig in
dig in 0xff7f
din channel
This command reports the action assigned to input channel and the
corresponding active state. The example that follows reports the input 5 to
be assigned an index number 9 corresponding to action of “analog outputs
to zero” with the active state being high.
Send:
Receive:
din 5
din 5 9 AOUTS TO ZERO high
set din channel index state
This command assigns digital input channel (1-16) to activate the action
indicated by index (1-35), when the input transitions to the designated state
(high or low). Use “list din var” command to obtain the list of supported
index values and corresponding actions.
Send:
Receive:
set din 1 3 high
set din 1 3 high ok
dout channel
This command reports the index number and output variable and the active
state assigned to output channel. The example that follows reports the input
4 to be assigned an index number 11 corresponding to “general alarm” with
the active state being open.
Send:
Receive:
dout 4
dout 4 11 GEN ALARM open
set dout channel index state
This command assigns digital output channel to be assigned to the action
associated with index, and assigns it an active state of state (open or closed).
Send:
Receive:
set dout 4 11 open
set dout 4 11 open ok
dtoa channel
This reports the outputs of the 6 or 12 digital to analog converters,
according to Table B-11. The example that follows shows that the DAC 1 is
97.7% full-scale.
Thermo Fisher Scientific
Model 49i Instruction Manual
B-41
C-Link Protocol Commands
I/O Configuration
Send:
Receive:
dtoa 1
dtoa 1 97.7%
Note All channel ranges are user definable. If any customization has been
made to the analog output configuration, the default selections may not
apply. Table B-11. Default Output Assignment
D to A
Function
1
Voltage Output
2
Voltage Output
3
Voltage Output
4
Voltage Output
5
Voltage Output
6
Voltage Output
7
Current Output
8
Current Output
9
Current Output
10
Current Output
11
Current Output
12
Current Output
list var aout
list var dout
list var din
These commands report the list of index numbers and the variables
(associated with that index number) available for selection in the current
mode (determined by single/dual/auto) for analog output, digital output
and digital inputs. The index number is used to insert the variable in a field
location in a list using “set sp field index”. The example that follows reports
the list of analog output, index numbers, and variables.
Send:
list var aout
Receive: list var aout
index variable
0 none
1 o3
2 no2
5 cellai
6 cellbi
7 noisa
8 noisb
B-42
Model 49i Instruction Manual
Thermo Fisher Scientific
C-Link Protocol Commands
Record Layout Definition
9 flowa
10 flowb
11 pres
12 bncht
13 lmpt
relay
relay stat
This command reports the current relay logic normally “open” or normally
“closed,” if all the relays are set to same state, that is all open or all closed.
The example that follows shows that the status when all the relays logic is set
to normally “open”.
Send:
Receive:
relay stat
relay stat open
Note If individual relays have been assigned different logic, the response
would be a 4-digit hexadecimal string with the least significant byte (LSB)
being relay no 1. For example:
Receive: relay stat 0x0001 (indicates relay no 1 is set to normally
open logic, all others are normally closed)
Receive: relay stat 0x0005 (indicates relay no 1 and 3 are set to be
normally open logic, all others are normally closed)
set relay open
set relay open value
set relay closed
set relay closed value
These commands set the relay logic to normally open or closed for relay
number value, where value is the relay between 1 and 16. The example that
follows sets the relay no 1 logic to normally open.
Note If the command is sent without an appended relay number then all the
relays are assigned the set logic of normally open/closed. Send:
Receive:
Record Layout
Definition
Thermo Fisher Scientific
set relay open 1
set relay open 1 ok
The Erec, Lrec, and Srec Layouts contain the following:
•
A format specifier for parsing ASCII responses
•
A format specifier for parsing binary responses
Model 49i Instruction Manual
B-43
C-Link Protocol Commands
Record Layout Definition
In addition to these, the Erec Layout contains:
•
A format specifier for producing the front-panel displays
In operation, values are read in using either the ASCII or binary format
specifiers and converted to uniform internal representations (32-bit floats or
32-bit integers). These values are converted into text for display on the
screen using the format specifier for the front-panel display. Normally, the
specifier used to parse a particular datum from the input stream will be
strongly related to the specifier used to display it (e.g., all of the floating
point inputs will be displayed with an 'f' output specifier, and all of the
integer inputs will be displayed with a 'd' specifier).
Format Specifier for ASCII
Responses
The first line of the Layout response is the scanf-like parameter list for
parsing the fields from an ASCII ERec response. Parameters are separated by
spaces and the line is terminated by a \n (the normal line separator
character). Valid fields are:
%s
%d
%ld
%f
%x
%lx
%*
-
parse a string
parse a decimal number
parse a long (32-bit) decimal number
parse a floating point number
parse a hexadecimal number
parse a long (32-bit) hex number
ignore the field
Note Signed versus unsigned for the integer values does not matter; it is
handled automatically. Format Specifier for
Binary Responses
The second line of the Layout response is the binary parameter list for
parsing the fields from a binary response. Parameters MUST be separated by
spaces, and the line is terminated by a '\n'. Valid fields are:
t
D
i
e
E
f
c
C
n
N
m
M
l
L
B-44
Model 49i Instruction Manual
-
parse a time specifier (2 bytes)
parse a date specifier (3 bytes)
ignore one 8-bit character (1 byte)
parse a 24-bit floating point number (3 bytes: n/x)
parse a 24-bit floating point number (3 bytes: N/x)
parse a 32-bit floating point number (4 bytes)
parse an 8-bit
signed number (1 byte)
parse an 8-bit unsigned number (1 byte)
parse a 16-bit
signed number (2 bytes)
parse a 16-bit unsigned number (2 bytes)
parse a 24-bit
signed number (3 bytes)
parse a 24-bit unsigned number (3 bytes)
parse a 32-bit
signed number (4 bytes)
parse a 32-bit unsigned number (4 bytes)
Thermo Fisher Scientific
C-Link Protocol Commands
Record Layout Definition
There is an optional single digit d which may follow any of the numeric
fields which indicates that after the field has been parsed out, the resulting
value is to be divided by 10^d. Thus the 16-bit field 0xFFC6 would be
interpreted with the format specifier 'n3' as the number -0.058.
Format Specifier for
Front-Panel Layout
The subsequent lines in the ERec Layout response describe the appearance
of the full panel. The full instrument panel as it appears on the screen has
two columns of lines. Each line is composed of three major components: (1)
a text field, (2) a value field, and (3) a button. None of these three
components is required. The text field contains statically displayed text.
The value field displays values which are parsed out of the response to a
DATA/ERec command. It also displays, though background changes, alarm
status. The button, when pressed, triggers input from either a dialog box or
a selection list. There are five kinds of buttons, B, I, L, T, and N.
Each line in the layout string corresponds to one line on the display. The
layout string describes each of the three major fields as well as translation
mechanisms and corresponding commands.
Text
Value String
Value Source
The first field in the layout string is the text. It is delimited by a ':'. The
string up to the first ':' will be read and inserted in the text field of the line.
This is followed by a possible string, enclosed in quotes. This is used to
place a string into the value field.
The value source, which is the item (or word) number in the DATA/ERec
response, appears next. This is followed by an optional bitfield designator.
The datum identified by the value source can be printed as a string 's',
hexadecimal 'x', decimal 'd', or floating point 'f', or binary 'b' number.
Typically, bitfield extractions are only done for decimal or hexadecimal
numbers.
Floating-point numbers can be followed with an optional precision specifier
which will be used as an argument to printf's %f format (e.g., a field of '4'
would be translated into the printf command of '%.3f'). Alternately, the
special character '*' can precede the precision specifier; this causes an
indirection on the precision specifier (which now becomes a field number).
This is useful when formatting, for example, numbers which have varying
precision depending on the mode of the instrument.
Thermo Fisher Scientific
Model 49i Instruction Manual
B-45
C-Link Protocol Commands
Record Layout Definition
Binary numbers can also have an optional precision specifier which is used
to determine how many bits to print. For example, the specifier 'b4' will
print the lowest four bits of the parsed number.
There are serious restrictions on where an 's' field may appear: currently
sources 1 and 2 must be 's', and no others may be 's'.
Alarm Information
The value source is followed by optional alarm information, indicated by a
commercial at sign '@' with a source indicator and a starting bit indicator.
All alarm information is presumed to be two bits long (low and high). The
bitfield extraction is performed on the integer part of the source. Typical
alarm information would appear as '@6.4'.
Translation Table
Then, there appears an optional translation table within braces '{}'. This is a
string of words separated by spaces. An example translation table would be
'{Code_0 Code_1 Code_2 Code_3}'. The value, once extracted is used as a
zero-based index into the translation table to determine the string to display.
Selection Table
Then there appears an optional selection table within parentheses '(...)'.
This is a string of numbers separated by spaces '(0 1)'. The selection table
lists the translation table entries which the user may select from when setting
the parameter. This is not necessarily the same as the entries which may be
displayed.
Button Designator
Then there appears an optional button designator. This will be one of 'B',
'I', 'L', 'T', or 'N'.
B- Indicates a button which pops up an input dialog prompting the user
for a new value using the designated input format. The input format is
specified from the 'B' through the subsequent semicolon.
I—Indicates a button which pops up a selection list with input
translation. That is, the values read are translated before they are
compared to the selection list options.
L—Indicates a button which pops up a selection list without any
translation. The output value is number of the selected option.
T—Indicates a button which pops up a selection list with output
translation. The number of the option selected is used as an index into
the translation table to generate an output string.
B-46
Model 49i Instruction Manual
Thermo Fisher Scientific
C-Link Protocol Commands
Record Layout Definition
N—Indicates a button which only sends the subsequent command to
the instrument. No user-prompting happens.
The following string through an optional ‘|’ or the end of the line is the
command which is to be sent to the instrument upon the completion of the
button selection. The command string should normally contain print-style
formatting to include the user input. If a ‘|’ is present, it indicates a
command which is sent to the instrument upon successful completion of
the button command to update the value field.
This is not currently used.
Examples
Some examples ('\n' is the C syntax for an end-of-line character):
'Concentrations\n'
This is a single text-only line.
'\n'
This is a single blank line.
' O3:3s\n'
This is a line which appears slightly indented. The text field is 'O3', the value
is taken from the third element of the data response, and interpreted as a
string.
' O3:18sBd.ddd;set no coef %s\n'
This is a line which also appears slightly indented. The next field is also 'O3',
but the value is taken from the eighteenth element of the data response,
again interpreted as a string. A button appears on this line which, when
pressed, pops up an input dialog which will state "Please enter a new value
for O3 using a d.ddd format." The string entered by the user is used to
construct the output command. If the user enters, for example, '1.234', the
constructed command will be 'set no coef 1.234'.
' O3:21f{Code_0 Code_1 Code_2 Code_3 Code_4 Code_5 Code_6 Code_7
Code_8 Code_9 Code_10 Code_11}Lset range no %d\n'
This is a line which appears slightly indented, the title is again 'O3', and the
value the twenty-first element of the data response, interpreted as a
floating-point number. There is a no-translation button which creates a
selection list of twelve "Code nn" options. The number of the user selection
is used to create the output command.
Thermo Fisher Scientific
Model 49i Instruction Manual
B-47
C-Link Protocol Commands
Record Layout Definition
'Mode:6.12-13x{local remote service service}(0 1)Tset mode %s\n'
This is a line which has a title of 'Mode', and value taken from the sixth field
of the data response. There is a bitfield extraction of bits 12 through 13
from the source (the value type is not important here because the value is
being translated to an output string). Once the bits have been extracted,
they are shifted down to the bit-zero position. Thus, the possible values of
this example will be 0 through 3. The translation list shows the words which
correspond to each input value, the zeroth value appearing first (0 -> local, 1
-> remote, etc.). The selection list shows that only the first two values, in
this case, are to be shown to the user when the button is pressed. The 'T'
button indicates full translation, input code to string, and user selection
number to output string.
'\xC'
This is a line that starts a new column (the \xC or ^L),
' Comp:6.11x{off on}Tset temp comp %s\n'
This shows that the bitfield end (the second part of a bitfield specification)
is optional. The bitfield will be one bit long, starting in this case at the
eleventh bit.
'Background:7f*8Bd.ddd;set o3 bkg %s\n'
This shows the use of indirect precision specifiers for floating point displays.
The background value is taken from the 7th element, and the precision
specifier is taken from the 8th. If the asterisk were not present, it would
indicate instead that 8 digits after the decimal point should be displayed.
B-48
Model 49i Instruction Manual
Thermo Fisher Scientific
Appendix C
MODBUS Protocol
This appendix provides a description of the MODBUS Protocol Interface
and is supported both over RS-232/485 (RTU protocol) as well as TCP/IP
over Ethernet.
The MODBUS Commands that are implemented are explained in detail in
this document. The MODBUS protocol support for the iSeries enables the
user to perform the functions of reading the various concentrations and
other analog values or variables, read the status of the digital outputs of the
analyzer, and to trigger or simulate the activation of a digital input to the
instrument. This is achieved by using the supported MODBUS commands
listed below.
For details of the Model 49i MODBUS Protocol specification, see the
following topics:
•
“Serial Communication Parameters” on page C-2 describes the
parameters used to support MODBUS RTU protocol.
•
“TCP Communication Parameters” on page C-2 describes the
parameters used for TCP connection.
•
“Application Data Unit Definition” on page C-2 describes the formats
used over serial and TCP/IP.
•
“Function Codes” on page C-3 describes the various function codes
supported by the instrument.
•
“MODBUS Commands Supported” on page C-8 lists the MODBUS
commands supported in Table C-1 through Table C-3.
Additional information on the MODBUS protocol can be obtained at
http://www.modbus.org. References are from MODBUS Application
Protocol Specification V1.1a MODBUS-IDA June 4, 2004.
Thermo Fisher Scientific
Model 49i Instruction Manual
C-1
MODBUS Protocol
Serial Communication Parameters
Serial Communication
Parameters
The following are the communication parameters that are used to configure
the serial port of the iSeries to support MODBUS RTU protocol.
Number of Data bits : 8
TCP Communication
Parameters
Number of Stop bits
:1
Parity
: None
Data rate
: from 1200-115200 Baud (9600 is default)
iSeries Instruments support the MODBUS/TCP protocol. The register
definition is the same as for the serial interface.
TCP connection port for MODBUS : 502
Application Data Unit
Definition
Slave Address
Here are the MODBUS ADU (Application Data Unit) formats over serial
and TCP/IP:
Serial:
Slave Address
Function Code
Data
TCP/IP:
MBAP Header
Function Code
Data
Error Check
The MODBUS slave address is a single byte in length. This is the same as
the instrument ID used for C-Link commands and can be between 1 and
127 decimal (i.e. 0x01 hex to 0x7F hex). This address is only used for
MODBUS RTU over serial connections.
Note Device ID ‘0’ used for broadcast MODBUS commands, is not
supported. Device IDs 128 through 247 (i.e. 0x80 hex to 0xF7 hex) are not
supported because of limitations imposed by C-Link. MBAP Header
C-2
Model 49i Instruction Manual
In MODBUS over TCP/IP, a MODBUS Application Protocol Header
(MBAP) is used to identify the message. This header consists of the
following components:
Transaction Identifier
2 Bytes
0x0000 to 0xFFFF (Passed back in response)
Protocol Identifier
2 Bytes
0x00 (MODBUS protocol)
Length
2 Bytes
0x0000 to 0xFFFF (Number of following bytes)
Unit Identifier
1 Byte
0x00 to 0xFF (Passed back in response)
Thermo Fisher Scientific
MODBUS Protocol
Function Codes
A Slave address is not required in MODBUS over TCP/IP because the
higher-level protocols include device addressing. The unit identifier is not
used by the instrument.
Function Code
The function code is a single byte in length. The following function codes
are supported by the instrument:
Read Coils
:
0x01
Read Inputs
:
0x02
Read Holding Registers
:
0x03
Read Input Registers
:
0x04
Force (Write) Single Coil
:
0x05
Read Exception Status
:
0x07
If a function code is received that is not in this list, and invalid function
exception is returned.
Data
The data field varies depending on the function. For more description of
these data fields, see “Function Codes” below.
Error Check
In MODBUS over Serial an error check is included in the message. This is
not necessary in MODBUS over TCP/IP because the higher-level protocols
ensure error-free transmission. The error check is a two-byte (16-bit) CRC
value.
Function Codes
This section describes the various function codes that are supported by the
Model 49i.
(0x01/0x02) Read Coils /
Read Inputs
Read Coils/Inputs reads the status of the digital outputs (relays) in the
instrument. Issuing either of these function codes will generate the same
response.
These requests specify the starting address, i.e. the address of the first output
specified, and the number of outputs. The outputs are addressed starting at
zero. Therefore, outputs numbered 1–16 are addressed as 0–15.
Thermo Fisher Scientific
Model 49i Instruction Manual
C-3
MODBUS Protocol
Function Codes
The outputs in the response message are packed as one per bit of the data
field. Status is indicated as 1 = Active (on) and 0 = Inactive (off ). The LSB
of the first data byte contains the output addressed in the query. The other
outputs follow toward the high order end of this byte, and from low order to
high order in subsequent bytes. If the returned output quantity is not a
multiple of eight, the remaining bits in the final data byte will be padded
with zeros (toward the high order end of the byte). The Byte Count field
specifies the quantity of complete bytes of data.
Note The values reported may not reflect the state of the actual relays in the
instrument, as the user may program these outputs for either active closed or
open. Request
Function code
1 Byte
0x01 or 0x02
Starting Address
2 Bytes
0x0000 to maximum allowed by instrument
Quantity of outputs
2 Bytes
1 to maximum allowed by instrument
Unit Identifier
1 Byte
0x00 to 0xFF (Passed back in response)
Function code
1 Byte
0x01 or 0x02
Byte count
1 Byte
N*
Output Status
n Byte
n = N or N+1
Response
*N = Quantity of Outputs / 8, if the remainder not equal to zero, then N=N+1
Error Response
Function code
1 Byte
Function code + 0x80
Exception code
1 Byte
01=Illegal Function, 02=Illegal Address,
03=Illegal Data, 04=Slave Device Failure
Here is an example of a request and response to read outputs 2–15:
Request
C-4
Model 49i Instruction Manual
Field Name
(Hex)
Function
0x01
Starting Address Hi
0x00
Starting Address Lo
0x02
Quantity of Outputs Hi
0x00
Quantity of Outputs Lo
0x0D
Thermo Fisher Scientific
MODBUS Protocol
Function Codes
Response
Field Name
(Hex)
Function
0x01
Byte Count
0x03
Outputs status 2-10
0xCD
Outputs status 11-15
0x0A
The status of outputs 2–10 is shown as the byte value 0xCD, or binary
1100 1101. Output 10 is the MSB of this byte, and output 2 is the LSB. By
convention, bits within a byte are shown with the MSB to the left, and the
LSB to the right. Thus the outputs in the first byte are ‘10 through 2’, from
left to right. In the last data byte, the status of outputs 15-11 is shown as the
byte value 0x0A, or binary 0000 1010. Output 15 is in the fifth bit position
from the left, and output 11 is the LSB of this byte. The four remaining
high order bits are zero filled.
(0x03/0x04) Read Holding
Registers / Read Input
Registers
Read holding/input registers reads the measurement data from the
instrument. Issuing either of these function codes will generate the same
response. These functions read the contents of one or more contiguous
registers.
These registers are 16 bits each and are organized as shown below. All of the
values are reported as 32-bit IEEE standard 754 floating point format. This
uses 2 sequential registers, least significant 16 bits first.
The request specifies the starting register address and the number of
registers. Registers are addressed starting at zero. Therefore registers
numbered 1–16 are addressed as 0–15. The register data in the response
message are packed as two bytes per register, with the binary contents right
justified within each byte. For each register, the first byte contains the high
order bits and the second contains the low order bits.
Request
Thermo Fisher Scientific
Function code
1 Byte
0x03 or 0x04
Starting Address
2 Bytes
0x0000 to maximum allowed by instrument
Quantity of Registers
2 Bytes
1 to maximum allowed by instrument
Model 49i Instruction Manual
C-5
MODBUS Protocol
Function Codes
Response
Function code
1 Byte
0x03 or 0x04
Byte count
1 Byte
2 x N*
Register value
N* x 2 Bytes
n = N or N+1
Function code
1 Byte
Function code + 0x80
Exception code
1 Byte
01=Illegal Function, 02=Illegal Address,
*N = Quantity of Registers
Error Response
03=Illegal Data, 04=Slave Device Failure
Here is an example of a request to read registers 10–13:
Request
Field Name
(Hex)
Function
0x03
Starting Address Hi
0x00
Starting Address Lo
0x09
No. of Registers Hi
0x00
No. of Registers Lo
0x04
Response
Field Name
(Hex)
Function
0x03
Byte Count
0x06
Register value Hi (10)
0x02
Register value Lo (10)
0x2B
Register value Hi (11)
0x00
Register value Lo (11)
0x00
Register value Hi (12)
0x00
Register value Lo (12)
0x64
Register value Hi (13)
0x00
Register value Lo (13)
0x64
The contents of register 10 are shown as the two byte values of 0x02 0x2B.
The contents of registers 11–13 are 0x00 0x00, 0x00 0x64 and 0x00 0x64,
respectively.
C-6
Model 49i Instruction Manual
Thermo Fisher Scientific
MODBUS Protocol
Function Codes
(0x05) Force (Write) Single
Coil
The force (write) single coil function simulates the activation of the digital
inputs in the instrument, which triggers the respective action.
This function code is used to set a single action to either ON or OFF. The
request specifies the address of the action to be forced. Actions are addressed
starting at zero. Therefore, action number 1 is addressed as 0. The requested
ON/OFF state is specified by a constant in the request data field. A value of
0xFF00 requests the action to be ON. A value of 0x0000 requests it to be
OFF. All other values are illegal and will not affect the output. The normal
response is an echo of the request, returned after the state has been written.
Request
Function code
1 Byte
0x05
Output Address
2 Bytes
0x0000 to maximum allowed by instrument
Output Value
2 Bytes
0x0000 or 0xFF00
Function code
1 Byte
0x05
Output Address
2 Bytes
0x0000 to maximum allowed by instrument
Output Value
2 Bytes
0x0000 or 0xFF00
Function code
1 Byte
Function code + 0x80
Exception code
1 Byte
01=Illegal Function, 02=Illegal Address,
Response
Error Response
03=Illegal Data, 04=Slave Device Failure
Here is an example of a request to write Coil 5 ON:
Request
Thermo Fisher Scientific
Field Name
(Hex)
Function
05
Output Address Hi
00
Output Address Lo
05
Output Value Hi
FF
Output Value Lo
00
Model 49i Instruction Manual
C-7
MODBUS Protocol
MODBUS Commands Supported
Response
MODBUS Commands
Supported
Field Name
(Hex)
Function
05
Output Address Hi
00
Output Address Lo
05
Output Value Hi
FF
Output Value Lo
00
Table C-1 through table C-3 list the MODBUS commands supported for
the Model 49i.
Table C-1. Read Coils for 49i
C-8
Model 49i Instruction Manual
Coil Number
Status
1
AUTO RANGE
2
SERVICE
3
GAS UNITS
4
ZERO MODE
5
SPAN MODE
6
SAMPLE MODE
7
O3 LEVEL 1
8
O3 LEVEL 2
9
O3 LEVEL 3
10
O3 LEVEL 4
11
O3 LEVEL 5
12
PURGE MODE
13
GEN ALARM
14
CONC MAX ALARM
15
CONC MIN ALARM
16
BENCH TEMP ALARM
17
BENCH LAMP TEMP ALARM
18
O3 LAMP TEMP ALARM
19
PRESSURE ALARM
20
FLOW A ALARM
21
FLOW B ALARM
22
INTENSITY A ALARM
Thermo Fisher Scientific
MODBUS Protocol
MODBUS Commands Supported
Table C-1. Read Coils for 49i, continued
Coil Number
Status
23
INTENSITY B ALARM
24
CONC ALARM
25
ZERO CHK/CAL ALARM (Zero/Span Option)*
26
SPAN CHK/CAL ALARM (Zero/Span Option)*
27
O3 LEVEL 1 CHK ALARM*
28
O3 LEVEL 2 CHK ALARM*
29
O3 LEVEL 3 CHK ALARM*
30
O3 LEVEL 4 CHK ALARM*
31
O3 LEVEL 5 CHK ALARM*
32
MOTHERBOARD STATUS ALARM
33
MEASUREMENT INTERFACE BD STATUS
ALARM
34
I/O EXP BD STATUS ALARM
*Single range only when sample cal valve is installed.
Table C-2. Read Registers for 49i
Thermo Fisher Scientific
Register Number
Variable
40001&40002
O3 CONC
40003&40004
LO O3 CONC (Dual/Auto Range mode)
40005&40006
HI O3 CONC (Dual/Auto Range mode)
40007&40008
RANGE STATUS
40009&40010
INTENSITY A
40011&40012
INTENSITY B
40013&40014
NOISE A
40015&40016
NOISE B
40017&40018
FLOW A
40019&40020
FLOW B
40021&40022
PRESSURE
40023&40024
BENCH TEMP
40025&40026
LAMP TEMP
40027&40028
O3 LAMP TEMP
40029&40030
ANALOG IN 1
Model 49i Instruction Manual
C-9
MODBUS Protocol
MODBUS Commands Supported
Table C-2. Read Registers for 49i, continued
Register Number
Variable
40031&40032
ANALOG IN 2
40033&40034
ANALOG IN 3
40035&40036
ANALOG IN 4
40037&40038
ANALOG IN 5
40039&40040
ANALOG IN 6
40041&40042
ANALOG IN 7
40043&40044
ANALOG IN 8
40045&40046
NOT USED
Table C-3. Write Coils for 49i
C-10
Model 49i Instruction Manual
Coil Number
Action
101
ZERO MODE
102
SPAN MODE
103
OZONATOR LEVEL 1
104
OZONATOR LEVEL 2
105
OZONATOR LEVEL 3
106
OZONATOR LEVEL 4
107
OZONATOR LEVEL 5
108
SET BACKGROUND
109
CAL TO LOW SPAN (Dual/Auto Range mode)
110
CAL TO HIGH SPAN (Dual/Auto Range mode)
111
OZONATOR SOLENOID
112
AOUTS TO ZERO
113
AOUTS TO FS
Thermo Fisher Scientific
Geysitech (Bayern-Hessen)
Protocol
Appendix D
This appendix provides a description of the Geysitech (Bayern-Hessen or
BH) Protocol Interface and is supported both over RS-232/485 as well as
TCP/IP over Ethernet.
The Geysitech Commands that are implemented are explained in detail in
this document. The Geysitech protocol support for the iSeries enables the
user to perform the functions of reading the various concentrations and to
trigger the instrument to be in sample/zero/span mode if valid for that
instrument. This is achieved by using the supported Geysitech commands
listed below.
For details of the Model 49i Geysitech Protocol specification, see the
following topics:
“Serial Communication Parameters” on page D-1
“TCP Communication Parameters” on page D-2
“Instrument Address” on page D-2
“Basic Command Structure” on page D-2
“Block Checksum <BCC>” on page D-3
“Geysitech Commands” on page D-3
Serial Communication
Parameters
The following are the communication parameters that are used to configure
the serial port of the iSeries to support Geysitech protocol.
Number of Data bits : 8
Thermo Fisher Scientific
Number of Stop bits
:1
Parity
: None
Data rate
: from 1200-115200 Baud (9600 is default)
Model 49i Instruction Manual
D-1
Geysitech (Bayern-Hessen) Protocol
TCP Communication Parameters
TCP Communication
Parameters
iSeries Instruments support the Geysitech/TCP protocol over TCP/IP. The
register definition is the same as for the serial interface.
TCP connection port for Geysitech: 9882
Instrument Address
The Geysitech instrument address has a value between 0 and 127 and is
represented by 3 digit ASCII number with leading zeros or leading spaces if
required (e.g. Instrument address of 1 is represented as 001 or <SP><SP>1).
The instrument Address is the same as the Instrument ID used for C-Link
and MODBUS commands. This can be set via the front panel.
The Instrument Address is represented by <address> in the examples
throughout this document.
Note Device IDs 128 through 247 are not supported because of limitations
imposed by the C-Link protocol. Abbreviations Used
The following is a list of abbreviations used in this document:
<CR> is abbreviation for Carriage Return (ASCII code 0x0D)
<STX> is abbreviation for Start of Text (ASCII code 0x02)
<ETX> is abbreviation for End of Text (ASCII code 0x03)
<SP> is abbreviation for space (ASCII code 0x20)
Basic Command
Structure
The following is the basic structure of a Geysitech command:
<STX>Command text<ETX><BCC>
OR
<STX>Command text<CR>
Each Command is framed by control characters, <STX> at the start and
terminated with either <ETX> or <CR>.
If a command is terminated with <ETX> then additional two characters
<BCC> is attached after <ETX>, this is the block checksum.
D-2
Model 49i Instruction Manual
Thermo Fisher Scientific
Geysitech (Bayern-Hessen) Protocol
Block Checksum <BCC>
Block Checksum
<BCC>
The block checksum is calculated beginning with a seed value of 00000000,
binary (0x00), and bitwise exclusive ORing with each of the characters of
the command string (or response) including the framing characters <STX>
and <ETX>. The checksum works as an error check. The command
terminator determines the presence or absence of <BCC>.
If a command is terminated by <ETX> then the next two characters are the
checksum, if the command is terminated with <CR> no checksum is
attached
The block checksum is represented by two characters, which represent a 2
digit hex number (1byte). (e.g. 1 byte 0xAB hex checksum will be
represented by the two characters ‘A’ & ‘B’)
The checksum is referred to as <BCC> throughout this document.
Geysitech Commands
Instrument Control
Command (ST)
The following commands are supported by the Geysitech protocol:
•
Instrument Control Command (ST)
•
Data Sampling/Data Query Command (DA)
There are three control commands supported by the Geysitech protocol.
This <control command> is a single letter, which triggers an action in the
instrument. These commands are active only when service mode is inactive
and the zero/span option is present.
Command ‘N’ switches the instrument gas mode to Zero.
For the 49i PS, command ‘K’ switches the instrument gas mode to
Level 1.
For the 49i, command ‘K’ is not used unless the Sample/Cal option is
present. When the Sample/Cal option is present:
•
If the ozonator is present, command ‘K’ switches the instrument gas
mode to Level 1.
•
If the the ozonator is not present, command ‘K’ switches the
instrument gas mode to Span.
Command ‘M’ switches the instrument gas mode to Sample for the 49i
and Manual for the 49i PS.
Thermo Fisher Scientific
Model 49i Instruction Manual
D-3
Geysitech (Bayern-Hessen) Protocol
Geysitech Commands
The following are the different acceptable formats of the ST command:
<STX>ST<address><control command><ETX><BCC>
OR
<STX>ST<address><control command><CR>
OR
<STX>ST<address><SP><control command><CR>
OR
<STX>ST<address><SP><control command><ETX><BCC>
The <address> is optional, which means it can be left out completely. The
<address> if present must match the Instrument Address. Additional space
can be present after the <address>.
If the received command does not satisfy the above formats or if the
<address> does not match the Instrument Address the command is ignored.
This is a sample command to switch the instrument to zero mode,
instrument id 5:
<STX>ST005<SP>N<CR>
Data Sampling/Data Query
Command (DA)
This command DA initiates a data transfer from the instrument. The
instrument responds with measurement data, which depends on the range
mode and is listed in “Measurements Reported in Response to DA
Command for 49i and 49i PS” on page D-7.
The command structure for a data query command is as follows:
<STX>DA<address><ETX><BCC>
The <address> is optional, which means it can be left out completely. The
<address> if present must match the Instrument Address. Additional space
can be present after the <address>.
If the <address> is left out then no space is allowed in the query string.
A command with no address is also a valid command.
D-4
Model 49i Instruction Manual
Thermo Fisher Scientific
Geysitech (Bayern-Hessen) Protocol
Geysitech Commands
The following are the different acceptable formats of the DA command
with Instrument Address 5:
<STX>DA<CR>
<STX>DA005<CR>
<STX>DA<SP><SP>5<ETX><BCC>
<STX>DA<ETX><BCC>
The data query string is valid and will be answered with data transmission
only if the command starts with <STX> which is followed by the characters
DA, and the <address> (if present) matches the Instrument Address, and the
command is terminated with either <CR> with no checksum or <ETX>
followed by the correct checksum <BCC>.
Sample Data Reply String in response to Data Query Command (DA):
In response to a valid data query command (DA) the instrument responds
in the following format:
<STX>MD02<SP><address><SP><measured
value1><SP><status><SP><SFKT><SP><address+1><SP><measured
value2><SP ><status><SP><SFKT><ETX><BCC>
The response uses the same command terminators as used by the received
command i.e. if the received command was terminated with a <CR> the
response is terminated with <CR> and if the command was terminated with
a <ETX><BCC> the response is terminated with<ETX> and the computed
checksum <BCC>.
The 02 after the MD indicates, that two measurements are present in the
reply string, (a 03 for three measurements and so on, this will also
determine the length of the reply string).
<address> is the Instrument Address. Each subsequent measurement
attached to the response will have the <address + X> where X keeps
incrementing by 1 for each measurement included.
<measured value> is the concentration value in currently selected gas units
represented as exponential representation with 4 characters mantissa and 2
characters exponent, each with sign.
Mantissa: sign and 4 digits. The decimal point is assumed to be after the
first digit and is not transmitted.
Thermo Fisher Scientific
Model 49i Instruction Manual
D-5
Geysitech (Bayern-Hessen) Protocol
Geysitech Commands
Exponent: sign and 2 digits.
Example:
-5384000.0is represented as -5384+06
+0.04567is represented as +4567-02
<status>: is formed by < operating status > and < error status > and separated
by a space i.e.
<operating status><SP><error status>
Each of the two (<operating status> and <error status>) are formed by two
characters each representing a 2 digit hex number which is one byte (8 Bits)
operation status and one byte (8 Bits) error status.
These two bytes contain the information about the main operating
conditions of the instrument at that instant. For details on how to interpret
the status bytes refer to Table D-1 and Table D-2.
<SFKT>: is the space provided for future use for special function, it
currently contains a string of ten 0’s i.e. <0000000000>.
Example:
Geysitech Protocol with transmission of three concentrations (Instrument
ID is 1, Operation Status is 03, Error Status is 04):
Data Query String:
<STX>DA<CR>
Reply String:
<STX>MD03<SP>001<SP>+2578+01<SP>03 <SP>04<SP>0000000000 <SP>002 <SP>
↑
Address
↑
↑
First Concentration(E-format)=25.78
Address+1
+5681+00<SP>03<SP>04<SP>0000000000<SP>003<SP>+1175+01<SP>03<SP>04<SP
↑
Second Concentration = 5.681
↑
Address+2
↑
Third Concentration=11.75
0000000000<SP><CR>
D-6
Model 49i Instruction Manual
Thermo Fisher Scientific
Geysitech (Bayern-Hessen) Protocol
Geysitech Commands
The attached concentrations are in the selected gas units. The
measurements that are attached to the response if not valid in a particular
mode then a value of 0.0 will be reported.
Measurements Reported
in Response to DA
Command for 49i and 49i
PS
The following measurements reported in response to DA command are for
the Model 49i and 49i Primary Standard.
Single Range Mode for 49i and
49i PS
The 1 measurement reported in single range mode for the Model 49i and
49i Primary Standard includes:
•
Dual/Auto Range Mode for 49i
Dual/Auto Range Mode for 49i PS
Operating and Error Status
O3
The 2 measurements reported in dual or auto range modes for the Model
49i include:
•
low O3
•
high O3
The 2 measurements reported in dual or auto range modes for the Model
49i Primary Standard include:
•
O3 Actual
•
O3 Set point
See Table D-1 for operating status and Table D-2 for error status for the
Model 49i and the Model 49i Primary Standard.
Table D-1. Operating Status for Model 49i and 49i Primary Standard
Thermo Fisher Scientific
Æ Bit
Æ Hex-value
D7
8
80
D6
7
40
MSB
D5
6
20
D4
5
10
D3
4
08
D2
3
04
LSB
D1
2
02
D0
1
01
Operating status:
Service Mode (On)
Maintenance (Local)
Zero gas (On)
Span gas (On)
Not used
0
0
0
0
0
0
0
0
0
0
0
0
0
0
0
0
0
0
0
1
0
0
0
1
0
0
0
1
0
0
0
1
0
0
0
1
0
0
0
0
Model 49i Instruction Manual
D-7
Geysitech (Bayern-Hessen) Protocol
Geysitech Commands
Gas Unit Indication (ppb OR ppm)
Not used
Not used
0
0
1
0
1
0
1
0
0
0
0
0
0
0
0
0
0
0
0
0
0
0
0
0
Table D-2. Error Status for Model 49i and 49i Primary Standard
D-8
Model 49i Instruction Manual
Æ Bit
Æ Hex-value
D7
8
80
D6
7
40
MSB
D5
6
20
D4
5
10
D3
4
08
D2
3
04
LSB
D1
2
02
D0
1
01
Error status:
O3 Lamp Temperature Alarm
Internal Temperature Alarm
Bench Lamp Temperature Alarm
Pressure Alarm
Flow A Alarm
Flow B Alarm
Intensity A Alarm
Intensity B Alarm
0
0
0
0
0
0
0
1
0
0
0
0
0
0
1
0
0
0
0
0
0
1
0
0
0
0
0
0
1
0
0
0
0
0
0
1
0
0
0
0
0
0
1
0
0
0
0
0
0
1
0
0
0
0
0
0
1
0
0
0
0
0
0
0
Thermo Fisher Scientific