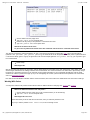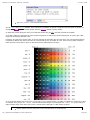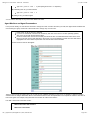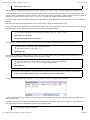
1
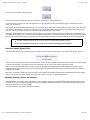
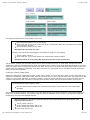
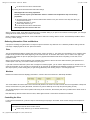
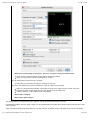
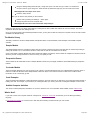
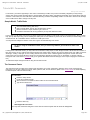
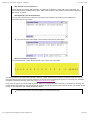
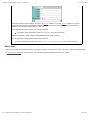
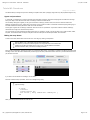
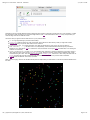
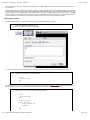
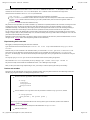
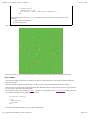
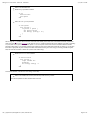
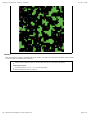
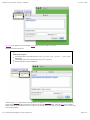
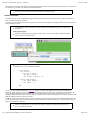
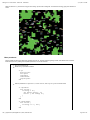
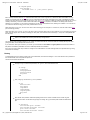
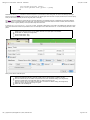
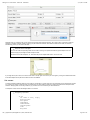
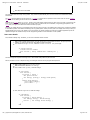
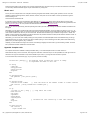
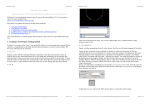
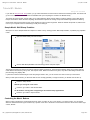
NetLogo 4.0.2 User Manual: Tutorial #1: Models
4/21/09 11:28 PM
Tutorial #1: Models
NetLogo 4.0.2 User Manual
If you read the Sample Model: Party section, you got a brief introduction to what it's like to interact with a NetLogo model. This section will
go into more depth about the features that are available while you're exploring the models in the Models Library.
Throughout all of the tutorials, we'll be asking you to make predictions about what the effects of making changes to the models will be.
Keep in mind that the effects are often surprising. We think these surprises are exciting and provide excellent opportunities for learning.
Some people have found it helpful to print out the tutorials in order to work through them. When the tutorials are printed out, there's more
room on your computer screen for the NetLogo model you're looking at.
Sample Model: Wolf Sheep Predation
We'll open one of the Sample Models and explore it in detail. Let's try a biology model: Wolf Sheep Predation, a predator-prey population
model.
Open the Models Library from the File menu.
Choose "Wolf Sheep Predation" from the Biology section and press "Open".
The Interface tab will fill up with lots of buttons, switches, sliders and monitors. These interface elements allow you to interact with the
model. Buttons are blue; they set up, start, and stop the model. Sliders and switches are green; they alter model settings. Monitors and
plots are beige; they display data.
If you'd like to make the window larger so that everything is easier to see, you can use the zoom menu at the top of the window.
When you first open the model, you will notice that the view is empty (all black). To begin the model, you will first need to set it up.
Press the "setup" button.
What do you see appear in the view?
Press the "go" button to start the simulation.
As the model is running, what is happening to the wolf and sheep populations?
Press the "go" button to stop the model.
Controlling the Model: Buttons
When a button is pressed, the model responds with an action. A button can be a "once" button, or a "forever" button. You can tell the
difference between these two types of buttons by a symbol on the face of the button. Forever buttons have two arrows in the bottom right
corners, like this:
file:///Applications/NetLogo%204.0.2/docs/tutorial1.html
Page 1 of 8
NetLogo 4.0.2 User Manual: Tutorial #1: Models
4/21/09 11:28 PM
Once buttons don't have the arrows, like this:
Once buttons do one action and then stop. When the action is finished, the button pops back up.
Forever buttons do an action over and over again. When you want the action to stop, press the button again. It will finish the current
action, then pop back up.
Most models, including Wolf Sheep Predation, have a once button called "setup" and a forever button called "go". Many models also have
a once button called "go once" or "step once" which is like "go" except that it advances the model by one tick (time step) instead of over
and over. Using a once button like this lets you watch the progress of the model more closely.
Stopping a forever button is the normal way to stop a model. It's safe to pause a model by stopping a forever button, then make it go on
by pressing the button again. You can also stop a model with the "Halt" item on the Tools menu, but you should only do this if the model is
stuck for some reason. Using "Halt" may interrupt the model in the middle of an action, and as the result the model could get confused.
If you like, experiment with the "setup" and "go" buttons in the Wolf Sheep Predation model.
Do you ever get different results if you run the model several times with the same settings?
Controlling speed: Speed Slider
The speed slider allows you to control the speed of a model, that is, the speed at which turtles move, patches change color, and so on.
When you move the slider to the left the model slows down so there are longer pauses between each tick (time step). That makes it easier
to see what is happening. You might even slow the model down so far as to see exactly what a single turtle is doing.
When you move the speed slider to the right of the center the model will speed up. NetLogo will start skipping frames, that is, it won't
update the view at the end of every tick, only some ticks. Showing the state of the world takes time, so showing it less often means the
model progresses faster.
Note that if you push the speed slider well to the right, the view update may update so frequently that the model appears to have slowed
down. It hasn't, as you can see by watching the tick counter. Only the frequency of updates has lessened.
Adjusting Settings: Sliders and Switches
The settings within a model give you an opportunity to work out different scenarios or hypotheses. Altering the settings and then running
the model to see how it reacts to those changes can give you a deeper understanding of the phenomena being modeled. Switches and
sliders give you access to a model's settings.
Here are the switches and sliders in Wolf Sheep Predation:
file:///Applications/NetLogo%204.0.2/docs/tutorial1.html
Page 2 of 8
NetLogo 4.0.2 User Manual: Tutorial #1: Models
4/21/09 11:28 PM
Let's experiment with their effect on the behavior of the model.
Open Wolf Sheep Predation if it's not open already.
Press "setup" and "go" and let the model run for about a 100 time-ticks. (Note: there is a readout of the number
of ticks right above the plot.)
Stop the model by pressing the "go" button.
What happened to the sheep over time?
Let's take a look and see what would happen to the sheep if we change one of the settings.
Turn the "grass?" switch on.
Press "setup" and "go" and let the model run for a similar amount of time as before.
What did this switch do to the model? Was the outcome the same as your previous run?
Just like buttons, switches have information attached to them. Their information is set up in an on/off format. Switches turn on/off a
separate set of directions. These directions are usually not necessary for the model to run, but might add another dimension to the model.
Turning the "grass?" switch on affected the outcome of the model. Prior to this run, the growth of the grass stayed constant. This is not a
realistic look at the predator-prey relationship; so by setting and turning on a grass growth rate, we were able to model all three factors:
sheep, wolf and grass populations.
Another type of setting is called a slider.
Sliders are a different type of setting then a switch. A switch has two values: on or off. A slider has a range of numeric values that can be
adjusted. For example, the "initial-number-sheep" slider has a minimum value of 0 and a maximum value of 250. The model could run with
0 sheep or it could run with 250 sheep, or anywhere in between. Try this out and see what happens. As you move the marker from the
minimum to the maximum value, the number on the right side of the slider changes; this is the number the slider is currently set to.
Let's investigate Wolf Sheep Predation's sliders.
Read the contents of the Information tab, located above the toolbar, to learn what each of this models' sliders
represents.
The Information tab offers guidance and insight into the model. Within this tab you will find an explanation of the model, suggestions on
things to try, and other information. You may want to read the Information tab before running a model, or you might want to just start
experimenting, then look at the Information tab later.
What would happen to the sheep population if there was more initial sheep and less initial wolves at the
beginning of the simulation?
Turn the "grass?" switch off.
Set the "initial-number-sheep" slider to 100.
Set the "initial-number-wolves" slider to 20.
Press "setup" and then "go".
file:///Applications/NetLogo%204.0.2/docs/tutorial1.html
Page 3 of 8
NetLogo 4.0.2 User Manual: Tutorial #1: Models
4/21/09 11:28 PM
Let the model run for about 100 time-ticks.
Try running the model several times with these settings.
What happened to the sheep population?
Did this outcome surprise you? What other sliders or switches can be adjusted to help out the sheep
population?
Set "initial-number-sheep" to 80 and "initial-number-wolves" to 50. (This is close to how they were when you
first opened the model.)
Set "sheep-reproduce" to 10.0%.
Press "setup" and then "go".
Let the model run for about 100 time ticks.
What happened to the wolves in this run?
When you open a model, all the sliders and switches are on a default setting. If you open a new model or exit the program, your changed
settings will not be saved, unless you choose to save them.
(Note: in addition to sliders and switches, some models have a third kind of setting, called a chooser. The Wolf Sheep Predation doesn't
have any of these, though.)
Gathering Information: Plots and Monitors
A purpose to modeling is to gather data on a subject or topic that would be very difficult to do in a laboratory situation. NetLogo has two
main ways of displaying data to the user: plots and monitors.
Plots
The plot in Wolf Sheep Predation contains three lines: sheep, wolves, and grass / 4. (The grass count is divided by four so it doesn't make
the plot too tall.) The lines show what's happening in the model over time. To see which line is which, click on "Pens" in the upper right
corner of the plot window to open the plot pens legend. A key appears that indicates what each line is plotting. In this case, it's the
population counts.
When a plot gets close to becoming filled up, the horizontal axis increases in size and all of the data from before gets squeezed into a
smaller space. In this way, more room is made for the plot to grow.
If you want to save the data from a plot to view or analyze it in another program, you can use the "Export Plot" item on the File menu. It
saves this information to your computer in a format that can by read back by spreadsheet and database programs such as Excel. You can
also export a plot by control-clicking (Mac) or right-clicking (Windows) it and choosing "Export..." from the popup menu.
Monitors
Monitors are another method of displaying information in a model. Here are the monitors in Wolf Sheep Predation:
The monitor labeled "time-ticks" tells us how much time has passed in the model. The other monitors show us the population of sheep and
wolves, and the amount of grass. (Remember, the amount of grass is divided by four to keep the plot from getting too tall.)
The numbers displayed in the monitors update continuously as the model runs, whereas the plots show you data from the whole course of
the model run.
Note that NetLogo has also another kind of monitor, called "agent monitors". These will be introduced in Tutorial #2.
Controlling the View
If you look at the interface tab, you'll see a strip of controls along the top edge in the toolbar. These controls change various aspects of
the view.
Let's experiment with the effect of these controls.
Press "setup" and then "go" to start the model running.
file:///Applications/NetLogo%204.0.2/docs/tutorial1.html
Page 4 of 8
NetLogo 4.0.2 User Manual: Tutorial #1: Models
4/21/09 11:28 PM
As the model runs, move the speed slider to the left.
What happens?
This slider is helpful if a model is running too fast for you to see what's going on in detail.
Move the speed slider to the middle.
Try moving the speed slider to the right.
Now try checking and unchecking the view updates checkbox.
What happens?
Fast forwarding the model and turning off view updates are useful if you're impatient and want a model to run faster. Fast forwarding
(moving the speed slider to the right) drops view updates so the model can run fast, since updating the view takes time that could be used
for updating the view.
When view updates are off completely The model continues to run in the background, and plots and monitors still update; but if you want
to see what's happening, you need to turn view updates back on by rechecking the box. Most models run much faster when view updates
are off.
The size of the view is determined by five separate settings: Min and Max X, Min and Max Y and Patch Size. Let's take a look at what
happens when we change the size of the view in the "Wolf Sheep Predation" model.
There are more world and view settings than there's room for in the toolbar. The "Settings..." button lets you get to the rest of the settings.
Press the "Settings..." button in the toolbar.
A dialog box will open containing all the settings for the view:
file:///Applications/NetLogo%204.0.2/docs/tutorial1.html
Page 5 of 8
NetLogo 4.0.2 User Manual: Tutorial #1: Models
4/21/09 11:28 PM
What are the current settings for max-pxcor, min-pxcor, max-pycor, min-pycor, and Patch size?
Press "cancel" to make this window go away without changing the settings.
Place your mouse pointer next to, but still outside of, the view.
You will notice that the pointer turns into a crosshair.
Hold down the mouse button and drag the crosshair over the view.
The view is now selected, which you know because it is now surrounded by a gray border.
Drag one of the square black "handles". The handles are found on the edges and at the corners of the view.
Unselect the view by clicking anywhere in the white background of the Interface tab.
Press the "Settings..." button again and look at the settings.
What numbers changed?
What numbers didn't change?
The NetLogo world is a two dimensional grid of "patches". Patches are the individual squares in the grid.
In Wolf Sheep Predation, when the "grass?" switch is on the individual patches are easily seen, because some of them are green, while
others are brown.
Think of the patches as being like square tiles in a room with a tile floor. By default, exactly in the middle of the room is a tile labeled
file:///Applications/NetLogo%204.0.2/docs/tutorial1.html
Page 6 of 8
NetLogo 4.0.2 User Manual: Tutorial #1: Models
4/21/09 11:28 PM
(0,0); meaning that if the room was divided in half one way and then the other way, these two dividing lines would intersect on this tile. We
now have a coordinate system that will help us locate objects within the room:
How many tiles away is the (0,0) tile from the right side of the room?
How many tiles away is the (0,0) tile from the left side of the room?
In NetLogo, the number of tiles from right to left is called world-width. And the number of tiles from top to bottom is world-height. These
numbers are defined by top, bottom, left and right boundaries.
In these diagrams, max-pxcor is 3 , min-pxcor is -3, max-pycor is 2 and min-pycor is -2.
When you change the patch size, the number of patches (tiles) doesn't change, the patches only get larger or smaller on the screen.
Let's look at the effect of changing the minimum and maximum coordinates in the world.
file:///Applications/NetLogo%204.0.2/docs/tutorial1.html
Page 7 of 8
NetLogo 4.0.2 User Manual: Tutorial #1: Models
4/21/09 11:28 PM
Using the Settings dialog that is still open, change max-pxcor to 30 and max-pycor value to 10. Notice that
min-pxcor and min-pycor change too. That's because by default the origin (0,0) is in the center of the world.
What happened to the shape of the view?
Press the "setup" button.
Now you can see the new patches you have created.
Edit the view by pressing the "Settings..." button again.
Change the patch size to 20 and press "OK".
What happened to the size of the view? Did its shape change?
Editing the view also lets you change other settings, including the font size of labels and whether the view uses shapes. Feel free to
experiment with these and other settings as well.
Once you are done exploring the Wolf Sheep Predation model, you may want to take some time just to explore some of the other models
available in the Models Library.
The Models Library
The library contains five sections: Sample Models, Perspective Demos, Curricular Models, Code Examples, and HubNet Computer
Activities.
Sample Models
The Sample Models section is organized by subject area and currently contains more than 210 models. We are continuously working on
adding new models to it, so come visit this section at a later date to view the new additions to the library.
Some of the folders in Sample Models have folders inside them labeled "(unverified)". These models are complete and functional, but are
still in the process of being reviewed for content, accuracy, and quality of code.
Perspective Demos
These models are all models that are also in Sample Models, however, they are slightly modified to demonstrate NetLogo's perspective
features.
Curricular Models
These are models designed to be used in schools in the context of curricula developed by the CCL at Northwestern University. Some of
these are models are also listed under Sample Models; others are unique to this section. See the info tabs of the models for more
information on the curricula they go with.
Code Examples
These are simple demonstrations of particular features of NetLogo. They'll be useful to you later when you're extending existing models or
building new ones. For example, if you wanted to put a histogram within your model, you'd look at "Histogram Example" to find out how.
HubNet Computer Activities
This section contains participatory simulations for use in the classroom. For more information about HubNet, see the HubNet Guide.
What's Next?
If you want to learn how to explore models at a deeper level, Tutorial #2: Commands will introduce you to the NetLogo modeling
language.
In Tutorial #3: Procedures you can learn how to alter and extend existing models and build your own models.
file:///Applications/NetLogo%204.0.2/docs/tutorial1.html
Page 8 of 8
NetLogo 4.0.2 User Manual: Tutorial #2: Commands
4/21/09 11:28 PM
Tutorial #2: Commands
NetLogo 4.0.2 User Manual
In Tutorial #1, you had the opportunity to view some of the NetLogo models, and you have successfully navigated your way through
opening and running models, pressing buttons, changing slider and switch values, and gathering information from a model using plots and
monitors. In this section, the focus will start to shift from observing models to manipulating models. You will start to see the inner workings
of the models and be able to change how they look.
Sample Model: Traffic Basic
Go to the Models Library (File menu).
Open up Traffic Basic, found in the "Social Science" section.
Run the model for a couple minutes to get a feel for it.
Consult the Information tab for any questions you may have about this model.
In this model, you will notice one red car in a stream of blue cars. The stream of cars are all moving in the same direction. Every so often
they "pile up" and stop moving. This is modeling how traffic jams can form without any cause such as an accident, a broken bridge, or an
overturned truck. No "centralized cause" is needed for a traffic jam to form.
You may alter the settings and observe a few runs to get a full understanding of the model.
As you are using the Traffic Basic model, have you noticed any additions you would like to make to the
model?
Looking at the Traffic Basic model, you may notice the environment is fairly simple; a black background with a white street and number of
blue cars and one red car. Changes that could be made to the model include: changing the color and shape of the cars, adding a house or
street light, creating a stop light, or even creating another lane of traffic. Some of these suggested changes are cosmetic and would
enhance the look of the model while the others are more behavioral. We will be focusing more on the simpler or cosmetic changes
throughout most of this tutorial. (Tutorial #3 will go into greater detail about behavioral changes, which require changing the Procedures
tab.)
To make these simple changes we will be using the Command Center.
The Command Center
The Command Center is located in the Interface Tab and allows you to enter commands or directions to the model. Commands are
instructions you can give to NetLogo's agents: turtles, patches, links, and the observer. (Refer to the Interface Guide for details explaining
the different parts of the Command Center.)
In Traffic Basic:
Press the "setup" button.
Locate the Command Center.
Click the mouse in the white box at the bottom of the Command Center.
Type the text shown here:
Press the return key.
What happened to the View?
You may have noticed the background of the View has turned all yellow and the street has disappeared.
file:///Applications/NetLogo%204.0.2/docs/tutorial2.html
Page 1 of 7
NetLogo 4.0.2 User Manual: Tutorial #2: Commands
4/21/09 11:28 PM
Why didn't the cars turn yellow too?
Looking back at the command that was written, we asked only the patches to change their color. In this model, the
cars are represented by a different kind of agent, called "turtles". Therefore, the cars did not received these instructions
and thus did not change.
What happened in the Command Center?
You may have noticed that the command you just typed is now displayed in the white box in the middle of the
Command Center as shown below:
Type in the white box at the bottom of the Command Center the text shown below:
Was the result what you expected?
Your View should have a yellow background with a line of brown cars in the middle:
The NetLogo world is a two dimensional world that is made up of turtles, patches and an observer. The patches create the ground in
which the turtles can move around on and the observer is a being that oversee everything that is going on in the world. (For a detailed
description and specifics about this world, refer to the NetLogo Programming Guide.)
In the Command Center, we have the ability to give the observer a command, the turtles a command, or the patches a command. We
choose between these options by using the popup menu located in the bottom left corner of the Command Center. You can also use the
tab key on your keyboard to cycle through the different options.
In the Command Center, click on the "observer>" in the bottom left corner:
file:///Applications/NetLogo%204.0.2/docs/tutorial2.html
Page 2 of 7
NetLogo 4.0.2 User Manual: Tutorial #2: Commands
4/21/09 11:28 PM
Choose "turtles" from the popup menu.
Type set color pink and press return.
Press the tab key until you see "patches>" in the bottom left corner.
Type set pcolor white and press return.
What does the View look like now?
Do you notice any differences between these two commands and the observer commands from earlier?
The observer oversees the world and therefore can give a command to the patches or turtles using ask . Like in the first example
(observer> ask patches [set pcolor yellow] ), the observer has to ask the patches to set their pcolor to yellow. But when
a command is directly given to a group of agents like in the second example (patches> set pcolor white ), you only have to give
the command itself.
Press "setup".
What happened?
Why did the View revert back to the old version, with the black background and white road? Upon pressing the "setup" button, the model
will reconfigure itself back to the settings outlined in the Procedures tab. The Command Center is not often used to permanently change
the model. It is most often used as a tool to customize current models and allows for you to manipulate the NetLogo world to further
answer those "What if" questions that pop up as you are investigating the models. (The Procedures tab is explained in the next tutorial,
and in the Programming Guide.)
Now that we have familiarized ourselves with the Command Center, let's look at some more details about how colors work in NetLogo.
Working With Colors
You may have noticed in the previous section that we used two different words for changing color: color and pcolor .
What is the difference between color and pcolor?
Choose "turtles" from the popup menu in the Command Center (or use the tab key).
Type set color blue and press return.
What happened to the cars?
Think about what you did to make the cars turn blue, and try to make the patches turn red.
If you try to ask the patches to set color red , an error message occurs:
file:///Applications/NetLogo%204.0.2/docs/tutorial2.html
Page 3 of 7
NetLogo 4.0.2 User Manual: Tutorial #2: Commands
4/21/09 11:28 PM
Type set pcolor red instead and press return.
We call color and pcolor "variables". Some commands and variables are specific to turtles and some are specific to patches. For
example, the color variable is a turtle variable, while the pcolor variable is a patch variable.
Go ahead and practice altering the colors of the turtles and patches using the set command and these two variables.
To be able to make more changes to the colors of turtles and patches, or shall we say cars and backgrounds, we need to gain a little
insight into how NetLogo deals with colors.
In NetLogo, all colors have a numeric value. In all of the exercises we have been using the name of the color. This is because NetLogo
recognizes 16 different color names. This does not mean that NetLogo only recognizes 16 colors. There are many shades in between
these colors that can be used too. Here's a chart that shows the whole NetLogo color space:
To get a color that doesn't have its own name, you just refer to it by a number instead, or by adding or subtracting a number from a name.
For example, when you type set color red , this does the same thing as if you had typed set color 15 . And you can get a
lighter or darker version of the same color by using a number that is a little larger or a little smaller, as follows.
Choose "patches" from the popup menu in the Command Center (or use the tab key).
file:///Applications/NetLogo%204.0.2/docs/tutorial2.html
Page 4 of 7
NetLogo 4.0.2 User Manual: Tutorial #2: Commands
4/21/09 11:28 PM
Type set pcolor red - 2 (The spacing around the "-" is important.)
By subtracting from red, you make it darker.
Type set pcolor red + 2
By adding to red, you make it lighter.
You can use this technique on any of the colors listed in the chart.
Agent Monitors and Agent Commanders
In the previous activity, we used the set command to change the colors of all the cars. But if you recall, the original model contained one
red car amongst a group of blue cars. Let's look at how to change only one car's color.
Press "setup" to get the red car to reappear.
If you are on a Macintosh, hold down the Control key and click on the red car. On other operating systems,
click on the red car with the right mouse button.
If there is another turtle close to the red turtle you'll see more than one turtle listed at the bottom of the menu.
Move your mouse over the turtle selections, notice when your mouse highlights a turtle menu item that turtle is
highlighted in the view. Select "inspect turtle" from the sub-menu for the red turtle.
A turtle monitor for that car will appear:
Taking a closer look at this turtle monitor, we can see all of the variables that belong to the red car. A variable is a place that holds a
value that can be changed. Remember when it was mentioned that all colors are represented in the computer as numbers? The same is
true for the agents. For example, every turtle has an ID number we call its "who number".
Let's take a closer look at the turtle monitor:
What is this turtle's who number?
What color is this turtle?
file:///Applications/NetLogo%204.0.2/docs/tutorial2.html
Page 5 of 7
NetLogo 4.0.2 User Manual: Tutorial #2: Commands
4/21/09 11:28 PM
What shape is this turtle?
This turtle monitor is showing a turtle who that has a who number of 0, a color of 15 (red -- see above chart), and the shape of a car.
There are two other ways to open a turtle monitor besides right-clicking (or control-clicking, depending on your operating system). One
way is to choose "Turtle Monitor" from the Tools menu, then type the who number of the turtle you want to inspect into the "who" field and
press return. The other way is to type inspect turtle 0 (or other who number) into the Command Center.
You close a turtle monitor by clicking the close box in the upper left hand corner (Macintosh) or upper right hand corner (other operating
systems).
Now that we know more about Agent Monitors, we have three ways to change an individual turtle's color.
One way is to use the box called an Agent Commander found at the bottom of an Agent Monitor. You type commands here, just like in the
Command Center, but the commands you type here are only done by this particular turtle.
In the Agent Commander of the Turtle Monitor for turtle 0, type set color pink .
What happens in the View?
Did anything change in the Turtle Monitor?
A second way to change one turtle's color is to go directly to the color variable in the Turtle Monitor and change the value.
Select the text to the right of "color" in the Turtle Monitor.
Type in a new color such as green + 2 .
What happened?
The third way to change an individual turtle's or patch's color is to use the observer. Since, the observer oversees the NetLogo world, it
can give commands that affect individual turtles, as well as groups of turtles.
In the Command Center, select "observer" from the popup menu (or use the tab key).
Type ask turtle 0 [set color blue] and press return.
What happens?
Just as there are Turtle Monitors, there are also Patch Monitors. Patch monitors work very similarly to Turtle Monitors.
Can you make a patch monitor and use it to change the color of a single patch?
If you try to have the observer ask patch 0 [set pcolor blue] , you'll get an error message:
To ask an individual turtle to do something, we use its who number. But patches don't have who numbers, therefore we need to refer to
them some other way.
Remember, patches are arranged on a coordinate system. Two numbers are needed to plot a point on a graph: an x-axis value and a yaxis value. Patch locations are designated in the same way as plotting a point.
Open a patch monitor for any patch.
file:///Applications/NetLogo%204.0.2/docs/tutorial2.html
Page 6 of 7
NetLogo 4.0.2 User Manual: Tutorial #2: Commands
4/21/09 11:28 PM
The monitor shows that for the patch in the picture, its pxcor variable is -11 and its pycor variable is -4. If we go
back to the analogy of the coordinate plane and wanted to plot this point, the point would be found in the lower left
quadrant of the coordinate plane where x=-11 and y=-4.
To tell this particular patch to change color, use its coordinates.
In the bottom of the patch monitor, enter set pcolor blue and press return.
Typing a command in a turtle or patch monitor addresses only that turtle or patch.
You can also talk to a single patch from the Command Center:
In the Command Center, enter ask patch -11 -4 [set pcolor green] and press return.
What's Next?
At this point, you may want to take some time to try out the techniques you've learned on some of the other models in the Models Library.
In Tutorial #3: Procedures you can learn how to alter and extend existing models and build your own models.
file:///Applications/NetLogo%204.0.2/docs/tutorial2.html
Page 7 of 7
NetLogo 4.0.2 User Manual: Tutorial #3: Procedures
4/21/09 11:28 PM
Tutorial #3: Procedures
NetLogo 4.0.2 User Manual
This tutorial leads you through the process of building a complete model, built up stage by stage, with every step explained along the way.
Agents and procedures
In Tutorial #2, you learned how to use the command center and agent monitors to inspect and modify agents and make them do things.
Now you're ready to learn about the real heart of a NetLogo model: the Procedures tab.
You've already used types of agents you can give commands to in NetLogo: patches, turtles, links, and the observer. Patches are
stationary and arranged in a grid. Turtles move over that grid. Links connect two turtles. The observer oversees everything that's going on
and does whatever the turtles, patches and links can't do for themselves.
All four types of agents can run NetLogo commands. All three can also run "procedures". A procedure combines a series of NetLogo
commands into a single new command that you define.
You will now learn to write procedures that make turtles move, eat, reproduce, and die. You will also learn how to make monitors, sliders,
and plots. The model we'll build is a simple ecosystem model not unlike parts of Wolf Sheep Predation from Tutorial #1.
Making the setup button
To start a new model, select "New" from the File menu. Then begin by creating a setup button:
Click the "Button" icon in the toolbar at the top of the Interface tab.
Click wherever you want the button to appear in the empty white area of the Interface tab.
A dialog box for editing the button opens. Type setup in the box labeled "Commands".
Press the OK button when you're done; the dialog box closes.
Now you have a setup button. Pressing the button runs a procedure called "setup". A procedure is a sequence of NetLogo commands that
we assign a new name. We haven't defined that procedure yet (we will soon). Because the button refers to a procedure that doesn't exist
yet, the button turns red:
If you want to see the actual error message, click the button.
Now we'll create the "setup" procedure, so the error message will go away:
Switch to the Procedures tab.
Type the following:
to setup
clear-all
create-turtles 100
ask turtles [ setxy random-xcor random-ycor ]
end
When you're done, the Procedures tab looks like this:
file:///Applications/NetLogo%204.0.2/docs/tutorial3.html
Page 1 of 16
NetLogo 4.0.2 User Manual: Tutorial #3: Procedures
4/21/09 11:28 PM
Note that the lines are indented different amounts. Most people find it helpful to indent their code like this, but it is not mandatory. It makes
the code easier to read and change. Your procedure began with the word to and ended with the word end . Every new procedure you
create will begin and end with these two words.
Let's look at what you typed in and see what each line of your procedure does:
to setup begins defining a procedure named "setup".
clear-all resets the world to an initial, empty state. All the patches turn black and any turtles you might have created
disappear. Basically, it wipes the slate clean for a new model run.
create-turtles 100 creates 100 turtles. They start out standing at the origin, that is, the center of patch 0,0.
ask turtles [ ... ] tells each turtle to run, independently, the commands inside the brackets. (Every command in
NetLogo is run by some agent. ask is a command too. Here, the observer is running the ask command itself, in turn causing the
turtles to run commands.)
setxy random-xcor random-ycor is a command using "reporters". A reporter, as opposed to a command, reports a
result. First each turtle runs the reporter random-xcor which will report a random number from the allowable range of turtle
coordinates along the X axis. Then each turtle runs the reporter random-ycor , same for the Y axis. Finally each turtle runs the
setxy command with those two numbers as inputs. That makes the turtle move to the point with those coordinates.
end completes the definition of the "setup" procedure.
When you're done typing, switch to the Interface tab and press the setup button you made before. You will see the turtles scattered around
the world:
file:///Applications/NetLogo%204.0.2/docs/tutorial3.html
Page 2 of 16
NetLogo 4.0.2 User Manual: Tutorial #3: Procedures
4/21/09 11:28 PM
Press setup a couple more times, and see how the arrangement of turtles is different each time. Note that some turtles may be right on
top of each other.
Think a bit about what you needed to do to make this happen. You needed to make a button in the interface and make a procedure that
the button uses. The button only worked once you completed both of these separate steps. In the remainder of this tutorial, you will often
have to complete two or more similar steps to add another feature to the model. If something doesn't appear to work after you completed
what you thought is the final step for that new feature, continue to read ahead to see if there is still more to do. After reading ahead for a
couple of paragraphs, you should then go back over the directions to see if there is any step you might have missed.
Making the go button
Now make a button called "go". Follow the same steps you used to make the setup button, except:
For Commands enter go instead of setup .
Check the "forever" checkbox in the edit dialog.
The "forever" checkbox makes the button stay down once pressed, so its commands run over and over again, not just once.
Then add a go procedure to the Procedures tab:
to go
move-turtles
end
But what is move-turtles ? Is it a primitive (in other words, built in to NetLogo), like clear-all is? No, it's another procedure
that you're about to add. So far, you have introduced two procedures that you added yourself: setup and go .
Add the move-turtles procedure after the go procedure:
to go
move-turtles
end
to move-turtles
ask turtles [
right random 360
forward 1
]
end
file:///Applications/NetLogo%204.0.2/docs/tutorial3.html
Page 3 of 16
NetLogo 4.0.2 User Manual: Tutorial #3: Procedures
4/21/09 11:28 PM
Note there are no spaces around the dash in move-turtles . In Tutorial #2 we used red - 2 , with spaces, in order to subtract two
numbers, but here we want move-turtles , without spaces. The "-" combines "move" and "turtles" into a single name.
Here is what each command in the move-turtles procedure does:
ask turtles [ ... ] says that each turtle should run the commands in the brackets.
right random 360 is another command that uses a reporter. First, each turtle picks a random whole number between 0
and 359. ( random doesn't include the number you give it as a possible result.) Then the turtle turns right this number of
degrees.
forward 1 makes the turtle move forward one step.
Why couldn't we have just written all of these commands in go instead of in a separate procedure? We could have, but during the course
of building your project, it's likely that you'll add many other parts. We'd like to keep go as simple as possible, so that it is easy to
understand. Eventually, it will include many other things you want to have happen as the model runs, such as calculating something or
plotting the results. Each of these things to do will have its own procedure and each procedure will have its own unique name.
The 'go' button you made in the Interface tab is a forever button, meaning that it will continually run its commands until you shut it off (by
clicking on it again). After you have pressed 'setup' once, to create the turtles, press the 'go' button. Watch what happens. Turn it off, and
you'll see that all the turtles stop in their tracks.
Note that if a turtle moves off the edge of the world, it "wraps", that is, it appears on the other side. (This is the default behavior. It can be
changed; see the Topology section of the Programming Guide for more information.)
Experimenting with commands
We suggest you start experimenting with other turtle commands.
Type commands into the Command Center (like turtles> set color red ), or add commands to setup , go , or moveturtles .
Note that when you enter commands in the Command Center, you must choose turtles> , patches> , or observer> in the
popup menu on the left, depending on which agents are going to run the commands. It's just like using ask turtles or ask
patches , but saves typing. You can also use the tab key to switch agent types, which you might find more convenient than using the
menu.
You might try typing turtles> pen-down into the Command Center and then pressing the go button.
Also, inside the move-turtles procedure you can try changing right random 360 to right random 45 .
Play around. It's easy and the results are immediate and visible -- one of NetLogo's many strengths.
When you feel you've done enough experimenting for now, you're ready to continue improving the model you are building.
Patches and variables
Now we've got 100 turtles aimlessly moving around, completely unaware of anything else around them. Let's make things a little more
interesting by giving these turtles a nice background against which to move.
Go back to the setup procedure. We can rewrite it as follows:
to setup
clear-all
setup-patches
setup-turtles
end
The new definition of setup refers to two new procedures. To define setup-patches , add this:
to setup-patches
ask patches [ set pcolor green ]
end
The setup-patches procedure sets the color of every patch to green to start with. (A turtle's color variable is
color ; a patch's is pcolor .)
The only part remaining in our new 'setup' that is still undefined is setup-turtles .
Add this procedure too:
file:///Applications/NetLogo%204.0.2/docs/tutorial3.html
Page 4 of 16
NetLogo 4.0.2 User Manual: Tutorial #3: Procedures
4/21/09 11:28 PM
to setup-turtles
create-turtles 100
ask turtles [ setxy random-xcor random-ycor ]
end
Did you notice that the new setup-turtles procedure has most of the same commands as the old setup
procedure?
Switch back to the Interface tab.
Press the setup button.
Voila! A lush NetLogo landscape complete with turtles and green patches appears:
After seeing the new setup procedure work a few times, you may find it helpful to read through the procedure definitions again.
Turtle variables
So we have some turtles running around on a landscape, but they aren't doing anything with it. Let's add some interaction between the
turtles and the patches.
We'll make the turtles eat "grass" (the green patches), reproduce, and die. The grass will gradually grow back after it is eaten.
We'll need a way of controlling when a turtle reproduces and dies. We'll determine that by keeping track of how much "energy" each turtle
has. To do that we need to add a new turtle variable.
You've already seen built in turtle variables like color . To make a new turtle variable, we add a turtles-own declaration at the top
of the Procedures tab, before all the procedures. Call it energy :
turtles-own [energy]
to go
move-turtles
eat-grass
end
Let's use this newly defined variable ( energy ) to allow the turtles to eat.
file:///Applications/NetLogo%204.0.2/docs/tutorial3.html
Page 5 of 16
NetLogo 4.0.2 User Manual: Tutorial #3: Procedures
4/21/09 11:28 PM
Switch to the Procedures tab.
Rewrite the go procedure as follows:
to go
move-turtles
eat-grass
end
Add a new eat-grass procedure:
to eat-grass
ask turtles [
if pcolor = green [
set pcolor black
set energy (energy + 10)
]
]
end
We are using the if command for the first time. Look at the code carefully. Each turtle, when it runs these commands, compares the
value of the patch color it is on ( pcolor ) to the value for green . (A turtle has direct access to the variables of the patch it is standing
on.) If the patch color is green, the comparison reports true , and only then will the turtle runs the commands inside the brackets
(otherwise it skips them). The commands make the turtle change the patch color to black and increase its own energy by 10. The patch
turns black to signify that the grass at that spot has been eaten and the turtle is given more energy, from having just eaten the grass.
Next, let's make the movement of turtles use up some of the turtle's energy.
Rewrite move-turtles as follows:
to move-turtles
ask turtles [
right random 360
forward 1
set energy energy - 1
]
end
As each turtle wanders, it will lose one unit of energy at each step.
Switch to the Interface tab now and press the setup button and the go button.
You'll see the patches turn black as turtles travel over them.
file:///Applications/NetLogo%204.0.2/docs/tutorial3.html
Page 6 of 16
NetLogo 4.0.2 User Manual: Tutorial #3: Procedures
4/21/09 11:28 PM
Monitors
Next you will create two monitors in the Interface tab with the Toolbar. (You make them just like buttons and sliders, using the monitor
icon on the Toolbar.) Let's make the first monitor now.
Create a monitor, using the monitor icon on the Toolbar and click on an open spot in the Interface.
A dialog box will appear.
In the dialog box type: count turtles (see image below).
Press the OK button to close the dialog box.
file:///Applications/NetLogo%204.0.2/docs/tutorial3.html
Page 7 of 16
NetLogo 4.0.2 User Manual: Tutorial #3: Procedures
4/21/09 11:28 PM
turtles is an "agentset", the set of all turtles. count tells us how many agents are in that set.
Let's make the second monitor now:
Create a monitor, using the monitor icon on the Toolbar and click on an open spot in the Interface.
A dialog box will appear.
In the Reporter section of the dialog box type: count patches with [pcolor = green] (see
image below).
In the Display name section of the dialog box type: green patches
Press the OK button to close the dialog box.
Here we're using count again to see how many agents are in an agentset. patches is the set of all the patches, but we don't just
want to know how many patches there are total, we want to know how many of them are green. That's what with does; it makes a
smaller agentset of just those agents for whom the condition in the brackets is true. The condition is pcolor = green , so that gives
us just the green patches.
file:///Applications/NetLogo%204.0.2/docs/tutorial3.html
Page 8 of 16
NetLogo 4.0.2 User Manual: Tutorial #3: Procedures
4/21/09 11:28 PM
Now we have two monitors that will report how many turtles and green patches we have, to help us track what's going on in our model. As
the model runs, the numbers in the monitors will automatically change.
Use the setup and go buttons and watch the numbers in the monitors change.
Switches and labels
The turtles aren't just turning the patches black; they're also gaining and losing energy. As the model runs, try using a turtle monitor to
watch one turtle's energy go up and down.
It would be nicer if we could see every turtle's energy all the time. We will now do exactly that, and add a switch so we can turn the extra
visual information on and off.
To create a switch, click on the switch icon on the Toolbar (in the Interface tab) and click on an open spot in
the Interface.
A dialog box will appear.
In the Global variable section of the dialog box type: show-energy? Don't forget to include the question
mark in the name. (See image below.)
Now go back to the 'go' procedure using the Procedures tab with the Toolbar.
Rewrite the eat-grass procedure as follows:
to eat-grass
ask turtles [
if pcolor = green [
set pcolor black
set energy (energy + 10)
]
ifelse show-energy?
[ set label energy ]
[ set label "" ]
]
end
The eat-grass procedure introduces the ifelse command. Look at the code carefully. Each turtle, when it runs these new
commands, checks the value of show-energy? (determined by the switch). If the switch is on, comparison is true and the turtle will
run the commands inside the first set of brackets. In this case, it assigns the value for the energy to the label of the turtle. If the
comparison is false (the switch is off) then the turtle runs the commands inside the second set of brackets. In this case, it removes the text
labels (by setting the label of the turtle to be nothing).
(In NetLogo, a piece of text is called a "string". A string is a sequence of letters and other characters, written between double quotes. Here
we have two double quotes right next to each other, with nothing in between them. That's an empty string. If a turtle's label is an empty
string, no text is attached to the turtle.)
Test this in the Interface tab, by running the model (using the setup and go buttons) switching the showenergy? switch back and forth.
file:///Applications/NetLogo%204.0.2/docs/tutorial3.html
Page 9 of 16
NetLogo 4.0.2 User Manual: Tutorial #3: Procedures
4/21/09 11:28 PM
When the switch is on, you'll see the energy of each turtle go up each time it eats grass. You'll also see its energy going down whenever it
moves.
More procedures
Now our turtles are eating; let's make them reproduce and die, too. Let's also make the grass grow back. We'll add all three of these of
these behaviors now, by making three separate procedures, one for each behavior.
Go to the Procedures tab.
Rewrite the go procedure as follows:
to go
move-turtles
eat-grass
reproduce
check-death
regrow-grass
end
Add the procedures for reproduce , check-death , and regrow-grass as shown below:
to reproduce
ask turtles [
if energy > 50 [
set energy energy - 50
hatch 1 [ set energy 50 ]
]
]
end
to check-death
ask turtles [
if energy <= 0 [ die ]
]
end
file:///Applications/NetLogo%204.0.2/docs/tutorial3.html
Page 10 of 16
NetLogo 4.0.2 User Manual: Tutorial #3: Procedures
4/21/09 11:28 PM
to regrow-grass
ask patches [
if random 100 < 3 [ set pcolor green ]
]
end
Each of these procedures uses the if command. Each turtle, when it runs reproduce , checks the value of the turtle's energy
variable. If it is greater than 50, then the turtle runs the commands inside the first set of brackets. In this case, it decreases the turtle's
energy by 50, then 'hatches' a new turtle with an energy of 50. The hatch command is a NetLogo primitive which looks like this: hatch
number [ commands ]. This turtle creates number new turtles, each identical to its parent, and asks the new turtle(s) that have been
hatched to run commands. You can use the commands to give the new turtles different colors, headings, or whatever. In our case we run
one command. We set the energy for the newly hatched turtle to be 50.
When each turtle runs check-death it will check to see if its energy is less or equal to 0. If this is true, then the turtle is told to die
(die is a NetLogo primitive).
When each patch runs regrow-grass it will check to see if a random integer from 0 to 99 is less than 3. If so, the patch color is set to
green. This will happen 3% of the time (on average) for each patch, since there are three numbers (0, 1, and 2) out of 100 possible that
are less than 3.
Switch to the Interface tab now and press the setup and go buttons.
You should see some interesting behavior in your model now. Some turtles die off, some new turtles are created (hatched), and some
grass grows back. This is exactly what we set out to do.
If you continue to watch your monitors in your model, you will see that the count turtles and green patches monitors both fluctuate. Is
this pattern of fluctuation predictable? Is there a relationship between the variables?
It'd be nice if we had a easier way to track the changes in the model behavior over time. NetLogo allows us to plot data as we go along.
That will be our next step.
Plotting
To make plotting work, we'll need to create a plot in the Interface tab, and set some settings in it. Then we'll add one more procedure to
the Procedures tab, which will update the plot for us.
Let's do the Procedures tab part first.
Change setup to call the new procedure, do-plots , which we're about to add:
to setup
clear-all
setup-patches
setup-turtles
do-plots
end
Also, change go to call the do-plots procedure:
to go
move-turtles
eat-grass
reproduce
check-death
regrow-grass
do-plots
end
Now add the new procedure. What we're plotting will be be the number of turtles and the number of green
patches versus time. At each time step (a single run through the go procedure) these values are added to the
plot.
to do-plots
set-current-plot "Totals"
set-current-plot-pen "turtles"
plot count turtles
set-current-plot-pen "grass"
file:///Applications/NetLogo%204.0.2/docs/tutorial3.html
Page 11 of 16
NetLogo 4.0.2 User Manual: Tutorial #3: Procedures
4/21/09 11:28 PM
set-current-plot-pen "grass"
plot count patches with [pcolor = green]
end
Note that we use the plot command to add the next point to a plot. However, before doing that, we need to tell NetLogo two things.
First, we need to specify what plot we will be using (since later our model might have more than one plot) and second, we need to specify
which pen we want to plot with (we will be using two pens on this plot).
The plot command moves the current plot pen to the point that has an X coordinate equal to 1 greater than the previously plotted X
coordinate and a Y coordinate equal to the value given in the plot command (in the first case, the number of turtles, and in the second
case, the number of green patches). As the pens move they each draw a line.
In order for set-current-plot "Totals" to work, you'll have to add a plot to your model in the Interface tab, then edit it so its
name is the same name used in the procedures. Even one extra space in the name will throw it off -- it must be exactly the same in both
places.
Create a plot, using the plot icon on the Toolbar and click on an open spot in the Interface.
Set its Name to "Totals" (see image below)
Set the X axis label to "time"
Set the Y axis label to "total"
Next you will need to create two pens.
With the Plot dialog box still open, press the 'Create' button in the Plot dialog, to create a new pen.
Enter the name of this pen as "turtles" and press OK in the "Enter Pen Name" dialog. (see image below)
Press the 'Create' button in the Plot dialog again, to create a second new pen.
Enter the name of this pen as "grass" and press OK in the "Enter Pen Name" dialog. (see image below)
Select the color for this pen and change it to green.
Select OK in the Plot dialog box.
file:///Applications/NetLogo%204.0.2/docs/tutorial3.html
Page 12 of 16
NetLogo 4.0.2 User Manual: Tutorial #3: Procedures
4/21/09 11:28 PM
Note that when you create the plot you can also set the minimum and maximum values on the X and Y axes. You'll want to leave the
"Autoplot?" checkbox checked, so that if anything you plot exceeds the minimum and maximum values for the axes, the axes will
automatically grow so you can see all the data.
Setup and run the model again.
You can now watch the plot being drawn as the model is running. Your plot should have the general shape of the one
below, though your plot might not look exactly the same.
Remember that we left "Autoplot?" on. This allows the plot to readjust itself when it runs out of room.
If you forget which pen is which, click on the Pens label on the top right corner of the plot. You might try running the model several times
to see what aspects of the plot are the same and which are different.
Tick counter
To make comparisons between plots from one model run and another, it is often useful to do the comparison for the same length of model
run. Learning how to stop or start an action at a specific time can help make this happen by stopping the model at the same point each
model run. Keeping track of how many times the go procedure is run is a useful way to cue these actions.
To keep track of this, we will use NetLogo's built-in tick counter.
Change the go procedure:
to go
if ticks >= 500 [ stop ]
move-turtles
eat-grass
reproduce
check-death
regrow-grass
tick
do-plots
file:///Applications/NetLogo%204.0.2/docs/tutorial3.html
Page 13 of 16
NetLogo 4.0.2 User Manual: Tutorial #3: Procedures
4/21/09 11:28 PM
end
Now setup and run the model.
The graph and model won't keep running forever. They should stop automatically when the tick counter in the Interface tab's toolbar
reaches 500.
The tick command advances the tick counter by 1. ticks is a reporter which reports the current value of the tick counter. clearall takes care of resetting the tick counter to 0 when a new run starts.
Note that we put tick before do-plots . That's so if we write plotting code that uses the value of the tick counter, it will see the new
value, not the old value. (In this tutorial we won't actually write any code like that, but nonetheless, it is generally good practice to call
tick after your agents have done their actions but before you plot.)
Now that your model uses ticks, you'll probably want to use the menu at the top of the Interface tab to change from "continuous" updates
to "tick-based" updates. That means that NetLogo will only update (that is, redraw) the view (that is, the display area where you see your
agents) between ticks, never in the middle of a tick. This makes your model run faster and ensures a consistent appearance (since the
updates will happen at consistent times). See the Programming Guide for a fuller discussion of view updates.
Some more details
First, instead of always using 100 turtles, you can have a variable number of turtles.
Make a slider variable called 'number', using the monitor icon on the Toolbar and click on an open spot in the
Interface. Try changing the minimum and maximum values in the slider.
Then inside of setup-turtles , instead of create-turtles 100 you can type:
to setup-turtles
create-turtles number
ask turtles [ setxy random-xcor random-ycor ]
end
Test this change and compare how having more or fewer turtles initially affect the plots over time.
Second, wouldn't it be nice to adjust the energy the turtles gain and lose as they eat grass and reproduce?
Make a slider called energy-from-grass .
Make another slider called birth-energy .
Then, inside of eat-grass, make this change:
to eat-grass
ask turtles [
if pcolor = green [
set pcolor black
set energy (energy + energy-from-grass)
]
ifelse show-energy?
[ set label energy ]
[ set label "" ]
]
end
And, inside of reproduce , make this change:
to reproduce
ask turtles [
if energy > birth-energy [
set energy energy - birth-energy
hatch 1 [ set energy birth-energy ]
]
]
end
file:///Applications/NetLogo%204.0.2/docs/tutorial3.html
Page 14 of 16
NetLogo 4.0.2 User Manual: Tutorial #3: Procedures
4/21/09 11:28 PM
Finally, what other slider could you add to vary how often grass grows back? Are there rules you can add to the movement of the turtles
or to the newly hatched turtles that happen only at certain times? Try writing them.
What's next?
So now you have a simple model of an ecosystem. Patches grow grass; turtles wander, eat the grass, reproduce, and die. You have
created an interface containing buttons, sliders, switches, monitors, and plots. You've even written a series of procedures to give the
turtles something to do.
That's where this tutorial leaves off.
If you'd like to look at some more documentation about NetLogo, the Interface Guide section of the manual walks you through every
element of the NetLogo interface in order and explains its function. For a detailed description and specifics about writing procedures, refer
to the Programming Guide. All of the primitives are listed and described in the the NetLogo Dictionary.
Also, you can continue experimenting with and expanding this model if you'd like, experimenting with different variables and behaviors for
the agents.
Alternatively, you may want to revisit the first model in the tutorial, Wolf Sheep Predation. This is the model you used in Tutorial #1 .
In the Wolf Sheep Predation model, you saw sheep move around, consume resources that are replenished occasionally (grass), reproduce
under certain conditions, and die if they ran out of resources. But that model had another type of creature moving around -- wolves. The
addition of wolves requires some additional procedures and some new primitives. Wolves and sheep are two different "breeds" of turtle. To
see how to use breeds, study Wolf Sheep Predation.
Alternatively, you can look at other models (including the many models in the Code Examples section of the Models Library) or even go
ahead and build your own model. You don't even have to model anything. It can be interesting just to watch patches and turtles forming
patterns, to try to create a game to play, or whatever.
Hopefully you have learned some things, both in terms of the NetLogo language and about how to go about building a model. The entire
set of procedures that was created above is shown below.
Appendix: Complete code
The complete model is also available in NetLogo's Models Library, in the Code Examples section. It's called "Tutorial 3".
Notice that this listing is full of "comments", which begin with semicolons. Comments let you mix an explanation the code right in with the
code itself. You might use comments to help others understand your model, or you might use them as notes to yourself.
In the Procedures tab, comments are gray, so your eyes can pick them out easily.
turtles-own [energy] ;; for keeping track of when the turtle is ready
;; to reproduce and when it will die
to setup
clear-all
setup-patches
setup-turtles
do-plots
end
to setup-patches
ask patches [ set pcolor green ]
end
to setup-turtles
create-turtles number
;; uses the value of the number slider to create turtles
ask turtles [ setxy random-xcor random-ycor ]
end
to go
if ticks >= 500 [ stop ] ;; stop after 500 ticks
move-turtles
eat-grass
reproduce
check-death
regrow-grass
tick
;; increase the tick counter by 1 each time through
do-plots
end
to move-turtles
ask turtles [
right random 360
file:///Applications/NetLogo%204.0.2/docs/tutorial3.html
Page 15 of 16
NetLogo 4.0.2 User Manual: Tutorial #3: Procedures
forward 1
set energy energy - 1
4/21/09 11:28 PM
;; when the turtle moves it looses one unit of energy
]
end
to eat-grass
ask turtles [
if pcolor = green [
set pcolor black
;; the value of energy-from-grass slider is added to energy
set energy (energy + energy-from-grass)
]
ifelse show-energy?
[ set label energy ] ;; the label is set to be the value of the energy
[ set label "" ]
;; the label is set to an empty text value
]
end
to reproduce
ask turtles [
if energy > birth-energy [
set energy energy - birth-energy ;; take away birth-energy to give birth
hatch 1 [ set energy birth-energy ] ;; give this birth-energy to the offspring
]
]
end
to check-death
ask turtles [
if energy <= 0 [ die ] ;; removes the turtle if it has no energy left
]
end
to regrow-grass
ask patches [ ;; 3 out of 100 times, the patch color is set to green
if random 100 < 3 [ set pcolor green ]
]
end
to do-plots
set-current-plot "Totals" ;; which plot we want to use next
set-current-plot-pen "turtles" ;; which pen we want to use next
plot count turtles ;; what will be plotted by the current pen
set-current-plot-pen "grass" ;; which pen we want to use next
plot count patches with [pcolor = green] ;; what will be plotted by the current pen
end
file:///Applications/NetLogo%204.0.2/docs/tutorial3.html
Page 16 of 16