1
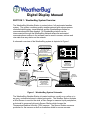
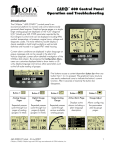
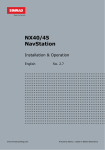
Weather Station
Digital Display User’s
Manual
Version 1.5
November 2004
Digital Display Manual
Copyright
Copyright 2003, by AWS Convergence Technologies, Inc.
WeatherBug is a trademark of AWS Convergence Technologies, Inc.
All Rights Reserved.
Information in this document is subject to change without notice and does not represent a
commitment on the part of AWS Convergence Technologies, Inc. The software described in this
document is furnished under a license or non-disclosure agreement. The software may be used
or copied only in accordance with the terms of this agreement. It is against the law to copy AWS
Convergence Technologies, Inc., software onto magnetic tape, disk or any other medium for any
purpose other than for the purchaser's personal use.
Note: This equipment has been tested and found to comply with the limits for a Class A digital
device, pursuant to Part 15 of the FCC rules. These limits are designed to provide reasonable
protection against harmful interference when the equipment is operated in a commercial
environment. This equipment generates uses and can radiate radio frequency energy. If not
installed and used in accordance with the instruction manual, may cause harmful interference to
radio communications.
For Technical Support relating to this WeatherBug product, call
800-624-4205 or email [email protected].
1
Digital Display Manual
TABLE OF CONTENTS
Page
Copyright ............................................................................................................. 1
SECTION 1: WeatherBug System Overview .................................................... 3
2.1 Unpacking ............................................................................................................. 5
2.2 Choosing a Site to Locate Your Display............................................................. 5
2.3 Installing the Digital Display ................................................................................ 6
SECTION 3: Operation of the Digital Display .................................................. 7
3.1
3.2
3.3
3.4
Current Conditions ............................................................................................... 9
Changing Display Units...................................................................................... 14
Rates of Change ................................................................................................. 14
Daily Minimum and Maximum Values ............................................................... 15
SECTION 4: Trouble Shooting Your Digital Display ..................................... 16
LIST OF TABLES AND FIGURES
Table 1:
Values Available from Digital Display.................................... 6
Table 2:
Available English and Metric Units........................................ 11
Table 3:
Troubleshooting Guide.......................................................... 13
Figure 1:
WeatherBug System Schematic........................................
Figure 2:
Digital Display Schematic...................................................... 5
2
1
Digital Display Manual
SECTION 1: WeatherBug System Overview
The WeatherBug Weather Station is a stand-alone, fully automated weather
system. The system combines quality weather sensors with microprocessor
controlled data logging, visual displays and the WeatherBug software for
communications and data displays. All WeatherBug stations can be
interconnected through the WeatherBug Network where the automated
communications routines in the software can be used to access, retrieve and
view data from any station on the network.
A schematic overview of the WeatherBug system is depicted in Figure 1.
Master Control Unit (MCU)
Automatically Stores Data
4 Months Stored Internally
Auto-Download to PC
Automatic Battery Back-Up
Triple Data Outputs
Barometric Pressure Sensor
Indoor Temp Sensor
Sensor Station
Temperature
Relative Humidity
Wind Speed
Wind Direction
Precipitation
Light
AUTOMATED
WEATHER
SOURCE
NW
MPH
Aux
E
Min
Max
Wind Chill
Heat Index
Dew Point
Wet Bulb
Dew Point
Select
Wet Bulb
SE
Avg
S
Rate
Select
Barometer
135
180
SW
Wind Chill
Heat Index
%
45
90
KNOTS
Outdoor
pm
NE
270
225
Indoor
am Select
Humidity
0
315
W
Temperature
Time/Date
Select
Winds
N
Units
Rainfall
Light
English
Metric
%
Select
Day
Month
Year
Digital Display
User-Friendly
“Real-Time” Data
Highs/Lows
Trends, Averages
Rates of Change
MODEM
Remote Access
MAC or PC
Software
Local Access
Telecommunications
MAC or PC
Software
MODEM
Remote
Access via
Direct Internet
Computer Software
Automated Communications
“Real-Time” Color Graphics
Autoplot Mapping
Automatic Graphing
Data Analysis
Educational Lessons
Figure 1 - WeatherBug System Schematic
The WeatherBug Weather Station is located outdoors, usually on a rooftop or in
an open, unobstructed area to obtain best results. The Weather Station includes
a Wind Sensor to monitor the wind, a Rain Gauge to measure liquid precipitation,
a photocell to measure light and a Sensor Shelter which houses the
Temperature/Relative Humidity (TRH) sensors. The Sensor Shelter serves as
protection for the sensors as well as a radiation shield to ensure accurate
3
Digital Display Manual
temperature and relative humidity readings. Unshielded sensors yield inaccurate
results that are highly dependent upon the incident solar radiation.
Data generated by the rooftop sensors is converted from analog to digital form to
the rooftop remote unit is fed via cable to the Master Control Unit (MCU) located
indoors. The barometric pressure sensor is located inside the MCU. The data is
stored in non-volatile electronic memory. Historical data can be stored (logged)
at selectable intervals; 15 minutes, 30 minutes or 60 minutes (1 hour). There is
sufficient memory in the MCU to store data for up to 4 months at 1-hour intervals.
Stored data can be transmitted through three separate outputs for viewing and
analysis.
The first output on the back of the MCU is labeled “Display", which will be
described in this manual. The "Digital Display" receives real time data (every one
second) from the MCU and displays the data on several large, easy-to-read
digital LED's. The display is housed in an attractive oak case and contains
several features for viewing daily highs, lows and rates of change.
WeatherBug Display Specifications:
Wind Speed
0 - 99 mph*
0 - 99 km/h*
1 mph
1 km/h
0-360 deg
23 deg
(16 compass points)
(1 point)
Temperature
-60F to +130F
-51C to +54C
1F
1C
Barometric Pressure
17.5"Hg - 32.0"Hg
593 mbar - 1084 mbar
0.01" Hg
1 mbar
Relative Humidity (RH)*
5% to 100%
1.0%
unlimited
.01"
.02 cm
Wind Direction
* Dewpoint calculated
from Temp. and RH
Rainfall
*WeatherBug Weather Station records wind speeds well in excess of 99 mph or 99 km/h, and will show
these higher values in the computer software.
For more information on sensor specifications, see “WeatherBug System Installation, Operations and
Maintenance Manual”
4
Digital Display Manual
SECTION 2: Installing the Digital Display
As shown in Figure 1, your Digital Display must be connected to the overall
WeatherBug Weather Station through the Master Control Unit (MCU). This
section of the manual will describe the steps necessary to install and connect
your display to the MCU.
In general, there are three easy steps required to install your Digital Display:
1. Unpack your display from the shipping container
2. Choose a site to place your display
3. Connect the power and data lines to the display
2.1 Unpacking
First, carefully remove your display from its shipping container. Remove the
bubble wrap protection from around the display. Enclosed with the display is a
power pack with power cord and a standard 25 ft phone cord (RJ11).
2.2 Choosing a Site to Locate Your Display
In choosing a site to locate your Digital Display there are several factors you
should consider, including the following:
1. Place the display where it will most easily viewed;
take into account possible glare problems from
nearby light sources.
2. Place the display where you will be able to
comfortably reach and use the buttons, perhaps on a
shelf or desktop under instructor’s supervision.
3. The Digital Display unit can be placed up to 700 ft
from the MCU. However, if placed more than 25 feet,
you must provide your own 4 conductor phone cord.
4. You must be able to run the phone cord from the site
you choose for the Digital Display to the MCU.
5. Place the display where there is access to a standard
110V power outlet.
5
Digital Display Manual
A MCU can power up to 10 displays totaling 700 feet (ie. 10 x70
feet = 700 feet). Additional displays can easily be purchased from
your WeatherBug Representative by calling 1-800-544-4429.
2.3 Installing the Digital Display
Once you have chosen a site to place your Digital Display, the final installation is
relatively simple. The standard phone line must be "run" between the MCU and
the Digital Display, connected to each, and then power must be connected to the
display.
The back of the MCU has a female phone jack connector labeled "Display". Plug
one end of the phone line into that connector. The back of the Digital Display
also has a female phone jack labeled "Data Logger / MCU". Plug the other end
of the phone line into that connector.
To connect the power to the Digital Display, first plug the power jack into the
receptacle labeled “Power” on the back of the display. Then plug the power pack
with the standard 2 prong connector into a standard 110 volt outlet. This will
activate the Digital Display. If the MCU and sensors are operating, real time
values from the MCU should be displayed.
With the exception of maximum and minimum wind speeds, the Digital Display
tracks and stores daily highs and lows. On the first day of operation the daily
highs and lows will be those that occur subsequent to initial power up of the unit.
Daily highs and lows will also be reset if the display’s power is removed or lost
during operation.
6
Digital Display Manual
SECTION 3: Operation of the Digital Display
This section of the manual will provide a detailed description of all the features of
the Digital Display and their uses. Much of the discussion will refer to the
schematic of the display shown in Figure 2.
AUTOMATED
Select
Winds
N
NW
W
225
45
MPH
KNOTS
E
90
37
Select
pm
Indoor
Outdoor
Aux
Wind Chill
Heat Index
%
28
Select
Wind Chill
Heat Index
Dew Point
Wet Bulb
Barometer
30.17
135
180
SW
36
Select
Dew Point
Wet Bulb
SE
S
Rate
97
NE
7
270
12:54
am
Humidity
0
315
Temperature
Time/Date
WEATHER
SOURCE
Min
Max
Avg
Units
English
Metric
Rainfall
Light
88 %
Select
0.07
Figure 2: Digital Display Schematic
7
Day
Month
Year
Digital Display Manual
Table 1 provides a summary of all values that can be displayed, measured or
calculated by the WeatherBug Weather Station (indicated by X's in the table).
The paragraphs that follow will describe the manner in which each of the values
is displayed on the Digital Display.
Value
Current
Time/Date
Indoor Temperature
Outdoor Temperature
Auxiliary Temperature
Relative Humidity
Barometric Pressure
Wind Speed
Wind Direction (Compass)
Dew Point Temperature
Wet Bulb Temperature
Wind Chill Index
Heat Index
Light Intensity
Daily Rainfall
Monthly Rainfall
Yearly Rainfall
Rainfall Rate
X
X
X
X
X
X
X
X
X
X
X
X
X
X
X
X
X
Average Daily High Daily Low
X
X
X
X
X
X
X
X
X
X
X
X
X
X
X
X
X
X
X
X
X
X
X
X
X
X
Table 1: Values Available from the Digital Display
8
Change Rates/
Trend Arrows
X
X
X
X
X
X
Digital Display Manual
3.1 Current Conditions
By default, all values displayed by the digital unit are "real-time" or current
conditions (values are updated every one second). What you see displayed is
what is happening at the time. The following paragraphs will describe each value
individually.
Time/Date
The time and date are shown in the top, center region of the Digital Display. By
default, the display is set to the current time in 24 hour format. The date is
displayed in "month.day" format, e.g., if the date shown is "2.15" then the date is
February 15th. When the date is being displayed, neither of the AM/PM indicator
lights are illuminated.
Pressing the "Select" button to the left of the time/date box set the display in
cycle mode where it will continuously rotate between the time and the date.
Pressing the "Select" button again will cause the display to be fixed on the value
it was displaying at the time.
If the time and/or date indicated is incorrect, please call WeatherBug Weather
Station Technical Support at (800) 624-4205 to have Technical Support remotely
set the time and date. Please note that the unit will automatically correct itself for
Daylight Savings Time.
Humidity
The relative humidity reading is located just below the time/date. The units of
relative humidity are percent (%). To the right the humidity box are trend arrows
in the form of upward and downward pointing triangles. If the upward pointing
triangle is illuminated then the humidity is rising (increasing). If the downward
pointing triangle is illuminated then the humidity is falling (decreasing). If neither
of the triangles are illuminated then the humidity is steady (not changing). To
view rates of change and daily minimum and maximum values for relative
humidity, refer to sections 3.3 and 3.4 of this manual.
Barometer
The barometric pressure reading is located just below the relative humidity box.
Barometric pressure can be displayed in both the English units of inches of
Mercury ("Hg) and the Metric units of millibars (mbar). Refer to section 3.2 of this
manual to change the display units.
9
Digital Display Manual
To the right the barometric pressure box are trend arrows in the form of upward
and downward pointing triangles. If the upward pointing triangle is illuminated
then the barometric pressure is rising (increasing). If the downward pointing
triangle is illuminated then the barometric pressure is falling (decreasing). If
neither of the triangles are illuminated then the barometric pressure is steady (not
changing). To view rates of change and daily minimum and maximum values for
barometric pressure, refer to sections 3.3 and 3.4 of this manual.
Light
The Light Sensor in the Weather Station is a photocell that responds to all visible
light. The light may originate from the sun or from man-made sources. The light
reading is located in the bottom, center region of the display, just below the
barometric pressure box. The units of measurement displayed are a percentage
(%) of available light. On bright, sunny days readings will be 60% to near 100%.
On cloudy days, readings can range from 5% to 50%. At night, the sensor will
usually indicate 0%.
To the right of the light box are trend arrows in the form of upward and downward
pointing triangles. If the upward pointing triangle is illuminated then the light
intensity is rising (increasing). If the downward pointing triangle is illuminated
then the light intensity is falling (decreasing). If neither of the triangles are
illuminated then the light is steady (not changing). To view rates of change and
daily minimum and maximum values for light, refer to sections 3.3 and 3.4 of this
manual.
Temperature
The WeatherBug Weather Station includes three temperature sensors. The
outdoor temperature sensor is located outdoors in the Sensor Shelter. The
Indoor Temperature Sensor located within the MCU. The location of the Optional
Auxiliary Temperature Sensor may vary from site to site. It can be located
indoors or outdoors. The standard Auxiliary Temperature Sensor can be run up
to 25 feet. Longer auxiliary temperatures probes can be purchased from your
WeatherBug Representative.
The temperature readout box on the unit is located in the upper right region of
the display. Temperature values can be displayed in the English units of degrees
Fahrenheit (F) or the Metric units of degrees Celsius (C). By default the units are
displayed in degrees Fahrenheit (F). To change the measurement units, refer to
section 3.2 of this manual.
10
Digital Display Manual
By default, the Digital Display will cycle between the indoor, outdoor and auxiliary
temperature (about three seconds per value). Three small circular indicator
lights are located to the right of the temperature readout box, labeled "Indoor",
"Outdoor", and "Aux". These lights indicate which temperature value is currently
being displayed. To "freeze" the display on a particular value press the "Select"
button to the left of the temperature box when that value is being displayed.
Pressing the "Select" button again will return the display to cycling automatically
between all three values.
NOTE: Younger students may find it easier to read the display if the temperature
is “locked” in on the outdoor temperature.
To the right of the temperature box are trend arrows in the form of upward and
downward pointing triangles. Trends are available for each of the temperature
values. If the display is in automatic cycle mode, the appropriate trend arrows
will also cycle with it. If the upward pointing triangle is illuminated then the
temperature trend is rising (increasing). If the downward pointing triangle is
illuminated then the temperature trend is falling (decreasing). If neither of the
triangles are illuminated then the temperature is steady (not changing). To view
rates of change and daily minimum and maximum values for temperature, refer
to sections 3.3 and 3.4 of this manual.
Wind Chill / Heat Index
The wind chill / heat index values are displayed just beneath the temperature
box. Wind chill and heat index values can be displayed in the English units of
degrees Fahrenheit (F) or the Metric units of degrees Celsius (C). By default the
English units are displayed. To change the measurement units, refer to section
3.2 of this manual.
The Digital Display automatically determines which value to display. If the
outdoor temperature is below 60 degrees F then the wind chill index is displayed.
If the outdoor temperature is 60 degrees F or above then the heat index is
displayed. The two small circular lights to the right of the wind chill / heat index
box (labeled "Wind Chill" and "Heat Index") indicate which value is currently
being displayed.
Dew Point / Wet Bulb
The dew point and wet bulb temperatures share a readout box just below the
wind chill and heat index values. Dew point and wet bulb temperature values can
11
Digital Display Manual
be displayed in the English units of degrees Fahrenheit (F) or the Metric units of
degrees Celsius (C). By default the English units are displayed. To change the
measurement units, refer to section 3.2 of this manual.
By default the Digital Display indicates dew point temperature. Pressing the
“Select” button changes the display to automatically cycle between the two
values (one second each). The two small circular lights to the right of the
readout box indicate which value is being displayed.
To "freeze" the display at a particular value press the "Select" button to the left of
the readout box when that value is being displayed. Pressing the "Select" button
again will return the display to cycling automatically between the two values.
Rainfall
The WeatherBug Weather Station monitors and records daily, monthly and yearly
rainfall totals. The rainfall readout box on the Digital Display is located in the
lower right region of the unit. Rainfall values can be displayed in the English
units of degrees inches (in) or the Metric units of centimeters (cm). By default
the English units are displayed. To change the measurement units, refer to
section 3.2 of this manual.
By default the display indicates the daily rainfall total. Pressing the “Select”
button changes the display to automatically cycle between daily, monthly, and
yearly rainfall (one second each). The three small circular lights to the right of
the rainfall readout box indicate which value is currently being displayed.
To "freeze" the display at a particular value, press the "Select" button to the left
of the readout box when that value is being displayed. Pressing the "Select"
button again will return the display to cycling automatically between all three
values. To view the rainfall rate and daily maximum rainfall rate, refer to sections
3.3 and 3.4 of this manual.
Wind Speed and Direction
The left most region of the display is dedicated to wind speed and direction. The
sixteen circles with arrow shapes connected to them represent sixteen points on
the compass (the circles with arrow shapes connected to them are intended to
resemble a typical wind vane). Eight of these figures are labeled with their
associated compass points and direction in degrees. In the meteorological
coordinate systems, angular degrees rotate clockwise from north, with north
12
Digital Display Manual
being zero degrees. The wind speed readout box is located in the center of the
circle of compass points.
The wind direction is indicated by the illuminated compass point. For example, if
the North (N or 360) circle is illuminated, then the wind is coming from the north
and blowing toward the south. The number in the readout box indicates the
speed of that wind.
The WeatherBug Weather Station also computes the average wind speed and
direction over a two-minute period. Since wind speed and direction often change
significantly in short periods of time the averaged values provide a better
indication of the predominant conditions. In average mode, you will notice that
the wind speed and direction change less frequently. This may be easier for
younger students to view.
To view average wind speed and direction conditions, press the "Avg" button
outside the lower right region of the compass points. The circle next to the "Avg"
button will illuminate, indicating that average conditions are being displayed.
Pressing the "Avg" button again toggles the display back to instantaneous or
real-time mode. To view the daily maximum wind speed (gust), refer to section
3.4 of this manual.
To view average wind speed and direction conditions, be sure that the "Avg" light
below the SE region of the compass is illuminated. Pressing the "Avg" button
again toggles the display back to instantaneous or real-time mode. To view the
daily maximum wind speed (gust), refer to section 3.4 of this manual.
13
Digital Display Manual
3.2 Changing Display Units
The Digital Display unit provides the capability to display values in English or
Metric units. Table 2 depicts the measurement units available from the display
unit.
Weather Value
English Unit
Metric Unit
Temperature
Barometric Pressure
Wind Speed
Degrees Fahrenheit (F)
Inches of Mercury ("Hg)
Miles per Hour (mph)
Knots (knts)
Inches (in)
Degrees Celsius (C)
Millibars (mbar)
Kilometers per Hour (km/h)
Precipitation
Centimeters (cm)
Table 2: Available English and Metric Units
There are two circles just to the right of the "Units" button, one of which will be
illuminated, indicating which units are currently being displayed. English units
are the default setting of the Digital Display unit. To toggle between English units
and Metric units press the "Units" button. The indicator light will change as you
press the button.
The Standard English wind speed unit of miles per hour (mph) is factory set at
the time of order. To change the English wind speed units from miles per hour
(mph) to knots or vice versa, you must send the display unit back to WeatherBug
Technical Support via an RMA. Please call WeatherBug Weather Station
Technical Support at 800-624-4205 for assistance.
3.3 Rates of Change
The Weather Station Digital Display unit allows you to view the rates of change of
several weather values, as shown in Table 1. To view the rates of change press
and hold the "Rate" button in the lower left region of the display. Values for rates
which are not available will not be displayed. Releasing the "Rate" button returns
the display to the current conditions mode.
All rate values are expressed in "per hour" format. For example, when the rate
button is pressed and held, the value in the humidity readout box is the rate of
14
Digital Display Manual
change of relative humidity expressed in percent per hour (%/hr). A positive rate
means humidity is increasing. A negative rate means humidity is decreasing.
3.4 Daily Minimum and Maximum Values
As shown in Table 1, the Digital Display unit records and displays daily highs and
lows for several weather variables. To view the daily lows, simply press and hold
the "Min" key in the lower left region of the display. Releasing the button returns
the display to current conditions mode. To view the daily highs, simply press and
hold the "Max" key in the lower left region of the display. Releasing the button
returns the display to current conditions mode. Values for which no daily highs
and lows are tracked will not be displayed.
The Digital Display tracks and stores daily highs and lows. On the first day of
operation, the daily highs and lows will be those that occur subsequent to initial
power up of the unit. Daily highs and lows will also be reset if the display’s power
is removed or lost during operation. Section 2.3 explains how to utilize the UPS
(uninterruptible power supply) to maintain continuous power supply to the
display.
NOTE: These high and low values are automatically reset at midnight each
night.
15
Digital Display Manual
SECTION 4: Trouble Shooting Your Digital Display
Table 3 presents a list of possible problems and causes that you could
experience with your Digital Display.
Problem
Possible Cause
1. No display lights
Power not connected properly
2. All zeros on display, or
the words “no signal”
Data phone line between MCU and
display not connected properly
3. Temperature of –100
Data transfer between Remote Weather
Module and Master Control Unit
3. Highs and lows incorrect
Power interruption during the day
4. Change rates incorrect
Power interruption during the day
5. Time and/or date incorrect Call WeatherBug Technical Support
Table 3: Troubleshooting Guide
If you have any questions regarding your Digital Display, you may call the
WeatherBug Weather Station Technical Support line at (800) 624-4205 or
reach help via email at [email protected].
16