1
Appendix for Corescan
10.1.2.1.Core Scan application
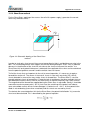
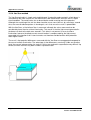
In this section, Core Scans will be shown for different causes of high (and non-uniform) contact
resistance.
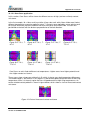
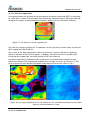
In the first example, 10 x 10 cm multi-crystalline silicon solar cells with silicon nitride were fired at
different temperatures around an optimum value T. Contacts were applied by screen printing and
co-firing of aluminium paste on the back side and silver paste on the front side. The cells are
positioned on the belt with the busbars perpendicular to the belt direction.
Figure 5: FF 72 %, T45 °C
Figure 6: FF 74 %, T30 °C
Figure 7: FF 74%, T15 °C
Figure 9: FF 74 %,
T+15 °C
Figure 10: FF 69 %,
T+30 °C
Figure 11: FF 62 %,
T+45 °C
Figure 8: FF 75 %,
T+0 °C
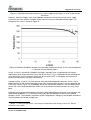
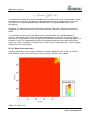
Core Scans on cells fired at different set temperatures. Lighter areas have higher potential and
thus higher contact resistance.
These scans show a large non-uniformity in Rcl which is due to cross-belt temperature differences.
The middle region is the coolest: in this region it is too cold for good contact formation at low firing
temperature, while it is the only region that has still good contact at high firing temperatures. An
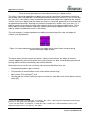
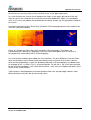
emitter related contact problem is shown in figure below, which shows a circle of increased contact
resistance.
Figure 12: Circle of increased contact resistance
Corescan
Version 10.00 MRN-061-EN
Page 67