1
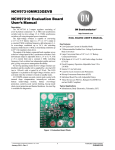
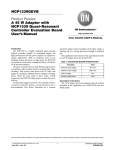
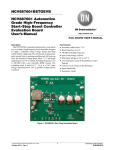
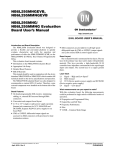
Test Procedure for the 25VT6A5VGEVB Evaluation Board
Test Setup
The test set up, test points and components present on the
25VT6A5VGEVB Evaluation Board are shown in Figure 4.
The MOSFET parts placed on the evaluation board are the Q1
and Q4 (Refer to Figure 1).
Figure 4. Schematic of the Test Setup
Start up and Shut down Procedures
Before starting the test, the oscilloscope probes should be
connected. IR or k−type thermo−couples can be used to
monitor the temperature of the parts. IR monitoring requires
the removal of the oscilloscope probes due to the IR beam
interference.
Start up Procedure (VOUT 0.8 V – 1.56 V):
1. Initially set all the power supplies to 0 V.
2. Set the output voltage to the desired value by changing
the VID settings on SW2 (see Appendix). The SW2
must be changed while the driver and controller are off.
3. Set the driver voltage and controller voltage to 5 V.
4. Set the inptut voltage to the desired value (8 V – 16 V).
5. VOUT Adjustments: the output voltage may be fine-tuned
at this time, by adjusting the R60 potentiometer.
6. Set the load current to the required value. The load
current must be incremented slowly to prevent the
controller from shutting down due to transient spikes on
the inductor current sense lines (CS1, CS2 in Figure 2).
If the controller shuts down, there are two different
methods that can be used to reset the controller. The first
4/30/2014
1
method is to toggle Pin 8 (EN) of the Grayhill switch
(SW2) to 0 (down position) and then back to 1 (up
position). The second method is to set VIN to 0 V
and then back up to the desired voltage, then turned
on and Vin re−established.
Start up Procedure (VOUT 1.56 V – 1.8 V):
1. Initially set all the power supplies to 0 V.
2. Set the output voltage to 1.56 V by changing the VID
settings on SW2 (see Appendix). The SW2 must be
changed while the driver and controller are off.
3. Set the driver voltage and controller voltage to 5 V.
4. Set the input voltage to the desired value
(8 V – 16 V).
5. Adjust the output voltage using the R60
potentiometer until the desired output voltage is
reached (1.8 V maximum).
6. Set the load current to the required value. The load
current must be incremented slowly to prevent the
controller from shutting down due to transient spikes
on the inductor current sense lines (CS1, CS2 in
Figure 2). If the controller shuts down, there are two
www.onsemi.com
different methods that can be used to reset the controller.
The first method is to toggle Pin 8 (EN) of the Grayhill
switch (SW2) to 0 (down position) and then back to 1
(up position). The second method is to set VIN to 0 V
and then back up to the desired voltage, then turned on
and Vin re−established.
3.
4.
Reduce the input voltage to zero and then shut down
the input power supply.
Reduce the driver voltage and controller voltage to
zero. Then shut down the driver power supply and
controller power supply.
Test Procedure
1.
Shut down Procedure (VOUT 0.8 V – 1.56 V):
1. Shut down the load.
2. Reduce the input voltage to zero and then shut down the
input power supply.
3. Reduce the driver voltage and controller voltage to zero.
Then shut down the driver power supply and controller
power supply.
Shut down Procedure (VOUT 1.56 V – 1.8 V):
1. Shut down the load.
2. Adjust the potentiometer until the output voltage
measures 1.56 V.
4/30/2014
2.
3.
4.
5.
6.
2
Before making any connections, make sure to set all
power supplies to 0 V, and make sure the load current
is 0 A.
Connect the oscilloscope probes at the desired test
points.
Connect the voltmeters / multi-meters to monitor the
required parameters (refer to Figure 4).
Set the output voltage to 1.2 V and the input voltage
to 12 V, following the Start-Up Procedure specified
in the previous section.
Obtain the required data and waveforms
Follow the Shut-Down Procedure specified in the
previous section.
www.onsemi.com
TEST RESULTS
The following test results were obtained for the 25VT6A5VGEVB evaluation board by following the Test Procedure listed
above. The selected MOSFETs were evaluated in a 1 x 1 combination.
Figure 5. Efficiency of NTTFS4H07N x NTMFS4H02NF for VIN = 12 V, VOUT = 1.2 V, VDRV = 5 V, FSW = 500 kHz
Figure 6. Switch Node and Gate Waveforms of NTTFS4H07N x NTMFS4H02NF taken at IOUT = 20 A
4/30/2014
3
www.onsemi.com