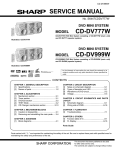
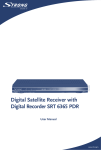
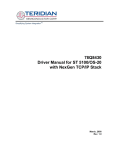
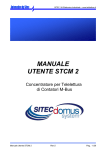
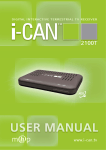
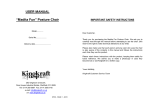
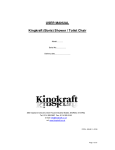
1
ST20 Embedded Toolset
R2.0.5 Patch-2 Release Notes
September 2004
R2.0.5 Patch-2 Release Notes
Contents
1
INTRODUCTION
3
1.1
New in this patch
3
1.2
Other Enhancements and Fixes Summary
3
2
INSTALLATION INSTRUCTIONS
5
2.1
PC installation instructions
5
2.2
Solaris installation instructions
5
2.3
Linux installation instructions
5
3
ST VISUAL DEVELOP KEY IMPROVEMENTS
6
3.1
Substantial speed improvements
6
3.2
Improved "Edit Event" dialog
6
3.3
"Find in Files" dialog
7
3.4
Trace navigation improvements
7
3.5
Multiple “Watch Tip” formats
8
3.6
Intelligent breakpoint resource allocation
9
3.7
"Go to line" option in editor
9
3.8
Files can be added to project recursively
9
3.9
Watch window context handling
10
3.10
Show/hide details option on callstack window
10
3.11
Help
11
3.12
Ability to save and open trace sessions
11
3.13
Ability to save and open core dumps
11
3.14
Numerous bug fixes
11
4
USING ST VISUAL DEVELOP WITH AN EXISTING MAKEFILE
12
5
POST-MORTEM TRACE AND TRAPHANDLER LOCATION
13
6
TRACE UPDATE IN SOLARIS/LINUX (INQUEST GUI)
14
STMicroelectronics
2 of 14
R2.0.5 Patch-2 Release Notes
1 Introduction
This document contains the release notes for the ST20 Toolset version R2.0.5Patch-2 and complements the ST20 Embedded Toolset Delivery Manual (ADCS
7257995), identifying changes and clarifications made since the ST20 R2.0.5 product
release.
To install this patch, first ensure the R2.0.5 product release is installed and then
follow instructions in section 2 Installation Instructions.
Any future R2.0 patches will include this one, so only the last patch release ever needs
to be installed (previous patches will still be made available). See section 1.1 New in
this patch for a description of what has been updated in this patch since previous patch
releases. See section 1.2 Other Enhancements and Fixes Summary for a description of
previous patch releases.
See the buglist, buglist.htm, for the list of enhancements or bugs fixed in this release.
This buglist also contains the unresolved bugs discovered since the R2.0.5 release; it
is the file <ST20ROOT>/doc/buglist.htm, which can found via the toolset
navigation browser file <ST20ROOT>/index.htm .
Note: in this document, the top level installation directory is referred to as
<ST20ROOT>.
1.1 New in this patch
This R2.0.5-P2 patch includes all that was in previous R2.0.5 patches plus the
following:
•
Alterations to the TCOFF object and debug file formats to reduce file size
o Faster compilation/linkage due to smaller files, particularly for C++
•
Faster C++ dependency generation.
See section 1.2 Other Enhancements and Fixes Summary for the R2.0.5 updates in
previous patch releases.
It should be noted that although these changes result in compilation and linking
performance better than R2.0.5 or R2.0.5-P1, for many C++ applications compile and
link times will still be slower than when using the R1.9.6-P7 toolset. This is because
the R2.0.5 series toolsets provide better support for C++, such as:
•
thread-safe exceptions support
•
support for the C++ STL
•
commoning-up of code/data from multiple object files resulting in smaller
ROM images/linked-units.
1.2 Other Enhancements and Fixes Summary
The major enhancements and fixes in this and previous patch releases since the ST20
R2.0.5 product release include:
•
Substantial improvements to ST Visual Develop (st20dev) , see section 3
•
Fixes to the Unix/Linux hosted version of the st20run GUI (referred to as
inquest in the buglist) for:
STMicroelectronics
3 of 14
R2.0.5 Patch-2 Release Notes
o Events window data breakpoint display
o Win XP "No Exception handler installed" fatal error
o Memory and speed problems with huge dbg file
•
Runtime libraries
o Performance improvements for ST20-C1 memset
o Avoid clash of devid for st20sim and silicon
o Replace byte copying in romload2 on C1 with word copying
o Added support for chip STi7710
•
os20
o New version due to bug fixes, see the file
<ST20ROOT>/src/os20/readme.txt
o Extended ST20-C1 os20 timer plug-in for STm5700. See the file
<ST20ROOT>/examples/os20/c1timer/readme.txt
•
C++ (st20edg)
o Workaround for exploding file sizes due to #include emulation (only C
enter include functionality now supported).
o Type identifier symbols in BSS sections are not being properly
commoned up
•
st20run
o Ability to load a saved trace session from file into an existing core
session.
o Various trace fixes
o Better display of classes
o Include interrupt controller registers in core file for os20 task list
•
Toolset validated on:
o STm5700 evaluation board MB385
o STi5100 evaluation board MB390
STMicroelectronics
4 of 14
R2.0.5 Patch-2 Release Notes
2 Installation Instructions
2.1 PC installation instructions
First, ensure the R2.0.5 product release is installed:
stm-st20.205-2.0.5-MSWin32-x86.exe
Then install the patch release by running the following:
stm-st20.205-2.0.5-MSWin32-x86-patch-2.exe
The patch installer should automatically detect the directory of the R2.0.5 installation,
%ST20ROOT%, but this may fail in some cases, so be sure to check the installation
directory when the installer displays it.
The patch installer should automatically detect any previous R2.0.5 patch release
installations and will uninstall them.
The patch may be uninstalled (from the Windows Control Panel) to revert to the
product release. Always uninstall the patch before modifying or uninstalling the
product release, as not doing so is likely to result in a corrupted installation.
2.2 Solaris installation instructions
First, ensure the R2.0.5 product release is installed:
stm-st20.205-2.0.5-sun4-solaris.tar.gz
Then obtain the patch installation:
stm-st20.205-2.0.5-sun4-solaris-patch-2.tar.gz
Unzip and untar the patch into the toolset root directory, $ST20ROOT, using the
commands:
gunzip stm-st20.205-2.0.5-sun4-solaris-patch-2.tar.gz
tar xvf stm-st20.205-2.0.5-sun4-solaris-patch-2.tar
The tar file can then be deleted.
2.3 Linux installation instructions
First, ensure the R2.0.5 product release is installed:
stm-st20.205-2.0.5-1.i386.rpm
Then obtain the patch installation:
stm-st20.205-2.0.5-i386-linux-patch-2.tar.gz
Unzip and untar the patch into the toolset root directory, $ST20ROOT, using the
commands:
gunzip stm-st20.205-2.0.5-i386-linux-patch-2.tar.gz
tar xvf stm-st20.205-2.0.5-i386-linux-patch-2.tar
The tar file can then be deleted.
STMicroelectronics
5 of 14
R2.0.5 Patch-2 Release Notes
3 ST Visual Develop Key Improvements
•
Substantial speed improvements
•
Improved "Edit Event" dialog
•
"Find in Files" dialog
•
Trace navigation improvements
•
Multiple “Watch Tip” formats
•
Intelligent breakpoint resource allocation
•
"Go to line" option in editor
•
Files can be added to project recursively
•
Watch window context handling
•
Show/hide details option on callstack window
•
Ability to save and load trace data
•
Ability to save and load core files
•
Numerous bug fixes
3.1 Substantial speed improvements
There has been a considerable focus on improving performance of ST Visual Develop
over the original R2.0.5 product. In particular the communications with the st20run
process on each update has been optimised to make stepping more responsive.
3.2 Improved "Edit Event" dialog
The dialog used for adding and modifying events has been completely redesigned for
ST Visual Develop. The new dialog is based around a system of tabs:
The most commonly used options are available on the General tab, with the ability to
make the event specific to a particular program, task and/or frame available on the
Context tab and the remaining options available on the Advanced tab.
STMicroelectronics
6 of 14
R2.0.5 Patch-2 Release Notes
Two notable changes from the old dialog are the Skip control and the Action on break
combo on the Advanced tab. Skip corresponds to the old Count option, and maps
down to the “break –counter” st20run command. It should be noted that the value to
be used to get a particular result has changed because of the different sense of the
wording. To set a breakpoint to only stop the fifth time it is hit, the old Count control
would have been set to 5. To get the same result, the new control should be set to
“Skip 4 times”.
The Action on Break combo contains the following three options:
•
Stop on break. This is the default behaviour
•
Notify only on break. This was previously referred to as continue.
•
Silent on break. This corresponds to the Non-trapping option in the old dialog.
3.3 "Find in Files" dialog
ST Visual Develop now provides a Visual Studio-style Find in Files dialog, allowing
the user to search for a chosen string in all files in a chosen folder and its subfolders.
However, the dialog does not support regular expression searching.
3.4 Trace navigation improvements
The trace window tables have been enhanced to make navigation through trace data
easier. A scrollbar is now provided, and when a large number of trace records have
been collected they are split into “pages” of 4000 records, which are navigated with a
spin control.
Also, when the user double-clicks on an iptr or source reference to locate the source
or disassembly windows, the appropriate line in those windows will be highlighted in
orange.
STMicroelectronics
7 of 14
R2.0.5 Patch-2 Release Notes
3.5 Multiple “Watch Tip” formats
Hovering the mouse pointer over a variable when debugging will display the value of
that variable in a tooltip. In R2.0.5, the format of this value was the st20run print
default for the type of the variable. In this patch, it has been enhanced to allow the
user to specify one or more of the formats supported by the st20run print command
(Decimal, Binary, Octal, Hexadecimal, ASCII, Strings).
Also, the Watch Tips now uses line context. For example, in this code:
Hovering over the two i's will recognise the two different instances and give the
correct value for the one being hovered over.
STMicroelectronics
8 of 14
R2.0.5 Patch-2 Release Notes
Watch Tip options are available from Tools>Options, or from the source window
context menu.
3.6 Intelligent breakpoint resource allocation
ST20 cores, particularly those with a DCU2 rather than a DCU3, have only limited
register resource for setting hardware breakpoints. Simple code breakpoints are
simulated in software but data breakpoints, ranged breakpoints and those using
options such as tracing must be set in hardware.
ST Visual Develop in this patch manages this limited resource by a notion of implicit
and explicitly hardware breakpoints. When the user chooses an option which requires
that the breakpoint be set in hardware, e.g. “Trace on”, it will automatically be
implemented in hardware.
This is an “implicitly hardware” breakpoint. If in the future the user modifies the
breakpoint so that it no longer needs to be set in hardware (by changing the tracing
option to “No tracing”, for example) it will automatically be moved to being
implemented in software, freeing up the hardware resource. If the user specifically
wants to implement a code breakpoint in hardware without using any options that
require it, they can choose “Code (H/W) Breakpoint” from the Event Type combo.
This event is then considered to be “explicitly hardware” and will be kept as a
hardware breakpoint unless the Event Type is specifically changed.
This should help ensure that users have as much hardware resource available as
possible at any given point.
3.7 "Go to line" option in editor
The ST Visual Develop editor now provides a "Go to line" option, available from the
source window context menu and Ctrl+G.
3.8 Files can be added to project recursively
The dialog used to add files to a project has been enhanced to allow whole folders to
be added recursively. This allows a large source base to be imported quickly into the
workspace view.
STMicroelectronics
9 of 14
R2.0.5 Patch-2 Release Notes
3.9 Watch window context handling
The way the watch window handles the context of watches has been changed for ST
Visual Develop. In R2.0.5, when a variable was added to the window it was given a
set context according to the current context when it was entered. This meant that if,
for example, the user has a number of variables called i, the watch window would
simply display “not a symbol” for all instances of i except the original one.
The new system is similar to Microsoft Visual Studio. By default, all watches are
displayed in the current debugger context, which should be sufficient for most users
most of the time. However, if the user wants to set a specific context for a Watch, they
should:
•
Display the “Context” column using the “Display Context” option on the
watch window context menu.*
•
Deselect “Current Context” to stop it tracking the current context. A marker
indicating this will appear to the left of the variable name.
•
Use the “Change Context…” dialog to set the specific context to be used.
It is possible to have multiple watches with the same name, but different contexts.
* Note that due to an unresolved bug, this will initially have size 0, dragging the right border of the
“Value” column will make it visible.
3.10 Show/hide details option on callstack window
The callstack window now provides the option to show or hide the “details”
(argument values, iptr and wptr) of each frame. Hiding these details reduces
communication between ST Visual Develop and st20run and so improves
responsiveness. The details are hidden by default, and can be toggled from the
callstack window context menu.
STMicroelectronics
10 of 14
R2.0.5 Patch-2 Release Notes
3.11 Help
Selecting Help from the toolbar will display all the product documentation in
Microsoft Compiled Help format (chm). This can then be easily browsed and
searched.
3.12 Ability to save and open trace sessions
It is now possible to save and open trace sessions from ST Visual Develop. Saving a
trace session enables you to store the contents of the current trace session to a file so
you can re-open the session at a later date.
•
To open a trace session in ST Visual Develop you must be in edit mode. Select
File>Open Trace… and a file open dialog will allow you to choose a
previously saved trace session. ST Visual Develop will then go into debug
mode and connect to an address space (core) into which the specified trace
session will be opened. The Trace and Profile Window will then be populated
with trace data from the previously saved session.
•
To save a trace session you must be in debug mode. Collect some trace data
and then select File>Save Trace and Profile As… and a file save dialog will
allow you to choose a filename to save the trace file to.
ST Visual Develop’s trace save and open functionality is built on the st20run
commands tracedump and traceload and supersedes the need to use the command
console – see ST20 Embedded Toolset User Manual, section 6.6 Saving and loading
trace records. The tracedump command is described in ST20 Embedded Toolset
Reference Manual, Chapter 21 Alphabetical list of commands, tracedump.
3.13 Ability to save and open core dumps
It is now possible to save and open core dumps from ST Visual Develop. A core dump
is a file which contains a record of the state of memory and CPU registers.
•
To open a core dump file in ST Visual Develop you must be in edit mode.
Select File>Open Core… and a file open dialog will allow you to choose a
previously saved core dump.
•
To save a core dump file you must be in debug mode. Select File>Save Core
As… and a file save dialog will allow you to choose a filename to save the
core dump to.
When a core dump is opened in ST Visual Develop all the normal debugger windows
are available to inspect the current memory and CPU state.
ST Visual Develop uses the st20run core dump command, core, to load and save core
dumps – see ST20 Embedded Toolset User Manual, section 10.3.10 Saving state in a
core dump file and ST20 Embedded Toolset Reference Manual, Chapter 21
Alphabetical list of commands, core.
A loaded core dump is a type of address space and is described in ST20 Embedded
Toolset User Manual, section 10.3.13 Address spaces.
3.14 Numerous bug fixes
A wide variety of other issues have been addressed for ST Visual Develop, improving
look-and-feel, usability and stability.
STMicroelectronics
11 of 14
R2.0.5 Patch-2 Release Notes
4 Using ST Visual Develop with an existing makefile
Typically, large applications are built using makefiles. In the ST20 Embedded Toolset
Delivery Manual, section 8.2.3 Using st20dev with existing build systems, using ST
Visual Develop (st20dev) with an existing build system is described, and some advice
is provided how to migrate makefile based projects into a native st20dev project to
gain the full benefits of the IDE.
However, total migration may take a lot of effort. Further, the current version of
st20dev is slow when handling many files and/or a very large number of build options
(as a result of resolving DDTS INSbl21364 and INSbl21128).
The following steps demonstrate how to create a new st20dev workspace from an
existing makefile. In this example, an application tree called STCM is chosen as a
representative of a complex make system, the same steps are also relevant for building
other applications.
1. Use the Windows Control Panel to set the path and environment variables that
would be needed to build from a Command Prompt.
o For STCM, create environment variables SRCBASE and SRCBATCH.
Then extend the path environment variable by adding %SRCBASE% and
%SRCBASE%\bin.
2. Start st20dev.
3. Select File>New Workspace.
4. Double-click Create from makefile and navigate to the main makefile
5. Open Project>Project Settings dialog, and click on makefile tab.
6. For STCM:
o Change Make Utility from “gmake” to "make".
o Append "depend main.lku" to Makefile "Build argument” like so:
-f $(InputFile) depend main.lku
7. Click OK.
8. Select Build>Build to start the build.
Errors and warnings can be located to by double-clicking on any diagnostics in the
Output window. Files can be opened by double-clicking in the Explorer window. If
they are edited then the dependencies will be considered when the lku is rebuilt. If the
lku and target names are specified in the workspace settings (and an appropriate board
is available), F5 will start debugging.
STMicroelectronics
12 of 14
R2.0.5 Patch-2 Release Notes
5 Post-mortem trace and TRAPHANDLER location
Post-mortem trace is described in ST20 Embedded Toolset User Manual, section 6.7
Postmortem analysis
As documented, memory needs to remain intact during a system reset for both the
TRAPHANDLER segment as well as the trace buffer. This is best achieved by locating
both in the on-chip SRAM.
However, the user may not have control of the TRAPHANDLER location (as it is
declared in a board configuration file) or there may not be sufficient space in SRAM
for it (the TRAPHANDLER segment is 1*K in size).
If the TRAPHANDLER contents is not preserved across a system reset, then the trace
buffer will not be displayed correctly, even if the trace buffer contents was preserved.
This can occur if the trace buffer is located in the INTERNAL memory segment
(SRAM) but TRAPHANDLER is located in the EXTERNAL memory segment.
This problem can be worked around by avoiding the use of the st20dev Build>Start
Debug>Postmortem Extraction selection. Instead, after the trace has been setup,
make a record of the tracebuffer settings. This is available using the ‘tracebuffer –
print’ command in the st20dev View>Command Console thus:
>tracebuffer -print
tracebuffer -size 16 -location 0x80000140 -traceoncapture
-savecount –saveiptr -wraponfull -countcpustallcycles
-nonintrusive
When the target application hangs or crashes, then terminate st20dev. Next, start
st20run in interactive line-mode (st20run –d option), use the same target but supply
the name of the symbolic dbg file instead of the lku (to avoid poking in a fresh
image). For example:
st20run -t mytarget hello.dbg -d
Then issue the same tracebuffer command as was originally used, but add the ‘–
postmortem’ option to the end:
>tracebuffer -size 16 -location 0x80000140 -traceoncapture
-savecount –saveiptr -wraponfull -countcpustallcycles
-nonintrusive -postmortem
To extract the trace buffer from the target, execute a ‘trace –download’ command. To
save the trace output to a file, execute a ‘tracedump’ command:
>trace -download
space 0 tracedownload
>tracedump postmortem ## save to file postmortem.trc
The saved tracedump file can then be viewed using st20dev File>Open Trace …
selection, see section 3.12
STMicroelectronics
13 of 14
R2.0.5 Patch-2 Release Notes
6 Trace update in Solaris/Linux (inquest GUI)
In pre-R2.0 toolsets, when using the st20run GUI (st20run –g), in Windows>Trace,
once trace had been disabled then it would be extracted from the target and displayed.
However, trace could only be sequenced on or off once using Windows>Trace
Generation Commence and Halt selections.
In R2.0, st20dev is only supported on Windows. On Solaris and Linux, the st20run
GUI is called inquest and has essentially the same in functionality as the pre-2.0
st20run GUI.
A change in inquest behaviour for R2.0 is that in Windows>Trace, the trace records
are not extracted from the target until the Refresh button is selected. However, trace
can be sequenced on and off multiple times using the commands break –traceon
and break –traceoff in the Window>Command Console, see ST20 Embedded
Toolset Reference Manual, Chapter 21 Alphabetical list of commands, break.
STMicroelectronics
14 of 14