1
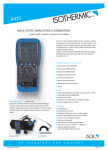
ANEMOMASTER MODEL 6113 Operation Manual 取扱説明書本文にでてくる警告事項は、ご使用いただく前に 注意深く読み、よく理解してください。 いつでもご使用いただけるように大切に保管してください。 Please use this instrument properly by reading this user’s manual and following the warning instructions. Keep this manual in a place where it can be accessed quickly. KANOMAX JAPAN INC. 2-1 Shimizu Suita Osaka Zip:565-0805 Phone: +81(6)6877-0183 Fax : +81(6)6879-2080 01001 03. 01 Thank you for purchasing Kanomax product. Please use this instrument properly by reading the operation manual and following the warning instructions. List of Components ■ Standard Items MODEL Qty Functions Main Body 6113 1 - Probe 6113-01 1 Air velocity, sensor Extension Rod 6112-03 1 To measure high places Shoulder Strap air 1 - Operation Manual - 1 - AA Manganese Batteries - 6 - temperature ■ Options Items MODEL Functions Spare Probe 6113-01 For spare Pressure Sensor 6113-07 For measurements pressure Analog Output 6113-08 Analog output terminal AC Adaptor 6113-02 Power supply RS232C Cable 6000-02 For the connection of Main Body and PC Portable Anemometer Data Logging Software S600-00 Data collection (application) software of differential Safety Precautions i Safety Precautions PLEASE READ CAREFULLY BEFORE PROCEEDING These precautions explain how to use the device correctly and safely, thereby preventing injury to yourself or to others. This section has been sub-divided into a WARNING section and a CAUTION section, according to the likelihood and nature of any potential injuries or damage inflicted. They relate to your personal safety, and also help you minimize the risk of damaging the device. Please read these sections carefully before proceeding. WARNING Always follow the basic precautions listed below to avoid the possibility of serious injury or even death from electrical shock, short-circuiting, damages, fire or other hazards. These precautions include, but are not limited to, the following: ¾ Do not install the probe in an area where flammable gas is present. Otherwise, there is an increased risk of fire or even explosion. ¾ Do not open the device or attempt to disassemble or modify it. Otherwise, there is an increased risk of electrical shock or fire. The device contains no user-serviceable parts. If it appears to be malfunctioning, have it inspected by qualified service personnel. ¾ Do not insert fingers or foreign objects into the device. Otherwise, there is an increased risk of personal injury (such as burning yourself), electrical shock, and damage to the device or fire. Please take particular care if small children are present. ¾ Do not expose the device to rain, use it near water or in damp or wet conditions or place containers on it that contain liquids which might spill into any openings. Otherwise, there is an increased risk of electrical shock, fire or personal injury. ¾ Follow the Operation Manual carefully. Otherwise, there is an increased risk of personal injury, electrical shock, fire or damage to the unit. Follow the correct procedure when setting up the device. ¾ If unusual smells, sounds or smoke emanate from the device or if liquids enter the device, switch the device off immediately and take out the batteries and/or unplug it from the power outlet. Otherwise, there is an increased risk of electrical shock, fire or damage to the device. Return the device immediately to nearest Kanomax Office or to the Service Center in Osaka, Japan. Safety Precautions ii CAUTION Always follow the basic precautions listed below to avoid the possibility of physical injury to yourself or others, or damage to the instrument or other property. These precautions include, but are not limited to, the following: ¾ Always unplug the anemometer from the electrical outlet if it will not be used to for a prolonged period time of if there is a risk of lightning. Otherwise, there is an increased risk of electrical shock, short-circuiting or fire. ¾ Always take out the batteries before storing. Otherwise, there is an increased risk of leakage. ¾ Do not leave exhausted batteries in the unit. Otherwise, there is an increased risk of leakage. ¾ Do not expose the device to excessive heat or vibrations or extreme cold or heat (such as in direct sun light or near heater). Otherwise, the main body may become disfigured or the internal components may be damaged and no longer function properly. ¾ When cleaning the device, never use benzene, paint thinners, detergents or chemical-impregnated wiping cloths. Also, do not place vinyl, plastic or rubber objects on the device. Otherwise, the device may be damaged or its main body may become discolored or disfigured. Use a soft, dry cloth to wipe the device. ¾ Do not impact the device by resting your weight on or placing heavy objects on the device; do not use excessive force on the buttons, switches or connectors. Otherwise, there is an increased risk of damage to the device or personal injury. ¾ Have the device serviced regularly. Otherwise, there is an increased risk of not maintaining the accuracy. For information about servicing charges, contact your nearest Kanomax Office or Kanomax Service Center. The device should be serviced about once a year. ¾ The sensor is very sensitive to electrostatic. Please handle with care. Table of Contents 1.ANEMOMASTER Anatomy.................................................................................. 1 1.1 1.2 1.3 1.4 Main Body......................................................................................................................... 1 Operation Panel ............................................................................................................. 3 Probe / Probe Cable................................................................................................... 4 Telescopic Articulating Extension Rod (Option).............................................. 5 2.Getting Started........................................................................................................ 6 2.1 2.2 2.3 2.4 2.5 Installing Batteries........................................................................................................ 6 Confirming the Probe Number ................................................................................ 7 Connecting Probe......................................................................................................... 7 Powering ANEMOMASTER ON / OFF............................................................. 8 How to Make Measurements .................................................................................... 9 2. 5. 1 Measuring Air Velocity..........................................................................................................9 2. 5. 2 Measuring Air Temperature ................................................................................................9 2. 5. 3 Measuring Pressure ...............................................................................................................9 3.Normal Measurement *** Measurement Mode *** ................................11 3.1 3.2 3.3 3.4 Selecting the Measuring Parameters .................................................................11 Display Hold..................................................................................................................12 Changing the Display Range on the Bar Graph ..............................................12 To Change Time Constant .....................................................................................13 4.Storing and Deleting Stored Measurement Data .....................................14 4.1 To Store Measurement Data.................................................................................14 4.2 To Delete Data.............................................................................................................15 4.2.1 Complete Deletion: Deleting All Stored Measurement Data........................ 15 4.2.2 Simple Deletion: Deleting a Single Measurement Data Last Stored......... 15 4.2.3 Selective Deletion: Deleting a Single Specific Stored Data......................... 16 5.Measuring Mean, Maximum & Minimum *** Calculation Mode *** ..........17 6.Data Output ............................................................................................................19 6.1 Printing Out ..................................................................................................................19 6.1.1 6.1.2 6.1.3 6.1.4 6.1.5 Set up the Printer Paper (Roll Paper)..................................................................... 19 Spot Value Print Out ..................................................................................................... 21 Calculation Results Print Out..................................................................................... 21 Stored Data Print Out ................................................................................................... 22 Function Set Information Print Out (Also for Test Print)............................... 22 6.2 Digital Output...............................................................................................................23 6.2.1 Preparation......................................................................................................................... 23 6.3 To Access From Your PC.......................................................................................24 6.3.1 Transmission of On-Time Data (Every-second Basis) ............................... 24 6.3.2 Transmission of Data Stored in Memory................................................................ 25 6.4 Setting the Output for Single Parameter Measurement Data .................25 6.4.1 How to Print-out using the Setting for Single Parameter Data Output.... 25 6.4.2 Digital Output using the Settings for Single Parameter Output................... 25 6.5 Analog Output (Optional) .................................................................................................... 26 7.Other Settings .......................................................................................................27 7.1 Date .................................................................................................................................27 7.2 Units and Baud Rate.................................................................................................28 7.2.1 Set-up.................................................................................................................................. 28 7.2.2 Dip Switch Set-up Chart.............................................................................................. 29 8.Cleaning the Probe...............................................................................................30 9.Specification ...........................................................................................................31 10.Principle of Measurement ..............................................................................32 11.About Compensation........................................................................................34 11.1 Influence of Measuring Temperature ...............................................................34 11.2 Influence of Pressure at Measuring Point .....................................................34 11.3 Measuring Gas Components................................................................................34 12.Probe Directivity (Air Velocity) ...................................................................35 12.1 Horizontal ...................................................................................................................35 12.2 Vertical........................................................................................................................35 13.Trouble Shooting ...............................................................................................36 13.1 13.2 13.3 13.4 13.5 13.6 Batteries.....................................................................................................................36 Initial Operations .....................................................................................................36 During Operations...................................................................................................36 Printer Output..........................................................................................................37 Digital Output ...........................................................................................................37 Analog Output ..........................................................................................................37 14.Warranty and After Service...........................................................................38 1 1. ANEMOMASTER Anatomy 1.ANEMOMASTER Anatomy 1.1 Main Body Unit:mm Extension Rod (Articulating) Cable Lid (Probe storage area) Probe Approx. 120 <Rotate> Approx. 210 Power Switch I :ON O:OFF Probe Rest (To be used only when measuring) DC Input Terminal RS232C Terminal Approx. 133 LCD Display (Approx. 107) Operation Panel Probe Connection Terminal Analog Output Terminal (Option) Pressure Sensor Port (Option) *) Caution Whenever you close the Lid, be sure to disconnect the Probe from the Probe Connection Terminal, and store on the Probe Rest. If you close the Lid while the Probe is still set on the Probe Rest, you may risk damage such as breaking the probe cable. 2 1. ANEMOMASTER Anatomy <Diagram of the Bottom> 0001 ROM Cassette Probe Number Display Window Batteries Compartment ROM Cassette Storage Area <Diagram of the Left Side> Built-in Printer Printer Paper Cutter 3 1. ANEMOMASTER Anatomy 1.2 Operation Panel The key tone is set “ON” at the time of inspection. You may turn it off by going through the manual. Please refer to page xxxx Hold/Set Key Press this key to hold/reset the displayed value on the measurement mode. You can also use this key to select and choose the item on the date/time setting mode and function setting mode, Samp. Key The displayed value will be stored when you press briefly. (All measurement parameters will be stored.) The maximum number of memory is 100. If you press for an extended length of time, the average value for the duration of that time will be stored. Sampling is done every second up to a maximum of 60 seconds. (Measurement values beyond 60 seconds will not be acknowledged.) Mode Key Press this key to change displayed parameter on the measurement mode and the calculation mode. Calc.Key Use this key to switch to the calculation mode and go through the stored data. Air Velocity (Option) Pressure Air Temperature Measurement Mode Stored Data Display Minimum Value Mean Value Maximum Value Calculation Mode Power Switch Power Source ON/OFF I :ON O :OFF Clear Key ・ When you continue to press more than a second, it deletes the last piece of data stored on the memory. ・When you are in the function setting mode: Use this key to finish setting. ・ During printing : Printing will be forced to stop. (Cannot stop printing for data that has already been transmitted to the printer.) SP.Zero Key (Option) When you continue to press for more than 2 seconds when the pressure is displayed during the measurement mode, it will adjust to zero. Feed Key Each time you press this key, the printer paper will be forwarded by 1 line. ▲Key When you press this key during the measurement mode, you can select the time constant among 1, 5, or 10 seconds. ▼Key When you press this key during the measurement mode, you can select the range of the bar graph among 1, 5, 10, 25, or 50m/s. ※In other modes, keys ▲ or ▼ can be used to select a Parameter or to move numbers up or down. Print Key When you press this during the measurement mode, the displayed value will be printed. (All measurement parameters will be printed.) As for the calculation mode, the calculation results (average, max, min) of the data stored in the memory will be printed. 4 1. ANEMOMASTER Anatomy 1.3 Probe / Probe Cable Unit:mm Approx. φ10 Wind Direction Mark Approx. 150 Temperature Sensor Approx. φ13 Temp. Compensation Sensor Approx. 33 Air Velocity Sensor Probe Number Approx. φ5 Cable Length: Approx 2000 本体側 Approx. 23 001 5 1. ANEMOMASTER Anatomy 1.4 Telescopic Articulating Extension Rod (Option) Unit:mm Approx. 167 (Max. extended length 960) Approx.φ12 Approx. 68 How to Connect ① Probe Telescopic Articulating Extension Rod ② Approx. φ15 2. 6 Getting Started 2.Getting Started 2.1 Installing Batteries <Diagram of the Bottom of the Main Body> ① Remove the lid by pressing lightly on the 2 areas (see arrows) and pulling towards you. ② Insert batteries in the order as shown. ( ※ Be sure to observe the polarity. ) This instrument requires six AA batteries. Use only AA size Manganese (R6), alkaline (LR6) or Ni-Cd batteries. Do not mix battery types, otherwise it may lead to leakage or damage to the Main Body. ※Batteries cannot be recharged by the optional AC Adapter. ③ Put the cover back on in the opposite order it was removed. Acceptable Battery Types Manganese (R6) AA Batteries Alkaline (LR6) AA Batteries Ni-Cd AA Batteries 7 2. Getting Started 2.2 Confirming the Probe Number Confirm that the number on the Probe and the number on the Main Body (indicated on the ROM cassette inserted in the bottom of the Main Body) matches. ※ You will need to confirm the Probe Number if you purchase in multiples or if you own a spare Probe. (The number on the Main Body is also displayed when you turn on the power. See Chapter 2.4, “Powering ANEMOMASTER On/Off” for details.) The characteristics data pertaining to each probe is stored in the ROM cassette inserted underneath the Main Body. Each Probe has different characteristics so you must confirm that the numbers match in order to measure properly. Do the numbers match? 0001 001 Bottom of the Main Body Probe 2.3 Connecting Probe Per the illustration below, connect the Probe by paying attention to the direction of the connector (Probe Cable sticks out from the “up” side) and attach to the Probe Terminal located on the Main Body. ※ Make sure that the power is OFF when connecting or disconnecting the Probe Cable. ※ Do not force the connector into the socket without confirming the correct direction, and do not rotate the connector after attaching as these will cause damage. ※ When you close the Lid, be sure to remove the Probe Connector otherwise it may damage the cable. Probe Cable Connector Probe Terminal 8 2. Getting Started 2.4 Powering ANEMOMASTER ON / OFF When you connect the Probe onto the Main Body and turn on the switch, the software version followed by the Probe Number will be displayed before you see the Normal Mode (Normal Measurement display). I ON (Turn the switch on) O OFF(Turn the switch off) Connect Probe to the Main Body Power Switch Power ON Software Version Display When the ROM Cassette is not properly inserted, you will get an alarm and an error message as shown above. (Refer to Chapter 13 “Trouble Shooting” for Error Codes.) Turn off the instrument and check if the ROM Cassette is properly inserted. Display Icons ( Normal Mode : Refer to Chapter 3 “Normal Measurement” for details.) ① Instructed Value or Fixed Value, ② Bar Graph, ③ Bar Graph Range, ④ Unit, ② ⑤ Battery Level Indicator Probe Number Display ⑤ ① ④ m/s ③ Normal Mode ◆ Battery Level Indicator m/s Battery level is indicated upper right. Battery consumption depends on the air velocity being measured. When this indicator starts to flash, it is time to change batteries. Caution : Measurement may suddenly stop depending on the wind velocity if the battery is low. The indicator changes as you see it below. Time to replace batteries (Flashes) ― LOCK ― When “E - - 0” is displayed, every function of the instrument will be locked. The measurement will stop and data will NOT be saved. To unlock, turn off the power and replace batteries. (Locked) 9 2. Getting Started 2.5 How to Make Measurements 2. 5. 1 Measuring Air Velocity Probe has its own directivity characteristics. Make sure that the wind direction mark is facing the wind (For more details on directivity characteristics, refer to Chapter 12 “Probe Directivity (Air Velocity)”. If you are not sure of wind direction, slowly rotate Probe and measure at the point where you get the highest air velocity reading. To make the temperature compensation more effective, make sure that the Air velocity sensor and Temperature compensation sensor of Probe are evenly exposed to the airflow. To take a measurement in temperature changing situation, leave Probe for more than 20 seconds until the display becomes stable. Wind Mark Wind 2. 5. 2 Measuring Air Temperature The faster the wind, the shorter the response time for temperature measurement. (The response time is approximately 30 seconds at the airflow of 1m/s). Take the measurement after the reading is stabilized on the display. With no airflow present, the instrument’s air temperature reading may become higher than it actually is due to the heat generated by the air velocity sensor. It is recommended to take a measurement with at least 0.1m/s of wind present for accurate reading. 2. 5. 3 Measuring Pressure Do not apply more than 75kPa of pressure to the pressure sensor (optional). This may cause serious damage to the sensor. When you make a measurement, make sure that the temperature is somewhere between 5 to 40℃ or 41 to 104OF. Before you make a pressure measurement, make sure you execute the zero adjustment. When you make the adjustment, leave the both pressure ports ((+) and (-)) open. 10 2. Getting Started <Zero Adjustment Procedure> DISPLAY PROCEDURE Press when you are in the Measurement Mode, and select pressure measurement. kPa Each time you press the MODE key, it will show in order air velocity ->air temperature -> pressure. kPa When you press for more than 2 seconds, you will hear a beep, and the pressure display will show “0.00”. <Connecting Pressure Tube> Connect the pressure tube to the (+) or (-) port as you see on the bottom. Connect/insert the other end of the tube to the measuring hole of the duct. If the pressure that you are going to measure is positive, connect the tube to (+) Port. If it is negative, connect the tube to (-) Port. ! CAUTION ! In order to make a precise measurement, the tube must have no holes and must be connected securely. Also, the tube must not be bent at any point. Positive(+)Port Negative(-)Port Pressure Port 11 3. Normal Measurement 3.Normal Measurement *** Measurement Mode *** When you first turn on the instrument this will be the first mode that you will be in (Air Velocity Measurement Mode). You cannot save any data in this mode. The display will be updated every 1 second. m/s <Air Velocity Measurement Display> 3.1 Selecting the Measuring Parameters DISPLAY PROCEDURE ① <NORMAL MODE> Press m/s in the Normal Measurement display. (See example on the left.) Press ② Air , and display mode moves in order, as shown below. Temperature → ③ Pressure ( Optional ) → ① Air Velocity(=Normal) ② <AIR TEMPERATURE MEASUREMENT MODE> ※In the Air Temperature Measurement Mode, there will be no bar ℃ graphs displayed under the measured value. ③ <PRESSURE MEASUREMENT MODE> ※In the Pressure Measurement Mode, there will be no bar graphs kPa displayed under the measured value. ※This mode is available only to instrument with optional pressure sensor. 12 3. Normal Measurement 3.2 Display Hold DISPLAY PROCEDURE While measuring, press m/s . (The same procedure applies when you are in Air Temperature Measurement Mode, and Pressure Measurement Mode.) m/s “HOLD” indicator appears on the display to indicate that the reading shown is held. Press once again to release. 3.3 Changing the Display Range on the Bar Graph Bar graphs are displayed only for air velocity measurement. DISPLAY PROCEDURE Press key when you are in the Normal Measurement Mode (Air Velocity Measurement Mode) m/s ※The initial range is 0 - 10m/s and each scale equals 2m/s. 1 Bar:0.4m/s 1 scale:2m/s m/s You will see the value on the right end of the bar graph change. The range is now between 0 – 25m/s. 1 scale now equals 5m/s. Each time you press , the value on the right end of the bar graph will change. The range will change in the following order: m/s 0~10m/s(1 scale:2m/s、1 bar:0.4m/s)<Initial Default Setting> →0~25m/s(1 scale:5m/s、1 bar:1m/s) →0~50m/s(1 scale:10m/s、1 bar:2m/s) →0~1m/s(1 scale:0.2m/s、1 bar:0.04m/s) →0~5m/s(1 scale:1m/s、1 bar:0.2m/s) →0~10m/s ※Once you turn off the power, the setting will revert to the default range(0~10m/s). 13 3. Normal Measurement 3.4 To Change Time Constant You can change the Time Constant only when measuring air velocity. The Time Constant for air temperature and pressure (option) is fixed at 1 second. DISPLAY PROCEDURE When you hit when you are in the Normal Measurement Mode (Air Velocity Measurement Mode)you will see a display (see left) which briefly flickers the set Time Constant. ※Default setting is 1 second. In the Normal Measurement Mode, you can change the Time m/s Constant by pressing You can select Time Constant from 1sec, 5sec and 10sec. 00:01 :Display moving average of 1sec. 00:05 :Display moving average of 5sec. 00:10 :Display moving average of 10sec. Time Constant ※Once you turn the switch off, the Time Constant will revert to the default setting of 1 second. *** What is Time Constant? *** Time Constant determines the time span of the moving average. When you set the Time Constant to a larger value, the indicating value will become stable. When you select the smaller (=shorter) Time Constant value, the reading will become more responsive and sensitive to the change in air velocity. This function will not be in effect in Calculation Mode and Air Flow Mode. MODE How to Take In Measured Data 0 5 10 15 00:01 (1 sec.) 5 10 15 00:05 (5 sec.) 20sec. (Measuring Time) Average of 5 sec 0 00:10 (10 sec.) 20sec. (Measuring Time) Average of 1 sec 0 5 10 15 EXPLANATION 20sec. (Measuring Time) Average of 10sec Take the data 10 times in a second and indicate its average as an instantaneous value at every 1 second. Indicate the average value of 5 seconds at every 1 second. Data shifts by 1 second. Indicate the average value of 10 seconds at every 1 second. Data shifts by 1 second. 14 4. Storing and Deleting Stored Measurement Data 4.Storing and Deleting Stored Measurement Data 4.1 To Store Measurement Data ① Storing Spot Data DISPLAY PROCEDURE Hit the key when you are in the Normal Measurement Mode. You can do the same on the displays for the Air Velocity, Air ℃ Samp ℃ Temperature, and Pressure measurement modes. As per the illustration on the left, you will see “ Samp ” , Data Number, and a bar graph flicker briefly. After this, the data for all measurement parameters (Air Velocity, Air Temperature, Pressure) will be stored as one set. (The bar graph that flickers briefly indicates the approximate accumulated amount of stored data.) The maximum number of data that can be stored is 100. Data Number Approx. amount of stored data ② Storing the Average Value … For Consecutive Data Not Exceeding 60 Seconds DISPLAY PROCEDURE Press for longer than 1 second when you are in the Normal Measurement Mode. By doing so, the average value for the data spanning the length you continued to hold will be stored as 1 Samp set of data. Sampling is done every second (you will hear a beep) and you will m/s get the average value for consecutive data not exceeding 60 seconds. Also note that while you hold onto , the “Samp”, Data Number, and bar graph will continue to be displayed. (For example, if you pressed 10 seconds, the single average value pertaining to the 10 sampled values will be stored.) ※If you held beyond 60 seconds, you will hear an alarm and the measurement will end. ※Once the measurement data is stored, it will not be lost even if the switch is turned off. In addition, data will be preserved even during battery change since the built-in back-up battery will kick in. However, please be warned that if the built-in back-up battery has worn out over time, it is possible that data may not be stored. 15 4.Storing and Deleting Stored Measurement Data 4.2 To Delete Data 4.2.1 Complete Deletion: Deleting All Stored Measurement Data DISPLAY PROCEDURE When you simultaneously press and for more than 4 seconds when you are in the Normal Measurement Mode, you m/s will see the “n-00” display (as on the left), and all stored data will be deleted. 4.2.2 Simple Deletion: Deleting a Single Measurement Data Last Stored DISPLAY PROCEDURE Press m/s for more than 1 second when you are in the Normal Measurement Mode. (This can be done for Air Velocity, Air Temperature, Pressure measurement modes.) <Measurement Mode Display> m/s The Total Number of Measurement Data Stored You will briefly see a display “n-xx” (as on the left) and the latest (newest) stored data will be deleted. (The number in “xx” indicates the total number of stored data that will remain after the deletion. “n-00” indicates there are no stored measurement data.) The only data you can delete using this method is the last (newest) data you stored. For example, it is not possible to delete anything in between, such as the 40th data from a total of 75 data. 16 4.Storing and Deleting Stored Measurement Data 4.2.3 Selective Deletion: Deleting a Single Specific Stored Data DISPLAY PROCEDURE Press m/s 4 times when you are in the Normal Measurement Mode and change over to the display of Stored Measurement Data in the Calculation Mode. (For details on Calculation Mode, refer to Chapter 5 “Measuring Mean, Maximum, Minimum”.) Data Number <Stored Measurement Data Display> Press to find the Data Number you would like to delete. Press for more the 4 seconds. (This can be done for Air Velocity, Air Temperature, Pressure measurement modes.) You will m/s hear a beep along with a display of the total number of stored measurement data. After this, the display will return to show the remaining stored data. Total Number of Stored Measurement Data To delete successively, press m/s and select the data to for more than 4 seconds to delete. You can delete. Press delete only one data a time. The selected page will be deleted and the remaining data will shift up. (See example below.) Example: There are data, 1 through 4. If you delete the 3rd data, the 4th data now becomes the 3rd data (likewise, the assigned Data Number changes to 3), and there will now remain data pertaining to pages 1 through 3. Data1 Data2 Data3 Data4 Data1 Data2 Data4 Data1 Data2 Data3 The Data Number changes 17 5. Measuring Mean, Maximum & Minimum 5.Measuring Mean, Maximum & Minimum *** Calculation Mode *** Calculation Mode will automatically calculate the maximum, minimum, mean from the stored data. If there are no stored data, you must first store the measurement data in order to compute.(Refer to Chapter 4 “ To Store and Delete Measurement Data” on how to store.) The calculation is performed on all stored measurement data. (It is not possible to select certain data and perform calculations on them.) DISPLAY PROCEDURE ① Press when you are in the Normal measurement Mode (You can do the same for Air Velocity, Air Temperature, Pressure.) Each time you press m/s , there will be displays in the following order: ② Mean Value Display (Avg) → ③ Max Value Display(Max) → ④ Minimum Value Display(Min)→⑤Stored Measurement Value Data <Normal Measurement Display> ② Display→①Normal Measurement Display Mean Value <Mean Value Display> Along with the Mean Value display, you will see the total number of stored measurement data at the bottom. Avg m/s Each time you press , it will show in order the mean values for: Air Temperature ÆPressureÆ Air Velocity. Total Number of Stored Measurement Data ③ Maximum Value Mark <Maximum Value Display> Along with the Maximum Value display, you will see the total number of stored measurement data at the bottom. Max m/s Each time you press , it will show in order the maximum values for: Air Temperature ÆPressureÆ Air Velocity ④ Minimum Value <Minimum Value Display> Along with the Minimum Value display, you will see the total number of stored measurement data at the bottom. Min m/s Each time you press , it will show in order the minimum values for: Air Temperature ÆPressureÆ Air Velocity 18 5.Measuring Mean, Maximum & Minimum DISPLAY PROCEDURE <Stored Measurement Data Display> The latest measurement data that was stored will be displayed with the Data Number and bar graph. ( The bar graph indicates the approximate location of the data stored. ) ⑤ Each time you press m/s Approximate Location measurement values for : Velocity , it will show in order the stored Air Temperature ÆPressureÆ Air Data Number In addition, when you press you can display other data pertaining to other Data Numbers. Each time you press m/s measurement values for : Velocity , it will show in order the stored Air Temperature ÆPressureÆ Air ※You can also select and delete data from this display. For details refer to Chapter 4 “Storing and Deleting Stored Measurement Data”. 19 6.Data Output 6.Data Output 6.1 Printing Out 6.1.1 Set up the Printer Paper (Roll Paper) ① Open the cover by lightly pressing on the arrows, and pulling the printer cover towards you. ② Turn on the Power Supply Switch and press . ③ Confirm the sides of the paper - front and back. (The illustration shows the back (inner) side of the roll paper facing upwards toward you.) Insert the front end of the roll paper underneath the Roller. Roller ※Install the Roll Paper with the Head Lever pulled down. Roll Paper Here is the Paper Sensor. How to Cut the Roll Paper As shown in the left illustration, cut the right side of the Roll Paper so it is longer than the left. The Roll Paper Sensor is located at the right side of the Roller, therefore, Roll Paper installation will be easier if the right side is × × ○ longer. ※Use the designated thermal paper. (Seiko Instruments TP-202L). 20 6.Data Output Head Lever ④ When you insert the tip of the Roll Paper into the Roller, the Roller will automatically rotate and crank up the paper, and the paper will come out from the top. ※ If you have problems properly setting the paper (slanted, bent, etc), pull the Head Lever up, remove the paper, and repeat steps ② to ④. Approx. 5cm ⑤ Press until the tip of the approximately 5 cm of the paper has come out of the Roller. ※ Be careful that the paper coming out of the Roller does not get fed back into the Roller. Roll Paper Holder ⑥ Install the paper into the Holder as you tighten the roll. Make sure the paper comes out of the Paper Outlet located on the Printer Cover. Close the Printer Cover to complete installation. ※Be sure to eliminate any slack on the Roll Paper as much as possible. Otherwise, the loose portion may accidentally get pulled into the Roller. Paper Tip of the Roll Paper 21 6.Data Output 6.1.2 Spot Value Print Out DISPLAY PROCEDURE Press m/s ℃ while you are in the Normal Measurement Display. It will hold the measurement value for all parameters (Air Velocity, Air Temperature, Pressure) .Those values will be printed out. Example of Print Out <Measuring Results> 2002/10/29 09:41:29 VEL(m/s)TEMP(℃)PRS(kPa) 0.06 20.8 0.13 Air Velocity Air Temperature Date of Measurement Pressure 6.1.3 Calculation Results Print Out DISPLAY PROCEDURE Avg Display the Calculation Mode ( Press Measurement Mode) and then press m/s in the Normal . The calculated values for all measurement parameters (mean, maximum, minimum) will be printed out. Example of Print Out <Calculation Results> Condition Calculation Results DATE:2002/10/29 TIME:09:41:29 DATA:063 MODE:VEL TEMP PRS MAX 7.25 m/s AVG 5.79 m/s MIN 2.66 m/s MAX 22.5 ℃ AVG 21.0 ℃ MIN 19.4 ℃ MAX 0.78 kPa AVG 0.43 kPa MIN 0.27 kPa Date of Measurement Time of Measurement Number of Stored Data Measurement Parameter Air Velocity Air Temperature Pressure 22 6.Data Output 6.1.4 Stored Data Print Out DISPLAY PROCEDURE Display the Calculation Mode ( Press Avg Measurement Mode. By pressing m/s in the Normal together with you will get the print out of the calculation values for all measurement parameters (mean, maximum, minimum) along with the stored measurement data. 6.1.5 Function Set Information Print Out (Also for Test Print) DISPLAY PROCEDURE Press keys together for more than 2 seconds. This will print out the information pertaining to the functions that were set up. ℃ ※For details on how to set up functions, refer to Chapter 7 “Other Settings”. ※This function can be used to do test print. DATE:2002/10/29 TIME:09:41:29 DATA:063 MODE:VEL TEMP PRS MAX 7.25 m/s AVG 5.79 m/s MIN 2.66 m/s MAX 22.5 ℃ AVG 21.0 ℃ MIN 19.4 ℃ MAX 0.78 kPa AVG 0.43 kPa MIN 0.27 kPa NUM 01 02 03 m/s ℃ kPa 3.89 21.8 0.33 4.41 22.0 0.41 5.01 22.4 0.32 <Information on Function Set-up> Probe Number Information on Hardware Setup (This cannot be changed) Baud Rate Buzzer ON/OFF Air Velocity Unit Air Temperature Unit Pressure Unit Analog Output Range(Air Vel) Analog Output Range(Air Temp) Analog Output Range(Pressure) Test Print 6113 ANEMOMASTER Ver.1.000 DATE:2002/10/29 TIME:15:06:49 ******************** PROBE No. 1 PROBE Type.10 SensorTime 150min -------------------HARD SW SETTING Bit PR ON Bit PRS ON -------------------SOFT SW SETTING BAUD RATE 4800 BUZZER ON Vel Unit m/s Temp Unit ℃ PRS Unit kPa ANALOG Vel 0 - 5.0 ANALOG Temp 0 – 50.0 ANALOG PRS –5.0 – 5.0 DATE DISPLAY JP ******************** TEST PRINT 0123456789-+/*() Information on Function Setup Measurement Data Calculation Results Measurement Conditions Example of Data Print Out <Calculation Results+Measurement Data> 23 6.Data Output 6.2 Digital Output RS232C Terminal 6.2.1 Preparation You can download the data stored in the ANEMOMASTER to your PC, by connecting ANEMOMASTER and your PC with the RC232C cable (Optional). <Need To Have> ●Personal Computer ●RS-232C Cable (Optional) ●Software ( Example: Windows has software for hyper terminals.) <Check the BAUD RATE> You need to coordinate the Baud rate on both Main Body and your PC. The factory setting of Main Body is as follows: Data Bit Length Parity Permission Parity Condition Stop Bit Delimiter Baud Rate 8 bits Without Odd 1 CRLF ※Depends on the set up value ※To change the BAUD RATE, please refer to Chapter 7 “ Other Settings” For setting your PC, refer to the operation manual of your PC <Connecting PC> ① ② ③ ④ Turn OFF the ANEMOMASTER Connect PC to Main Body using an RS-232C cable. Turn ON the ANEMOMASTER Make sure that the ANEMOMASTER is displaying the NORMAL Measurement Mode. RS232C Cable Wiring Diagram PC (D-Sub9 pin) Signal Pin No. NC RXD TXD NC GND NC RTS CTS NC 1 2 3 4 5 6 7 8 9 ANEMOMASTER (MODEL6113) Connection Pin No. Signal Purpose Direction 1 2 3 4 5 6 GND TXD RXD CTS RTS NC Signal Ground Transmitting Receiving Transmission Approval Transmission Request Output Input Input Output ◆ We also have measurement software available for Windows. (Sold separately.) 24 6.Data Output 6.3 To Access From Your PC To connect to ANEMOMASTER to your PC, please refer to the previous Section 6. 2 “Digital Output”. ―――Icons and its Meaning -----:Space :Return or Press Enter *:A Number Command D**** N S U P ※ All commands must be in capital letters. 6.3.1 Transmission of On-Time Data DISPLAY AD 26.8; 26.8; 27.0; 27.0; 26.9; AN DISPLAY AS VT-;01; DISPLAY AU m/s;℃;kPa (Every-second Basis) PROCEDURE Example: Air Velocity Measurement Mode and typed D**** 0.19; 0.51; 0.61; 0.24; 0.15; T**** Function Number of Downloading Data Receiving Cancelled Output of Measuring Condition (of On-time Data) Output of Measuring Units Output of Page Number and Amount of Data Output of Stored Data 73.4 73.5 76.1 77.5 76.0 <Set Number of Data Needed> Press “D**** ” (※Must type in 4 digits) After entering you will receive “AD” and the data will be displayed. Each data represents 1second of measurement. If you ask for 20 data, it takes approximately 20 seconds to display. The maximum number that can be set is 9999. If you need more, re-send the command. <Output Content> With Pressure (Option): Air Velocity; Air Temperature; Pressure Without Pressure: Air Velocity; Air Temperature;: 0000000 <To Cancel> Press “N”. You will receive “AN” and the transmission will be cancelled. PROCEDURE <To Download Measuring Conditions> Press “S ” After entering“S”, you will receive “AS” and the data will be displayed. You will see the measurement Parameter, and Time Constant that appears on the display. (See Section 3. 4 “To Change Time Constant”) <Output Content> Measuring Parameter (VT- PRS); Time Constant; VT-: Air Velocity, or Air Temperature PRS: Pressure (Optional) PROCEDURE <To Download Measuring Units> Press “U ” After entering “ U ” , you will receive “AU” and the data will be displayed. You will see the measurement unit that is currently set up. <Output Content> Velocity Unit; Temperature Unit; Pressure Unit 25 6.Data Output 6.3.2 Transmission of Data Stored in Memory DISPLAY AP P0012 DISPLAY AT 2002/10/30;14:25:46 011; 0.15; 25.5; 0.10 DISPLAY ED PROCEDURE <To Download Page Number> Press “P ” You will receive “AP”. Number of data stored pages will be downloaded. PROCEDURE <To Download Stored Data> Press “T**** ” (※Must type in 4 digits) Type in the desired page number after “T”. You will receive “AT”, and the data which is stored under that number will be displayed. ※There will be no output of calculation data (Min, Mean, Max). ※The measurement unit currently set up will be applied to the output data. <Output Content> With Pressure (Option): Data Number, Air Velocity, Air Temperature, Pressure Without Pressure: Data Number, Air Velocity, Air Temperature, 00000 PROCEDURE <Error Message> You will get this message if you enter the wrong number of pages. Re-type the command. 6.4 Setting the Output for Single Parameter Measurement Data When you turn on this function, you can output only the value that was shown in the operation. See Pag xxxx “Other Settings” for details. 6.4.1 How to Print-out using the Setting for Single Parameter Data Output Please refer to Section 6. 1 “Printing Out” on how to print out measurement data. Example of a Print Out <Measurement Results (Air Velocity)> <Calculation Results(Pressure)> 2002/10/29 MODE VEL 0.06 m/s 09:41:29 DATE:2002/10/30 TIME:07:52:55 DATA:006 MODE:PRS MAX 0.44 kPa AVG 0.33 kPa MIN 0.21 kPa 6.4.2 Digital Output using the Settings for Single Parameter Output Please refer to Section 6.2 “Digital Output” on how to digitally print out measurement data. Display <Output of Downloaded Data(Air Temperature)> <Output of Stored Data (Air Velocity)> AD 0000000; 0000000; 26.8;0000000 26.7;0000000 AT 2002/10/30;14:25:46 011; 0.15;0000000;0000000 26 6.Data Output 6.5 Analog Output (Optional) Analog Output Terminal ①Data Update Interval ………0.1 seconds ②Load Impedance ……Above 5KΩ ③Output Current ………………DC 0~1V For the analog output, you must select one setting from the table below. The measurement value that is displayed on the Normal Measurement Display will be out put. See “Other Settings” for details. Velocity (U) Temperature (T) Pressure (P) Output Range Conversion Formula 0 ~ 5 m/s 0 ~ 10 m/s 0 ~ 25 m/s 0 ~ 50 m/s 0 ~ 1000 FPM 0 ~ 2000 FPM 0 ~ 5000 FPM 0 ~ 9999 FPM -10 ~ 40 ℃ 0 ~ 50 ℃ 0 ~ 100 ℃ 14 ~ 104 oF 32 ~ 122 oF 32 ~ 212 oF -5 ~ +5 kPa -2 ~ +2 kPa U= 5×V m/s U=10×V m/s U=25×V m/s U=50×V m/s U=1000×V FPM U=2000×V FPM U=5000×V FPM U=9999×V FPM T= 50×V-10 ℃ T= 50×V ℃ T=100×V ℃ T= 90×V+14 oF T= 90×V+32 oF T=180×V+32 oF P= 10×V-5 kPa P= 4×V-2 kPa Of the output range, the low end will be set at 0V and the high end will be set at 1V. The voltage is linear. The Time Constant (0.1 second at normal) will be in effect. To change the setting of Time Constant, refer Section 3. 4 “To Change Time Constant”. Way To Take In Measured Data (Analog Output) Mode Explanation 0 0.5 1.0 1.5 2.0sec (Measuring Time) TC1 Average of 1sec. 0 2.5 5.0 7.5 10sec (Measuring Time) TC5 Average of 5sec. 0 5 10 15 20sec (Measuring Time) TC10 Average of 10sec. Take the data 10 times in a second and indicate its average as an instantaneous value at every 0.1 sec. Output the average value of 5sec. at every 0.1sec. Data shifts by 0.1sec. Output the average value of 10sec. at every 0.1sec. Data shifts by 0.1sec. 27 7.Other settings 7.Other Settings 7.1 Date DISPLAY PROCEDURE When you are in the Normal Measurement Mode, press m/s and together for more than 2 seconds. The set-up level will be displayed on the bottom left and the last 2 digits of the year will flicker. Press either keys to the desired number. Then press to adjust . ※ The Set-up Level numbers correspond to the following: Set-up Level 1 ………… Year 4 ………… Time 2 ………… Month 5 ………… Minute 3 ………… Day Next, there will be a display to set up the month. Press either keys press to adjust to the desired number. Then . Next, there will be a display to set up the day. Press either keys press to adjust to the desired number. Then . Next, there will be a display to set up the time. Press either keys press . to adjust to the desired number. Then 28 7.Other settings Next, there will be a display to set up the time. Press either keys press to adjust to the desired number, and . This will return you to the Normal Measurement Mode, and the set up will be complete. ※ If you press before you save, you will return to Main Menu and the setting will NOT be saved. 7.2 Units and Baud Rate You can set up the Baud Rate, measurement units, data output parameters, using the bit set-up (Soft Dip Switch). Once the set-up is stored, it will not be lost even if the switch is turned off because of the back-up batteries. 7.2.1 Set-up DISPLAY PROCEDURE Turn the switch OFF first. Then turn the switch back ON by holding onto . Continue to hold until you see a display like the one on the left. The “b0” (see left) indicates the Bit Number. “01” on the right indicates the Bit Status. ( See the next page Section 7.2 “Dip Switch Set-up Chart” for definitions on Bit Number and Bit Status.) Bit Number shows zero Indicates the Bit Status Using either keys, select the Bit Status. Press to save the set-up. Move onto the next bit number. (After 9 is displayed, it will display 0 (zero) ). Press m/s when you have finished setting up all Bit Numbers. This will return you to the Normal Measurement Display. 29 7.Other settings 7.2.2 Dip Switch Set-up Chart ※ = Set up at the time of ship-out Set-up Parameter Specification Display of Bit Status 4800bps b0:00 b1:00 9600bps b0:01 b1:00 19200bps b0:00 b1:01 38400bps b0:01 b1:01 Buzzer ON/OFF Setup [b2] YES b2:00 - NO b2:01 - Wind Velocity Unit Setup [b3] Air Temperature Unit Setup [b4] m/s b3:00 - FPM <1m/s = 196FPM> b3:01 - ℃ b4:00 - b4:01 - 0~5m/s b5:00 b6:00 0~10m/s b5:01 b6:00 0~25m/s b5:00 b6:01 0~50m/s b5:01 b6:01 0~1000FPM b5:00 b6:00 0~2000FPM b5:01 b6:00 0~5000FPM b5:00 b6:01 0~9999FPM b5:01 b6:01 0~50℃ b5:00 b6:00 0~100℃ b5:01 b6:00 -10~40℃ b5:00 b6:01 32~122oF b5:00 b6:00 32~212oF b5:01 b6:00 14~104oF b5:00 b6:01 -5~+5kPa b5:00 b6:00 -2~+2kPa b5:01 b6:00 All Parameters b7:00 - Single Parameter b7:01 - Japanese Format:Yr/Mo/D b8:00 b9:00 American Format:Mo/D/Yr b8:01 b9:00 European Format:D/Mo/Yr b8:00 b9:01 Baud Rate Setup [b0、b1] o F Wind Velocity Analog Output (Option) [b5] Range Setup Wind Temp. Pressure Data Output Parameter Setup [b7] Date Display Format Setup [b8、b9] <T( oF) = 1.8×T(℃)+32 > 30 8. Cleaning the Probe 8.Cleaning the Probe Dust or particles attached on the velocity sensor would alter the amount of heat diffusion, which leads to less precise reading. Also, deformation or clogging up of the protective mesh around the sensor of ANEMOMASTER would also affect the accuracy of the instrument. Users are encouraged to clean up Probe regularly for maintaining accurate measurement Procedure Clean the sensor by soaking it to water in ultrasonic cleaner for 10 to 20 seconds. Do not soak it for too long, since there is an increased risk of damaging the coating of the sensor. You can also clean the sensor with neutral detergent, when it should be washed up with water fully. !CAUTION! !)When cleaning, make sure that the power is OFF. !)Make sure that the sensor is dry before turning it ON. 31 9. Specification 9.Specification Product Name Model Measuring Object Air Vel. Measuring Range Air Temp Pressure (Resolution) ※ Air Vel. Air Temp Accuracy Pressure ※ Air Vel. Response Time Air Temp Pressure ※ Temperature Compensation (Air Velocity) ANEMOMASTER Air Velocity Meter 6113 Clean air flow (0.00~9.99m/s:0.01m/s,10.0~50.0m/s:0.1m/s) 0.10~50.0 m/s 0.0~100.0 ℃ (0.1℃) -5.00~+5.00 kPa (0.01kPa) ±(3% of reading + 0.1) m/s ±1.0 ℃ ±(3% of reading + 0.01) kPa Approx. 1 second (at 1m/s, 90% response time) Approx. 30 seconds (at 1m/s, 90% response time) Approx. 1 second ±(5% of Reading + 0.1)m/s (in the temperature range 5 to 80.0℃) Measurement Hold: Max., Min., Avg,; Time Constant (1, 5, 10 seconds); Battery Level Indicator (5 Levels), o Functions Unit selection: (Air Velocity: m/s, FPM, Temperature: ℃, F; Static Pressure※: kPa) Measurement data storage:Spot value, Mean value(max 60seconds); Max upload of 100 data. Calculation functions:Max, Min, Mean calculation; Unprocessed data display; Calendar feature; Bar graph display for air velocity value. Output Digital Output: RS-232C (Baud Rate 4800, 9600, 19200 and 38400 bps) for output to PC※ Printer Output: Calculation results, measurement data Analog Output※: DC 0~1V (select one from Air Velocity, Temperature, Pressure) Power 6 × AA Batteries (Manganese,Alkaline, Ni-Cd), AC Adaptor※: AC 100~240V (50/60Hz) Approximately 10 hours continuous (at air velocity 5m/s, 20 ℃ , with alkaline batteries, and not using printer) Main Body 5~40 ℃ Battery Life Operating Environment Probe Storage Environment Weight 0~100 ℃ 5~40 ℃ Approximately 1000 g (without batteries) Accessories Operation Manual, 6×AA Batteries, Probe Cable (2m), Extension Rod, Shoulder Strap, Printer Roll Paper Options Spare Probe, Analog Output, Pressure Sensor, RS-232C Cable, Software (for Windows), AC Adaptor ※Optional 32 10.Principle of measurement 10.Principle of Measurement Current ¾ Principle of Hot-Wire Anemometer The principle of the thermal Probe is based on Current a heated element from which heat is extracted by the colder impact flow. The temperature is kept constant via a regulating switch. The controlling Cooling Wind current is directly proportional to the velocity. -off When thermal velocity Probes are used in turbulent flows, the Sensor (Platinum Coil) Velocity m/s measured result is influenced by the flows impacting the heated body from all directions. In turbulent flows, a thermal velocity sensor indicates higher measured values than a vane Probe. This can be observed during measurements in ducts. Depending on the design of the duct, turbulent flows can occur Current even at low velocities. The amount of heat that is extracted by the colder impact flow from the sensor can be expressed by: Sensor Current Heat Diffusion Quantity [H] Sensor Ta1 Ta2 Where H: Heat diffusion quantity T: Temperature of the sensor temperature U: Air velocity a, b: Constant Ta: Air Also, heat diffusion quantity can be expressed by the formula: Ta1 < Ta2 Velocity [U] Compensation Heat Diffusion Quantity [H] H = (a + b U )(T − Ta ) ・・・・・・King ' s fomula (a + b U )(T − Ta) Velocity [U] H = RI 2 Where R is resistance and I is current (R is kept constant regardless of air velocity since the temperature in constant). 2 Therefore, RI ∝ a + b U ¾ The Temperature Compensation The air velocity sonsor is heated to and elevated temperature relative to the surrounding air by means of control electronics. The temperature compensation sensors senses the ambient, or surrounding air temperature and forces the velocity sensor to stay at a constant overheat above the ambient. The circuit foeces the voltage to be equal by means of an operational amplifier. Air flowing past the sensor tends to cool the sensor, thus driving down its resistance. The amplifier responds by immediately delivering more power to the circuit to maintain voltage equilibrium. Delivered power is converted into electrical signal to display. 33 10.Principle of measurement ¾ Measurement of Wind-Temperature The coefficient of resistance of the temperature sensor has a direct proportional relationship with the temperature. We can measure the wind temperature by adjusting the sensor’s temperature to the wind-temperature, and measuring its coefficient of resistance. Wind Temp Sensor (Platinum Resistor) Upper Electrode Macromolecule Membrane Lower Electrode Glass Foundation Theory of detecting static pressure. To measure static pressure, we use a diffusion-type semiconductor pressure sensor. The diffusion-type semiconductor pressure sensor is incorporated under the principle that the resonant frequency of a piezo-crystal decreases linearly with the pressure applied. On a thin diaphragm of silicon, there are four diffusion resistors (sensor chips) placed in a fixed distant apart. (Pic.1) When the pressure is applied from above, the diaphragm will deflect downward. When it is deflected, the sensors near center (R3 and R4) will have compressing stress and the sensors near perimeter (R1 and R2) will have tensile stress instead. (Pic.2) The diffusion coefficient of diffusion resistor change according to these two stresses. Diaphragm R3 e g a t l o V ¾ Measurement of Humidity (Hygrometer) The sensor is a pair of condenser and its electro-capacity is depended upon the amount of water contained in its hydrophilic macromolecule (humidity sensitive) membrane. The components of the sensors are glass foundation; lower electrode; macromolecule membrane and upper electrode. The upper electrode will capture the change in permittivity caused by condensation or evaporation of water vapors to the macromolecule membrane. (Electrostatic Capacity Type) There is another type of hygrometer that uses a resistor instead of a condenser. It is usually said that the Electrostatic Capacity is good for low humidity measurement and the resistor is good for high humidity measurement. d e x i F ¾ R1 R2 R3 R1 R4 R2 R4 Output R1~R4:Diffusion Resistant Pic.2 Pic.3 Detecting Circuit Pic.1 Pressure Sensor If we create a bridge among these diffusion resistors (Pic.3), it will be possible to detect voltage that is proportional to the amount of pressure applied. These sensors can be affected by the temperature, and therefore, temperature compensation circuit must be added. 34 11. About Compensation 11.About Compensation This instrument has been calibrated at normal temperature and pressure. Therefore, if you are going to measure velocity at a different temperature and pressure, the indicating value will be affected. 11.1 Influence of Measuring Temperature This instrument has been calibrated at normal temperature. Because of theoretical fundamentals of hot-wire anemometer, it can easily be effected by the ambient temperature. To prevent such influence, temperature compensation is needed. The temperature compensation sensor senses the ambient, or surrounding air temperature and forces the velocity sensor to stay at a constant overheat above the ambient. By adopting temperature compensation sensors, you can measure air velocity accurately within the range of 5~80℃ (41 ~176oF) 11.2 Influence of Pressure at Measuring Point This instrument has been calibrated at 1013hPa. Change in pressure does affect the amount of heat diffusion. Therefore, the pressure compensation, using the following equation, is needed. Um = Where: Um: Actual Velocity[m/s] 1013 × Uc Pm Uc: Indicating Value Pm: Pressure at the Measuring Point[hPa] 11.3 Measuring Gas Components This instrument has been calibrated using air. The ANEMOMASTER indicates air velocity based on the heat capacity, i.e. the heat diffusion quantity to deprive a device of in fluid. If the fluid, which is dealt with for the measurement, is different from the fluid when the instrument is calibrated, the diffusion quantity changes and the indicating air velocity, too, will be affected. In order to compensate, you first need to find the heat diffusion quantity of air to the indicating value in mixture measurement. By substituting this heat diffusion quantity to the value in the heat diffusion-velocity relation formula, you can find the actual velocity value of the mixture. 35 12.Probe directivity(air velocity) 12.Probe Directivity (Air Velocity) 12.1 Horizontal Wind Mark 90° -180° 0° -90° At Air Velocity 5m/s 12.2 Vertical 0° Wind Mark -90° 90° -180° At Air Velocity 5m/s 36 13.Trouble shooting 13.Trouble Shooting 13.1 Batteries Problem Possible Cause(s) / Solution (s) ANEMOMASTER will not turn The battery is old or defective. ON →Turn OFF the power and replace the batteries. Nothing appears on the display Batteries are installed incorrectly. even when batteries are →Turn OFF the power and place in the correct polarity. replaced. Display shows “E - - 0” The batteries are low. →Turn OFF the power and replace the batteries. Refer To (Page No.) 6 6 6 13.2 Initial Operations Problem Possible Cause(s) / Solution (s) Display shows ”E - - 9” ROM Cassette is not inserted. →If already inserted, turn OFF the power and re-insert. Display shows ”- - - -” Probe/Probe Cable not connected properly. →Turn the OFF the power and connect Probe. The measurement unit is not You may switch to the Air Velocity Measurement unit (m/s, correct. FPM), Air Temperature Measurement Unit (℃、oF). Refer To (Page No.) 7 7 28 13.3 During Operations Problem Possible Cause(s) / Solution (s) “ ‐ ‐ ‐ ‐ ” is displayed for This means the value exceeds the specified measurement measured value. range. →Use within the specified range. Probe/Probe Cable is not connected property. →Check the connection. Probe/Probe Cable may be damaged. →Contact your local Kanomax Office or service center. ANEMOMASTER is not Probe is not facing the wind. displaying the right speed. →Make sure the Wind Mark is facing the wind. Higher temperature displayed. is Theoretically, ANEMOMASTER cannot measure temperature in no-wind environment. →Measure the temperature in environment with more than 0.1m/s of wind. The response for Air Velocity Confirm the Time Constant settings. Measurement is slow. Display shows ”E - - 8” when Pressure Port(+、-)is blocked. doing Zero Adjustment →Unblock both ports for + and -. Procedure The adjustment exceeds the range specified for the Zero Adjustment. →Contact your local Kanomax Office or service center. Refer To (Page No.) 31 7 9 9 13 9 9 37 13. Trouble shooting 13.4 Printer Output Problem Cannot printout. Possible Cause(s) / Solution (s) Printer paper not installed correctly. →Open the printer cover and reinstall. Also, check for paper accidentally pulled into the printer. Out of printer paper. →Change the remaining amount on the roll when you start seeing red marks on the edges of the paper. Batteries are low. →Turn OFF the power and replace the batteries. Prints only the value shown on The set-up for data output is in the SINGLE Parameter the display. output mode. Refer To (Page No.) 19 19 6 28 ÆUse the set-up function to switch to ALL parameters output mode. Cannot cancel the printout. Display shows ”E - - 1”. Display shows ”E - - 2”. Display shows ”E - - 3”. You cannot cancel the printout. The printer paper is not set. →Check if the printer paper is properly set up in the Roller. Batteries are low. →Turn OFF the power and replace the batteries. Printer Head is overheated due to continuous use of the printer. →Temporarily stop printing out and recommence. The Printer Head Lever is up. →Pull down the lever. 19 6 19 Printer Head Lever 13.5 Digital Output Problem Cannot load the data Possible Cause(s) / Solution (s) Cable not correctly connected or using wrong cable. →You need to use the RS232C cable. Baud rate setup is incorrect. →Check the settings between the ANEMOMASTER and the computer. Transmission command is wrong. Refer To (Page No.) 23 23 24 13.6 Analog Output Problem Possible Cause(s) / Solution (s) Wrong polarity. →Correct the polarity. Refer To (Page No.) 26 38 14.Warranty and after service Mode problem. →Need to use the Normal Measurement Mode. The Air Velocity output looks Check the Time Constant setting. like a “staircase”. Output value is different Analog output setting is wrong. The output range setting is wrong. The load impedance is lower than the designated value.(Load impedance needs to be over 5kΩ). 11 13 26 26 26 14.Warranty and After Service Kanomax Limited Warranty The limited warranty set below is given by KANOMAX JAPAN, Inc. (hereafter referred to as “KJI”) with respect to the KANOMAX brand anemometer, its attachment parts including Probe and other accessories (hereafter referred to as “PRODUCT”) that you have purchased. PRODUCT you have purchased shall be the only one that the limited warranty stated herein applies to. Your PRODUCT, when delivered to you in new condition in its original container, is warranted against defects in materials or workmanship as follows: for a period of one (1) year from the date of original purchase, defective parts or a defective PRODUCT returned to KJI, as applicable, and proven to be defective upon inspection, will be exchanged for a new or comparable rebuilt parts, or a refurbished PRODUCT as determined by KJI. Warranty for such replacements shall not extend the original warranty period of the defective PRODUCT. This limited warranty covers all defects encountered in normal use of the PRODUCT, and does not apply to the following cases: (1) Use of parts or supplies other than the PRODUCT sold by KJI, which cause damage to the PRODUCT or cause abnormally frequent service calls or service problems. (2) If any PRODUCT has its serial number or date altered or removed. (3) Loss of damage to the PRODUCT due to abuse, mishandling, improper packaging by the owner, alteration, accident, electrical current fluctuations, failure to follow operating, maintenance or environmental instructions prescribed in the PRODUCT's instruction manual provided by KJI, or service performed by other than KJI. NO IMPLIED WARRANTY, INCLUDING ANY IMPLIED WARRANTY OF MERCHANTABILITY OR FITNESS FOR A PARTICULAR PURPOSE, APPLIES TO THE PRODUCT AFTER THE APPLICABLE PERIOD OF THE EXPRESS LIMITED WARRANTY STATED ABOVE, AND NO OTHER EXPRESS WARRANTY OR GUARANTY, EXCEPT AS MENTIONED ABOVE, GIVEN BY ANY PERSON OR ENTITY WITH RESPECT TO THE PRODUCT SHALL BIND KJI. KJI SHALL NOT BE LIABLE FOR LOSS OF STORAGE CHARGES, LOSS OR CORRUPTION OF DATA, OR ANY OTHER SPECIAL, INCIDENTAL OR CONSEQUENTIAL DAMAGES CAUSED BY THE USE OR MISUSE OF, OR INABILITY TO USE, THE PRODUCT, REGARDLESS OF THE LEGAL THEORY ON WHICH THE CLAIM IS BASED, AND EVEN IF KJI HAS BEEN ADVISED OF THE POSSIBILITY OF SUCH DAMAGES. IN NO EVENT SHALL RECOVERY OF ANY 14.Warranty and after service 39 KIND AGAINST KJI BE GREATER IN AMOUNT THAN THE PURCHASE PRICE OF THE PRODUCT SOLD BY KJI AND CAUSING THE ALLEGED DAMAGE. WITHOUT LIMITING THE FOREGOING, THE OWNER ASSUMES ALL RISK AND LIABILITY FOR LOSS, DAMAGE OF, OR INJURY TO THE OWNER AND THE OWNER'S PROPERTY AND TO OTHERS AND THEIR PROPERTY ARISING OUT OF USE OR MISUSE OF, OR INABILITY TO USE, THE PRODUCT NOT CAUSED DIRECTLY BY THE NEGLIGENCE OF KJI. THIS LIMITED WARRANTY SHALL NOT EXTEND TO ANYONE OTHER THAN THE ORIGINAL PURCHASER OF THE PRODUCT, OR THE PERSON FOR WHOM IT WAS PURCHASED AS A GIFT, AND STATES THE PURCHASER'S EXCLUSIVE REMEDY. After Service Whenever the PRODUCT is malfunctioning, please check with “Troubleshooting” to find possible cause first. Repair parts are retained for a minimum period of five (5) years after production cessation of the PRODUCT. This storage period of repair parts is considered as the period during which KJI can provide repair service. For more information, please contact your local distributor, or call us at KJI’s service desk from 9:00 a.m. to 5:00 p.m. JST on weekdays excluding holidays. When you make a call, please have the following information of your PRODUCT at hand: (1) PRODUCT name; (2) Model number; (3) Serial number; (4) Probe number; (5) Description of Symptom, and; (6) Date of purchase