1
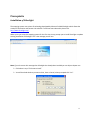
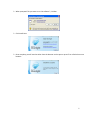
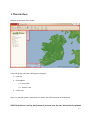
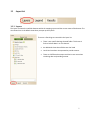
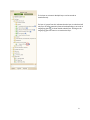
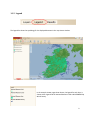
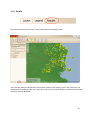
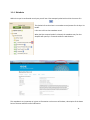
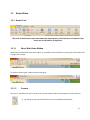
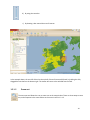
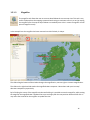
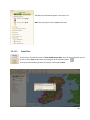
Map Viewer User Manual Heritage Mapping System Version 1, Rob O’Loughlin, Compass Informatics, 26 November 2013 1 Contents Prerequisite .................................................................................................................................................................. 4 Installation of Silverlight .......................................................................................................................................... 4 1. The interface ............................................................................................................................................................ 6 1.1 Layer List ...................................................................................................................................................... 7 1.1.1 Layers ................................................................................................................................................... 7 1.1.2 Legend .................................................................................................................................................. 9 1.1.3 Results ................................................................................................................................................ 10 1.1.4 Metadata............................................................................................................................................ 11 1.1.5 Help .................................................................................................................................................... 12 1.2 Home Ribbon ............................................................................................................................................. 13 1.2.1 Home Tools ........................................................................................................................................ 13 1.2.1.1 Show/Hide Home Ribbon ............................................................................................................ 13 1.2.1.2 Zoom in ....................................................................................................................................... 13 1.2.1.3 Zoom out ..................................................................................................................................... 14 1.2.1.4 Pan Tool....................................................................................................................................... 15 1.3.1.5 Direction Arrows ......................................................................................................................... 15 1.2.1.6 Previous and Next Extent ............................................................................................................ 15 1.2.1.7 Full Extent.................................................................................................................................... 15 1.2.1.8 Reset............................................................................................................................................ 15 1.2.1.9 Magnifier ..................................................................................................................................... 16 1.2.1.10 Identification ............................................................................................................................... 17 1.2.1.11 Print Map..................................................................................................................................... 17 1.2.1.12 Add Species ................................................................................................................................. 19 1.2.1.13 Date Filter.................................................................................................................................... 20 1.2.1.14 Send Feedback ............................................................................................................................ 21 2 1.2.1.15 1.2.2 Scale bar, Co-ordinates and Resolution ...................................................................................... 21 Analysis Tools ..................................................................................................................................... 22 1.2.2.1 Measurement Tools .................................................................................................................... 22 1.2.2.2 Add Shapefile .............................................................................................................................. 24 1.2.2.3 Search By Area ............................................................................................................................ 25 1.2.2.4 Report by Polygon ....................................................................................................................... 26 1.3 Useful Links ...................................................................................................................................................... 28 3 Prerequisite Installation of Silverlight The mapping system uses a piece of technology developed by Microsoft called Silverlight which allows the creation of interactive and content rich websites. To find out more about this please visit: http://www.silverlight.net/. When you try to access the mapping system for the first time it may prompt you to install Silverlight or update existing installation of Silverlight. This is the message you will see: Note: If you do not see this message then Silverlight has already been installed you can skip to chapter one. Click where it says “Click now to install” You will be asked whether you want to Run, Save or Cancel, when prompted click “run”. 4 When prompted “Do you want to run this software”, click Run. Click Install Now Once complete, you will need to either close the browser and re-open or press F5 to refresh the current browser. 5 1. The interface Different Components of the Viewer: In this user guide, information will be given relating to: 1. Layer List 2. Home Ribbon 2.1 Home Tools 2.2 Analysis Tools 3. Useful Links Every icon, tab and symbol is depicted in this section with a full description of functionality. NOTE: Each tool has a tool tip, which means if you hover over the icon, the function is explained. 6 1.1 Layer List 1.1.1 Layers The layers list shows the available datasets within the mapping system and the current status of the dataset. The view shown here is the default view when you open up the system. There are a few things to note within the layers list: There is one specific Heritage themed folder. This theme is further broken down in to ‘sub themes’. An additional three theme folders are also listed Land Units have been incorporated to provide context. There are 3 different base maps each has its own uses when visualising data and providing context. 7 Tick a layer to activate it. Multiple layers can be turned on simultaneously. If a layer is ‘greyed’ out this indicates that the layer is scaled and will only turn on when zoomed in/zoomed out depending on set scale. A magnifying glass is shown beside scaled layers. Clicking on the magnifying glass will zoom in to visualise the layer. 8 1.1.2 Legend The legend list shows the symbology for the displayed datasets in the map viewer window. In the example viewer page shown above, the legend for each layer is shown within legend tab for National Museum Finds and INFOMAR Ship Wreck Survey. 9 1.1.3 Results The results tab displays results from a query performed on the mapping system. In the example above the identification tool has been clicked on the mapping system, the results from the identification are displayed under the results tab. In this case, information relating to the Record of Protected Structures has been displayed. 10 1.1.4 Metadata Within the Layer list and beside most layers you will see a blue notepad symbol with an M in the centre of it: This Symbol tells us that there is a metadata record present for the layer it is beside. It also acts a link to that metadata record. When the blue notepad symbol is selected, the metadata entry for that shapefile will open up in a new tab within the web browser. This metadata is very important as it gives us information on the source of the data, a description of the data a Point of Contact and other useful information. 11 1.1.5 Help The help menu will allow access to the mapping systems in built help function. When the help button is selected, a new tab will open with various help systems. 12 1.2 Home Ribbon 1.2.1 Home Tools This suite of tools help the user move about the map and more, each tool has a tool tip and if you hover over it the function is explained. 1.2.1.1 Show/Hide Home Ribbon Most tools are located within the Home ribbon, it is possible to hide the ribbon by clicking the small arrow to the top right of the viewer. To show the ribbon again, simply click the arrow again. 1.2.1.2 Zoom in The zoom in tool allows the user to zoom in on the map window. There are three ways to use this function. a) By clicking on the map the view will zoom in by a predetermined amount 13 b) By using the zoom bar c) By drawing a box around the area of interest: In the example above, the user left clicked on the top left of Area of Interest (AOI) and, by holding the click, dragged the box down to the bottom right. The viewer will zoom to the selected extent of AOI 1.2.1.3 Zoom out The zoom out tool allows the user to zoom out on the map window. There are three ways to zoom out, and all operate in the same fashion as the zoom in tool in 1.2.1.2. 14 1.2.1.4 Pan Tool The pan tool allows the user to move the map window in any direction. To use this tool left click on the map window hold the click and move the map, when you are happy with the re-centered release the left click. 1.3.1.5 Direction Arrows The Direction Arrows offer an alternative way to navigate about the map, by clicking on any of the arrows the map view will pan in that direction. This feature is very useful when a user wishes to move about the map while in editing mode. 1.2.1.6 Previous and Next Extent The blue arrow to the left is for the previous extent and the blue arrow to the right is for the next extent. These operate in the exact same manner as the forward and back buttons in an internet browser except the back button reverts back to the previous map view. The previous extent stores up to 20 “Extent views” but maintains the current selected features within these views. 1.2.1.7 Full Extent By clicking on the globe symbol the map view will zoom out to the maximum extent of the viewer (this function is in development in version 1.1). This tool is useful if you get lost while zooming in and out, and you want to return to the opening screen. Note: When you return to the full extent the layers turned on/off do not reset themselves. 1.2.1.8 Reset By clicking on the reset symbol the map reset to the default view. All fields will be turned off and the map will zoom out to the maximum extent of the viewer. Note: If species have been added to the map (see Section 1.3.1 for details), these will not be removed. 15 1.2.1.9 Magnifier The magnifier tool allows the user to see more detail below the current map view. This tool is very useful to help explore the mapping system without having to continuous zoom in or out. By moving the magnifier over the map the layers below are revealed (note: circle in center of magnifier is focal point of magnifier zoom) In the example here the magnifier has been centered over Achill Island, Co. Mayo. The slider along the bottom of the window changes the magnification, move to right to increase magnification. The slider on the right hand side makes the magnified view transparent. Move down and up to increase/ decrease transparency respectively. By left clicking the centre of the magnifier window and holding it is possible to move the magnifier, while moving the magnifier the magnified view is updated. Once you are happy with the new position release the left click. It may take a few seconds for the magnifier to update the view. 16 1.2.1.10 Identification Clicking the identification icon and by then clicking on the map, the layers that are turned on will have results returned. The results are displayed in the results tab on the left hand side of the viewer (see 1.1.3). 1.2.1.11 Print Map The Print Map tool allows you to create a PDF document of your current viewer, ready for printing. Once the button is pressed you will be prompted to select Print Template, Resolution (Quality) and Scale, you will also be able to enter a Map Tile and Notes as you desire (see below). You will then be prompted to select a save location for the output file. 17 Once Save is clicked, the system will then generate the pdf and you will receive the following message. If you navigate to the output file location (Rob_Map.pdf in this case) you can view the readily printable map. All the features present on a normal map will be present e.g. Legend, Scale, North Arrow and Date. Note: All the layers selected on will be present in the legend. Additional information can and should be added such as a Map Title and any relevant notes. 18 1.2.1.12 Add Species This tool allows the user add Species data directly from the National Biodiversity Data Centre database. Once this tool is clicked, you will be prompted to Search for a Species. Once you find the species you are interested in, press the magnifying glass button: To add the layer to the map, press the green arrow to the left of the species name. 19 The data layer should then appear in the Layers List. Note: Only two species can be added to the map. 1.2.1.13 Date Filter The Date Filter Tool allows the user to Filter added Species data. Once the tool is selected, you will be able to select From and To dates, by clicking the small calendar symbol: To reset the selected filter go back into the Filter Tool and click Reset. 20 1.2.1.14 Send Feedback In order to constantly improve our mapping service, a feedback icon has been added to the home ribbon. Clicking on this icon will open up an email pop up to enter your feedback. 1.2.1.15 Scale bar, Co-ordinates and Resolution In terms of understanding map scale, large scale or high resolution is an indication of detail on the ground e.g. 1:5000 scale is typically considered as large scale mapping and 1:500,000 as small scale. The example resolution shown below is for the viewer zoomed out to full extent. In the bottom left corner of the map window the control shown here is visible. The top line of this control shows a scale bar, depending on where you are zoomed into this will dynamically change. Underneath the scale bar there are X and Y coordinates. This coordinates are in the Irish National projection. They automatically update while the user is moving the cursor around the map window. The Resolution refers to the detail of the map, the smaller the resolution the higher the detail. The more you zoom into the map the more detail you see; hence the resolution will become higher. In the example below the viewer has been zoomed into a large scale view 1:40,000. The OSi 1:50,000 Discovery series becomes the default view base map at scales larger than 1:50,000. 21 1.2.2 Analysis Tools 1.2.2.1 Measurement Tools The Measurement Tools are located in the Analysis tab at the top left of the Viewer. 1.2.2.1.1 Measure Distance The measure Distance tool allows user to query distance in metres, kilometres, feet, miles and nautical miles. Set the unit from the dropdown, select the Measure Distance tool, click at origin, drag to measurement point and double click to finish. The example below shows a line measurement of approximately 4 kilometres across Wexford Harbour. 22 If the user wishes to check distance between many points, simply click at each point of interest and double click when completed. The total length will be shown at the first click location. 23 1.2.2.1.2 Measure Area The Measure Area tool allows user to query area in acres, square feet, square metres, square kilometres, square miles and square nautical miles. Select the Measure Area tool, click at origin, drag to measurement point and click again, continue to click around area you wish to measure, double click to finish. The total area will appear in the centre of the polygon. The example below shows a rough polygon measurement around Wexford Harbour of approximately 29km². 1.2.2.2 Add Shapefile The Add Shapefile tool allows user to temporarily add data to the viewer. Select the Add Shapefile tool, and then navigate to the location of the shapefile you wish to see in the viewer, selecting both the .shp and .dbf file. 24 1.2.2.3 Search By Area If the user needs to search through different area within Ireland, the Search By Area tools should be used. Selecting County/Barony/Electoral Division/Townland opens a pop up as shown in the diagram below. A drop down list of all available areas associated with the search area will be given. Selecting your area of interest will zoom in to view the extent of that area. 25 1.2.2.4 Report by Polygon Report by Polygon is a reporting tool. It reports data in the form of an excel spreadsheet relating to a drawn polygon. The same procedure to measure area is used to draw a polygon. The data that is reported is on Sites and monuments Records (SMR) National Inventory of Architectural Heritage (NIAH) Record of Protected Structures (RPS) Note: SMR and NIAH are scaled for viewing (see section 1.1.1 Layers) 26 When the polygon has been completed, after the user double clicks, a pop up will appear to generate the excel spreadsheet. The excel spreadsheet will have five sheets (General, RMP, NIAH, RPS and Terms & conditions) and will look similar to this: 27 1.3 Useful Links Under the Links tab there are a range of external links that have been displayed for the users benefit. Clicking on one of the links will open it in a new tab. The links include: Heritage Council National Museum of Ireland National Monuments Service National Parks and Wildlife Service Geological Survey of Ireland Marine Institute INFOMAR MyPlan Irish Spatial Data Exchange 28