Download The 68X Enterprise LANMeter® Series:
Transcript
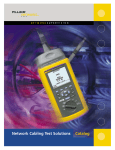
The 68X Enterprise
LANMeter Series:
®
Powerful Troubleshooting and
Personal Network Management
The first and only
portable troubleshooting tools specifically
designed to help
network managers see
across routers
to view events on
managed networks
The Fluke LANMeter series of
handheld testers now makes
testing and troubleshooting
complicated networks faster
and easier than ever before.
Modern Tools
for Modern Networks
Today’s diverse super-segmented WANs are loaded with
managed hubs, switches, and
routers, all scattered over
remote sites, making it almost
impossible to “see” where problems are originating. Unlike
protocol analyzers the Enterprise LANMeter gives managers
of these modern networks the
fast answers they need.
WAN & LAN Testing for
Ethernet and Token Ring
The 68X Enterprise LANMeter
models support token ring and
10/100 Ethernet direct connections, and permit SNMP access
to the furthest reaches of your
WAN from wherever you are.
Ease of Use
From the moment you pick it
up, you will find the LANMeter
analyzer’s front panel simple,
straightforward and fast to use.
Five dynamically labeled soft
function keys put you in control
of the intuitive menu system,
and status LED indicators reflect
the most common local segment
problems. It also contains an
extensive context sensitive
help file system.
Technical Data
68X Enterprise LANMeter —A new class
of tool to troubleshoot today’s networks.
®
SNMP
The Enterprise LANMeter is the
first portable tool to include
SNMP-based troubleshooting
capabilities, in an easy-to-use
format to reach beyond the
attached LAN segment. The
unique capability to query via
SNMP (including MIB I, II and
RMON queries) allows access
to information that already exists
in managed devices throughout
the entire network.
Remote Analysis
It is now possible to analyze the
configuration and performance
of remote WAN links and hardto-get-to switch ports.
New Device Verification
Minimize installation problems
by using the LANMeter to verify
correct operation of network
interface cards, cabling and hubs
or MAUs before they have a
chance to impact network
operation. Verify connectivity
Network Information
and access to key network
Network information is presented resources through LAN and
so that users of all skill levels can WAN connections with
quickly understand the data. It
protocol-specific ping tests.
no longer takes specially trained
Quick Problem Isolation
network engineers to interpret
the streams of packet information The unique functionality of the
LANMeter series allows you to
acquired by protocol analyzers
quickly isolate the most common
and other tools of the past.
problems that occur on an Ethernet or Token Ring network. The
Fluke LANMeter is the only
single instrument in a handheld
package capable of pinpointing
network, component and cable
problems.
Support You Can Count On
The LANMeter analyzer’s Flash
ROM Technology protects your
investment by allowing quick
and easy software updates from
your PC. If anything should go
wrong, you can count on Fluke’s
worldwide service and support
to get you up and running fast.
Network Monitor—Instant
HealthScan™ Option
Data log files created by the
Network Statistics test may be
exported in comma separated
variable (CSV) format for post
processing by a spreadsheet
application. The HealthScan
Option allows these and several
other test result files to be processed by extensive Microsoft®
Excel® macros.
HealthScan automatically
sorts, evaluates and plots
summary reports such as:
• Network bandwidth being
used by percent or frames
per second
• Top network traffic senders,
receivers and broadcasters
• Network errors; including
collisions, bad FCS, jabbers,
short frames, beacons, purges
and bursts
• Network bandwidth usage
sorted by protocol and by
station transmitting
With little additional effort,
use test results gathered during
normal monitoring and troubleshooting to create extensive
network baseline reports.
Collision Analysis
The amount and type of
collisions detected on a 10 Mbps
Network Statistics
Ethernet segment help to
Monitors the general health of a determine when a problem
network by calculating statistics exists, and where to look for it.
for key network parameters. The Collision Analysis displays all
results show Utilization, Collicollisions, including preamble
sions, Errors, and Broadcasts as
collisions and energy (ghosts) on
average, maximum, and total
the cable that uses up valuable
values, in numeric and bar graph bandwidth by preventing
formats. This test may be config- stations from transmitting—
ured to store log files of results
neither are reported by most
captured at various time interprotocol analyzers.
vals from 24 minutes to 7 days.
Log files are exported as commaseparated variable (CSV) files.
Ethernet
Token Ring
Error Statistics
Monitors the types and sources
of errors. Displays results in
numerical format and in a pie
chart which shows error
distributions by error type.
For Error Types that are preceded by the icon, highlight
the specific Error Type and
press the “Zoom In” softkey to
obtain a list of stations sourcing
those errors.
•
Network Statistics
Monitors the general health of a
network by calculating statistics
for key network parameters. The
results show Utilization and Soft
Errors in numeric and bar graph
formats, and other key frames
as average, maximum, and total
numerical values.
Error Statistics
Monitors the types and sources
of errors. Displays results in
numerical and pie chart formats.
Highlight a category and press
the “Zoom In” softkey for fault
domain address information.
2 Fluke Corporation
68X Enterprise LANMeter Series
view of network health
Token Rotation
Calculates the time for the token
to travel completely around the
ring. This test shows the last,
average, and maximum values
for token rotation time and the
number of active stations. The
LANMeter analyzer also reports
when token rotation is outside
of the normal range.
Ring Stations
Monitors the Network and compiles an ordered list of stations
inserted into the ring. The list
is in the correct physical order
around the ring, starting with
the active monitor.
Stations may be displayed
in the following address formats,
depending on which are known;
symbolic name, manufacturer
prefix, or hexadecimal MAC
address.
Use the active monitor history
screen to view a time-stamped
log of which stations have been
the active monitor. This helps
you isolate hard-to-find problems related to which station
is the active monitor.
Beaconing Rings
Push one button and in seconds
the LANMeter analyzer will
insert into a beaconing ring
and automatically identify the
fault domain. No more wading
through screens of decodes to
extract the buried fault domain
information.
A beacon alert pop-up
window is displayed when
the LANMeter analyzer detects
beacon frames on the network.
Ethernet and
Token Ring
Protocol Mix
Displays a percentage-ranked
listing of the top protocols measured by frame count on the
local segment. The LANMeter
analyzer automatically identifies
encapsulation types for IPX.
Highlight a protocol and press
the “Zoom In” softkey for a list of
the top stations transmitting that
protocol. The list of all protocols
and stations recorded for each
protocol may be printed or
viewed.
benefit from LAN switching as
well as showing where further
segmentation would be helpful.
Traffic Generation
Traffic generation is used to
stress test network components.
Adding traffic reveals media and
other physical layer problems on
networks. The traffic generator
may be run concurrently on
Ethernet networks with Network
Statistics, Error Statistics, and
Collision Analysis, and on Token
Ring networks with Network
Statistics, Error Statistics, and
Ring Stations.
User selectable parameters
include frames-per-second of
added traffic and frame size.
To assist in testing bridges and
routers the LANMeter analyzer
automatically builds IP and IPX
headers, all you need to supply
is the source and destination
address.
Top MAC
Monitors the busiest transmitting
nodes on the local network. The
LANMeter analyzer can be configured to filter on a single address and show the top senders
to a particular station. The data
is displayed in the form of a pie
chart, together with a list of the
top frame senders.
The test also distinguishes
between broadcast, multicast,
and non-broadcast frames for
Ethernet. For Token Ring, the test
distinguishes between all routes,
single routes, no route control,
and non-broadcast frames.
While the test is running, usA list of all stations recorded
ers may increase or decrease the
as transmitting and receiving
current frame rate and size onduring the test period may be
the-fly with the cursor keys. This
printed or viewed.
is particularly useful when trying
MAC Matrix
to locate sources of throughput
Monitors the busiest MAC conproblems and failure conditions.
versations on the local segment
For Token Ring networks
and displays test results by
select among three different
Source/Destination address pairs. worst-case data patterns. These
Test results include frame count
patterns are known to test for
transmitted by each address in
correlated phase jitter sensitivity
the pair combination. Use this
resulting from cabling, adapter
test to find segments that would card, and interoperability problems.
68X Enterprise LANMeter Series
Fluke Corporation 3
Powerful analysis for your most important
Protocol Support
The LANMeter analyzer has
in-depth protocol support for
your mission critical Ethernet
or Token Ring based networks:
• TCP/IP based networks
• Novell NetWare
• NetBIOS-based networks:
Windows NT, Windows 95,
Windows for Workgroups,
IBM LAN Server and OS/2
• Banyan VINES
NetWare Ping
The stations sending the most
Verifies connectivity of a Novell
traffic in each category may be
Client or Server. The target staidentified by “Zooming” on the
tion address may be chosen from desired category.
the station list or entered in
hexadecimal. The resulting IPX
address, MAC address, number
of responses and response time
is displayed.
Novell NetWare
This selection of tests diagnoses
problems on Novell networks
by verifying client and server
connectivity across IPX routers,
monitoring NetWare statistics
and routing, and keeps track
of top traffic contributors.
Server List
Displays a list of servers available from a specific network
location. It is similar to the
display servers function provided
on Novell Servers. The resulting
display shows the symbolic
name, IPX network address,
and response time. Use IPX
encapsulation choices to help
resolve configuration problems.
NetWare Statistics
Provides statistics that may
be used to evaluate the overall
health of the IPX traffic on the
local segment by monitoring file
requests and other key NetWare
frames and statistics. The stations sending the most traffic in
each category may be identified
by “Zooming” on the desired
category.
Routing Analysis
Only LANMeter helps you loadbalance your IPX routed traffic.
The display distinguishes between local-to-local, local-toremote, and remote-to-remote
traffic. Calculations are based
on frame count.
4 Fluke Corporation
68X Enterprise LANMeter Series
Top NetWare
Monitors the busiest transmitting
IPX nodes on the local segment.
The LANMeter analyzer can be
configured to monitor the top
senders to a particular station.
The data is displayed in the form
of a pie chart, together with a list
of the top frame senders. Station
addresses may be displayed
alternately as either symbolic
name, MAC address or IPX
network number by a single
keystroke.
protocols
Banyan VINES
Powerful analysis
for NetBIOS
Use “View Detail” to access
all information about the host.
This selection of tests provides
information to help troubleshoot,
load balance, and tune Banyan
VINES networks.
NetBIOS is growing as more
networks utilize Windows NT,
Windows 95 and IBM LAN
Server. The Enterprise LANMeter
Address Servers
analyzer provides unique
Displays a list of all VINES rout- troubleshooting capabilities that
ing servers and routers on the
allows you to discover problems
segment that assign the dynamic such as misconfigured NetBIOS
Banyan addresses to VINES
end-nodes, duplicate NetBIOS
clients entering the network.
names and the causes of high
NetBIOS traffic.
IP Auto Configuration
For NetBIOS over TCP/IP, automates IP configuration of the
Enterprise LANMeter analyzer.
Server Discovery
Displays all of the VINES servers
on your network. The Server
Discovery process may be controlled by adjusting a Hop Count,
which allows you to look for
servers on the same LAN as the
LANMeter, analyzer or up to some
number of router hops away.
NetBIOS Discovery
Analyses the attached NetBIOS
network cataloging critical network attributes. Automatically
identifies problems such as
duplicate names, registration
errors and default router not
responding to ARP.
Categories may be highlighted and further information
obtained by pressing the “Zoom
In” softkey.
Top VINES
Monitors the busiest transmitting
VINES nodes on the local segment. The LANMeter analyzer
can be configured to filter on a
single address and show the top
senders to a particular station.
The data is displayed in tabular
form with VINES IP address
shown together with the
corresponding MAC address.
A list of all stations recorded
as transmitting during the test
period may be printed or viewed.
NetBIOS Ping
Test network layer connectivity
by pinging a node by name.
A NetBEUI ping will be local to
the attached segment and is not
routeable. A NetBIOS ping over
IP or IPX can cross IP or IPX
routers.
Top NetBIOS
Monitors the busiest transmitting
NetBIOS nodes on the local segment. The LANMeter analyzer
can be configured to filter on a
single address and show the top
senders to a particular station.
Test results show source address,
encapsulation protocol, and
percent of NetBIOS traffic.
A list of all stations recorded
as transmitting or receiving
during the test period may
be printed or viewed.
68X Enterprise LANMeter Series
Fluke Corporation 5
Superior capabilities for TCP/IP
Fluke has substantially enhanced
support for today’s growing
TCP/IP networks. TCP/IP has
rapidly become the most important network protocol for many
enterprise-wide networks.
In the past, TCP/IP networks
were supported by a small team
of experts. Now many organizations are requiring the same
number of experts to support
and manage rapidly expanding
IP networks that span ever wider
geographic areas with more
complex switched, routed, and
often micro-segmented designs.
The Enterprise LANMeter
analyzer provides features
designed to show key IP network
configuration information that
is necessary to troubleshoot
connectivity and configuration
problems in IP networks.
TCP/IP
This selection of tests diagnoses
problems on TCP/IP networks
by verifying connectivity, and
monitoring traffic levels and
ICMP activity.
ICMP Monitor
Identifies congested devices, and
mis-configured routers and hosts
by monitoring key ICMP packets.
Monitors and displays the number of key IP events detected.
Frame types monitored include:
Destination Unreachable, Redirect, Source Quench, Time Exceeded, and Parameter Problem.
The stations sending the most
traffic in each category may be
identified by “Zooming” on the
desired category.
6 Fluke Corporation
68X Enterprise LANMeter Series
ICMP Ping
Verifies connectivity to a particular IP station. The target station
address may be chosen from the
station list or entered in dotted
decimal notation. The resulting
IP address, MAC address, number of responses and response
time is displayed.
Top IP
Monitors the busiest transmitting
IP nodes on the local segment.
The LANMeter analyzer can be
configured to filter on a single
address and show the top senders to a particular station. The
data is displayed in the form of a
pie chart, together with a list of
the top frame senders. Station
addresses may be displayed as
either symbolic name or IP addresses by a single keystroke.
A list of all stations recorded
as transmitting during the test
period may be printed or
viewed.
Trace Route
Reports each router encountered
while sending an IP packet to a
specified destination host. If a
Domain Name System (DNS)
server is configured, LANMeter
will look up the name of each
device encountered. Configur–
able parameters include source
and destination IP address,
default router/gateway address,
DNS server address, and
maximum TTL value.
Depending on the configuration of the network being tested,
Trace Route will show when
multiple routes are being used,
the route a packet is taking and
whether it reached the destination, and the last router that
forwarded the packet in situations where it does not arrive
at the destination.
IP Auto Configuration
Automates IP configuration
of the Enterprise LANMeter
analyzer. Searches for a usable
IP Matrix
IP source address, the correct
Monitors the busiest IP conversations on the local segment and subnet mask, a default IP router
and any available DNS server.
displays test results by Source/
Destination address pairs. Test
results include frame count
transmitted by each address in
the pair combination. Use this
test to determine the best placement of new switches by finding
the busiest stations and which
resources they are accessing.
Scan Host
Verifies a host’s IP configuration
by reporting the MAC address,
the subnet mask, and the IP
address of a usable default
router. If a DNS server is configured, the host name is also
reported. The test also monitors
the IP traffic to and from the
host, and also verifies connectivity by pinging the device.
The Auto Configure feature
can be used in Assisted mode
or make use of Dynamic Host
Configuration Protocol (DHCP)
or BOOTP servers.
Segment Discovery
Analyzes the attached IP
network cataloging critical IP
network attributes. Automatically
identifies problems such as
incorrect subnet masks, duplicate
IP addresses and advertised
services not available.
Segment Discovery also
searches for IP Routers, Subnet
information, DHCP and BOOTP
servers, Name Servers, SNMP
Agents and Local Hosts. Categories may be highlighted and
further information obtained by
pressing the “Zoom In” softkey.
Internet Toolkit
This test may be run as a
stand-alone test or accessed
via Hypertext links from other
Internet tests. The Internet
Toolkit contains tests that will
provide a more in-depth analysis
of a particular node.
And discover problems using
the Interface Error information.
The SNMP-based features
of the Enterprise LANMeter
analyzer using MIB and RMON
queries is unique in a handheld
product and expands the
troubleshooting capability of the
LANMeter analyzer beyond the
attached local segment.
Obtain information on
intelligent devices using
System Group query.
Multiport Statistics permit
viewing of all ports on an entire
host at once. (See SwitchWizard
Option on page 11.)
Use Interface Table to obtain
a list of interfaces on a host, and
Display Statistics for more detail
about a selected interface. (See
also WideAreaWizard Option on
page 11.)
For devices supporting RMON,
use the RMON Statistics Studies
to view utilization and error
informationl. Most new switches
offer RMON, often on a per-port
basis.
Verify routing tables using
the Route Table query.
Learn the latest MAC to IP
address associations by querying
routers and other hosts for their
ARP table. Check DNS Server
information by querying the
server for either an IP address
or for a name.
Use Ping Tests to validate
connectivity to a host.
Obtain interface utilization
information by interrogating the
device’s Interface Statistics.
68X Enterprise LANMeter Series
Fluke Corporation 7
Unique hardware tests
As part of a new breed of LAN
troubleshooters, the LANMeter
analyzer combines the most
commonly used troubleshooting
capabilities from protocol analyzers and cable scanners plus
many unique new capabilities.
Like a protocol analyzer, the
LANMeter analyzer provides
statistical information: utilization, top senders and receivers,
collision counts, soft errors, protocol distribution, and connectivity tests. The LANMeter analyzer
also implements standard cable
scanning tests, but goes one
step further in providing visibility into the network to find out
which cable, NIC or hub port is
the problem. The additional
function of Expert-T™ is unlike
anything else on the market.
NIC/Hub Tests
Network components can be
tested by selecting this function.
NIC Autotest
Tests new or suspected faulty
NIC cards for correct operation.
For Ethernet the test reports
the MAC address, protocol, and
driver voltage levels, offered auto
negotiation capabilities, 10/100/
T4, half or full duplex) and the
presence and polarity of link
pulses. If no signal is detected
from the NIC, the test will automatically scan for connector and
cable faults. For Token Ring, the
test reports the result of the lobe
test, checking for connector and
cable faults if the lobe test fails,
and reports the NIC speed, MAC
address and phantom drive levels. This test does not require a
live network connection. (Token
Ring shown.)
Expert-T™ Autotest
A unique comprehensive test
allows the LANMeter analyzer to
be connected in series between
a station and the hub or MAU.
This test automatically isolates
failures to cable, hub or MAU,
NIC, or station software with
confidence. (Ethernet shown.)
68X Enterprise LANMeter Series
These are a collection of Token
Ring tests that measure network
characteristics and poll network
devices for information.
Station Ping
Verifies connectivity to a particular station. The target station
address may be chosen from the
station list or entered in hexadecimal. If source routed bridges
are used, the route to the target
station and the maximum frame
size allowed through that path
will be displayed.
Ethernet
HUB Autotest
Tests new or suspected faulty
hub and switch ports for correct
operation by testing for the presence and polarity of link pulses,
offered auto negotiation capabilities (10/100/T4, half or full duplex) and for hub transmit levels.
Protocols detected are identified,
and IP and IPX hosts are pinged
to ensure connectivity. Cable
tests are performed when a
cable fault is suspected.
Token Ring
Lobe Test
Verifies that a lobe cable is
capable of supporting 4 Mbps
and/or 16 Mbps Traffic.
MAU Autotest
Tests new or suspected faulty
MAU port for correct operation
by attempting to insert into the
ring, reporting ring speed and
indicating the presence of network activity. Cable tests are
performed when a cable fault
is suspected.
MAU Reset
Attempts to unstick the relay
in the attached MAU port and
monitors network activity to
verify correct relay operation.
8 Fluke Corporation
Network Tests
Phase Jitter
Tests the amount of uncorrelated
phase jitter, a measure of noise,
on an operational ring.
While functioning as Active
Monitor, the LANMeter analyzer
displays an averaged jitter measurement made while frames of
all 1s or all 0s are being transmitted. The LANMeter analyzer
will give inconclusive results
when “jitter-busting” or other
retiming circuits are present on
the ring. A LOW result indicates
that there is relatively little
cumulative uncorrelated jitter
on the ring.
Adapter Status
Reports what functional role the
target station is performing, as
well as its NAUN and response
time. Use this test to discover the
location of source-routed bridges
on your network.
Remove Station
While troubleshooting, it’s easy
to remove a suspect station from
the ring by sending a Request
Station Removal frame to the
specified station.
Cable Tests
These tests measure cable
lengths and detect opens, shorts
and other miswires in network
cabling.
Cable Scan
Measures the length of the
cable, the distance to the largest
fault, and the characteristic
impedance of the cable. When
testing UTP cabling, split pairs,
opens, shorts and other
discontinuities can be found
without a termination device.
The wire map adapter can be
connected to the far end of the
cable to detect wiring problems
and smaller impedance discontinuities such as split pairs
at the far end.
For Ethernet networks, this
test may be performed on a live
coax network. For Token Ring
networks, the cable scan test
automatically detects the presence of a self-shorting IBM
connector and correctly reports
the cable length.
Wire Map
Checks for miswires and for
intermediate opens and shorts
on twisted pair cable. A pin-bypin connection list is displayed.
Cable Identifier
Used to map UTP drop and lobe
cables to individual offices from
the wiring closet. Unique Cable
Identifier Remote Units are identified and displayed in the order
detected. Up to thirteen identifiers can be connected.
Fiber Test
Measure fiber optic cables for
power loss with the DSP-FTK
Fiber Test Kit. It is used to detect
bad connections, bad splices,
broken fibers, and loss of power
from bends and fiber type mismatches.
The kit contains a fiber optic
meter for receiving signals from
850 nm, 1300 nm, 1310 nm and
1550 nm sources. An LED source
for both 850 nm and 1300 nm
is included in the kit, and allows
for testing of multimode cable,
with an optional 1310/1550 nm
laser power source for testing
singlemode cable.
Worst case frequency, NEXT
margin, and the test limit at that
frequency are displayed at the
end of test, or a listing of all
measurement results may be
viewed or printed.
NEXT
The NEXT measurement requires
the optional 100 MHz remote.
For 100 ohm twisted pair cable
the test performs a near-end
crosstalk (NEXT) test at frequencies up to 100 MHz, depending
on configuration.
Find NVP
Calculates the Nominal Velocity
of Propagation (NVP) for a cable
of known length and optionally
stores the value in a User Defined
cable type or standard cable type.
Attenuation
The attenuation measurement
requires the optional 100 MHz
remote. Attenuation is a measure
of loss of signal strength along
the cabling link, and changes
with the frequency of the signal.
For 100 ohm twisted pair cable
the test performs an attenuation
test at frequencies up to 100 MHz,
depending on configuration.
Worst case frequency, attenuCable Autotest
ation measurement, and the test
Tests length, impedance, wire
limit at that frequency are dismap, attenuation and NEXT up to played at the end of test, or a
100 MHz (depending on configu- listing of all measurement results
ration.) The specific tests run by may be viewed or printed.
Cable Autotest depend on the
network specification configured.
Cable Autotest may be used for
coax, 150 ohm STP, or 100 ohm
UTP. Testing 100 ohm twisted
pair requires the optional 100 MHz
remote adapter. If the optional
100 MHz remote adapter is used
to test 100 ohm twisted pair
cable, the results comply with
TIA/EIA-568-A, TSB-67 requireDC Continuity
ments for Level I test of Basic
For coax, use DC Continuity to
Link or Channel configurations.
verify that there are no missing
Test results may be viewed directly or stored for printing later. or incorrect terminators.
68X Enterprise LANMeter Series
Fluke Corporation 9
Setup
Manage Options
The Enterprise LANMeter
analyzer supports several
The LANMeter analyzer is preoptions which are enabled
configured with factory default
values. The setup function allows through software keys. Most
options are available to all users
the user to configure test and
setup parameters as required by for a limited period of time as
a free trial period to see if the
the network or test conditions.
option would be valuable in your
Configuration changes may be
unique environment. Option trial
stored in non-volatile memory
period status may be checked in
or used temporarily until the
this screen, and options may be
unit is turned off.
permanently enabled by entering the enable key code here.
Network Configuration
Permits the LANMeter MAC
File Manager
address to be changed. Allows
Provides management for all
Ethernet users to choose
saved files, printer type configubetween the RJ45 for 10 Mbps,
ration, SMTP E-mail parameters,
100 Mbps, or Auto speed detect,
and configuration of serial comand BNC connections as the
munication parameters.
active port. For Token Ring, the
Each saved file is identified
Ring Speed may be configured
by the test name, type of file,
to 4 Mbps, 16 Mbps or Auto
and is time and date stamped.
speed detect, and enables or
disables Beacon frame detection. Saved graphic and ASCII files
may be previewed on the display. All files may be selected
Station List
for export via E-mail, through
Allows the user to create or
the RS-232 port to a PC, or may
modify a list of up to 512 station
be printed directly to serial
addresses, and to establish a
printer (except log files which
symbolic name for MAC, IP,
cannot be printed directly).
VINES IP and IPX addresses.
All files may also be retrieved
Multiple station lists will
via a Web Browser.
support up to 4096 stations for
Virtually all screens may be
situations where the LANMeter
graphic captured to a file. Nearly
analyzer will be used at more
all tests permit complete results
than one site. Lists may also be
to be saved as ASCII formatted
imported or exported to a PC for
off-line storage and manipulation. files. ASCII and graphic files may
be previewed on the instrument
display. Data log files created
by the Net Stats test may be
exported but not previewed.
The LANMeter analyzer supports HP LaserJet, ThinkJet, and
EPSON printers for direct printing via the RS-232 port.
Web Agent
The LANMeter analyzer may
be configured as a web server,
relying on the current TCP/IP
configuration for addressing.
Web browsers may be used
to retrieve stored test results
and view the current LANMeter
screen remotely. Features available through virtually any web
browser include:
• View the current Enterprise
LANMeter display
• Retrieve test results
• Retrieve screen captures
• Retrieve station lists
• Retrieve data logs
System Information
Allows the user to view the
LANMeter software revision
level and default MAC address.
Update Software
The LANMeter analyzer’s Flash
ROM technology protects your
investment by allowing software
updates to be loaded quickly
and easily from your PC via
an RS-232 serial link.
Time and Date
The LANMeter analyzer time
stamps the beginning and end
of tests from its internal real
time clock. Time and date may
be changed using this menu
selection.
Display Configuration
Allows the user to set the Backlight Timeout and to enable or
disable the Automatic Display
Backlight feature.
Self Test
Provides access to several extensive functional verification tests
of the LANMeter analyzer.
10 Fluke Corporation
68X Enterprise LANMeter Series
WideAreaWizard
SwitchWizard Option Option
General
Specifications
This option shows what is occurring at each port of a multi-interface device. This test displays
utilization and error percentages
for up to eight ports simultaneously, while monitoring the
other ports in the background.
The user may sort the data by
port number, average utilization
or average error rates.
Dimensions:
29.2 x 17.8 x 6.7 cm
(11.9 x 7.0 x 2.65 in)
Weight: 2 kg (4.5 lbs)
Keyboard: 36 key Elastomeric
with alphanumeric and
dedicated keys.
Display: 240 x 128 pixel
bit-mapped LCD. (W x H)
12 x 6.5 cm (4.75 x 2.5 in)
LED Indicators: Nineteen light
emitting diodes
Power: Removable/rechargeable
NiCad (9 Sub-C Cells) with
average three hours operating
time. Recharges in three hours.
This option allows access to
information from WAN interfaces
selected from the Internet
Toolkit, Interface Table test.
Frame Relay
For frame relay links utilization
and error rate, and types of errors (including FECN and BECN)
present on the DTE interface is
shown. Selecting any individual
DLCI would allow the user
access to detailed information
about that connection.
Note: Continuous use of the display backlight
will reduce battery operating time by
approximately 33%.
The SwitchWizard Option will
display information for any type
of SNMP monitored port—
Ethernet, Token Ring, Serial
Links, FDDI, even very high
speed switch backplanes.
Statistics Detail
Use to see additional information
about any displayed port.
SwitchWizard will provide
detailed information on the
selected port, including utilization, error rates, and broadcast
levels. You can obtain greater
detail on the specific types of
errors by pressing the Interface
Errors softkey.
Source Details
The Source Details screen will
display the list of MAC addresses
from the port’s bridge forwarding
table, together with their associated IP address and DNS names
if available from the Segment
Discovery test.
Find Port
Enter a specific MAC or IP address and the SwitchWizard will
automatically highlight the port
where that address is located.
ISDN
In addition to providing a bar
graph display of utilization and
error rate for BRI or PRI interfaces, the test also provides
bearer information such as:
Inbound and outbound calls
attempted and accepted,
Channel number, Type and
status, and Information type.
Communication Port: RS-232C
Serial Port (DB-9)
Network Ports:
Ethernet:
HUB Connector (RJ-45)
NIC Connector (RJ-45)
BNC (ThinLAN)
Token Ring:
MAU Connector (RJ-45 and DB-9)
NIC Connector (RJ-45 and DB-9)
Operating Temperature:
10 to 30°C
Warranty: One year
(Extended warranty is available)
TDR Specifications
T1/E1
For T1/E1 interfaces, the
information presented on the
Enterprise LANMeter display will
include: Line coding and type of
Zero Code Suppression in use,
Send code, Line status, Line type,
Signal mode, Line index (In and
Out), Interface error types.
Resolution: 0.3m (1 ft)
Minimum Distance: 0m (0 ft)
measures right up to connection
point
Maximum Distance:
Dependent on cable type
BNC (ThickLAN) 600m (2000 ft)
BNC (ThinLAN) 300m (1000 ft)
STP 600m (2000 ft)
UTP 300m (1000 ft)
Measurement Accuracy
DC Resistance:
(BNC Connector): 0Ω to 200Ω
Accuracy: ± 10%
Cable Length:
0 to 30m (0 to 100 ft)
± (1% of reading +0.3m) (1 ft)
30 to 300m (100 to 1000 ft)
± (2% of reading)
68X Enterprise LANMeter Series
Fluke Corporation 11
Ordering Information
Every Fluke LANMeter® analyzer comes with a battery pack (installed),
instrument case, AC adapter/battery charger, remote wire map unit
(includes cable identifier #0), software utility disk and user manual.
Model
680 Enterprise LANMeter,® Token Ring
682 Enterprise LANMeter,® Ethernet
683 Enterprise LANMeter,® 10/100 Ethernet
685 Enterprise LANMeter,® Ethernet/Token Ring
686 Enterprise LANMeter,® 10/100 Ethernet/Token Ring
Options and Software
68X-0021 100 MHz Cable Test Option
68X-SW
SwitchWizard Option
(ordered with new instrument)
68X-SWK2 SwitchWizard Option (ordered as an
upgrade to an existing instrument)
68X-WW WideAreaWizard Option
(ordered with new instrument)
68X-WWK 2 WideAreaWizard Option (ordered as an
upgrade to an existing instrument)
N6800/T 3 LANMeter® HealthScan for Token Ring
N6800/E 3 LANMeter® HealthScan for Ethernet
N6800/ET 3 LANMeter® HealthScan for Ethernet
Token Ring
Accessories
DSP-FTK 4 Fiber Optic Test Kit
(contains DSP-FOM and FOS-850/1300)
DSP-FOM 4 Fiber Optic Meter for 850 nm, 1300 nm,
1310 nm and 1550 nm measurements
FOS-850/13004 Fiber Optic Source for 850 nm
and 1300 nm measurements
LS-1310/1550 4 Laser Source for 1310 and
1550 nm measurements
C6700 Soft Carrying Case
N6701 Battery Pack
N6703 UTP Accessory Kit
• 66 Punch-Down to RJ-45 Adapter
• 110 Punch-Down to RJ-45 Adapter
• RJ-45 Female Coupler
Fiber Test Accessories 4
• RJ-45 Clip Lead Cable
• RJ-45 to RJ-45 Patch Cable, 2m
N6704 Expert-T™ Accessory Kit
• DB-9 Male to Male STP Cable (IBM Type 1)
• IBM Data Connector to DB-9 (M) Cable, 1m
• RJ-45 to RJ-45 Patch Cable, 2m
N6705 Coax Accessory Kit
• BNC Tee
• 50Ω BNC Terminator
• BNC to Type N Adapter
• BNC to Alligator Clip Adapter
• RG-58 Coax Cable, 2m
• BNC to BNC Adapters (M-M, F-F)
C6700 Carrying Case
N6707 IBM Data Connector to RJ-45 Adapter
N6708 Cable Locator Kit 1: 6 Cable Locator Units (#s 1-6)
N6709 Cable Locator Kit 2: 6 Cable Locator Units (#s 7-12)
Extended Warranties and Service Contracts
SC1 680 5 One year extended warranty for 680
SC1 6825 One year extended warranty for 682
SC1 6835 One year extended warranty for 683
SC1 6855 One year extended warranty for 685
SC1 6865 One year extended warranty for 686
Fluke. Keeping your world
up and running.
68X-0021 100 MHz
Cable Test Option
Note 1: Almost all SNMP queries are made using standards-based MIBs. Security,
firewalls and individual vendor’s MIB implementations may affect or limit the
information available from the LANMeter analyzer.
Note 2: The cable length test accuracy is relative to the calibration of the LANMeter.
This calibration is provided by specifications of a representative cable. Variations,
not included in this specification, can occur due to changes in the cables relative
permittivity (dielectric constant). Changes in the relative permittivity are caused
by variations in wire twist rates.
1 For all 68X Enterprise LANMeter ® analyzers and for 67X LANMeter ® analyzers with
serial numbers greater than the following:
670 serial numbers greater than 6311801
672 serial numbers greater than 6296601
675 serial numbers greater than 6281701
2 For all 68X Enterprise LANMeter models.
3 Requires LANMeter firmware 5.x or higher, Microsoft Windows version 3.1 or
higher and Excel version 4.0 or higher on PC.
4 Requires LANMeter firmware 8.x or higher.
5 Does not include software upgrades.
Fluke Corporation
PO Box 9090, Everett, WA USA 98206
Fluke Europe B.V.
PO Box 1186, 5602 BD, Eindhoven, The Netherlands
For more information call:
In the U.S.A. (800) 443-5853 or Fax (425) 356-5116
In Europe/M-East (31 40) 2 678 200 or Fax (31 40) 2 678 222
In Canada (905) 890-7600 or Fax (905) 890-6866
From other countries (425) 356-5500 or Fax (425) 356-5116
Internet: [email protected]
Web access: http://www.fluke.com/nettools/
©1998 Fluke Corporation. All rights reserved. IBM and NetBIOS are registered
trademarks of International Business Machines Corporation; NetWare and IPX are
registered trademarks of Novell, Inc.; Microsoft, Excel and Windows are registered
trademarks of Microsoft Corporation; VINES is a registered trademark of Banyan;
all other product names mentioned are the trademarks of their respective owners.
Printed in U.S.A. 4/98 A0550UEN Rev B
Printed on recycled paper.


