1
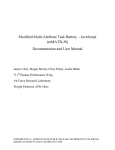
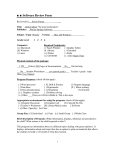
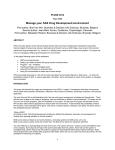
DTIWEB - USER MANUAL The objective of this document is to present the DTIWeb platform and describe the main steps that have to be followed to obtain from a DTI data set a white matter fiber map grouped into anatomical bundles. Figure 1 shows the main screen of the application. This consists of a top menu area to select the different options, a left menu to perform the main steps of the proposed technique and a main area to display the obtained results. Figure 1 - Main screen of the DTIWeb application To obtain the automatic fiber reconstruction we have to apply the four following steps: 1. Press Load Model button With this option the user accesses to the directory with the testing data sets and he has to select one of them. It is important to remind the name of the data set (it will be needed in the next step). Once a data set is selected, a progress bar appears (see Figure 2) and, then, the axial, coronal, sagittal and multiplanar reconstructions of the selected data set are rendered in the visualization area (see Figure 3 - Reconstruction of the selected data set are rendered in the visualization area). Figure 2 - Progress bar Figure 3 - Reconstruction of the selected data set are rendered in the visualization area 2. Press Load Mask button With this option, the background of the loaded data set is removed and a directory with the masks corresponding to each one of the data sets appears. Select the mask of the data set and, then, a progress bar will appear. When the process ends, the axial, coronal, sagittal and multiplanar reconstructions (without the background) of the selected data set are rendered in the visualization area (see Figure 4). Figure 4 - Visualization of the loaded data set where the background has been removed 3. Press Split and Merge button With this option the proposed approach with the default parameters is applied. These parameters can be modified using the Config Menu described in Section 7. A progress bar appears to show the evolution of the BSP computation, the Region removal and the Merge computation (see Figure 5). When the merging phase is finished, the obtained VOI decomposition with each VOI represented with a different color (see Figure 6) is visualized. At this step of the process, the user has the option of editing the obtained VOIs following the indications of Sections 10 and 11. Figure 5 - Progress bar of BSP computation Figure 6 - Visualization of the obtained VOI decomposition 4. Press Tracking Computation The last step of the process places seeds in the defined VOIs and performs tracking. By default, the method uses the 75% of planes with 4 seeds per voxel. The user can modify the tracking technique and the number of seeds following the indications of the Config menu described in Section 7. Once the parameters have been set, a progress bar (see Figure 7) appears and, then, the obtained fiber clusters are rendered in the visualization area (see Figure 8). Figure 7 - Progress bar of tracking computation Figure 8 - Visualization of obtained fiber clusters ADVANCED OPTIONS In this section we describe the advanced options supported by the DTIWeb application. For each option we present the menu and the description of the main options. 5. File menu The File menu (see Figure 9) has the next options: Open: with this option the user can access to the directory and select a data set for loading Save: the user can save the tracking results in the Fiber DTIStudio format, or the anisotropy maps in the Analyze format Snapshot: this option is used to take snapshots of the different views Exit: this option closes the DTIWeb application Figure 9 - File menu 6. Scene menu The Scene menu (see Figure 10) has options to load or save ROIs or VOIs, Fibers or Masks. ROIS: this option is used to load the file of ROIs or to save the ROIs that are shown in the main visualization area Fibers: this option can load fiber trackings or save fiber trackings Load mask: this option can load a binary file to remove the background of the loaded image Figure 10 - Scene menu 7. Config menu The Config menu (see Figure 11) has options to set the parameters of tracking, Binary Space Partition (BSP), merge and seeding algorithms. For each option we present the different parameters that can be modified (see Figures 12, 13 and 14). Figure 11 - Config menu Seeds per voxel when the seeding strategy is not the presented in the Neuroinfomatics paper Value of FA to put seeds to start fiber tracks [0.0-1.0] Number of voxels between two adjacent seeds [>0] Minimum number of steps considered to draw a fiber Parameters used as stop criterion Stopping value of the anisotropy index selected as stop criterion [0.0-1.0] Stopping value of angle [0º-360º degrees] Figure 12 - Tracking configuration window Assign a new random seed Seeding strategy used All brain: whole brain seeding All ROIS: seeds are placed in all voxels of each ROI First ROI: seeds are only placed in the first ROI of each group of ROIs Special: it follows the strategy presented in the Neuroinformatics paper Algorithm used for VOI detection Value of stop criterion [0..1 for MIR and an integer for the number of regions] Index used as stop criterion: MIR or number of regions Region where the VOI detection algorithm is applied First data set used for VOI detection Second data set used for VOI detection Number of final VOIs, the process could stop before if no more regions can be obtained At the end of the BSP process, regions with FA less than the selected value are removed At the end of the merge process, regions with FA less than selected value are removed Save the intermedium results using the Analyze format Figure 13 - Partition configuration window Percentage of seeding planes for each VOI Seeds per voxel for the special seeding method presented in the Neuroinformatics paper (see Figure 12) Figure 14 - Seeding parameters window 8. Help menu This menu (see Figure 15) has three options: Reset: to reset and refresh the main visualization area Help: to open the user manual About: a little explanation about us Figure 15 - Help menu options 9. Tab Visualization From this tab panel (see Figure 16) we can modify the visualization options. Bounding box visualization Seeds visualization Activate 1D visualization Anisotropy measure Activate 3D visualization Fiber tracking algorithm Fiber primitive drawing type Start fiber tracking computation Activate view planes Transparency level for 1D visualization Figure 16 - Detail of the visualization tab panel 10. Tab ROI This panel (see Figure 17) provides all the operations needed to manipulate ROIs or VOIs. Type of ROI Execute the BSP + Merge algorithm for automatic VOI detection Delete the last ROI manually drawn Save a manually drawn ROI Save a group of ROIs List of all the groups of ROIs Open window for manual ROI edition (see 11) Change the selected color of the group of ROIs List of textures for fiber tubes Visualize or not the fibers, tubes or ROIs of a selected group of ROIs Boolean operations between ROIs of the group Refresh boolean operations of the group of ROIs Delete all ROIs and fibers Visualize or not all ROIs Delete the selected group of ROIs Visualize or not all fibers Name of the selected group Save the name of the selected group List of ROIs of the selected group Delete the selected ROI of the group Concatenate the selected ROI to the selected ROI group List of destination of groups of ROIs to change a ROI Change the selected ROI of the group to the selected destination group Statistical data about ROI groups and fibers trackings Figure 17 - Detail of the ROI tab panel 11. Manual editing ROIS From this window (see Figure 18), the user can edit the voxels of each group of ROIs and can apply boolean operations between them, such as, union, erasure or intersection. Remove voxels from the group of ROIs by manual drawing with the mouse Add voxels to the group of ROIs by manual drawing with the mouse Visualize or not fiber tubes Visualize or not fibers Number of fibers and voxels for a group of ROIs Number of fibers Name of the group of ROIs Visualize or not the group of ROIs Selected group of ROIs for boolean operations Figure 18 - Manual editing ROIs window 12. Statistics This window provides information of the obtained VOIs or fibers and represents it in a tabular mode or as a graph (see Figure 19). The user can print, export or make a snapshot of the obtained results. Figure 19 - Example of statistical results For more details or information about the application please contact with Ferran Prados at [email protected]