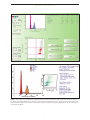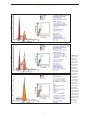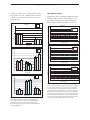
1
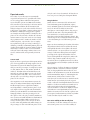
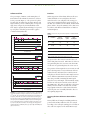
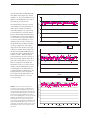
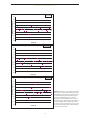
Guava® PCA-96™ Cell Cycle
A S S A Y
®
P R O T O C O L
Table of Contents
Objective _________________________________________1
Introduction ______________________________________1
Equipment and Materials Required ____________________2
Handling and Storage_______________________________2
Before You Begin ___________________________________2
Sample and Reagent Preparation _____________________2
Preparation of Working and Cell Staining Solution________3
Preparation Preparations ____________________________3
Cell Fixaction ______________________________________4
Cell Staining Protocol in 96 Well Format ________________4
Data Acquisition ___________________________________5
Data Analysis Using CytoSoft _________________________5
Data Analysis Using ModFit __________________________5
Analysis Using MultiCycle ____________________________6
Expected Results ___________________________________7
Troubleshooting Tips ______________________________14
Trademarks and Patents ____________________________14
A S S A Y
P R O T O C O L
Guava Technologies
Guava® PCA-96™ Cell Cycle
Authors: Jestine Ho, Katherine Gillis, Dianne Fishwild
Objective
The objective of this assay protocol is to guide the user from cell cycle sample preparation through data analysis to
obtain relative G0/G1, S, and G2/M cell cycle phase percentages for samples collected using the Guava PCA-96 System. Jurkat (human T cell leukemia) suspension and PC3 (human prostate cancer cell) adherent cell lines were
analyzed using the protocol below and the results are presented in the section, "Expected Results."
Introduction
PCA-96 using CytoSoft™ software. Data are displayed
in a single parameter histogram. Up to four markers
may be set to analyze the various populations. Statistics for each population within the histogram in
CytoSoft include a percentage of total, plus the PM1
mean, median and %CV fluorescence intensity. If
desired, a third party “curve-fitting” software package
such as ModFit™ or MultiCycle can apply more
sophisticated analysis model algorithms to identify
the three phases of the cell cycle and to calculate the
relevant statistics. However, CytoSoft also can be
used to identify the populations and to estimate the
number of cells within each phase. While CytoSoft
does not employ any sophisticated “pulse-processing”
technology to eliminate potentially contaminating
G0/G1 phase cell doublets from within the apparent
G2/M population, these particular aggregates can be
excluded from the G2/M peak using curve fitting
software such as ModFit or MultiCycle. The Guava
Cell Cycle data for all samples within a data set are
saved to an FCS 3.0 file, and optionally to individual
FCS 2.0 files. The data can be analyzed immediately
after the sample is acquired or recalled later. In addition to the saved FCS data file, all results and the
acquisition information are exported to a comma
separated values (CSV) spreadsheet file.
The cell cycle describes the process of the replication
and division of chromosomes within the nucleus,
which occurs prior to a cell dividing. Cancerous cells
develop when the normal mechanisms for regulating
cell cycle are disrupted. It is important to identify the
genetic basis for this disruption and to develop therapies to preferentially target those cells with
abnormalities. One of the ways to screen for potentially therapeutic drugs, or the effects of specific
genes on cell cycle, is to measure changes in cell cycle
kinetics under varying conditions.
For cells to divide they must first duplicate their
nuclear DNA. By labeling cellular DNA with propidium iodide (PI) it is possible to discriminate cells in
different stages of the cell cycle. Resting cells
(G0/G1phases) contain two copies of each chromosome. As cells progress toward mitosis, they
synthesize DNA (S phase), allowing more PI intercalation with a resulting increase in fluorescence
intensity. When all chromosomes have replicated
and the DNA content has doubled (G2/M phases),
the cells fluoresce with twice the intensity of the
G0/G1 population. The G2/M cells eventually divide
into two cells. Cells can be fixed, permeabilized and
stained with PI according to the protocol below. Data
from the stained cells are acquired on the Guava
1
A S S A Y
P R O T O C O L
Biological and chemical reagents
Equipment and materials required
■ Cell Sample
Equipment and consumables
■ Appropriate cell culture media (including serum)
■ Guava PCA-96™ with Cell Cycle Option
■ Phosphate buffered saline 1X, (1XPBS), pH 7.4
■ Guava CytoSoft version 2.5 with the Guava Cell
■ Triton X-100 detergent (Sigma, X100)
Cycle software module
■ DNase-free RNase (Sigma, R6513)
■ ModFit LT™, MultiCycle or comparable software
■ Propidium iodide at 1mg/ml in H2O (v/v) (Molec-
(optional, for cell cycle analysis using various software
ular Probes, P-3566)
■ Distilled water
algorithms)
■ Bleach
■ Centrifuge
■ Guava ICFTM Instrument Cleaning Fluid, Cat. No.
■ Vortex mixer
4200-0140
■ Refrigerator
■ Ice cold 70% Ethanol
■ 37ºC CO2 incubator
■ Guava PCA-96 ViaCount Flex reagent, Cat. No.
■ -20ºC freezer
4700-0060 (optional)
■ Guava Check Kit, Cat. No. 4500-0020
■ Ice
■ Tissue culture flasks
■ Pipettes
Handling and storage
■ Pipettor
1.
Store the Triton X-100 at room temperature.
■ Micropipette tips (200 and 20µL)
2.
Store propidium iodide and PBS at 2-8ºC.
■ Micropipettors, single and multi-channel (200 and
3.
Protect the propidium iodide reagent from light
at all times.
■ 50mL conical tubes
4.
Store RNase in –20ºC freezer.
■ 12x75mm polystyrene tubes
NOTE: Refer to specific manufacturer’s documentation for details on each specific product.
20µL)
■ 1.5mL microcentrifuge tubes with lids
■ 96 well round bottom plate (BD Falcon #353075,
#353915)
Before you begin
■ 96 flat bottom plate (BD Falcon 353910 or 353918)
Please review this Assay Protocol in its entirety, prior
to cell cycle data collection and analysis.
■ V-shaped 25 ml and/or 55 mL trough (25ml,
Apogent Discoveries #8093 and 55 mL VWR
210070-970)
Sample and reagent preparation
■ Sterile, serological pipets
Time considerations. Staining cycling cells using the
recommended protocol usually can be completed
within 1 hour. However, prior to the staining, cell
fixation requires at least twelve additional hours.
Finally, data acquisition of an entire 96 well plate on
the Guava PCA-96 may take several hours but the
actual elapsed time depends on the cell concentration
and the number of events to be acquired, as well as
the number of washing and mixing steps. Acquisition
of a typical 96-well plate with a cell concentration of
■ Stirrer bar
■ Corning filtration unit, 0.45 micron pore size,
250 mL (Corning Cat. No. 431096)
■ Lab shaker
■ Microplate sealers
■ Analytical balance
■ Disposable gloves
■ Plate shaker
2
A S S A Y
P R O T O C O L
500 cells/µL and acquisition of 5000 events takes
about 3.5 hours. 2500 events is also sufficient for a
representative analysis and the time for acquisition is
less than 2 hours.
b. Add 95.5 mL of 0.1% Triton X-100 in 1X
PBS to the sterile 100 mL bottle.
Recommended staining conditions. A typical assay
d. Add 2.5 mL of 1 mg/mL Propidium Iodide
Stock to the sterile bottle.
c. Add 2 mL of 10mg/mL stock DNAse-free
RNAse to the bottle.
test uses 0.2mL of cell staining solution (see below)
to stain 1 x 10⁵ to 2 x 10⁵ fixed cells per well in a 96
well microplate.
e. Cap the bottle and mix the Cell Cycle Staining Reagent by inverting it up and down
several times.
Preparation of working and cell staining solution
1.
Preparing 10% Triton X-100 in 1X PBS
Storage and handling for the cell staining
reagent solution
a. Add 9 mL of 1X PBS to a 15 mL Falcon tube.
1.
b. Using a 1 mL pipettor, slowly pipette 1 mL of
Triton X-100 from the bottle, wipe the tip of
the pipette and add the detergent to the Falcon tube containing the 1X PBS.
2.
to one month.
NOTE: Propidium iodide may be carcinogenic and/or
mutagenic. Exercise standard precautions when
obtaining, handling, and disposing of potentially carcinogenic and mutagenic reagents.
c. Mix the tube by pipetting up and down several times or vortexing until you get a
homogenous mixture.
d. Store the 10% Triton X-100 at room temperature or 4ºC.
2.
Cell preparations
Preparing 10 mg/mL of DNAse-free RNase in
water
1.
a. Using an analytical balance, weight out 25
mg of DNAse-free RNAse.
a. Prior to adding cells to the microplate, determine the cell concentration of the stock
using Guava PCA-96 ViaCount Flex reagent.
Please see the package inserts for instructions
in how to use those products to determine
cell concentrations.
b. Add 1 x 10⁵ to 2 x 10⁵ cells in a 200 µL volume (between 5 x 10⁵ cells/mL and 1 x 10⁶
c. Add 2.5 mL of deionized water to the tube.
d. Vortex the tube until the RNAse is completely dissolved.
Making up 0.1% Triton X-100
a. Add 118.8 mL of 1X PBS to a 200 mL container.
b. Add 1.2 mL of 10% Triton X-100 Working
Stock to the container.
cells/mL) to each well of a microplate with or
without experimental treatments. If adding
inducing agents after addition of cells to the
microplate, make stocks and add 20 µL of
inducing reagent to the appropriate wells.
c. Using a stirrer bar, mix the solution until it is
homogenous.
d. Filter the 0.1% Triton X-100 in 1X PBS using
the Corning Filtration Unit.
4.
Assaying non-adherent samples grown in 96well microplate.
b. Add the RNase to a 15 mL conical tube.
3.
Avoid exposure of the Cell Cycle staining reagent
to light.
Store Cell Cycle Staining reagent at 4-8ºC for up
c. Culture cells, if necessary, as per. your own
protocols.
Preparing Cell Cycle Staining Reagent
a. Cover a sterilized 100 mL bottle with
aluminum foil to shield the reagent away
from light.
d. Proceed to Cell Fixation in a 96-well plate
protocol.
3
A S S A Y
2.
P R O T O C O L
not already in a round-bottom plate.
Assaying samples that have been grown in tissue
culture vessels other than 96-well microplate
For adherent cells
b. Centrifuge the cells at 450 x g for 5 minutes
with the brake on low and at room temperature.
a. Transfer the cells from the culture vessels to
tubes.
c. Remove and discard the supernatant being
careful not to touch the pellet.
b. Determine the concentration of the cell sample using Guava PCA-96 ViaCount Flex
reagent. If necessary, adjhust the cell sample
to betewen 5 x 10⁵ to 1x10⁶ cells/mL, and
with a multi-channel micropipettor, add 200
mL cell sample to the well of a round bottom
plate. Proceed to the protocol for Cell Fixation in a 96-well plate or refer to Cell
Fixation in Tube to fix the cells.
d. Add 200 µL of 1X PBS to each well using a
multi-channel pipettor.
c. Rinse the flask once with 5-10 mL of 1X PBS.
Add the PBS into the same conical tube above.
h. Place the round bottom plate containing the
pellet cells with residual PBS on a lab shaker.
d. Dilute the Guava® CDR 1:3 with 1X PBS.
i. Add 200 µL of 70% ice cold ethanol dropwise into the wells while shaking at low speed
(speed 3).
e. Mix the cells in the well by pipetting up-anddown several times.
f. Centrifuge the cells in the round bottom
plate at 450 x g for 5 minutes with the brake
on low and at room temperature.
g. Remove and discard the supernatant.
e. For a T-75 flask, add 3 mL of diluted Guava®
CDR and incubate for 3-5 minutes in a 37ºC
incubator.
j. Seal the plate with a microplate sealer and
refrigerate cells for at least 12 hours prior to
staining. Fixed cells are stable for several weeks
at 4ºC and for two to three months at -20ºC.
f. Add 7 mL of media and pipet repeatedly to
release cells from the flask bottom.
g. Pipet the Guava® CDR and media into the
same tube.
i. Proceed to Cell Staining Protocol.
2.
h. Mix the cell sample by vortexing or pipetting
repeatedly to ensure a homogenous suspension.
a. Centrifuge the tube at 450 x g for 5 minutes
with the brake on low.
i. Determine the concentration of the using
Guava PCA-96 ViaCount Flex reagent. If necessary, adjust the cell sample to between 5 x
105 and 1 x 10⁶ cells/mL, and with a multichannel micropipettor, add 200 µL cell
sample to the well of a Round Bottom plate.
Proceed to Cell Fixation in a 96-well plate
Protocol or refer to Cell Fixation in Tube to
fix the cells.
b. Remove and discard the supernatant.
c. Add the same volume of 1X PBS to each tube
as was in the original culture (or to get
approximately 1 x 10⁶ cells/mL).
d. Mix the cell sample by vortexing or pipetting
repeatedly to ensure a homogenous suspension.
e. Centrifuge the tube at 450 x g for 5 minutes
with the brake on low.
f. Remove and discard the supernatant leaving
approximately 500 µL of 1X PBS.
Cell fixation
Cell fixation in 96 well plate
g. Resuspend the cells in the residual 1X PBS and
transfer the suspension drop-wise while vortexing on medium speed (setting at 5) into a 50
mL conical tube containing enough 70%
ethanol to make the final concnentration
approximately 106 cells/mL
a. Transfer the cell sample from the flat-bottom
plate to a round-bottom plate if the cells are
h. Refrigerate the cell preparation for at least 12
hours prior to staining. Fixed cells are stable
NOTE: It is important to achieve a single cell suspension prior to fixation. It is strongly advised that users
perform cell fixation in round bottom plates so as to
not lose cells with washing.
1.
Cell fixation in tube
4
A S S A Y
P R O T O C O L
detailed protocols describing data analysis using
Cytosoft.
for several weeks at 4ºC and for two to three
months at -20ºC.
i. Proceed to Cell Staining Protocol (in 96 well
format).
Data analysis using ModFit
1.
Open the ModFit software application.
Cell staining protocol (in 96 well format)
2.
Log in as an advanced user.
1.
Warm Cell Cycle staining reagent to room temperature; shield from excessive light exposure.
Warm 1X PBS to room temperature.
3.
Open a file by clicking the Open File box to the
left of the shortcut bar or by using the pull down
menu under File.
2.
Transfer the samples into the wells of a 96 well
round bottom plate if the samples have not yet
been transferred.
4.
Choose the cell cycle file you want to analyze.
5.
Choose FL2-PM2Max from the Choose Parameter for Analysis dialog and click OK.
6.
Under the Define Gate dialog click checkbox
next to the Gate 1 On and click Define Gate 1.
7.
Select P1: FS-P-FSCMax for the X Parameter and
P5: FL2-P-PM2Max for the Y Parameter and
click OK.
8.
Position gate to include events of interest and
click OK.
9.
Click OK in Define Gate dialog.
3.
Centrifuge the 96 well round bottom plate containing the samples at 450 x g for 5 minutes with
the brake on low and at room temperature.
4.
Remove and discard the supernatant being careful not to touch the pellet. After centrifugation,
the well should contain a visible pellet or a white
film on the bottom of the plate.
5.
6.
7.
Using a Multi-channel pipettor, add 200 µL of
1X PBS to each well and mix the wells by pipetting up and down several times. Let the plate
stand at room temperature for one minute.
10. Click Choose Model (Mod) button from the tool
bar or using the pull down menu under Analysis.
11. Set Properties for Manual Analysis.
Centrifuge the 96 well round bottom plate at
450 x g for 5 minutes with the brake on low and
at room temperature.
NOTE: Guava recommends Enabling the Auto Debris
and AutoAggregates features, as well as setting the
linearity to 1.8.
Remove and discard the supernatant being careful not to touch the pellet.
8.
Add 200 µL of Cell Cycle Staining Reagent to
each well.
9.
Mix by pipetting up and down several times.
12. Click OK when complete.
13. The software will automatically look for the G1
& G2 peaks and display results. If the peak
assignment requires manual adjustment, select
the peak label or either side of the cursor and
move the peak position until it is in the appropriate location.
10. Incubate the 96 well round bottom plate at
room temperature shielding away from light for
30 minutes.
11. Acquire the sample on the Guava PCA-96 system.
14. Click the Fit Data (Fit) button on the tool bar or
under the Analysis pull down menu.
Data Acquisition
15. The software will automatically fit the curve and
give you the %G1, %S and %G2 phase cells. (See
Figure 1.)
Refer to the Guava PCA-96 System User’s Manual for
detailed protocols describing data acquisition.
16. If desired, the quality of the data fit can be
determined by selecting Fit diagnostics under
the Tools menu.
Data analysis using CytoSoft
17. To save or print the analyzed file, choose those
options from the File menu.
Refer to the Guava PCA-96 System User’s Manual for
5
A S S A Y
P R O T O C O L
FIGURE 1:
ModFit LT™
analysis
display.
18. Repeat steps 3-17 for remaining samples.
5.
Click OK when description dialog come up.
NOTE: This data does not get exported to a CSV
(comma separated values) spreadsheet file.
6.
Gate around the major population by:
a. Using the Left Mouse Button to start the
polygon.
Analysis using MultiCycle
1.
Open the MultiCycle
software application.
2.
Open a file by clicking
the Open File box to
the left of the shortcut
bar or by using the pull
down menu under File.
3.
Choose the cell cycle
file you want to analyze.
4.
Under the 2P Gating:
Select FS-P for the XParameter and FL2-P
for the Y Parameter.
Click the Check box
next to Gate #1.When
the check box is
clicked, the gating dot
plot will come up automatically.
b. Point & Click the Left Mouse Button at next
vertex.
FIGURE 2: Peak positioning in MultiCycle.
6
A S S A Y
P R O T O C O L
c. Double Click the
Left Mouse Button to end the
polygon.
NOTE: DO NOT DRAG
THE MOUSE.
7.
Click the checkbox
next to FL2-P under
the To Mcycle column
8.
Click OK.
9.
The Software will
automatically try to
locate the G0/G1 and
G2/M peaks. If the
peak assignment
requires manual
adjustment, click
either the G1 Mean
or G2 Mean boxes
and click the red line
and move to the
appropriate location.
FIGURE 3: MultiCycle analysis display.
10. If adjustments to the
G2/G1 ratio need to
be made, enter the
appropriate value.
11. When peak positioning looks correct,
click OK. (See Figure
2.)
12. The software will
automatically fit the
curve and give you
the %G1, %S and
%G2 phase cells. (See
Figure 3.)
13. To Exclude Aggregates and Debris
click on the Agg Button on the Toolbar or
under the Edit pull
down menu. (See
Figure 4.)
FIGURE 4: MultiCycle analysis display with aggregate and debris excluded.
15. Repeat steps 2-14 for remaining samples.
14. To save or print the analyzed file, choose those
options from the File menu.
NOTE: This data does not get exported to a CSV
(comma separated values) spreadsheet file.
7
A S S A Y
P R O T O C O L
cell cycle can be better determined. All data shown
here were processed and plotted using ModFit LT.
Expected results
The results of your cell assays are automatically
exported from CytoSoft to a spreadsheet file. Statistics for each population within the histogram in
CytoSoft include percent total, PM1 mean, median
and %CV fluorescence intensity for all events and for
gated events. In addition, all the instrument and
analysis settings are stored in the CSV file. If desired,
a third party “curve-fitting” software package such as
ModFit LT or MultiCycle can apply more sophisticated analysis model algorithms to identify the three
phases of the cell cycle and to calculate the relevant
statistics. However, CytoSoft can be used to identify
the populations and to estimate the number of cells
within each phase. CytoSoft also does not employ
any sophisticated “pulse-processing” technology to
eliminate potentially contaminating G0/G1 phase cell
doublets from within the apparent G2/M population,
which may be a minor source of error. The Guava
Cell Cycle data for all samples within a data set are
saved to an FCS 3.0 file, and optionally to FCS 2.0
files.
Drug induction
Jurkat cells were serum starved for 24 hours and
treated with 0.05 µg/mL of Aphidicolin (S phase
arrest) and 0.029 µg/mL of Nocadozole (G2/M phase
arrest) for 24 hours in a flat bottom 96 well
microplate. A control sample, with no drug, was prepared at the same time. After drug induction, cells
were transferred to a round bottom 96 well
microplate, washed and fixed with 70% ethanol. The
cells were kept in 4oC overnight and stained according
to the Cell Staining (in a 96 well format) protocol
above.
Figure 6a shows a ModFit plot of Jurkat cells with no
drug induction while 6b shows Jurkat cells treated
with Aphidicolin and 6c shows Jurkat cells treated
with Nocadozole. As expected, there is a lower percentage of cells in the G0/G1 phase and a higher
percentage in the S phase when Jurkat cells were
arrested with Aphidicolin compared to Jurkat cells
with no drug treatment. Jurkat cells exposed to
Nocadozole showed a significant increase in cells in
the G2/M phase and essentially no Jurkat cells in the
G0/G1 phase.
Screen result
Figure 5a shows a typical CytoSoft histogram and dot
plot from a typical PC3 cell sample acquired on the
Guava PCA-96 system. The DNA histogram results
table presents the percentages of each phase by markers: M1 (G0/G1), M2 (S), M3 (G2/M), and M4 (if
enabled). The PM2 mean and median fluorescent
intensities as well as the PM2 % CV are also shown
in the histogram results table. These results can be
directly used to screen for large changes in particular
phases of the cell cycle.
The percentages of cells in the G0/G1, S and G2/M
phases for all three treatment conditions of Jurkat
cells (no drug, Aphidicolin and Nocadozole) were
similar on the Guava PCA-96 system, the Guava PCA
and the FACSCalibur (Figure 7), indicating that the
Guava PCA-96 yields accurate results for cells
actively in cycle as well as in arrest. Results from the
Guava PCA-96 system clearly show the expected
results. Cells treated with Aphidicolin had decreased
numbers of cells in G1 and increased numbers in S.
Cells treated with Nocadozole had substantially
decreased numbers of cells in G1, slightly decreased
cell numbers in S and significantly increased cell
numbers in G2/M. Note also that the replicate samples acquired on all instruments yielded very similar
results as indicated by the small error bars.
After acquisition on the Guava PCA-96 system, the
data can be analyzed immediately using ModFit LT.
Modfit LT employs more sophisticated analysis
model algorithms to identify the three phase of cell
cycle. Figure 5b shows a typical result from Modfit.
Unlike CytoSoft, ModFit LT uses mathematical curve
fitting algorithms, so that the percentages for the
three phases of the cell cycle provided by ModFit are
more accurate and smalle ModFit uses mathematical
curve fitting algorithms, unlike CytoSoft, the percentages for the 3 phases of the cell cycle are more
accurate when using ModFit and smaller changes in
the percentages of cells in the different phases of the
Post stain stability on the 96-well plate
The stability of cells after staining was assessed at
various time points out to 5.5 hours. Stability of
8
A S S A Y
P R O T O C O L
FIGURE 5. (A) An example of results obtained using the Cell Cycle protocol for PC3 cells cultured in a flask. PC3 cells were split 1:3 and cultured in a
T-75 flask for 2 days. Guava® CDR was used to remove the cells from the flask. Cells were fixed with 70% ethanol in the tube and then stained in the
96 well round bottom plate as described above. Results show percentages for the G0/G1 phase, S phase, and G2/M phase. (B) The same sample as
in (A) analyzed with Modfit.
9
A S S A Y
P R O T O C O L
FIGURE 6: Jurkat
cells were cultured with
Aphidicolin to
arrest cells in S
phase or with
Nocadozole to
arrest cells in
G2/M phase.
These treated
cells plus cells
not exposed to
drug were then
fixed, stained
and acquired on
the Guava PCA96 system. The
perrcentage of
cells in each
phase of the cell
cycle was determined using
ModFit for each
replicate (n=10).
Representative
data from each
of the treatment
groups ((A) no
drug, (B) Aphidicolin, (C)
Nocadozole) is
shown here.
10
A S S A Y
P R O T O C O L
staining is crucial because to ensure the best results, a
large number of events (~5000) should be acquired
at the slowest flow rate and this may take up to 3.5
hours per plate.
G0/G1 phase
80.00
Non-adherent cell line
Results show that post staining of Jurkat suspension
cell line is stable at least 5.5 hours (Figure 8). The
percentages of G0/G1 phase, S phase and G2/M
phase remain constant from time 0 to 5.5 hours.
PCA-96A
PCA
FACS
G0/G1 phase
100
70.00
80
G0/G1 phase (%)
60.00
G0/G1 phase (%)
PCA-96 A
PCA-96 B
FACS
90
50.00
40.00
30.00
70
60
50
40
30
20
20.00
10
0
10.00
0
50
100
0.00
No drug
Nocadozole 0.029
150
200
Time Post Stain (min)
250
300
350
Aphilicolin 0.05
S phase
Drug Sample
100
PCA-96 A
PCA-96 B
FACS
90
S phase
80
70
S phase (%)
70.00
PCA-96A
PCA
FACS
60.00
50.00
60
50
40
S phase (%)
30
20
40.00
10
0
30.00
0
50
100
150
200
250
300
350
Time Post Stain (min)
20.00
G2/M phase
100
10.00
PCA-96 A
PCA-96 B
FACS
90
80
No drug
Nocadozole 0.05ug
G2/M phase (%)
0.00
Aphilicolin 0.029
Drug Sample
G2/M phase
90.00
PCA-96A
PCA
FACS
70
60
50
40
30
20
10
80.00
0
0
70.00
50
100
150
200
250
300
350
G2/M phase (%)
Time Post Stain (min)
60.00
FIGURE 8: Post stain stability of a non-adherent cell line. Jurkat sus-
50.00
pension cells were cultured overnight in a flat bottom 96 well plate
at a cell concentration of 1.5 x 10⁵ cells per well. The cell samples
were transferred to a round bottom 96 well plate, fixed with 70%
ethanol and stained the following day. The cells were read on two
Guava PCA-96 instruments (n=6 per time point) and one FACSCalibur (FACS; n=2) at the following time points: immediately after 30
minute incubation time (t=0), 30, 60, 90, 120, 180, 240, and 330 minutes. The average percentages with standard deviations of G0/G1
phase (A), S phase (B) and G2/M phase (C) are shown here.
40.00
30.00
20.00
10.00
0.00
No drug
Nocadozole 0.05ug
Drug Sample
Aphilicolin 0.029
FIGURE 7: Comparison of Cell Cycle analysis of drug induced
cells acquired on various instruments. This figure shows the
percentages of G0/G1 phase (A), S phase (B) and G2/M phase
(C) of Cell Cycle analysis of drug treated Jurkat cells on the
Guava PCA-96 System (n=10 per condition), the Guava PCA (n=2)
and the FACSCalibur (n=2).
11
A S S A Y
P R O T O C O L
Adherent cell line
Precision
The percentages of G0/G1, S and G2/M phases of
PC3 adherent cells remained consistent to at least 5
hours post stain (Figure 9). The percent of S phase
for PC3 cells determined on the Guava PCA-96 was
higher and the percent of G0/G1 phase correspondingly lower compared to the FACSCalibur result.
This may be explained by PC3 having a low percentage of S phase cells when grown under log phase
conditions than Jurkat cells.
Jurkat suspension cells and PC3 adherent cells were
cultured in flasks or in 96 well plates, fixed and
stained in tubes or 96 well plates. The average percent positive, standard deviation and percent CV of
the data were calculated for the G0/G1, M and G2/M
phases. Table 1 shows the summary of the data %CV
for cultures with different distributions of G0/G1, S
and G2/M phases.
TABLE 1: Precision of cell cycle results acquired on a Guava PCA-96
System*.
G0/G1 phase
70
ID % Positive
G0/G1 phase (%)
60
CV of %
G0/G1 phase
CV of %
S phase
CV of
G2/M phase
50
40
5
> 50
<3
<5
<3
4
41-50
<5
<8
<5
3
21-40
<10
<10
<12
2
11-20
<10
<16
<15
1
<10
<45
<25
<30
30
PCA-96 A
PCA-96 B
FACS
20
10
0
0
50
100
150
200
Time Post Stain (min)
250
300
350
S phase
70
PCA-96 A
PCA-96 B
FACS
60
* Data include sample sizes varying from n=6 to n=96
S phase (%)
50
As expected, the data %CVs decreased as the % of
cells in that phase increased. When 20% of cells were
in a particular phase, the %CV was <10; when 50%
of cells were in a particular phase, the %CV was <5.
40
30
20
10
The precision of data acquired across an entire 96-well
plate is also important. To assess this, PC3 cells were
cultured in tubes and stained in a round bottom 96
well plate are shown below. The same sample was run
on two different Guava PCA-96 Systems at the same
time using a worklist containing automatic quick
clean after every 12th sample. The instrument setting
for flow rate was Very Low and the events collected
was 2500 events. The entire 96 well plate took approximately 2 hours to finish. Note that even over this
long acquisition time, the results obtained from the
end of the plate were essentially identical to those at
the beginning (Figure 10).
0
0
50
100
150
200
Time Post Stain (min)
250
300
350
G2/M phase
70
PCA-96 A
PCA-96 B
FACS
G2/M phase (%)
60
50
40
30
20
10
0
0
50
100
150
200
Time Post Stain (min)
250
300
350
FIGURE 9: Post-stain stability of an adherent cell line. PC3 adherent
cells were cultured for 2 days in a flask at a cell concentration of 1 x
106 cells/mL. The cell samples were transferred to round bottom 96
well plates, fixed with 70% ethanol and stained the following day.
The cells were acquired on two Guava PCA-96 instruments (n=6 per
time point) and one FACSCalibur (FACS; n=2) at the following time
points: immediately after a 30 minute incubation time (t=0), 30, 60,
90, 120, 180, 240, and 300 minutes. The average percentages with
standard deviations of G0/G1 phase (A), S phase (B) and G2/M phase
(C) are shown here.
Accuracy of Guava PCA-96 vs Guava PCA vs
FACS
Twenty different cell samples, including Jurkat suspension cells and PC3 adherent cells, were assayed
according to the Cell Cycle staining protocol. Data on
these cells were aquired on the Guava PCA-96 Sys-
12
A S S A Y
tem, the Guava PCA and BD FACSCalibur (FACS) and compared, as shown
in Figure 11. The percent differences of
G0/G1, S and G2/M phases were calculated and are presented below.
Percent gated G0/G1
60
Percent Positive G0/G1 phase
50
40
30
20
10
0
0
10
20
30
40
50
60
70
80
90
100
90
100
Sample ID
PCA-96A
PCA-96B
S phase
30
25
Percent Gated of S phase (%)
The Guava PCA-96 shows no trend of
overestimating or underestimating of
G0/G1 phase compared to FACS or
Guava PCA (Figure 11a). The average
percent difference between the Guava
PCA-96 and the FACS and Guava PCA
for G0/G1 phase of the twenty samples
is 3.3% and 2.9%, respectively. There is
no trend of underestimating or overestimating of the percent of S phase on
the Guava PCA-96 or FACS, regardless
of cell type (Figure11b). The S phase
data generated on the PCA-96 are generally more variable when compared to
the data from the FACSCalibur mostly
because the S phase contains the fewest
numbers of cells. While the highest
percent difference was 33% because of
the low percentage of PC3 cells in the S
phase, the average differences were less
than 5% compared to the FACS and
Guava PCA. There is no trend overestimating or underestimating the percent
of G2/M phase of the Guava PCA-96
compared to FACS or Guava PCA. The
average difference of the twenty samples acquired on the Guava PCA to the
FACS and Guava PCA is -1.5% and
2.3% respectively.
P R O T O C O L
20
15
10
5
0
0
10
20
30
40
50
60
70
80
Sample ID
G2/M phase
PCA-96A
PCA-96B
45
FIGURE 10: Precision of results across 96-well
microplates. The percentages of the G0/G1 phase
(10a), S phase (10b) and G2/M (10c) phase over an
entire 96 well plate of PC3 adherent cells acquired on
two different Guava PCA-96 Systems are shown here.
The average percentage of G0/G1 phase is 45%, S
phase is 18% and G2/M phase is 37%. The percent CV
of G0/G1, S and G2/M phase for all 96 samples for
Guava PCA-96-A is 3.2%, 12.4%, and 5.4%, respectively. The percent CV of G0/G1, S and G2/M for all 96
samples for Guava-PCA-96-B is 3.5%, 9.1%, and 5.1%,
respectively. The high data % CV for S phase on both
Guava-PCA 96 is due to a low percentage of cells in
the S phase.
Percent Gated of G2/M phase (%)
40
35
30
25
20
15
10
5
0
0
10
20
30
40
50
Sample ID
13
60
70
80
90
100
A S S A Y
P R O T O C O L
FACS
Guava PCA
Accuracy vs FACS and PCA (G0/G1 phase)
50
% difference Guava PCA-96
40
30
20
10
0
-10
0
5
10
15
20
-20
-30
-40
-50
Sample ID
FACS
Guava PCA
Accuracy vs PCA and FACS (S phase)
50
40
% difference of PCA-96
30
20
10
0
0
5
10
15
20
-10
-20
-30
-40
-50
Sample ID
FACS
Guava PCA
Accuracy vs FACS and PCA for G2/M phase
50
40
% difference of PCA-96
30
20
10
FIGURE 11: Comparing results obtained on the Guava
0
0
5
10
15
20
-10
-20
-30
-40
-50
Sample ID
14
PCA-96 System to those from the Guava PCA and the
BD FACSCalibur. The comparison of results obtained
on the Guava PCA-96 System for G0/G1 phase (A), S
phase (B) and G2/M phase (C) to those from the
Guava PCA and the BD FACSCalibur are shown here.
The formula used to determine the percent difference
between the Guava PCA 96 vs Guava PCA or FACS is
the percent positive of PCA-96 minus percent positive
of predicate method (Guava PCA or FACS) divided by
percent of predicate method.
A S S A Y
P R O T O C O L
not alleviate the problem, consult the Guava
PCA-96 System User’s Guide or contact Technical
Service for additional help.
Troubleshooting tips
1.
Setting the FSC threshold too low may affect
your results, because cell debris will be included
and affect analysis values. Additionally, noise
may appear in the PM2 histogram as a result.
Try adjusting the threshold upward in order to
reduce noise and debris, or enable gating during
data analysis to exclude unwanted debris events.
2.
Avoid excessive exposure of the stained samples
to light.
3.
If the concentration of the stained cell sample
for data acquisition is low (<7 x 10⁴ cells/mL),
the Guava PCA-96 will not be able to acquire
5,000 events in the allotted time for sample collection (10 min). Centrifuge the sample at 400xg
for 7-10 minutes and remove a sufficient
amount of the supernatant to increase the cell
concentration to >7 x 10⁴ cells/mL.
4.
Run Guava Check (Catalog No. 4500-0020) to
verify proper instrument function and accuracy.
6.
Periodically run Quick Clean using a deionized
water tube (at least after every 12 to 24 sample
acquisitions) to prevent a buildup of cell debris
in the flow system. If your samples contain significant amounts of cellular debris, run Quick
Clean with Guava ICF followed by water, to help
prevent clogs or blockage.
7.
A clog or blockage of the flow system can be
caused by cell aggregates, cell debris, free DNA
strands, bleach crystals, or other particulates. If
you are acquiring data from a sample but the
Cell Count number is not increasing and the
Events to Acquire bar is not moving, there is
probably a blockage of the flow system. Click on
“Pause” and then Click Backflush to flush out
the clog follow by a Quick Clean using ICF fluid
and then a final Quick clean using water. Load a
tube of deionized water and run Quick Clean to
remove bleach residue. If this procedure does
If there are no events being acquired and there is
no clog in the fluidics, then check the volume of
sample in the well. If the sample in the well is
less than 100 uL, dilute the sample using the Cell
Cycle reagent to at least 100 µL or press “Next”
to go to the next well.
9.
For more troubleshooting tips, refer to the
Guava PCA-96 System User’s Guide.
Trademarks and Patents
Microsoft is a registered trademark of Microsoft Corporation.
Guava and ViaCount are registered trademarks of
Guava Technologies, Inc.
The default number of events to acquire is 5000.
You may input a different number, however,
your statistical error may increase as you
decrease the number of events for acquisition.
You should not collect below 2000 gated events.
Collecting below 2000 gated events may yield
erroneous results.
5.
8.
PCA, Guava Cell Cycle, Guava Check, CytoSoft, and
CytoAnalysis are trademarks of Guava Technologies,
Inc.
ModFIT LT is a trademark of Verity Software House,
Inc. FACSCalibur is a trademark of Becton, Dickinson and Company..
© 2003 Guava Technologies, Inc. All Rights Reserved. Printed in USA.
Part No. NEEDS PART NUMBER Revised 23-Sept-2003
15
Guava Technologies, Inc.
25801 Industrial Blvd., Hayward, CA 94545
TOLL FREE IN US (866) 448-2827
PHONE (510) 576-1400
FAX (510) 576-1500
EMAIL [email protected]
WEBSITE www.guavatechnologies.com
®