1
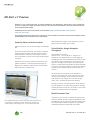
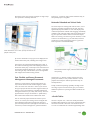
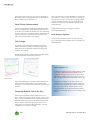
INSIDE ATLAS.ti – The QDA Newsletter
In This Issue
•
This issue of INSIDE ATLAS.ti has a preview of the
upcoming version 7.0 release. For a list of some of the
most important new features, changes, and powerful additional functionality you can expect from this latest major
release, read more here.
We hope you enjoy reading this new edition of INSIDE
ATLAS.ti and invite you to send us your feedback:
[email protected]
•
Jörg Hecker
Director Business Operations
In Research with ATLAS.ti, Corey Abramson of the
UC Berkeley Center for Urban Ethnography writes about
“Qualitative Research in the Positivist-Behavioral Tradition.” Read the article here.
Happy coding!
•
New Publications is a new section that informs our
readers of select scholarly publications that have come to
our attention. Read more here.
•
We highly recommend an important new book that
is scheduled for release in December: Dr Susanne Friese,
Qualitative Data Analysis with ATLAS.ti. Read more here.
•
And, last but by far not least, we announce the publication of the new, updated and expanded edition of the
ATLAS.ti User Manual. Read more here.
Xmas Sale! All licenses 20% Off!
To give back something for the fantastic development of
the past year this holiday season, we offer ANY NEW LICENSE (including student licenses) for a full 20% off during the month of December. Simply enter the following
coupon code on the shopping cart page: 2F9-NQS-SJR
Important to note: Not only will you receive the full package of ATLAS.ti at this lower price, you will automatically
also get a FREE UPGRADE to v.7.0 once it is released in
early 2012.
Thank you, enjoy, and happy holidays from ATLAS.ti!
Newsletter 2011/3 – December 2011
Page
1
����� ��
����� ��������� ����������
ATLAS.ti v.7 Preview
ATLAS.ti 7 is only a few months away, its release scheduled for early March 2012. Time to take a more in-depth look
at what is coming in this major new release. There are many reasons to look forward to this next milestone in professional qualitative data analysis.
A detailed preview of select new features can be found here: http://downloads.atlasti.com/v7preview/
v7preview_201111.pdf
The guiding princples of the innovations in ATLAS.ti 7 can be described as centered around increased usability, streamlined productivity, and revolutionary new functionality:
Powerful Video and Audio Analysis
ATLAS.ti 7 features state-of-the-art analysis of multimedia
files.
This makes ATLAS.ti the premier tool choice for anybody
working closely with video and audio material, such as
media researchers, educators, video analysts, musicologists, and scholars in a host of areas where media analysis
is required.
Waveform cues and frame previews overcome the navigational “blindness” of the old approach and give you
highly precise navigation. Videos can be viewed embedded, stand-alone, and full-screen.
Multi-dimensional analysis: Create image PDs from displayed frame for in-depth scene coding.
Virtual Reality: Margin Metaphor
Throughout
Most intutive user interface:
Software users – not only ATLAS.ti – still prefer to
simulate the non-digital world even in this digital age:
Smartphones offer virtual bookshelves from where to pick
your eBooks. Pages of eReaders can be turned over as if
they were real pages. Music apps let you input rhythm
patterns via drum pads and melodies via virtual keyboards
or virtual. In nearly every field there exists a time-honored
and well-proven standard way of interaction with your
material.
The most natural environment for the qualitative researcher is the margin area. Audio and Video now share
ATLAS.ti‘s basic metaphor for presenting and working
with documents: the margin area. Text, PDF, images,
audio, video – all utilize this powerful workspace.
Printing your source materials with all its margin information (not possible in any other QDA product) is, naturally,
standard procedure for ATLAS.ti. In ATLAS.ti 7, this option
will also be available for PDF and image files.
Multi-Document View
New Multimedia engine: View video PDs frame-by-frame for
in-depth scene coding and multi-dimensional analysis. All
codes display in the margin area – just as nature intended!
2
Page
In ATLAS.ti 7, you can work on multiple documents at the
same time and side-by-side. Imagine the possibilities: Compare different versions of the same document, directly draw
connections between different segments, or synchronize
multimedia and text documents with one another.
Newsletter 2011/3 – December 2011
����� ��
����� ��������� ����������
Document regions can be freely arranged via drag & drop.
The operation is smoothly animated.
import (e.g., comments, tags) and the added security of
full optional project encryption.
Networks Reloaded and Virtual Links
The visual aspect of working with network views, one of
ATLAS.ti‘s particular strengths from the start, has been
significantly improved further. A new node display with
realistic drop shadows and full node dragging, individually
resizable nodes and node hiding make visual-based working more powerful. Add to that a new animated layout,
flicker-free resizing, real zoom for greater freedom, as well
as the use of virtual links (e.g., PD-code links) and view
persistence on node and network level for a great new
work experience and added flexibility.
Multi-Document View: Three primary documents displayed side-by-side
Up to four documents of any type can be displayed and
worked with side by side, including their margin areas.
This enforces an in-depth understanding of the data. It
also makes transcribing media and analyzing associated
documents child‘s play. A transcript can be activated from
its associated media file clicking the “red dot.” Cross-document drag & drop of brackets lets you create hyperlinks
and navigate them without losing context.
Fast, Flexible and Secure Document
Management: Managed Documents
ATLAS.ti 7‘s powerful new managed documents concept ensures referential and content integrity to make
users‘ life easier! You now have a choice if you want to
keep your project files stored in their original location (as
before) or if you want ATLAS.ti to handle all document
management tasks for you, safely and securely. The managed document concept also includes a “public library”
that contains shared material for collaborative work.
You can retain the project document structure you‘re
used to, or convert your existing HUs to managed docs.
This sophisticated document management also gives
you increased performance (through one-time doc-to-rtf
conversion), revision management, optional metadata
Newsletter 2011/3 – December 2011
New Network View engine, with real zoom and excellent printing
Virtual Links, e.g. display of codes connected to their
primary documents, is now possible without a need to
populate the workspace with the quotations they are
actually linked to.
Finally, excellent full printing capability and high-resolution image export of network views give you countless
additional options for reporting and added usefulness all
around.
.rtf with Tables
ATLAS.ti 7 imports .doc, .docx and .rtf fully formatted –
including tables. Whatever your source material looks like,
ATLAS.ti can handle it. We have now decided to move
to a new .rtf model but do so without jeopardizing older
Page
3
����� ��
����� ��������� ����������
project data. That means you can enjoy the full width of
formatting options, including tables, for all .rtf documents
that are added to your projects in v.7.
Word Clouds (Wordcruncher)
A staple of many Web 2.0 applications and already available as an output format via the XML stylesheets since v.
5, ATLAS.ti 7 now integrates Clouds even more seamlessly
into the program core. Clouds for primary documents and
codes are now part of the Wordcruncher interface and
make many analytical steps more intutive.
GUI Changes
Also, each data source is now identifiable via a unique ID.
This means the position of the data source in the list of
documents is no longer an issue when merging multiple
projects. Each team member can now freely adjust the
sequence of documents to fit individual analysis needs
and preferences.
Administrators will enjoy new support for silent/
unattended installations.
New Analysis Options
A number of new analysis options are still in the pipeline. A description will be available in the next edition of
INSIDE ATLAS.ti.
The ATLAS.ti user interface has undergone numerous
subtle but extremely usability-enhancing changes. They
will increase your productivity without interupting your
workflow. For example:
Flexible side panels unify central functions and give speedy
access to frequently used functions and tools.
How to Upgrade to v.7:
To obtain an upgrade for your existing license, simply
go to http://www.atlasti.com/order.html, select
“Upgrade” and enter your license key when asked.
Alternatively, simply contact our support center via
http://support.atlasti.com and send your license key.
Word Clouds
Open coding dialog auto-completion makes coding even
faster and easier. And last but not least, subtle animations make use of many common tools more pleasant and
aesthetic.
Teamwork-Enabled, Out of the Box!
Upgrades are available for all older versions. Upgrade prices are generally approx. 50% of the price
of a new license. Upgrades can only be obtained for
the same type of license. Student licenses cannot
be upgraded, but if you still have full-time student
status, you can simply apply for a new student license
for v.7.
ATLAS.ti gives you the freedom to work alone or in a
team – without the need for special licenses, add-on modules, or servers. Collaborative work is possible with any installation and license type. The new Managed Document
feature supports central storage for team projects and
helps you keep your project data organized in a central
“public library” – locally or remotely.
4
Page
Newsletter 2011/3 – December 2011
����� ��
����� ��������� ����������
Qualitative Research in the Positivist-Behavioral Tradition
Resources for Addressing Type I and Type II Errors in Code Associations Using ATLAS.ti
Corey M. Abramson
Corey M. Abramson (http://cmabramson.com) is a PhD candidate in the Department of Sociology at the University of
California, Berkeley and a Research Analyst at the University of California San Francisco’s Institute for Health Policy
Research. His research uses a combination of quantitative, qualitative, and formal theoretical methods to examine the
mechanisms that link social inequality to the health of populations, individuals, and the human body more generally.
Corey currently manages UC Berkeley’s interdisciplinary Center for Urban Ethnography (CUE) where he collaborates on
projects with scholars from various fields, works on methodological issues, and directs an undergraduate training program in qualitative methods. He is also the lead instructor in Computer Assisted Qualitative Data Analysis (CAQDAS)
for the UCB Social Research workshops, where he provides methodological training and consulting to faculty, graduate
students, and research teams from across the country.
Introduction
When I teach workshops on data analysis in ATLAS.ti, I
get to interact with people from a wide spectrum of disciplines and philosophical orientations. I consider this ability
to accommodate a host of methodological and epistemic
perspectives to be an important strength of current
generation Computer Assisted Qualitative Data Analysis
Software (CAQDAS). The software accommodates phenomenologists, interpretivists, grounded theorists, positivists, and a whole host of other epistemic orientations.
ATLAS.ti does not require the analyst or team to impose
an exclusively top down-deductive logic, or an emergent
inductive logic, but allows the deployment of both logics,
either alone or in combination. Because of this flexibility,
CAQDAS workshops are one of the few venues where it
is not odd to have political scientists, sociologists, public
health scholars, rhetoriticians, anthropologists, and market
researchers in the same room. Often, the key common
denominator is that they recognize the software as useful
for their research or inquiry (even if they agree on little
else). Consequently, when I teach ATLAS.ti I do not proselytize or try to advocate for a particular methodology or
epistemic perspective, but rather show how the software
can be used as a flexible tool to accomplish individuals‘
particular goals. I always believe that the “best practices”
for using software, like any tool for social research, are
those practices that work best given the user‘s philosophy
and aims.
Nonetheless, as a sociologist that does work on inequality,
health, and policy at a large research university, I operate
within a particular scholarly and organizational context.
Newsletter 2011/3 – December 2011
That context requires that I contend with classical positivist-behavioral concerns about bias, error, representation,
inferential logic, and reliability. Many of the individuals
and teams I work with use ATLAS.ti in similar organizational and disciplinary contexts. Some agree with the
underlying logic of positivist-behavior research, others
find it repugnant. There are myriad critiques and responses (some of which I list at the end of this article). Still,
regardless of where they fall in these debates, researchers
acknowledge that there is a comparative dearth of literature relating CAQDAS to these concerns. This article is not
a normative assessment of various epistemologies or the
conditions under which one might adhere or deviate from
them. My intent is not to provide prescriptive statements
about what constitutes “proper” research. Rather, I address (in a limited way) how CAQDAS relates to concerns
with the possibility of error in inferred associations under
the positivist-behavioral tradition, and show how some
existing tools in ATLAS.ti can be used by those operating
in this tradition.
CAQDAS and the Problem of Inference
Two of the most common questions I get asked during
workshops and consulting are: 1. “How do I know if an
association between codes is real?” and 2. “How do I deal
with relationships that are real, but do not show up in my
examination of code associations?” Both questions are
concerned with the representation of a social or linguistic
process in a data set, and how it maps on (or fails to map
Page
5
����� ��
����� ��������� ����������
on) to a reality outside. It is a component of a set of classical problems in analytical inference- how does one get
correspondence between recorded data and the phenomena they purport to record? How can theory or model be
made line up with the phenomena they explain? And on
a related note, how does one minimize the possibility of
error, or miss-correspondence? In essence, the “how do
we know” questions are complex philosophical problems
underwritten by particular logics of inference. In the positive-behavior tradition, the overarching concern is how
can we deal with the lurking specter of type I errors (false
positives) and type II errors (false negatives) in research
generally – and qualitative research more specifically.
Dealing with problems and theories of inference and correspondence is a huge field, with volumes of books and
articles addressing possible responses. My contribution in
this article is much more meager. I do three things: (1) I
address how one might examine the relationship between
two or more “codes,” (2) I examine how this process
relates to the concern of type I and type II errors, and (3)
I discuss some of the new tools in ATLAS.ti that can be
deployed to help minimize inferential errors.
Defining Codes and Coding
Before I examine how to examine the relationship between codes, it is necessary to articulate what social scientists in the positive-behavioral tradition typically understand as codes and coding in qualitative research. To put
it generally, coding is the process by which an investigator
or team marks specific pieces of data (text, images, audio
clips, video, geo-spatial locations) as instances of particular categories, events, concepts, or variables. In ATLAS.ti,
codes break documents into a smaller unit of data known
as a “quotation.” The code is an indicator that a piece of
data (the quotation) contains characteristics that are part
of some larger grouping. Codes can range from seemingly straightforward demographic constructs (e.g. age:
20-29, state:california), to abstract theoretical notions
such as “cultural capital,” “anomie,” or “collective effervescence,” to the mezzo level constructs in between
(e.g. social network types, attitudes, various cultural
tropes etc.) ATLAS.ti offers numerous ways to arrange
these codes into larger hierarchical and non-hierarchical
groupings, and to search for quotations where codes or
combinations of codes co-occur (or overlap). Codes are
flexible and non-exclusive. Many codes can be applied
to one bit of data, or codes can be created that apply to
no data at all. By applying a code to a piece of data, the
6
Page
analyst is essentially saying “this bit of data is an instance
of [something].” How this something is measured, understood, generated, or “operationalized”, is ultimately
chosen by the researcher. In essence, all coding is an
analytical imputation. It is saying this piece of data (1)
should be considered/understood as a piece of data and
(2) is somehow associated with the code and its larger
categories. Even when code names are generated using
respondent speech behavior (as in invivo coding), there is
an analytical moment whereby the researcher designates
a portion of the raw data as something to be analyzed,
and denotes the speech behavior itself as the code with
which it is tagged. Before CAQDAS software, codes were
often simply keywords written in the margin of interview
transcripts or fieldnotes, newspapers, pamphlets, maps,
etc. At the most basic level coding assists the analyst in
understanding the massive amount of qualitative data by
referencing and cross-referencing key observations.
There are two common ways of generating codes in
qualitative social-science research. The first is the inductive or emergent generation of codes. Most “qualitative
methods” such as participant observation, content analysis, and in-depth interviewing typically have inductive
components. That is to say, emerging previously unforeseen patterns/occurrences in the data form a part of the
analysis. Inductive codes, generated after the analysis or
fieldwork has begun, are used to tag and/or group these
events/quotes into meaningful categories. These codes
are often then grouped into even larger meta-categories,
which facilitate the production of a model, theory, or
explanation. Some methodologies (e.g. grounded theory)
use this form of coding exclusively, others verbally discard
it as subjective. In practice, the inductive generation of
codes is a common aspect of most qualitative research
even in the most rigidly positive-behavioral disciplines,
since to ignore unforeseen patterns would be to miss out
on one of the key strengths of qualitative research.
The second mode of generating codes is deductive. This
sort of coding is common for positivist behavioral research, clinical methodologies, the extended case method,
and numerous other approaches found in social science
and policy disciplines. Here, researchers begin a project
with an understanding of specific existing theories that
purport to explain why things happen the way they do in
the world. They want to account for these in their analysis
of qualitative data. After doing a project/grant proposal,
literature review, etc., these researchers will typically go
through and generate codes based on existing, possible,
and counter-factual explanations for the social phenomenon they are studying. I refer to these codes, which are
typically generated before fieldwork or data analysis as
Newsletter 2011/3 – December 2011
����� ��
����� ��������� ����������
deductive codes. Deductive codes operationalize existing
theories, explanations, or categories from prior empirical
and theoretical inquiry. As with inductive codes these can
include everything from demographic categories such as
age, to abstract theoretical constructs. The codes may not
correspond to, or be applied to the data, but they exist
initially to orient a researcher to an analytical frame. If
they correspond to the data (even in part), that is a key
finding. If they do not correspond at all (e.g. they are useless in explaining a social phenomenon), that is a finding
as well. Generating at least some codes deductively also
saves a great deal of time in the process of recoding.
The most common practice in sociology and related disciplines is currently to use a combination of inductive and
deductive codes. Deductive codes are generated based
on prior understandings of a topic, existing theories,
and hypothesized explanations that purport to explain a
specific research puzzle. Inductive codes are generated to
correspond to the unforeseen patterns and occurrences
that present themselves during the course of producing and analyzing qualitative data. Since, unlike survey
methodologies, the range of “responses” or observations
in qualitative research are not limited to a drop down
menu pre-generated at the outset of a project, inductive
codes are necessary to account for observed occurrences
or patterns that were not in the initial analytic frame. Deductive codes are generated using a top down approache.g. starting with explanations and seeing if they map
on to data. Inductive codes are based on a bottom up
approach- beginning with the data and building up. The
extent to which one uses inductive versus deductive codes
(or even uses codes) is a function of their methodological
tradition and epistemic choices.
Codes, Errors, and Inference
There are two types of relationships between codes (key
concepts, themes, or variables) in a qualitative data set.
First, there is a mathematical/formal relationship between
the codes in ATLAS.ti. This formal relationship determines
what comes up in the window when one does a query
or produces advanced output like co-occurency tables.
These codes can be related by boolean links, semantic
links, or proximity links. The ATLAS.ti manual’s discussion
of the query tool explains these links in detail. In short,
these links allow the researcher to see if codes come up
together, come up alone, or are following/preceding/
overlapping one another. There are more complex associations that are possible, but that is the basic idea.
Newsletter 2011/3 – December 2011
The second type of relationship is a substantive empirical
relationship. Some of the formal associations that show
up in ATLAS output may indicate a spurious relationship.
The classic example in elementary statistics is the positive
correlation between ice cream consumption and drowning. The common argument here is that the association
is spurious, explained by an unmeasured explanatory
variable – time of year. Both are explained by the coming
of the summer months, which increases both ice cream
consumption and swimming. If we agree to this sort
of logic, the association between ice-cream and swimming deaths is a statistical artifact. It is what can be a
called a type I error or false positive. There is a formal/
mathematical association between two concepts or codes,
but the association is ultimately spurious (or non-substantive) and explained by something else- another measured
or unmeasured variable, concept, or code (in this case
time of year).
It is also possible that two concepts or the codes that
represent them are related in a crucial way, but that codes
do not come up as formal associations in queries. This
is referred to as a type II error of false negative. In this
instance, there is a real relationship between two things
in the world (e.g. time of year, swimming, and likelihood
of drowning), but this relationship is not easily reflected
in the data. Using the example above one might search
for time of year-summer and drowning, but the resulting
query does not yield useful results. Or perhaps, there is
no existing code or concept to refer to what is assumed
to be the explanatory factor (time of year). Here, the lack
of formal association in the software does not map onto
the substantive association between time of year and
drowning that exists in the larger universe of investigation. In addition to the type one error (the false positive),
the apparent lack of a relationship-when one exists in the
universe outside- is a type two error (a false negative).
I am often asked questions that knowingly or unknowingly touch on this issue of inference. People ask “how
do I make sure my data and coding capture what is going
on?” “how do I make sure a relationship isn‘t just made
up?” and “what if there is something I know is going on
in the world, but isn‘t showing up in my data set?” Often,
the underlying assumption is that there is a simple answer
and that their difficulty is the result of a lack of technical
proficiency with ATLAS.ti. The truth is that while technical
proficiency is necessary to address these problems, particularly for large qualitative data sets, these are complex
methodological questions. They speak to the palpable
tension of how to balance type I and type II errors in the
construction and analysis of data. There is no single command (i.e. right-click- minimize type I errors) or technique
Page
7
����� ��
����� ��������� ����������
that will dissolve this problem. There is no one-size-fits all
solution. Even within the methodological logic outlined
above (which is only one of many responses to epistemological issues such as how to manage “truth” and “correspondence”), the researcher and analyst must make hard
decisions about how to balance and manage type I and
type II errors in specific projects. While there is no one size
fits all solution, in grappling with these issues in both my
own research and that of others, I have developed some
thoughts and opinions that may be of use to others.
Dealing With and Minimizing Error
My general opinion is that type I errors (false positives)
are a lot easier to rule out in qualitative research than in
quantitative research. A qualitative researcher can always
go back and investigate a potential relationship by rereading interviews etc, looking at a text, listening to audio,
then reassessing if the relationship is spurious based on a
re-analysis of the initial content. In primarily quantitative
research, false positives are harder to deal with, since the
assessment is typically made by examining the numeric
strength of association between measures that are largely
set at the outset of a project. Some recoding is possible
(e.g. collapsing an interval variable into an ordinal variable, or building up binary variables into an index), but
the initial categories involved in data collection and analysis are relatively set. Without additional data (e.g. a record
of the observed event), it is hard to rule out the possibility of miscoding or mis-imputation. Qualitative methods
furnish additional information for ruling out false positives
due to errors in the coding scheme, a deficient initial analytical scheme, or chance overlap. They do so, by providing the analyst to look back at the data on which a coding
association is based (e.g. seeing if eating ice-cream has an
effect on swimming prowess), and examine whether that
apparent relationship is an artifact of methodological decisions or mis-imputation. Ultimately, this assessment comes
back to the researcher and their scholarly community, but
in the case of qualitative research, the raw data provides
an additional tool for adjudication.
Type II errors (false negatives) are harder to deal with,
because they are invisible. Broadly, this is an issue of
missing something either in the observation of a social
phenomenon or its analysis. Returning to the issue of
code associations, type II errors refer to real relationships
that don‘t come up as an association in queries or output.
In statistical methods, type II errors are often cast as less
dangerous, since no association is seen as the “more con-
8
Page
servative” result. But in reality, they are still errors. The
analyst misses part of what is going on in the data set and
the world it is meant to represent. Unfortunately, type II
errors are harder to rule out, because the analyst may not
even know they are there. The ability to generate codes
inductively and reanalyze data in qualitative research
assists in this capacity (again by allowing the analyst to
return to pre-coded data and reformulate categories), but
it does not remove the problem.
My strategies for minimizing error in qualitative data
analysis rely on the fact that it is easier to rule out false
positives than false negatives in qualitative research. I try
to minimize type II errors by generating codes deductively
at first, creating codes inductively to correspond to new
findings, coding densely with all relevant codes, then going back (using the query tool) to rule out false positives.
I look at formal associations as something potentially true.
I then decide if this is a false positive, not by computing
the probability of getting such a result due to chance, but
re-examining the event or phrase (in ATLAS.ti typically the
quotation) where the codes overlap and examining the
quality of the relationship.
Ruling out false negatives is harder, and requires more
cognitive flexibility. It often involves re-reading or searching through text in a less directed way. If there is a pattern
in the data that emerges, but is not found in an existing code or codes, I create a new code or codes so I can
reference it easily. If I can convince myself (and hopefully
the reader) that a substantive relationship (1) exists and
(2) refers to something real in the social world, I include
it in my analysis and say that the failure of my initial coding scheme to capture this is the result of a type II error.
Since the substantive claim is not based on a probability
of error, but on an observed and demonstrable pattern or
occurrence, this is consistent with the logic of inference
espoused above (this is bracketing the issue of statistical induction—or inference from sample to population).
It is a strength of qualitative research to account for and
incorporate observations the analyst didn‘t expect. The
ultimate concern isn‘t simply how good the initial coding
scheme is, but whether or not the emerging analysis,
which relates to both existing theories and the real world
is correct in the end.
Tools for Reducing Type II Errors in ATLAS.ti
Given this general strategy for dealing with error, there
are a number of basic and advanced tools in ATLAS.ti that
Newsletter 2011/3 – December 2011
����� ��
����� ��������� ����������
I use to this end. Each of these are covered well by existing articles and documentation in ATLAS.ti. The idea is to
think about these not simply as strategies for exploring
data, but for decreasing type II errors. Each of these can
be used to help patterns you may have missed.
•
•
Rereading data.
Control-f allows you to search for strings of text (in a
way that may not line up with your intial coding).
•
The object crawler does this as well, and provides
more options.
•
In the query tool you can use the “follows” and
“precedes” operators instead of limiting yourself to
Boolean (and, or, not, Xor) searches.. This can help you in
identifying chronological patterns.
•
Using quantitative outputs—e.g. the code primarydocument table could broaden the scope in looking for a
relationship between codes. You could use this to see for
instance, if and how many times two codes are in same
primary document.
Conclusion
The questions “how do we know if an association is real,”
and “how do we deal with real associations that do not
show up in a query,” are not technical questions. They are
fundamental issues tied up with epistemological concern
like “how do we know what we know.” As such, there is
no simple answer, and the most useful or palatable solution varies between and within disciplines. While criticisms
of the positivist-behavioral tradition abound-particularly
in qualitative research, this is context or tradition in
which many of us operate. Without offering prescriptive
statements about the relative utility of different epistemologies, I have discussed a problem fundamental to
research in the positivist-behavioral tradition: dealing with
and minimizing errors in association. I showed how this
relates to CAQDAS, and the specific tools that ATLAS.ti
has for this purpose. It is my hope that even if one wants
to contest this logic, having a better understanding of it,
and the way ATLAS.ti’s tools might be implemented, can
strengthen their own inquires.
•
Co-occurency table explorer. This is a new and
extremely powerful tool for seeing patterns in your data.
See the new newsletter article by Ricardo B. Contreras
here: http://downloads.atlasti.com/library/contreras_
nl201108.pdf
•
You can use network views, to examine the association of codes from different vantage points.
Newsletter 2011/3 – December 2011
Page
9
����� ��
����� ��������� ����������
Publications
In this section we let you know about publications of potential interest to our users that
have come to our attention:
Mühlmeyer-Mentzel, Agnes (2011). Das Datenkonzept
von ATLAS.ti und sein Gewinn für “Grounded-Theory”Forschungsarbeiten [74 Absätze]. Forum Qualitative
Sozialforschung / Forum: Qualitative Social Research,
12(1), Art. 32, http://nbn-resolving.de/urn:nbn:de:0114fqs1101325. [full article in German only]
Qualitative data analysis software is quite similar regarding the fundamental steps and procedures of data
analysis, but the way in which the results of the analysis
are stored is different. This article focuses on the fit of
grounded theory methodology (GTM) and a networklike storage, as is used in ATLAS.ti. Using data from an
ongoing research study as an example, a description is
provided of how the analytical steps of GTM are implemented in ATLAS.ti and how results are stored as a net of
nodes. This code net represents the developed “grounded
theory” as structured conceptualized information. Exported as an XML file the code net can be used in other applications by other researchers. This has the potential to
support data quality and scientific cooperation between
qualitative researchers.
Pan, Steve; Chon, Kaye, and Song, Haiyan (2008) Visualizing Tourism Trends: A Combination of ATLAS.ti and
BiPlot. Journal of Travel Research February 2008 vol. 46
no. 3 339-348.
By analyzing 766 articles from travel trade magazines
published in 2005, this article aims to identify tourism
trends in the Asia-Pacific region. The qualitative analysis
sketches a holistic conceptual network of relationships
among trends, whereas the quantitative analysis visually
presents the trends‘ commonalities or differences among
four subregions (Northeast Asia, Southeast Asia, South
Asia, and Oceania). This article differs from previous
studies in that it counts the frequencies of quotations
associated with codes rather than the commonly used
keywords. Quotations are composed of sentences and
10
Page
paragraphs that provide a deeper and richer understanding of the context. And as the title implies, it visualizes
the relationships among trends and between trends and
sub-regions. Through visualizing the qualitative data
holistically and individually, this approach is intended to
“see the forest for the trees.”
De Gregorio, Eugenio (2009). Narrating a crime: Contexts and accounts on deviant actions. International
Journal of Multiple Research Approaches. Vol 3, Issue 2,
177–190.
This article summarizes the main findings of a study on
the narrative construction of deviant actions which focused both on the contents and the structures of the narrative accounts provided by criminals. The qualitative research was conducted by collecting narrative interviews.
These involved 34 individuals detained in the penal institutions of Regina Coeli and Rebibbia (Rome) and were
aimed at revealing how accounts are typically constructed
in a non-investigative context. More specifically, the aim
of the project was to show whether there are any differences in the narrative accounts provided by different
offenders, classified according to the type of crime they
committed and their experience in the area of deviance.
All interviews were analyzed using ATLAS.ti and taking
the ‚Evaluation model‘ of W Labov as a reference. Participants were divided into three groups according to their
criminal experience (ie professionals, intermediates and
amateurs) and into four groups according to the crime
they committed (ie homicide, robbery and theft, and
crimes related to drugs and fencing). The results show
that there are important differences in the way a crime is
reconstructed by offenders with different criminal history.
The paper also proposes solutions and innovative strategies to deal with quantification and qualitative data.
Newsletter 2011/3 – December 2011
����� ��
����� ��������� ����������
Patrizi, Patrizia (2005). Deviant Action and Self-Narration: A Qualitative Survey through ATLAS.ti. Journal
for the Theory of Social Behaviour. Volume 35, Issue 2,
pages 171–188, June 2005
This paper has its roots in qualitative analysis of accounts
produced by an Italian serial killer. Theoretical references
are related to symbolic interactionism and its developments in the field of psychology and criminology. The
whole contribution is aimed to twofold purposes: A) to
provide a set of criteria specifically addressed to study
deviant action as system of meanings into two related
contexts: the single action itself and the whole life history. According this point, paper introduces the concept
of “deviant career” and it explains its development and
steps; it also provides some psychological social points
Newsletter 2011/3 – December 2011
of views and contributions that scientific works offers. B)
to think about potentialities of accounting interviews as
powerful tools in clinical practice and empirical research
too. Specifically, we discuss narrative about behaviour
and life story as a resource in order to take suggestions
about meanings, goals and rules of action. It also suggests
something about functions that crime discharges in the
whole pathway of one‘s life. Juridical case analysis, run
by means of the software ATLAS.ti, is aimed to demonstrate theoretical reasoning proposed.
Please feel free to share with us any additional recent
(or not so recent) publications that other users may find
helpful or enlightening. Send information to
[email protected].
Page
11
����� ��
����� ��������� ����������
New Book Coming Soon
Dr. Susanne Friese:
Qualitative Data Analysis with ATLAS.ti. Sage
Publications, December
2011.
More information and pre-order is available from
Sage UK: http://www.uk.sagepub.com/books/
Book235168#tabview=title
Sage US: http://www.sagepub.com/books/Book235168
“Qualitative Data Analysis with ATLAS.ti” by
Dr. Susanne Friese is the
very first book designed
to guide you stepby-step through your
research project using
ATLAS.ti. In the book,
you will find clear, practical advice on preparing your data,
setting up a new project in ATLAS.ti, developing a coding
system, asking questions, finding answers and preparing
your results.
Read some early reviewers‘ voices and download a
flyer for distribution here: http://www.atlasti.com/
frieseqda.html
ATLAS.ti Manual
The full ATLAS.ti 6 Manual has been significantly updated, revised, and expanded. Download it from http://
manual.atlasti.com
It contains full documentation of the program and useful
information for special application scenarios.
Those just getting started may prefer the “light” version
of the manual, also referred to as the “mini manual.”
It makes the perfect companion for the Quick Tour and
its pre-coded sample project that come bundled with
12
Page
ATLAS.ti. The “mini manual” has answers to many frequently asked questions and provides useful tips on optimal project setup and management, basic information on
coding, data analysis, and visualization with the network
view function. It is available for free download from http:
//www.atlasti.com/uploads/media/miniManual_v6_
2011.pdf. Highly recommended!
Newsletter 2011/3 – December 2011
����� ��
����� ��������� ����������
Talk To Us – We Love To Hear from You!
We hope you enjoyed reading this issue of
INSIDE ATLAS.ti – Your Quarterly Newsletter. And
we welcome your feedback and suggestions!
Newsletter Feedback
Help to ensure that we fill future issues with information and news that are relevant to
you: Simply use the feedback link to tell us what you liked and what you would like to
read about in future issues.
[email protected]
Request/Suggest Program Features
Your suggestions and requests are an invaluable source when it comes to further
improving our software. Help us identify your needs by telling us about product features
that would make your research efforts easier or more efficient.
http://suggestions.atlasti.com
Newsletter Settings
To update your preferences and contact data, to subscribe, or to unsubscribe from our
newsletter, use the link below. Also, you can comfortably recommend INSIDE ATLAS.ti to
friends and colleagues from this page:
http://newsletter.atlasti.com/lists/?p=preferences
Social Media
You don’t have to wait for the next issue of INSIDE ATLAS.ti for the latest news. Just
connect with us on Facebook or visit our YouTube channel and you can be in touch any
time. We look forward to all your comments. (And rest assured: We continue to be available as always through our forum, mailing list, website, as well as “live” at numerous
events all over the world.)
Facebook: http://facebook.atlasti.com
YouTube: http://youtube.atlasti.com
Newsroom
Visit the ATLAS.ti Newsroom for a comprehensive overview of all media channels and
press information.
Newsroom: http://newsroom.atlasti.com
Newsletter 2011/3 – December 2011
Page
13