1
•
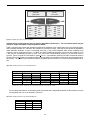
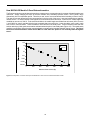
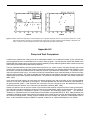
From this screen or from the input screen the array page can be selected. The array output for this problem is
displayed in Figure A.9. This three-dimensional figure shows the longitudinal and lateral extent of contamination.
Again, the user can select the constituent to be viewed and the no degradation or biotransformation prediction. Note
that the scale on the array automatically changes depending on the magnitude of the concentrations. These array
values are maximum values because the array is evaluated at z=0.
Other information that is presented on the output screen includes the mass removed, the percent biotransformed, and
the mass flux. The TCE mass flux discharging to the canal is approximately 83 mg/day.
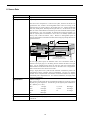
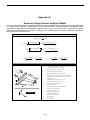
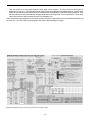
Figure A.6. BIOCHLOR input screen. Cape Canaveral Air Force Base, Florida.
43