1
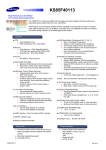
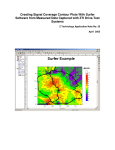
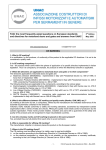
Examples of Signal Coverage
Measurements Using Z Technology Drive
Test Systems
Z Technology Application Note No: 11
Introduction
This document describes a step by step procedure used to perform RF signal
coverage measurements using a Z Technology’s Drive Test System. It details a
straightforward method to organize, setup and carry out a drive test (a data
measurement, collection and storage procedure). The process is outlined in
considerable detail including an example of performing two different sets of
signal coverage measurements during one drive test session.
S5007GPS Drive Test System
DSS5600 Drive Test System
Description of Systems
Every Z Technology Drive Test System includes a full set of hardware necessary
to perform signal coverage test analysis. This includes a field strength meter,
utility mag mount vertical receiving antenna, GPS receiver & antenna, laptop PC
and power supplies. Each System includes the above hardware plus extensive
proprietary software. Z Technology’s factory installed Windows based Drive Test
Measurement Application uniquely integrates several related applications into
one System.
Drive Test Application Note
Drive Test System Description of Equipment
Equipment
Drive Test Package
Supplied by Z Technology
Model No. Such as:
S5005GPS
S5006GPS
S5007GPS
DVS5100
DSS5600
DSS5800
GPS Antenna
Supplied by Z Technology
Cabling
Supplied by Z Technology
Receiving Antenna &
Cables
Optional and available from
Z Technology
Description
Contains:
1) R500 Series Field
Strength Meter (Receiver)
2) GPS Receiver
3) Power Supplies/Inverter
4) Decoder (with some
Systems)
5) Laptop PC
a) With compliment of
Standard Software
b) Drive Test Appl. SW
From Z Technology
Mag. Mount to be located
on Vehicle Roof
Power Cables to connect to
12VDC vehicle power and
120/230VAC power mains.
Vertical, Horizontal or CP
Antenna Mounted for
proper reception
Comments
This Package is a selfcontained set of
measurement equipment
housed in a rugged
suitcase type portable
case.
The antenna includes 12
feet of coaxial cable to
connect with the GPS
receiver.
The receiving antenna is
the one item the operator
will uniquely determine
his own configuration.
Note: Calibrated RF feed
cables are also available.
The operator of a Drive Test System will control and interface with the System
via the PC keyboard and screen. Using the Z Technology proprietary software
“tool” or “Application” an operator can easily set up and control a signal coverage
measurement session.
The Drive Test System employed by a user will include several operating modes.
Each of these modes can be called upon to examine some aspect of System
operation or of actual received signal coverage measurements. From the many
different operating modes, there are three (3) major modes that will be used
repeatably during a test period. Each operating mode has a specific PC screen
used to access the features it provides. These major modes include Data
Collection, Plotting & Mapping and Spectrum Display. Each mode is described in
more detail below.
Data Collection
This mode is entered by selecting the Data Tab on the PC screen from the Drive
Test Application’s start page. The Data Tab is the place where all Drive Test
“Jobs” are selected and Recording processes controlled. Past Jobs can be
2
Drive Test Application Note
recalled as well as additional new ones created. A primary use of this Tab
selection is to allow monitoring of ongoing automated data collection activities
occurring during a measurement session.
Within Data Tab the user creates an initial custom measurement routine, This is
referred to as a “Job.” He will assign the Job a reference “Name.” Among other
things, he will choose the frequency(ies) or Channel(s) to be monitored. Jobs
can be modify or edited from the data tab.
The Data Tap display area gives details of all the data being collected. This
includes signal condition data, frequencies measured, date & time and GPS
location information. Within a scrolling center panel text box the user can see, in
real time, what is actually being stored in data files on the hard drive. An
operator can also keep a watchful eye on the operation of every device the PC
controls including the GPS receiver, field strength meter and any decoder in use.
Data Tab Screen Capture
Data Tab Screen Capture
Plotting & Mapping
This mode of operation is entered by selecting the Plot Tab from the Drive Test
Application. Here Latitude and longitude data are received from the GPS receiver
inside the Drive Test System. The GPS latitude/longitude fixes are used to
create plots of the route traveled while measuring signal coverage. Multi-colored
dot trails showing signal strength versus color is plotted and overlaid onto area
maps of roads and major highways.
Collected signal strength can be plotted for any Job containing valid GPS data.
Simply select the Plot Tab and wait for data to be acquired. Dot plots can be
viewed while moving along the selected route. As data is being gathered, the plot
of the driven route will be plotted and can be viewed in real time.
Each signal parameter measured and stored can be plotted. This includes RF
signal power and for digitally modulated signals: integrated power, tilt, notches,
SER, SNR, sync lock, etc.
3
Drive Test Application Note
Plots from city wide Drive Tests
Plots from neighbor wide Drive Test
Swept Spectrum Display
This mode is entered through a drop down “Tool” menu within the Drive Test
Application. A spectrum display of signal strength versus frequency can be
viewed before and during a drive test session. Near real time Spectrum
Monitoring of a received signal is one of the most useful steps an operator can
perform. The display provides a significant amount of information in just one tool.
The swept spectrum monitor is useful initially as a confidence builder before
starting a test drive. The operator can check for potential interfering signals that
occupy frequencies near the channel of interest. The Spectrum Monitor mode
can also be used to position the direction of your stationary antenna for
maximum received power.
Spectrum Display of RF Signal
Spectrum Display of DTV Signal
All the features described above have been brought together in one unified
hardware/software System to provide a full featured Drive Test Signal Coverage
Measurement Package ready to be placed in a vehicle and used for testing RF
signal coverage. Each of the System features are accessible in the field and are
active during the drive test process itself.
4
Drive Test Application Note
Drive Test Systems allow an operator to easily and quickly collect, analyze and
display RF signal coverage information (and for Systems with a decoder included
8VSB or COFDM decoded television information) several different ways.
Drive Test Example
This document describes a clear methodology for collecting RF Signal Coverage
Measurements using Z Technology Drive Test Systems. It will walk through the
process of setting up a moving (Dynamic) AND a stationary (Static) drive test
measurement procedure. It discusses installation of the System inside a vehicle
and covers receiver antenna setup.
When operating any moving vehicle, safety is first priority and must
be your primary concern. Do not install a Z Technology Drive Test
System in such a way that it will distract the driver of the vehicle from
his primary duty: Safe Driving.
Drive Test Systems are built in easy to transport suitcase sized carrying cases.
Place the System inside the vehicle and open the “pop-up” case. Strap or tie the
System solidly in place. This may be possible by using the vehicles seat belt.
Carefully rap it around the pop-up case.
Open the System case and locate the 12 VDC power inverter along the back
inside wall of the case. Plug the inverter into the cigarette lighter or accessory
power receptacle. If necessary, the inverter itself can be extracted and moved
closer to the vehicles 12VDC power source. The inverter provides power to the
entire System. Next unfold as necessary the Field Strength Meter from inside
and under the laptop PC. This is necessary for most Drive Test Systems. Only
those Systems having decoding capability such as the DSS5600 and DSS5800
are configured to operate with the Field Strength Meter positioned below the PC.
Open the computer to expose the screen and keyboard. Turn on the PC. The
laptop will to boot to the standard Windows desktop start screen.
Drive Test System in Vehicle
5
Drive Test Application Note
Receiving Antenna Mount System
Turn on the instrumentation. Systems with Field Strength Meters only: Depress
the red Power button. Put the meter in Remote mode by selecting Function F93.
The meter will display “1 Port”. Systems with Meter and Decoder: Turn on the
decoder box by depressing the top of the rocker switch on the front of the
decoder. The Meter will automatically come on and be in remote mode with “1
Port” displayed.
Connect the mag mount GPS receiving antenna to the push-on SMB type coaxial
connector located on the top of the GPS receiving brass box on the right side of
the System. Place the GPS mag mount antenna on the outside of the vehicle on
top of the roof.
Mount the receiving antenna for the signal under test on the roof of the vehicle.
To receive a radio broadcast or wireless communication signal, we suggest the
use of a vertical mag mount antenna cut to the transmitter frequency. For
television broadcast signals we suggest, as one option, a quad-mag mount
supporting mast system. One featuring a 2-foot (0.7 meter) vertical mast with a
mounting clamp to hold a horizontally polarized Tuned Dipole Antenna. This type
of Tuned Dipole is normally supplied with Antenna Factors. Antenna Factors (AF)
are usually provided in table form. Using the antenna manufacturers instructions
(see Z Technology’s Antenna Manual for those antennas sold by us) adjust the
Tuned Dipole elements to the correct lengths and note the AF values for the
frequency under test. Connect the receiving antenna to the RF input Type N
connector of the meter.
Here it should be noted as discussed elsewhere in Z Technology
Application Literature, the type of receiving antenna to be used is truly a
technical issue of significance. One that must be considered carefully and
resolved by the engineer confirming the antenna of choice is proper and
will be effective for the application at hand. Several antenna options are
available from Z Technology. The operator should make a careful choice
here. The choice that is best for his specific application. Many of Z
Technology’s Drive Test Systems come with a vertically polarized utility
mag mount antenna. This supplied antenna does not include Antenna
Factors. See a separate Z Technology application note for more details
on Selecting Antennas for Drive Testing.
The Drive Test System is now in place and ready for use. From the Windows
desktop display of the PC, double click on the Drive Test Icon
.
This
launches the Z Technology Drive Test Software. Wait for the Application to
launch and present the start screen.
6
Drive Test Application Note
Start Screen for Drive Test Application
Now you are ready to create a tailor made Drive Test procedure. Following the
directions in the user manual, you will be lead through the process of creating
two Jobs: one for a Dynamic moving vehicle test, the other for a stationary or
Static test. Dynamic Tests are true drive test measurements taken while the
System is in motion. Static tests are a set of carefully obtained measurements
taken at one location with a fixed antenna.
The two Jobs are created by selecting the Data Tab of the Drive Test Application
and clicking on the New Job button. The Job Editor screen shown below
appears. We will set up two identical Jobs. Everything will be the same, from
one Job to the other, except for the Name of each Job and the antenna factor if
different antennas are used. One Job will be used to control and record
measurements in motion and the other will be used during a stationary set of
tests. In this example, we will be making signal measurements of one digital
television station, perhaps you will pick Job Names made up of the stations call
signs. One Job then would be named say WWW-Dynamic and the other WWWStatic. First we will enter the information for the Dynamic job. We will save that
job then create a copy of it and edit the copy to change the antenna factors -- this
assumes one antenna will be used for the Dynamic job and different antenna to
be used for the Static job.
The Job Editor contains three Tabs each tab displays a form. The Frequency
Tab contains all the settings for the different frequencies that will be measured,
the Settings Tab contains all the settings that will hold true for all measurements
done with the job. The Help Tab contains a TV Channel versus Frequency table.
To enter the first frequency, type the frequency to be measured in the frequency
7
Drive Test Application Note
text box on the right side of the frequency form. For Digital TV signals use the
center frequency. For Analog signals use the visual picture carrier frequency.
The TV channel vs. Frequency table in the Help tab is a useful reference. Next
enter a name for the frequency to be measured in the Frequency Name text
box. Typically one would enter the call sign here. Next enter an antenna factor.
This is the number from the Antenna Calibration table for the frequency being
measured plus any feed line loss. If different antennas are used for the Dynamic
and Static jobs, the antenna factors will be different in the two jobs. The antenna
factor is used only if “dBuV/Meter” units are selected in the Settings Tab. Last
select the signal type. For analog signals select “Analog” from the Signal Type
drop down box. For digital signals select the type of modulation from the Signal
Type drop down box. For instance for a US DTV signal select “8VSB”.
To enter another frequency click the Duplicate button, then edit the Frequency,
Frequency Name, Antenna Factor, and Signal Type boxes. Continue until all
frequencies are entered.
Click the Settings tab, shown are the default settings. These may be changed if
necessary. For instance change the Signal Units to “dBuV/Meter” if you want
the measurements to account for antenna factor and feed line loss.
Click the Save Job button to save the job. Name the job WWW-Dynamic. This
completes the creation of the Dynamic Job. To Create the WWW-Static job click
on the Edit Job button, edit the antenna factors in the frequency tab as
necessary, then click on the Save Job As button. Name the job WWW-Static.
After these job creation procedures are complete the user is ready to begin
collecting data with the system.
8
Drive Test Application Note
Job Editor Screen
Start the actual test from the PC screen Data Tab. Navigate back to this screen
and examine the GPS status window in the lower right corner. It reports the
number of satellites being received. If there are at least three satellites in view,
latitude and longitude values will also be displayed within the appropriate onscreen boxes. When this is the case the operator is ready to proceed. (When
powered-up for the first time in a new geographic region, it may take up to 15
minutes for a GPS receiver to determine its initial location.)
Next select the SAMPLE Button in the upper left part of the Application’s screen.
This will read all available Data from every subsystem within the Drive Test
Application. The data will be shown in the blue screen mid-section of the Data
Tab. Visible in the lower part of the screen are areas that report similar
information for each subsystem – including Field Strength Meter, Digital Decoder
(if applicable) and the GPS Receiver signal parameters.
After the SAMPLE procedure shows everything is working acceptably, go ahead
and begin taking measured data. Here different choices of buttons allow a
couple of options: RECORD ONCE or RECORD CONTINUOUS. The first
choice takes one and only one set of measurements each time the button is
clicked. The second choice starts a recording process that will continue
indefinitely until ended by the STOP MEASUREMENTS button is clicked.
Regardless of the choice of buttons, in default mode, the drive test program is
configured to allow entering a comment before starting data records. If desired,
9
Drive Test Application Note
type in a comment from the keyboard. As an example, indicate conditions at the
time a recording began or possibly something about the present location at the
beginning of the test procedure. This comment will be recorded along with
measured data in the stored data file.
Dynamic Data Collection
The operator will normally select as the first step in a test procedure the
collection of Dynamic data. Therefore, select the job Name WWW-Dynamic and
begin recording measured data as the vehicle starts moving. It is suggested data
be continuously recorded over a range of 1 to 2 miles (1.6 – 3.2 km). Have the
navigator keep a close watch on the PC screen and the Drive Test Application as
the vehicle travels along. Under the Dynamic drive test conditions, new GPS
latitude and longitude locations will be received and recorded to data files. This
can be seen from the GPS reporting area of the Data Tab screen. By moving to
the Plot Tab, the user can view real time data being acquired and recorded by
the System. The dot trail being generated on a computer screen in the Plot Tab
indicates the route being traveled. This Dot Plot is color coded to give the
operator a visual understanding of the dispersion of data for signal strength and
other measured parameters during a data collection period.
Data Collection Window
Follow the test procedure suggested and complete the first 1 to 2 miles (1.6 –3.2
km) of travel. Stop the vehicle at a convenient roadside location. After pulling off
10
Drive Test Application Note
the road, select the STOP MEASUREMENTS button. In the Data Tab area of
the screen, information will no longer be written into the blue area of the display.
All other presentation areas except for GPS information, in the lower right corner,
will also remain unchanged. Move to the Plot Tab and review the complete route
traveled up to this point. This is done by viewing the colored dots representing
signal parameter information. The Dot Plot shows via a palette of colors the
results of collected data for any one parameter measured. Each parameter in
turn can be chosen for viewing. This is done from the right side of the Plot Tab
display area using the box named FOM (Figures of Merit). Using the drop down
arrow, select any of the FOM shown as available for the signal being measured
Static Data Collection
We next will begin the process of collecting signal coverage data at the first
stationary location. Return to the Data Tab. Since we have already selected the
STOP MEASUREMENTS button, at the moment, the System is idle. Thus, it is
not collecting data. Click the down arrow of the Job box and select the WWWSTATIC Job. You are now ready to begin collecting a new set of data to be
stored in a separate and unique data file (www-static.dto). You may want to
change receiving antennas and select, for example, a tuned dipole mounted on a
tripod at 30 foot of elevation. Position this new antenna and adjust it as desired.
You may view the received signal by going to the Pull Down Menu, select View
and then choose Spectrum Monitor. This brings up a Swept Spectrum display
of the signal being measured. Click on the Live button to view the signal being
received with the new antenna. This display can be viewed as desired before
signals are recorded to data files.
After the antenna is correctly adjusted, revert to the Data Tab and click the
SAMPLE button. Selecting the SAMPLE button will assure the user that all
desired information is being received and the System is ready to record properly
into the new data file (the STATIC data file). The sampled data will appear both
in the blue screen area and the device status boxes at the bottom of the screen
but will not be written into the output file. When ready click the RECORD ONCE
button. This will take one set of measurements. (Once again the operator is
given a choice of typing in a comment.) The data captured will be recorded into
the data file for stationary measurements. Choose one set of measurements only
or take three or four sets at this one fixed location.
Ongoing Measurements
Upon completion of this measurement period at the fixed location, change over to
the antenna used earlier. The one used in the Dynamic measurement routine.
From the Data Tab select the original Job name “WWW-Dynamic.” Add more
measured data to this job by selecting RECORD CONTINUOUS. As this choice
is made, begin traveling the next segment of the predetermined route. This is the
second leg of the drive test.
The next set of moving measurements may extend for another 2 miles (3.2KM).
After traveling this distance pull off the road and stop once again. At this
11
Drive Test Application Note
roadside stop, the operator will click STOP MEASUREMENTS. He/she will
reattach the antenna used in the stationary test, select the job named WWWSTATIC and take a second set of data parameter measurements at this new
stationary location.
It can be seen this entire process can be repeated for as long as is desired or
until the user completes the predetermined route chosen for the Dynamic Drive
Test loop.
Spectrum Display of DTV Signal
RF Parameters
Spectrum Display and Decoder
Display of DTV Signal
Remember, a given data collection session can be stopped at any time by
selecting the STOP MEASUREMENTS button. The same test session can then
be restarted immediately or the operator may choose to add to a Job days or
weeks later. In this way data is added to the an existing job file simply by calling
up the correct earlier defined Job name and beginning the recording session
once again. In addition to this, one job can be stopped, the user can move to a
second job for a short period and then return the first job. This is the procedure
suggested above when describing performing both a WWW-Dynamic and WWWStatic job both during the same day.
After the Drive Test
The typical Drive Test procedure will usually call for the operator to complete a
chosen test route and return to the starting point of the drive. Upon completion of
the test procedure, turn off the Drive Test System. Remove the System from the
vehicle and carry it into the laboratory. To do this close the Drive Test
Application and shut down the Windows operating system on the PC. Turn off
the entire System including the Field Strength Meter or Decoder if installed and
unplug the System from the 12VDC-power source.
Inside the laboratory the operator can once again power up the Drive Test
System by removing the power cord from the Power Inverter in the back of the
black pop-up case. Plug the AC power cord into an appropriate wall socket.
Once again turn on the laptop PC, allow Windows to boot and the laptop to come
12
Drive Test Application Note
to its Windows desk top screen display. Double click on the Drive Test Icon
and wait while the Drive Test Application is launched. The Application will sense
that the Field Strength Meter is not active and will ask what steps the user wants
to take Abort, Retry or Ignore. Select the option Ignore. The Drive Test
Application will complete the launch process. From the Data Tab, select the
moving drive test just performed: WWW-Dynamic. Move to the Plot Tab and
view the complete map created by the data taken during the drive. The Dot Plot
generated can be stored as a .jpg file by clicking SCREEN CAPTURE button in
the Drive Test toolbar. This option is available while taking data in the field as
well as back in the laboratory. SCREEN CAPTURE is also available from most
other screens in the Application. The feature is especially convenient in the field
when needing to record the Spectrum Display screen.
Colored Plot of Signal Parameters over Area Map
The operator can use all the features and screen options in the laboratory just as
in the field. He/she can view dot plot generated from data stored in either Job.
All Figure of Merit plots available for the type of signals measured can be created
at this time. Screen captures of these dot plots including colored plots over road
maps are very effective when used to analyze coverage. Formal presentations
using these captured images as illustrations are especially useful in conveying
service area coverage results.
13
Drive Test Application Note
More in depth information is available from the data files. Data within these
comma-delimited files can easily be viewed and examined in detail. This can be
done directly within the Application from the Data Tab area. Use the View button
to examine all data stored in the data file. Data can also be examined and
exported into other applications for careful analysis and viewing. Use the Export
button to generate simple comma delimited text files with column headings. One
file for each frequency measured. Click the Export button in the DriveTest tool
bar. A list of measured frequencies appears. Double click on the frequency you
would like export data for. Select “Generic” under translation type. A list of
exportable parameters appears on the left side of the Export window. Double
click on the parameters you wish to export. They will move to a list on the right
side of the window. Click Finish. This will generate the requested text file, then
ask if you’d like to generate another file for another frequency. Select Yes if you
want to export data for more frequencies, No if done. If our job was WWWDynamic, the frequency of interest was 599 MHz the frequency name was KJOY
and the signal type was 8VSB, the exported text file would be
C:\DT_Output\WWW-Dynamic\WWW-Dynamic,599.000000,KJOY,8VSB,Gen.txt
To open this file with Excel, start the Excel application, from the File menu select
Open. Browse to C:\DT_Output\WWW-Dynamic. Under File Types select “All
Files” you will see the file WWW-Dynamic,599.000000,KJOY,8VSB,Gen.txt
appear in the file list box, double click on it. A Text Import Wizard screen
appears, click on the Delimited option button then click Next. In the Delimiters
box click the “Comma” check box, then click Next, then click Finish. The data is
now in Excel and can be viewed, studied, and manipulated. It can also be stored
as an Excel .xls file that may be useful in importing the data into yet other
applications.
Conclusion
It can be seen from the above step by step process how an operator can quickly
and easily prepare for and then actually generate a comprehensive set of RF
Signal Coverage Measurements for a specific service area. Initial review of
signal coverage can be done while still in the process of performing the drive
testing. Post coverage analysis and generation of maps & reports are a
straightforward and simple task. If more data collection is found to be needed,
additional measurements can be added to previously taken data without any
additional file manipulation or other complex issues.
Signal coverage measurements no longer need to be a one and only one time
event. Using Z Technology’s equipment, drive tests of a broadcaster's signal
coverage can be performed before during and after antenna or transmitter
changes.
All Z Technology Drive Test Systems are designed for fast yet accurate signal
coverage measurement and analysis. Engineers and managers will find having
14
Drive Test Application Note
effective and accurate test results with Z Technology Drive Test Systems an
indispensable addition to station operations.
Each System is a complete data collection, analysis & storage package. It is self
contained providing not only data acquisition but signal coverage mapping, drill
down capability and real time spectrum display monitoring. All these features
make signal coverage analysis straightforward and easy to perform.
15