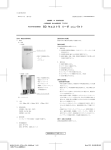
1
EconExpert-DG Users Manual – Copyright 2001 - 2005 CCl EconExpert Model the Future -DGBY: A “ Universal ” Financial Pro for ma TM TM User’s Manual for the EconExpert-DG Financial Proforma For the Economic Evaluation of Distributed Generation, Combined Heat and Power, Energy Savings and Other Inside-the-Fence/Retail Energy Projects Prepared by: Competitive Energy Insight, Inc. Tel ) 858 – 566 – 0221 Fax) 858 – 566 - 0287 Email) [email protected] Website) http://www.CEInsight.com Revised 7/14/03 Page 1 EconExpert-DG Users Manual – Copyright 2001 - 2005 (Page Intentionally Left Blank) Revised 7/14/03 Page 2 EconExpert-DG Users Manual – Copyright 2001 - 2005 Important Notices to Users of EconExpert-DG Copyright Notice The EconExpert-DG Financial Model and its accompanying documentation are protected by copyright law and international treaties. The EconExpert-DG Model, documentation, and reports generated by the model include prominently displayed Copyright Notices. Unauthorized use, modification, reverse engineering, reproduction or distribution of the EconExpert-DG Model, or any portion of it, may result in severe civil and criminal penalties and will be prosecuted to the maximum extent possible under the law. If you are a licensed user, you are free to distribute printed reports and charts, as well as to provide others with electronic copies of EconExpert-DG, if such reports or electronic copies are generated by the EconExpert-DG Model's Command Menu and contain the Copyright Notices included with the EconExpert-DG Model. You may also provide saved electronic copies of the EconExpert-DG model to others but such copies will not function properly on unlicensed computers unless the Authorized License Codes are provided by Competitive Energy Insight, Inc. Warning Regarding Changing of Your Computer’s Clock If you make changes to the setting of the clock on your computer, particularly if you set the clock backwards after you have installed EconExpert-DG or forwards beyond the end of your authorized license period, an error will be produced when the EconExpert-DG Model is opened. While Excel can be closed and reopened normally, EconExpert-DG will not function properly if it is reopened after such invalid clock settings have been made. It is highly recommended that you maintain your Computer Clock Settings at the current date and time whenever you plan to or have opened the EconExpert-DG Model. If you encounter a problem related to the setting of your Computer Clock, please contact CEI to discuss measures to repair your valid installation of the EconExpert-DG Model. Revised 7/14/03 Page 3 EconExpert-DG Users Manual – Copyright 2001 - 2005 Warning Regarding Use of EconExpert-DG with Macros Enabled In order to properly install and use EconExpert-DG, the “Macros Enabled” option for Microsoft Excel MUST be selected. The model will not function properly without Macros Enabled. Microsoft Excel Versions 2000 and later include a Security Setting that can prevent the user from opening spreadsheets that contain macros. If this Security Setting is set the HIGH, then you will not be permitted to open EconExpert-DG (or any other spreadsheet) with the Macros functioning. Prior to opening EconExpert-DG, you may want to check this setting on your version of Excel. To do so select: Tools - Macro - Security from the Excel Command Menu. On the Security Level Tab, the setting selection should be MEDIUM or LOW. Product Warranty and Warranty Limitations Users of EconExpert-DG hereby indemnify Competitive Energy Insight, Inc. against any and all problems, damages, liabilities or claims, or other violation that might arise in association with any use of the EconExpert-DG Model by the Licensee. Competitive Energy Insight, Inc. makes no warranties or representations with respect to the accuracy or fitness-for-purpose with respect to the use or application of the Model except that Competitive Energy Insight will make reasonable efforts to correct defects in the Model after they are identified and will promptly provide paid Licensees with updates containing such corrections when they are available. These reasonable efforts to correct defects in the Model do not apply to Derivative Works developed by Users of the Model. CEI assumes no responsibility for or obligation relative to the performance of or defects in Microsoft Excel. EXCEPT FOR THE WARRANTIES AND REPRESENTATIONS EXPRESSLY SET FORTH HEREIN, COMPETITIVE ENERGY INSIGHT, INC. DISCLAIMS ANY AND ALL WARRANTIES AND REPRESENTATIONS, EXPRESS OR IMPLIED, WITH RESPECT TO THE MODEL AND ITS CONFORMITY TO ANY SPECIFICATIONS OR DESCRIPTION, INCLUDING WITHOUT LIMITATION ANY IMPLIED WARRANTIES OF MERCHANTABILITY, FITNESS FOR A PARTICULAR PURPOSE OR THAT THE MODEL OR THE RESULTS THEREFROM SHALL BE ERROR FREE. EconExpert-DG Windows EconExpert's normal mode is to have two Windows of the model available to the user. These two Windows will be identified by Program Icons at the bottom of your Windows Desktop screen. You may use this feature to view multiple sections of the model at the same time. For example, you can have the Global Inputs Table open in one window and a Operating Expenses Table open in a second window. This would allow you to follow changes in the resulting cost calculations as you change inputs. Please note that these two windows are simultaneous views into the same EconExpert Spreadsheet and do not represent separate copies of the model. If desired you may add additional windows, but if you close one of the EconExpert Windows, in certain circumstances the model will require you to restore the window you closed (i.e. to have two windows available). Revised 7/14/03 Page 4 EconExpert-DG Users Manual – Copyright 2001 - 2005 (Page Intentionally Left Blank) Revised 7/14/03 Page 5 EconExpert-DG Users Manual – Copyright 2001 - 2005 Table of Contents Important Notices to Users of EconExpert-DG ...........................................................................................................3 List of Figures .................................................................................................................................................................8 I) Introduction and Overview of the EconExpert-DG Model ..............................................................................12 II) How to Obtain or to Extend a Subscription to EconExpert-DG ...................................................................15 III) System Requirements.........................................................................................................................................18 IV) Getting Started – Installing EconExpert-DG ..................................................................................................19 V) Features of the EconExpert-DG Model............................................................................................................28 A) The EconExpert-DG On-Line Tutorial .........................................................................................................28 B) 1) 2) 3) 4) 5) 6) The EconExpert-DG Command Menu..........................................................................................................29 NAVIGATE ..................................................................................................................................................30 PRINT ...........................................................................................................................................................31 SENSITIVITIES ...........................................................................................................................................33 TORNDADO DIAGRAMS ..........................................................................................................................35 UTILITIES....................................................................................................................................................38 EconExpert-DG On-Line HELP ...................................................................................................................53 C) 1) 2) 3) 4) 5) 6) 7) 8) 9) 10) 11) 12) 13) 14) 15) 16) 17) 18) 19) 20) 21) 22) Worksheet Tabs.............................................................................................................................................55 License ..........................................................................................................................................................59 Title ...............................................................................................................................................................60 Status.............................................................................................................................................................60 Sensitivities ...................................................................................................................................................62 Project Summary...........................................................................................................................................63 Monthly Data ................................................................................................................................................64 Simplified Inputs...........................................................................................................................................66 Table 1 Project Global Inputs .......................................................................................................................69 Table1C Annual Inputs .................................................................................................................................72 Table 2 Summary .........................................................................................................................................76 Table 3 Construction .....................................................................................................................................77 Tables 4 Operating Costs ..............................................................................................................................78 Table 5 Debt Service or Lease ......................................................................................................................79 Table 6 Revenues & Savings ........................................................................................................................81 Table 7 Cash Flow ........................................................................................................................................82 Table 8 Returns .............................................................................................................................................82 Table 9 Financials .........................................................................................................................................82 Table 10 Cents per kwh.................................................................................................................................83 Table 11 Depreciation ...................................................................................................................................83 Graphs Sensitivity 1 - 4.................................................................................................................................84 Graphs Tornado 5..........................................................................................................................................84 Graphs Current Case 6 - 7............................................................................................................................84 Revised 7/14/03 Page 6 EconExpert-DG Users Manual – Copyright 2001 - 2005 D) 1) 2) 3) 4) 5) Inputs to the EconExpert-DG Model ............................................................................................................85 Discussion of Individual Inputs to Table 1 Project Global Inputs ................................................................86 Simplified Inputs.........................................................................................................................................115 Table 1C Project Annual Inputs..................................................................................................................118 Monthly Data ..............................................................................................................................................135 Time-of-Use Wizard ...................................................................................................................................145 E) Saving EconExpert-DG Spreadsheets.........................................................................................................164 1) Saving “Fully Functional” Copies of the Model.........................................................................................164 2) Creating a “Values-Only” Copy of the EconExpert-DG Model That You Can Share with Others Who Don’t Have a License.......................................................................................................................................166 F) Sensitivity Analyses ....................................................................................................................................167 G) Tornado Diagrams.......................................................................................................................................171 H) Customizing EconExpert-DG .....................................................................................................................176 Appendices ..................................................................................................................................................................177 1. A) EconExpert-DG Software License Agreement ...........................................................................................177 Comparing EconExpert Files and Identify / Quantify Differences Between Cases....................................180 2) Glossary of Terms .......................................................................................................................................186 VI) 1) 2) 3) 4) 5) 6) 7) 8) Special Insert - Table 1P – Partner Return Calculations .............................................................................191 Partnership Overview and Disclaimer.........................................................................................................192 Defining Partners ........................................................................................................................................192 Partnership Financial Statements ................................................................................................................194 Allocations ..................................................................................................................................................195 Cash Distributions Options .........................................................................................................................196 Cash Distribution Basis...............................................................................................................................198 Guaranteed Payments..................................................................................................................................198 Glossary ......................................................................................................................................................199 Revised 7/14/03 Page 7 EconExpert-DG Users Manual – Copyright 2001 - 2005 List of Figures How to Obtain a License Figure 1 – How to Obtain an Authorized Subscription to EconExpert-DG ..............................................................16 Figure 2 – License Authorization Screen Yes/No ....................................................................................................16 Figure 3 – Extension Code Screen.............................................................................................................................16 Figure 4 – Enter User Name for New License ..........................................................................................................17 Figure 5 – Enter Company Name for New License...................................................................................................17 Getting Started Figure 6 – EconExpert-DG Greeting Screen .............................................................................................................17 Figure 7 – Microsoft Excel Enable Macros Screen ...................................................................................................20 Figure 8 – EconExpert-DG Successful Installation Notice .......................................................................................21 Figure 9 – EconExpert-DG Copyright Notice Screen ...............................................................................................21 Figure 10 – Notice on Sharing EconExpert-DG .......................................................................................................22 Figure 11 – How to Obtain the User’s Manual..........................................................................................................23 Figure 12 – Notice Regarding the EconExpert-DG License Agreement...................................................................23 Figure 13 – The EconExpert-DG License Agreement Sheet.....................................................................................24 Figure 14 – Acknowledging or Declining the EconExpert-DG Software License....................................................25 Figure 15 – License Accepted Notification / Save to New Filename........................................................................25 Figure 16 – Notice Installation is Completed - Do You Want to View the Tutorial? ...............................................26 Figure 17 – The EconExpert-DG Title Screen ..........................................................................................................27 Figure 18 – First Window in the EconExpert-DG Tutorial .......................................................................................28 Figure 19 – The EconExpert-DG Command Menu...................................................................................................30 Sensitivities and Tornado Diagrams Figure 20 – Inputting the Term of Sensitivity Analyses or Tornado Diagrams ........................................................33 Figure 21 – Example of Sensitivity Analysis Graph .................................................................................................34 Figure 22 – Inputting the Term of Sensitivity Analyses or Tornado Diagrams ........................................................35 Figure 23 – Tornado Diagrams User Input Form ......................................................................................................36 Figure 24 – Sample Tornado Diagram ......................................................................................................................37 Pop-Ups and Holding Bins Figure 25 – Pop-Up NPV, IRR and Payback Summary ............................................................................................39 Figure 26 – Example Display of Current Contents of Holding Bins.........................................................................40 Figure 27 – EconExpert-DG’s Default Assumptions Associated with the Simplified Inputs Sheet .........................50 Using the Model Figure 28 – Instructions for Data Import Between Copies of EconExpert-DG.........................................................52 Figure 29 – Example of EconExpert-DG’s On-Line Help Comments ......................................................................54 Figure 30 – EconExpert Worksheet Tabs..................................................................................................................55 Figure 31 – EconExpert License Agreement.............................................................................................................59 Figure 32 – Title Sheet ..............................................................................................................................................60 Figure 33 – Status Sheet ............................................................................................................................................61 Figure 34 – Sensitivities Sheet ..................................................................................................................................62 Figure 35 – Project Summary Sheet ..........................................................................................................................63 Figure 36 – The Monthly Data Table ........................................................................................................................64 Revised 7/14/03 Page 8 EconExpert-DG Users Manual – Copyright 2001 - 2005 List of Figures - Using the Model Continued Figure 37 – EconExpert-DG’s Default Assumptions Associated with the Simplified Inputs Sheet .........................67 Figure 38 – The Simplified Inputs Sheet...................................................................................................................70 Figure 39 – Screen Shot of Table 1 Project Global Inputs ........................................................................................69 Figure 40 – Screen Shot of Table 1C Project Annual Inputs.....................................................................................72 Global Inputs Figure 41 – Screen Shot of Table 1 .........................................................................................................................86 Figure 42 – Switches ................................................................................................................................................90 Figure 43 – GNP Escalation Rate and Real Escalation Rates .................................................................................91 Figure 44 – Equity and Debt Percentages.................................................................................................................91 Figure 45 – Project Schedule....................................................................................................................................92 Figure 46 – Quarterly Performance Data Inputs.......................................................................................................93 Figure 47 – Other Revenues ...................................................................................................................................103 Figure 48 – Variable O&M ....................................................................................................................................104 Figure 49 – Fixed O&M .........................................................................................................................................104 Figure 50 – Property Taxes and Insurance .............................................................................................................105 Figure 51 – Development Costs .............................................................................................................................105 Figure 52 – Engineering and Construction Phase Costs.........................................................................................107 Figure 53 – Salvage Value at the End of the Project Life ......................................................................................108 Figure 54 – Financing Terms..................................................................................................................................109 Figure 55 – Operating Lease ..................................................................................................................................111 Figure 56 – Sources of Capital Summary...............................................................................................................111 Figure 57 – Depreciation for Book and Cash .........................................................................................................112 Figure 58 – Income Taxes and Investment Tax Credit...........................................................................................113 Figure 59 – The IRR Guess ....................................................................................................................................114 Simplified Inputs Figure 60 – EconExpert-DG’s Default Assumptions Associated with the Simplified Inputs Sheet .......................116 Figure 61 – The Simplified Inputs Sheet.................................................................................................................117 Annual Inputs Figure 62 – Screen Shot of Table 1C Project Annual Inputs...................................................................................118 Figure 63 – General Inflation Rate (GNP) for Revenues and Expenses..................................................................121 Figure 64 – Forced Outage Rate..............................................................................................................................125 Figure 65 – User Defined Additional Revenue Sources (1, 2 and 3) ......................................................................131 Figure 66 – User Defined Additional Expenses (1, 2 and 3)...................................................................................131 Figure 67 – Debt Service or Capital Lease, Custom Principal Payments or Interest Rates.....................................132 Monthly Data Figure 68 – The Monthly Data Table ......................................................................................................................135 Time-of-Use Wizard Figure 69 – Legend..................................................................................................................................................146 Figure 70 – TW1 Site Energy Consumption and TOU Prices WITHOUT DG ......................................................148 Figure 71 – TW1A, TW1B and TW1C Projected Site Displaceable Chiller and Non-Chiller Consumption (“Host’s Appetite”)..........................................................................................................................................150 Figure 72 – TW1D - Aggregated Cost of Electric Energy Purchased fm Utility, c/kwh (WITHOUT DG) .......151 Figure 73 – TW2 Time-of-Use Energy Price Wizard WITH DG Operational........................................................152 Figure 74 – TW2A - PROJECTED DG Plant Capacity Factor...............................................................................154 Figure 75 – TW2B - Projected Displaced Electric Chiller Consumption, 1000 kwh/period...................................155 Revised 7/14/03 Page 9 EconExpert-DG Users Manual – Copyright 2001 - 2005 List of Figures - Time-of-Use Wizard Continued Figure 76 – TW2C Projected Aggregated Cost of Electricity Purchased from Utility with DG Operational........156 Figure 77 – TW3 - Time-related Demand Charge Wizard – Site WITHOUT DG .................................................157 Figure 78 – TW3A - Projected Time-related Demand Charges WITHOUT DG, $................................................159 Figure 79 – Time-related Demand Charge Wizard – Site WITH DG .....................................................................160 Figure 80 – TW4A - Projected Time-related Demand Charges WITH DG, $ .......................................................162 Figure 81 – Table TW4B – Projected Savings in Time-Related Demand Charges.................................................163 Other Features Figure 83 – The IRR Sensitivity Term (Input to Table 1) .......................................................................................168 Figure 84 – Sensitivity Tables – Input of Sensitivity Increments............................................................................169 Figure 85 – Graphs Produced from Sensitivity Analyses........................................................................................169 Figure 86 – Inputting the Term of Sensitivity Analyses or Tornado Diagrams ......................................................171 Figure 87 – Tornado Diagrams Data Input Sheet ....................................................................................................173 Figure 88 – Sample Tornado Diagram ....................................................................................................................175 Figure 89 – Example of Free-Form Sections at the Bottom of Each Sheet.............................................................176 Figure 90 – Comparing Data Files – Highlighting of Inputs that Changed.............................................................181 Revised 7/14/03 Page 10 EconExpert-DG Users Manual – Copyright 2001 - 2005 (Page Intentionally Left Blank) Revised 7/14/03 Page 11 EconExpert-DG Users Manual – Copyright 2001 - 2005 I) Introduction and Overview of the EconExpert-DG Model Thank you for choosing EconExpert-DG, the first “Truly Universal” Financial Proforma for the Distributed Generation (DG), Combined Heat and Power (CHP) and Energy Service Company (ESCO) Industries. EconExpert-DG is a sophisticated and highly flexible spreadsheet developed in Microsoft Excel®1 to be used for performing financial analysis of “Inside-the-Fence” Distributed Generation and Energy Savings projects using virtually any technology type and in any country in the world. EconExpert-DG now includes the Time-of-Use Wizard, allowing users to perform analyses of time-of-use related operations and tariff data, further expanding the model’s range of capabilities. The EconExpert-DG model, developed by Competitive Energy Insight, Inc. (CEI) a California Corporation with offices in San Diego, is a copyrighted product that has evolved since 1997 as a tool first used extensively in CEI’s private consulting practice in support of Fortune 500 clients to evaluate opportunities for development or acquisition of power generation projects. Now, EconExpert-DG has been transformed into a Universal Tool that can be used efficiently and effectively by project developers, project owners and hosts, banks, equipment suppliers, consultants and others in the Distributed Generation industry, to study and make informed decisions on the economic viability of Distributed Generation and Cogeneration investments. The beauty of EconExpert-DG is its flexibility. The key to the model is its architecture which allows you to study any project through the model’s input sheets. By specifying the conditions of the host’s needs, the DG plant design, the utility tariff, fuel pricing, the project schedule, construction and operating costs, project financing and income tax considerations, virtually any Inside-the-Fence DG / CHP / ESCO project can be fully analyzed. Then, it becomes easy to quickly perform sophisticated sensitivity analyses to study how the economic viability of that project might be impacted by changes in future market conditions. Built-in menus, automated functions, sensitivities, tornado diagrams, graphics and on-line help features will further assist you in evaluating opportunities and producing reports that clearly and accurately support the conclusions you reach. Distributed Generation, Combined Heat and Power and Energy Savings Projects (DG/CHP/ESCO) are complex business and technical deals and can not be over simplified using Simple Payback analysis. Critical economic considerations associated with virtually every DG/CHP/ESCO project that must be fully understood in order to be successful and profitable include: - - The Host's Appetite for Electric & Thermal Energy Offsets The Profiles of the Host’s needs. The Operating Characteristics and Performance of the New DG/CHP/ESCO Facilities. The Applicable Utility Electric and Gas Tariff(s), including energy charges, demand charges, time-of-use charges, stand-by charges, and other fees. Sometimes multiple tariffs may apply. Time-of-Use Analysis Fuel Pricing Risk. 1 Microsoft Excel® is a registered trademark of the Microsoft Corporation. Revised 7/14/03 Page 12 EconExpert-DG Users Manual – Copyright 2001 - 2005 - The Capital, Operating and Maintenance Costs of the New DG/CHP/ESCO Facilities. Outage Considerations. Incentives and Rebates available to DG/CHP/ESCO. The Project’s Timing and Schedule Considerations. Financing Options including Debt Equity, Capital Leases and the benefits of Operating Leases. Income Taxes including Allowances including production and investment tax credits under the Energy Policy Act of 2005. The economic structure and terms of Power Purchase Agreement (PPA), Fuel Supply Agreements (FSA), Maintenance Agreements and other project specific agreements. The Sensitivities, Risks and Opportunities associated with future markets & changes in markets. And More! With EconExpert-DG you can fully quantify, evaluate, understand, communicate, capture the benefits in and manage the risk associated with all of these critical considerations, allowing you to close more deals, to make more profit on the deals you close and to assume less risk! EconExpert-DG will allow you to model DG/CHP/ESCO projects from the perspective of ANY party to the deal including the client/host, the developer, the bank or leasor, the equipment supplier or the fuel supplier, allowing you to fully quantify and understand the economic impacts of fuel prices, utility tariffs and the customer’s demand profiles for electric and thermal energy. By integrating these issues, EconExpert-DG allows you to fully understand and optimize the project economics, maximizing profit and minimizing risk. And now, using our POWERFUL Tariff Model you can fully understand and model the economics of any Utility Tariff or combination of tariffs in the U.S, including detailed Special Conditions. By fully understanding and quantifying the complete economics from the perspective of every participant in the deal not only will you be able to better focus on the right deals, to better quantify and communicate the deal to the customer, and to better manage risk but most importantly you will more fully capture the value in the project without leaving money on the table! This User’s Manual has been developed to assist you in getting started using EconExpert-DG , and to provide supporting documentation in the event that questions might arise as you use it. The User’s Manual is complemented by On-Line Help and an On-Line Tutorial that can be accessed directly from the EconExpert-DG Model. Founded in 1997, Competitive Energy Insight provides business and project development support to the Power Generation and Distributed Generation Industries with the following areas of expertise: • • • • • • • Custom Model Development Project Screening and Analysis Facilities Siting Acquisitions Analysis Due Diligence Environmental Permitting Support Development and Negotiation of Agreements including: o Terms Sheets o Project Financing Agreements Revised 7/14/03 Page 13 EconExpert-DG Users Manual – Copyright 2001 - 2005 o o Power Purchase Agreements (PPAs) Engineering, Procurement and Construction Agreements (EPC) For additional information on EconExpert-DG or CEI and the services we provide, please visit http://www.CEInsight.com our website at Revised 7/14/03 Page 14 EconExpert-DG Users Manual – Copyright 2001 - 2005 II) How to Obtain or to Extend a Subscription to EconExpert-DG For those who are interested in purchasing a subscription to EconExpert-DG, you can do so by contacting Competitive Energy Insight via email or the phone number shown on the previous page. Purchasers will be provided with 30 days of free technical support, and access to all updates issued during the term of their Software License. Rates for a subscription can be quoted by CEI. All users of the EconExpert-DG model will be required to acknowledge their acceptance of the EconExpert-DG Software License Agreement in order to fully enable the model. Please see the Getting Started Section for an additional description on how to accept the Software License. A copy of the License is included on the License Sheet in the Model and in the Appendix of this User’s Manual. If you open EconExpert-DG when your current license is within twenty-one days of expiration the model will notify you that your license is about to expire. The EconExpert-DG HELP Menu includes an automated feature that allows you to extend the period of a license by entering a License Extension Code which can be provided by CEI. Don’t wait for your license to expire. By contacting CEI and entering the necessary codes, your license term can be extended at any time. In the event that your installation of EconExpert-DG experiences problems, this feature may also be used to revalidate a current license. If you forward copies of EconExpert-DG to others who do not have an active license, the model you send them can be enabled as a “Fully Functional” Model by CEI using these License Codes. If others attempt to open a model and they are not unauthorized, they will be advised how to contact CEI to obtain the needed codes. Without these codes, unauthorized copies of the model will not function properly. Once the authorized codes are entered, all copies of EconExpert-DG will function on the authorized computer during the authorized license period. From the EconExpert-DG Command Menu, licensed users can create a “Values-Only” copy of the model that can be shared with others and viewed on any PC, including PC’s that are not licensed to use the model. These “Values-Only” copies must be created using the EconExpertDG Command Menu to function properly. Much of the Command Menu functionality will be preserved in the “Values-Only” copy allowing others to easily print reports and charts for the case that has been provided to them. A “Values-Only” copy will not allow users to change inputs or to evaluate any new cases. Importantly, if you purchase an appropriate subscription to the EconExpert model, any copies of the model that you save will be recoverable as values-only versions even after your license expires. The Initial Installation File you receive from CEI will only enable the use of the model for a limited period, usually 30 days. If you have purchased an extended period license to use the EconExpert-DG model, contact CEI after performing your initial installation. CEI will provide Revised 7/14/03 Page 15 EconExpert-DG Users Manual – Copyright 2001 - 2005 you with the necessary License Extension Codes to fully enable your use of the model for the subscribed license period. To access the License Enable / License Extension feature, first contact CEI by telephone. Then from the UTILTIES menu select: Extend my License Enable or Extend my EconExpert-DG License Next, the following screen will appear: Figure 1 – How to Obtain an Authorized Subscription to EconExpert-DG Provide CEI with this information over the phone and CEI will provide you with the necessary License Extension Codes, which are specific to your system. Select OK and the following screen will appear: Figure 2 - License Authorization Screen Yes/No If you have contacted CEI to obtain the Extension Code select YES. You will then be prompted by the following screen: Figure 3 – Extension Code Screen Revised 7/14/03 Page 16 EconExpert-DG Users Manual – Copyright 2001 - 2005 Enter the code provided to you by CEI. The License Extension Code is comprised of five sets of 5-Character Case Sensitive Segments, each separated by a single space. THE CODE IS CASE SENSITIVIVE AND MUST MATCH THE AUTHORIZED CODE EXACTLY. IF IT DOES NOT MATCH, YOU WILL BE PROMPTED UP TO 3 TIMES FOR THE CORRECT CODE. After the correct code is entered, if the model was transferred by someone else, you will see the following screen: Figure 4 – Enter User Name for New License Enter your User Name, usually your First Name and Last Name. The User Name that you enter must be at least 8 characters long. The name you enter will appear on the Program Greeting each time you open EconExpert-DG. After entering your name, select OK and the following screen will appear: Figure 5 - Enter Company Name for New License Enter the name of your Company. This Company Name will appear on all printed reports generated by the model. After entering your Company Name select OK. You will then see the following greeting acknowledging successful extension of the license. Figure 6 – EconExpert-DG Greeting Screen Select OK and EconExpert-DG will initialize and be ready for use. Other previously saved copies of EconExpert-DG should perform normally during the new license term. Revised 7/14/03 Page 17 EconExpert-DG Users Manual – Copyright 2001 - 2005 III) System Requirements EconExpert-DG is a Microsoft Excel® spreadsheet that has been complemented with sophisticated Visual Basic macros to add flexibility, ease-of-use and functionality. While the spreadsheet will work effectively with a very wide variety of computer hardware, operating systems and versions of Microsoft Excel, the following minimum system requirements are recommended: Hardware • • • • • • A Pentium III, Pentium IV (or higher) processor or the equivalent. 32 MB or more of Random Access Memory. If it is desired to print very large (multiple-table) reports from the model, it is recommended that you have your system configured with at least 2MB of printer spooling memory. This can be as network or computer RAM or as a memory module on the printer. A Graphics-Capable Monitor with a setting of at least 800 x 600 Pixels and preferably 1024 x 768 Pixels A Graphics-Capable printer (Note: If you have a printer capable of printing to 11 x 17” paper, the model will accommodate that paper format in addition to 8 ½ x 11” paper.) At least 15MB of available storage on you C:\ hard drive. This memory is needed for the initial installation only. After the installation is completed, the model can be saved and operated on the installed PC from any local or network drive. Software • • • Microsoft Windows 95, Windows 98, Windows NT, Windows XP or Windows Millennium Operating System Microsoft Excel 2000 or Excel 2002 o Note: Due to memory management limitations in Microsoft Excel 97 and limitations in that versions memory handling capabilities, EconExpert-DG will not function properly with that software. Winzip®2 or the equivalent for decompressing the original files. Note that if requested the EconExpert-DG model and documentation can be provided as self-extracting .exe files that will not require the installation or use of WinZip to decompress the files. The model is not conventionally delivered this way as many Network Administrators will not allow .exe files as attachments to emails. It should be noted that while use of the EconExpert-DG software has been successfully demonstrated with the listed systems, the configuration of individual systems or networks might be a factor in the successful installation of this software. If problems arise, please contact CEI. 2 WinZip is a registered trademark of WinZip Computing, Inc. Revised 7/14/03 Page 18 EconExpert-DG Users Manual – Copyright 2001 - 2005 IV) Getting Started – Installing EconExpert-DG For a trial or paid subscription to EconExpert, the following EconExpert-DG file will be provided to you by CEI. The file can be transferred to you by email or can be downloaded (with approval codes) from our website. EconExpert-DG Installation File v.xxx [Your Name] [Your Company].Zip This is the file that contains the uninstalled EconExpert-DG Model. Installation Copies should ONLY be provided by CEI Inc. and under the terms of the License Agreement. Prior to installing the model, copy this file to your hard drive. EconExpert-DG Users Manual V.xxx.PDF From the CEI Website (http://www.CEInsight.com) you can download a free copy of the EconExpert-DG User’s Manual as a PDF file which can be viewed and printed using Adobe Acrobat. The file is named: EconExpert-DG Users Manual V.xxx.PDF It is possible that you received a previously installed copy of EconExpert-DG from another user, and that you would like to enable that copy of the model using License Codes provided by CEI. If this is the case, please refer to Page 15 of the User’s Manual for instructions on how to enable a previously installed model on a new user’s computer. Installation files are compressed using WinZip, a utility that compresses files for more efficient saving and transport via email or download from the Internet. To view the User’s Manual and to install EconExpert-DG, you must first decompress the files. If you already own WinZip, to do so please use the following steps: • Step 1: Copy the original .Zip (or .Exe files) to the desired location and sub-directory on your C:/ drive. Installation of the model MUST be initiated from your C: drive. If you have received .Zip files from CEI, and have previously installed WinZip, using My Computer or Windows Explorer locate the directory where you copied the files and right click on the .Zip files. To expand the files, select the WinZip option: Extract to folder [C]:\…\EconExpert-DG Installation File v [Your Name and Company] and Extract to folder [C]:\…\EconExpert-DG Users Manual v Where “\…\” is your directory path and [Your Name and Company] is the name of the user who is authorized for this installation file. THE MODEL MUST BE INSTALLED FROM YOUR C: DRIVE. Revised 7/14/03 Page 19 EconExpert-DG Users Manual – Copyright 2001 - 2005 If you have received Exe (auto extracting) files from CEI or the CEI Website, using My Computer or Windows Explorer locate the directory where you saved the files and double click on them to initiate expanding the files. The Initial Installation File you receive from CEI will only enable the use of the model for a limited period, usually 30 days. If you have purchased an extended period license to use the EconExpert-DG model, CEI will provide you with the necessary authorization codes to fully enable your use of the model for the subscribed license period. • Step 2: Start Microsoft Excel and use the File-Open command on the Excel Command Menu to select EconExpert-DG Installation File V.xxx.xls from the directory where the Installation File has been added. IMPORTANT NOTE: EconExpert-DG must be run with Macros Enabled. Microsoft Excel Versions 2000 and later include a Security Setting that can prevent the user from opening spreadsheets that contain macros. If this Security is set the HIGH, then you will not be permitted to open EconExpert-DG with the Macros enabled. Prior to opening EconExpert-DG, you may want to check this setting on your version of Excel. To do so select: Tools - Macro - Security from the Excel Command Menu. On the Security Level Tab, the settings selection should be MEDIUM or LOW. The MEDIUM Setting will continue to provide you with the warning message concerning spreadsheets that contain macros. Also, it is recommended that no other worksheets are opened when you install EconExpert-DG. If your security level setting is set to Medium as discussed above, Microsoft Excel will now provide you with a warning which is similar to: Figure 7 – Microsoft Excel Enable Macros Screen Select Enable Macros! Whenever you open EconExpert-DG , you MUST select the Enable Macros option to properly initialize the EconExpert-DG model. If this option is not selected, the model will not function properly! Revised 7/14/03 Page 20 EconExpert-DG Users Manual – Copyright 2001 - 2005 Step 3: The installation of EconExpert-DG will proceed. EconExpert-DG will now follow with the screens: Figure 8 – EconExpert-DG Successful Installation Notice EconExpert-DG will be saved to your C:\ Drive to store the installation settings for your use. This saved copy of the model will include all of the installation settings. When you reopen it you will not be required to repeat the installation process. Select OK and the following screen will appear: Figure 9 – EconExpert-DG Copyright Notice Screen Please read this Copyright Notice carefully. Note that this screen will also advise you of the current date and on what date your license to use the software will expire. Also note that the Recalculation Feature on Excel will be set to Automatic. This is the recommended setting for EconExpert-DG though if you prefer you can later reset the recalculation setting to Manual using the: Revised 7/14/03 Page 21 EconExpert-DG Users Manual – Copyright 2001 - 2005 Tools – Options – Recalculation option on the Excel Command Menu. If you set recalculation to Manual, it will be necessary for you to press F9 (Calculate) to re-enable EconExpert-DG after any time you save the model, as discussed below. Select OK again and you will see a notice about providing copies of EconExpert-DG to others. Figure 10 – Notice on Sharing Copies of EconExpert-DG and Reports Generated by EconExpert-DG with Others This is an Important Notice. You are permitted to send copies of the model to others but unless the model is converted to “VALUES ONLY” using the EconExpert-DG Command Menu, electronic copies will only function properly on others’ computers after they have received Authorization from CEI. Select OK and EconExpert-DG will be initialized. In the upper left-hand corner of the spreadsheet, the message will appear: EconExpert-DG is Initializing Please Wait The Initialization Procedure will occur every time that you open the model. EconExpert-DG will automatically check its setup to ensure that all of its internal settings are set correctly when you start work. Revised 7/14/03 Page 22 EconExpert-DG Users Manual – Copyright 2001 - 2005 • Step 4: If this is your first use of the model you will next see the following screens Figure 11 – How to Obtain the User’s Manual Finally, another VERY IMPORTANT one-time message. Figure 12 – Notice Regarding the EconExpert-DG License Agreement advising you that prior to using the model you must acknowledge that you accept the terms of the Software License Agreement. This is required to enable EconExpert-DG’s calculations. You will be required to acknowledge your Agreement with the Software License each time you install the model on an Authorized Computer and each time you renew your license to the model. Revised 7/14/03 Page 23 EconExpert-DG Users Manual – Copyright 2001 - 2005 Select OK and the following screen will appear: Figure 13 – The EconExpert-DG License Agreement Sheet The EconExpert-DG Software License is presented. If desired, you may print the license by clicking on either of the Print License buttons at the top of the Screen. If you read the license on your monitor, be sure to scroll down the screen and real ALL of the applicable license terms. A copy of the EconExpert-DG Software License is also included in the Appendix to the User’s Manual. Step 5: At the conclusion of the Software License, you will be provided with the option to ACCEPT or DECLINE the EconExpert-DG Software License Agreement. READ THIS LICENSE CAREFULLY as by accepting it you will be legally bound to its conditions. PLEASE NOTE THAT THE MODEL WILL NOT FUNCTION PROPERLY UNLESS YOU CHOOSE TO ACCEPT THE AGREEMENT! Revised 7/14/03 Page 24 EconExpert-DG Users Manual – Copyright 2001 - 2005 Figure 14 – Acknowledging or Declining the EconExpert-DG Software License If you ACCEPT the License, the following message will appear: Figure 15 – License Accepted Notification / Save to New Filename To record your acceptance of the License Terms. Select OK to continue. The model will again be saved to a new directory on your Hard Drive labeled C:\EconExpert Files\ Revised 7/14/03 Page 25 EconExpert-DG Users Manual – Copyright 2001 - 2005 • Step 6: After accepting the License, you will be asked if you would like to view the EconExpert-DG Tutorial. Figure 16 – Do You Want to View the Tutorial? Select YES if you would like to view the Tutorial, which is highly recommended for new users and will take about 10 – 20 minutes. If you elect not to view the Tutorial at this time, it can be accessed at any time from the EconExpert HELP option on the Command Menu. • Step 7 – The model has been fully initialized and is ready for use. All copies of EconExpertDG models that you save will be “Fully Functional” on Licensed Computers used by you or others, during the applicable License Period for that user. Note that copies of the spreadsheet will not work properly on computers that do not have licensed authorized installations. If you forward copies of the model to others who do not have an active license, or you try to use the model on another computer, that copy of the model can be enabled by obtaining the appropriate License Authorization codes from CEI. Once entered, the codes will fully enable the use of EconExpert-DG on that computer for the subject license period. Revised 7/14/03 Page 26 EconExpert-DG Users Manual – Copyright 2001 - 2005 You will now be transferred to the EconExpert-DG Title Screen. Figure 17 – The EconExpert-DG Title Screen • Step 8: The EconExpert-DG Command Menu will appear at the top of the screen. You are ready to go! To begin using the model, simply select the Click Here button to enter the spreadsheet. Remember that after saving the model, the Div!/0 notation will appear throughout the model. To enable EconExpert-DG, select: ENABLE MODEL Enable EconExpert from the EconExpert-DG Command Menu. Congratulations! You are now ready to use EconExpert-DG ! Final note: If your Display Setting in Windows is set at other than the setting of 1024 x 768 Pixels recommended for EconExpert-DG, a notice will appear during the installation, giving you the option to reset the display settings in Windows or to modify the Zoom settings in EconExpert-DG from the default value of “50%”. If you do not choose to change the EconExpert-DG Zoom settings when this message appears, you may do so later by selecting: UTILITIES Table Viewing Format Set Table Zoom [Setting] on the EconExpert-DG Command Menu. Revised 7/14/03 Page 27 EconExpert-DG Users Manual – Copyright 2001 - 2005 V) Features of the EconExpert-DG Model EconExpert-DG is equipped with a variety of specialized features to expand its functionality and to make it easy-to-use. Those features are fully described under the EconExpert HELP option on the command menu, and in the descriptions that follow. Note that individual cells in the EconExpert-DG Model also include detailed help comments that describe the purpose of the subject cell or table. The Help Comment feature can be enabled or disabled from the EconExpert-DG Command Menu as described later. A) The EconExpert-DG On-Line Tutorial EconExpert-DG includes an On-Line Tutorial that will guide you through the important features of the model. After accepting the terms of the EconExpert-DG License Agreement, you will be asked if you would like to view the Tutorial. The Tutorial may also be viewed at any time by selecting the Tutorial Option from the EconExpert HELP Menu. It is highly recommended that new users review the tutorial and the examples in the Appendix to this User’s Manual. If you select to view the Tutorial, it will be initiated with the window: Figure 18 – First Window in the EconExpert-DG Tutorial Select OK to proceed. The Tutorial will describe the following features of the model: Command Menus and their Sub-Menus Help Features Tips on Saving and Re-enabling the Model Inputs and Important Features in the Model Worksheet Tabs and Tables in the Model Tips on Customizing the Model Information on How to Enable or Extend Your License to Use the Model When viewing the Tutorial, you will be provided with options at various times to skip forward to a later section or to end the Tutorial. Also note that in order to view information hidden Revised 7/14/03 Page 28 EconExpert-DG Users Manual – Copyright 2001 - 2005 behind the various message boxes you may click on the message box and drag it to any location on the screen. B) The EconExpert-DG Command Menu EconExpert-DG includes a Custom Command Menu that appears on the Excel Menu Bar to the right of the Excel Help Option. The EconExpert-DG Command Menu provides you with access to and control of the EconExpert-DG Model's special functions and On-Line Help Features. The menu will be added to the Excel Menu Bar each time you open the model and will be deleted each time you close EconExpert. If Windows should lock up when EconExpert-DG is open, the EconExpert-DG Command Menu may be present when Excel is reopened, even though EconExpert-DG is not. If this occurs, open EconExpert-DG without any other spreadsheets opened. Then close EconExpert-DG and any extraneous menus will be deleted. The six options provided on the EconExpert-DG Command Menu are: NAVIGATE PRINT SENSITIVITIES UTILITIES EconExpert HELP ENABLE MODEL The Command Menu appears at the top of the EconExpert-DG screen as shown below: The various options in the Command Menu are described following the Figure. Revised 7/14/03 Page 29 EconExpert-DG Users Manual – Copyright 2001 - 2005 Figure 19 – The EconExpert-DG Command Menu 1) NAVIGATE As an alternative to selecting from the worksheet tabs (located on the bottom of the Excel Screen) and scrolling to a specific location in a worksheet, the NAVIGATE Menu provides you with a means for locating and viewing the specific inputs, and various tables and charts, in the EconExpert-DG Model. Options provided on this menu include: • • Global Inputs to Table 1. The Global Inputs Table is the only mandatory table in the model. To locate specific input categories, select from an alphabetical list of the Input Categories to Table 1. Global Inputs are inputs that typically apply over the life of the project or are entered as a single value and then escalated at a constant rate. Details associated with Table 1 Project Global Inputs are further described on page 86. Annual Inputs to Table 1C. The Annual Inputs Table is an optional table used to refine the setup that you have developed using Global Inputs. To locate specific input categories, select from an alphabetical list of Input Categories used in Table 1C Project Annual Inputs. Annual Inputs are inputs that apply in a single year during the life of the project. When entered, none-zero inputs or results generated using formulas in the Annual Inputs Table will override or will be added to results otherwise calculated using the corresponding Global Input. Details associated with Table 1C Project Annual Inputs are further described on page 118. Revised 7/14/03 Page 30 EconExpert-DG Users Manual – Copyright 2001 - 2005 • • • • • • • Monthly Data. Select from an alphabetical list of Input Categories used in the Monthly Data Sheet. The Monthly Data Sheet allows you to enter plant performance and forward pricing data in up to 12 monthly periods/year and then to convert that data to an equivalent quarterly format for use in EconExpert-DG’s Global or Annual Inputs Sheets. For a detailed explanation on the Monthly Data Sheet and how to use it, see page 64 and page 135. Simplified Inputs. The Simplified Inputs Table provides one-screen-view of all of the critical inputs to Table 1 Project Global Inputs. Inputs are entered in the shaded cells based on Annual Averages which can be transferred to the Global Inputs Sheet. You can locate a specific input by scrolling through the table. For a detailed explanation of the Simplified Inputs Sheet and how to use it, see page 115. Time-of-Use Wizard. The Time-of-Use Wizard allows you to more fully evaluate the time-of-use related pricing elements of individual utility tariffs. Using this tool in combination with the Table 1C Project Annual Inputs you can break each month down into block pricing periods (i.e. off-peak, mid-peak, on-peak, etc.) for the purposes of analyzing time-related energy and demand charges. The Time-of-Use Wizard is described in more detail on page 145. Results Tables. Select from a list of various Results Tables produced by the model. The Results Tables are also identified by the Worksheet Tabs shown at the bottom of the Excel screen. Descriptions of each of these tables and Worksheet Tabs are provided starting on page 76. Current Case Graphs. Select to view and edit the various charts (or Graphs) generated by EconExpert-DG for the current case that you have set up in the model. Descriptions of the Current Case Graphs sheets are provided starting on page 84. Tornado Tables or Graphs. Select to view the tables and graphs produced by EconExpert-DG that are used to generate Tornado Diagrams. You can view the results of the Tornado Analyses in table form, or in graphical form as described next. Additional discussion of the Tornado Diagrams and Tornado Tables is provided on page 171. Sensitivity Tables and Graphs. Select to view the Sensitivity Tables and to edit the increments used for the various automated Sensitivity Analyses performed by EconExpert-DG. You can view the results of the Sensitivity Analyses in table form, or in graphical form as described next. Additional discussion of the Sensitivity Input Tables is provided on page 62 and page 167. 2) PRINT The PRINT Menu provides you with options for printing Tables and Graphs generated by the EconExpert-DG model. Tables and graphs in the model can be generated in multiple formats, with options to print tables selectively or in various levels of summary detail. If desired, you can also create your own custom reports using the Excel File Page Setup Revised 7/14/03 and File Print Page 31 EconExpert-DG Users Manual – Copyright 2001 - 2005 Options, just as you would from any other spreadsheet. Please note that the EconExpert-DG Software License Agreement requires that you include the Copyright notice on any reports that you create. Options on the PRINT menu include: • Tables - Select this option to print reports of any of the inputs or results tables in the model to letter sized paper. Tables can be printed to 8 ½” x 11” or to 11” x 17” paper. • Current Case Graphs. Select this button to print the various “Current Case” graphs in the model. These graphs are located on the Worksheet Tabs Graphs Current Case 6 and Graphs Current Case 7. Results will be printed to 8 ½” x 11” paper. • Tornado Tables and Graphs. Print the Tables and Graphs that are generated each time you create a Tornado Diagram from the SENSITIVITIES menu. These graphs show results for the respective Tornado Analyses for the following categories: o Capital Cost, Equity and Debt Related Inputs, o Capacity Factor and O&M Related Inputs, o Revenue Related Inputs. The graphs illustrate how the after-tax IRR or NPV of the project will be impacted by incrementing any one of several inputs in each of these categories. Payback results are also calculated and can be plotted by the user. The increment values are entered in the Data Form which can be opened by selecting the Tornado Diagrams options from the EconExpert-DG Sensitivities Menu. Note that for the Tornado Tables to be current, the respective Tornado Diagrams must be updated prior to viewing or printing the table. For additional discussion of Tornado Diagrams page 35 and page 171. • Sensitivity Tables and Graphs. Print the selected tables that are included on the Sensitivities Sheet. These Tables show how the after-tax IRR, NPV and Payback of the project will vary as a function changes in a specific input variable. The graphs show plots of the after-tax IRR and NPV. The user can alternatively chart the Payback values if desired. When you select to run a specific Sensitivity from the Command Menu, you will be asked to provide the “increment” to be applied in the analysis. Using this increment, the model will be executed seven times for the selected analysis, varying the increment for –3 to +3 times the value you select. If you direct the program to run all of the Sensitivities at once, the increment values can be entered in the green shaded cells found in the Sensitivities Sheet. Plots of the respective Sensitivity Analysis show the variation in after-tax IRR and NPV as a function of the incremented value. Note that for the Sensitivity Tables and Graphs to be current, the respective sensitivity analysis must be executed prior to viewing or printing the table. A warning will be issued advising you to be sure the sensitivity is executed before the table is viewed or printed. For additional discussion of Sensitivities see the next section page 167. Revised 7/14/03 Page 32 EconExpert-DG Users Manual – Copyright 2001 - 2005 3) SENSITIVITIES The SENSITIVITIES Menu provides you with options to study how the after-tax Internal Rate of Return (IRR), Net Present Value (NPV) or Payback of the current case will be impacted by incrementing key inputs to the model. Each of the respective Sensitivities is performed by varying the identified input over the life of the project. Options on the SENSITIVITY menu include: o Tornado Diagrams – Tornado Diagrams illustrate how the IRR or NPV (or Payback of plotted by the user) of the current case will be impacted by individually incrementing any one of several inputs. Each of the respective Tornado Diagrams is generated by varying the inputs for the life of the project, based on inputs to either Table 1 or Table 1C. For more information, see page 35 and page 171. o Individual Sensitivity Cases. The remaining options allow you to selectively run individual Sensitivities listed above. The individual Sensitivity Tables and Graphs can be viewed from the Navigate menu or printed from the PRINT Menu. o Run All Sensitivity Cases. You can run all of the programmed sensitivities in a single batch, updating all of the corresponding graphs and printing them if desired. This selection will take some time to execute if selected. The complete model will be calculated almost 150 times, to develop all of the desired cases. It is highly recommended that you run all of the Sensitivity Cases prior to creating a ValuesOnly copy of the model, to ensure that all of the Sensitivities are updated to match the current Values-Only case. You can specify the term (in years) of the IRR and NPV Analyses that are used in the Sensitivities by entering the desired number of years in the third column of the NPV and IRR Summary Tables at the top of Table 1. The location of the entry is identified by the red boldfaced title “IRR TERM FOR SENSITIVITY STUDIES AND TORNADO DIAGRAMS” as shown in the following figure. Figure 20 – Inputting the Term of Sensitivity Analyses or Tornado Diagrams Revised 7/14/03 Page 33 EconExpert-DG Users Manual – Copyright 2001 - 2005 Input Categories for which Sensitivity Analyses can be performed include: o Capital Cost o DG Plant Operations o Demand and Standby Charges o Energy Prices o Financing o Fuel Use or Price o Operations and Maintenance Expenses o Revenues or Savings The Sensitivity Sheet is used to perform the individual sensitivity analyses. The Sensitivity Increment (specified on the Sensitivity Sheet) is the % variation or the absolute amount of variation, from the current case, of the selected variable that is used to perform sensitivity analyses. The increment is used to iterate the model, over a range of +/- three times the increment, running the complete financial analysis for each incremented value and then plotting the after-tax NPV and IRR as a function of the incremental variations of the selected parameter. For each Sensitivity Analysis a graph will be generated showing you how the after-tax IRR and NPV (where applicable) for your current case will be impacted by variations in the selected input. An example graph is shown below: Figure 21 – Example of Sensitivity Analysis Graph Sensitivities of IRR and NPV After Tax (10 yrs) to Capital Investment Cost for the Example Global Inputs - Base Year 2002 $ Each Tick Mark Equals 5.0% Change % Change in Capital Investment Cost from Base Case -15.0% 40.0% -10.0% -5.0% 0.0% 5.0% 10.0% 15.0% $4,900,000 35.0% $4,700,000 30.0% IRR % $4,300,000 20.0% 15.0% $4,100,000 10.0% $3,900,000 5.0% $3,700,000 0.0% $4,126,750 $4,369,500 $4,612,250 $4,855,000 $5,097,750 $3,500,000 $5,583,250 $5,340,500 Capital Investment Cost (Excluding Soft Costs and IDC), $ IRR After Tax 10 Years NPV After Tax 10 Years at 6.0% Discount Rate For additional information on using EconExpert-DG’s Automated Sensitivities, see page 167. Revised 7/14/03 Page 34 NPV $4,500,000 25.0% EconExpert-DG Users Manual – Copyright 2001 - 2005 4) TORNDADO DIAGRAMS The SENSITIVITIES Menu also provides you with options to generate Tornado Diagrams. Tornado Diagrams are a unique tool that will help you to identify which economic parameters/inputs, if they were to change, would have greatest consequential impacts on the analysis. They illustrate how the IRR or NPV of the Project would be impacted by changes in each of several categorically related inputs, in order or significance. This provides valuable insight into which parameters might warrant further investigation to determine how changes would impact the economic case you have set up. To create a Tornado Diagram select: SENSITIVITIES Tornado Diagrams from the Command Menu. You will be prompted with a Data Entry Form which asks you over what ranges you would like to study the selected parameters. You can specify the term (in years) of the IRR and NPV Analyses that are used in the Tornado Diagrams by entering the desired number of years in the third column of the NPV and IRR Summary Tables at the top of Table 1. The location of the entry is identified by the red bold-faced title IRR TERM FOR SENSITIVITY STUDIES as shown in the following Figure. Figure 22 - Inputting the Term of Sensitivity Analyses or Tornado Diagrams The Sensitivity Sheet is used to generate the tables used for the Tornado Diagrams. The Increments used for the Tornado Diagrams are entered in the User Input Form that is opened when you select the respective Tornado Diagram from the SENSITIVITIES Menu. An example of the User Input Form that will be opened is provided below. Revised 7/14/03 Page 35 EconExpert-DG Users Manual – Copyright 2001 - 2005 Your User-Defined Titles Appear Here Figure 23 – Tornado Diagrams User Input Form The white boxes in this sheet are the locations where you tell EconExpert-DG over what +/range (“Increment”) that you would like the model to vary each of the specified inputs. Once you have established the Increments, select one of the blue buttons on the bottom of the Data Form. The first button will run the selected sensitivities and will sort the horizontal bars in the resulting Tornado Diagram based the after-tax IRR. The must sensitive inputs will be sorted to the top of the chart and the least sensitive inputs will be sorted to the bottom of the chart. The second button will run the same sensitivities based on the after-tax NPV. The third button can be selected to cancel the operation and to return to the model. Revised 7/14/03 Page 36 EconExpert-DG Users Manual – Copyright 2001 - 2005 The figure below shows an example of a Tornado Diagram. The horizontal bars illustrate how +/- changes in the identified inputs would impact the project’s IRR. The results are sorted in order of significance, giving the “Tornado” effect. Note that the titles on the left axis identify the base case after-tax IRRs, the Base Year $ value for the input, and the Increment that was used. Similar Tornado Diagrams are provided in EconExpert for the NPV. Please note that due to the nature of timing of cash flows and effects of discount rate on the IRR and NPV calculations, the ordering of consequential impact of the parameters on the respective IRR and NPV Tornado Diagrams may be different for the same base case. Figure 24 – Sample Tornado Diagram Tornado Diagram - Sensitivity of After Tax IRR to Changes in Fuel Costs, Fixed and Variable O perating Costs, and Capacity Factor Related Inputs Base Case 10 yr. IRR = 35.5% % Change in Leveraged IRR from Base Case -2.5% -2.0% -1.5% -1.0% -0.5% 0.0% Annual Capacity Factor (life- of- project avg)= 84.5% + / - 5.0% 0.5% 1.0% -1.89% -0.70% 0.70% Cogen Annual Fuel Price (5 yr avg) = $0.350/ Therm + / - 5.0% -0.68% 0.67% User Defined Additional Annual Expenses 2 (5 yr avg. O &M) $90,595* + / - 25.0% -0.68% Standby Charges (5 yr avg) $3.000$/ kw mo + / - 25.0% 0.62% -0.60% -0.47% 0.58% 0.47% Variable O &M Costs (5 yr avg) $0,000cents/ kwh + / - 25.0% -0.19% 0.19% Fixed & Expensed Major Maintenance Costs (5 yr avg)$54,000*) + / - 25.0% -0.19% 0.19% Revised 7/14/03 2.0% 1.79% User Defined Additional Annual Expenses 3 (5 yr avg. O &M) $141,417* + / - 25.0% User Defined Additional Annual Expenses 1 (5 yr avg. O &M) $55,716* + / - 25.0% 1.5% Page 37 EconExpert-DG Users Manual – Copyright 2001 - 2005 5) UTILITIES The UTILITIES Menu provides useful tools to manage the model. Features on the UTILITIES Menu include: a) Global Inputs Wizard The Global Inputs Wizard provides an index to walk you through the population of the Global Inputs Sheet Revised 7/14/03 Page 38 EconExpert-DG Users Manual – Copyright 2001 - 2005 b) Show “Pop-Up” NPV, IRR and Payback Summaries The Pop-Up Summary is a convenient summary review of the after-tax NPV, IRR and Payback that you can access from the UTLITIES menu, from any location in the model. The corresponding results are calculated in Table 8 Results and are also presented at the top of the Global Inputs. To close the Pop-Up summary simply click on the 'X' box on the top right of the Pop-Up form. Figure 25 – Pop-Up NPV, IRR and Payback Summary c) Save or Reset Inputs. This is a valuable feature in EconExpert-DG. It allows you to store input sheets to “Holding Bins” and then later recall those input sheets. Using this feature, you can run multiple scenarios in the same spreadsheet. The menu also allows you to Load the Example DG Case that is documented in the Appendix to this User’s Manual. You can also reset (or clear) the Global or Annual Input Sheets, and the Custom Construction Drawdown Schedule. Options under Save or Reset Inputs include: • Display Contents of Holding Bins. This option allows you to view the contents of the various Holding Bins described below. The Holding Bins are used to store copies of the respective Global Inputs, Annual Inputs, Monthly Data and Simplified Inputs Sheets. Whenever you file a copy of an Input Sheet to a Holding Bin, you will be prompted to name the sheet you are saving. That name will appear in the Description cell located at the top of each sheet and will appear in the window that is generated when you select this option. An example of the window that EconExpert-DG creates to inform you about the current contents of the Holding Bins is provided below: Revised 7/14/03 Page 39 EconExpert-DG Users Manual – Copyright 2001 - 2005 Figure 26 – Example Display of Current Contents of Holding Bins • Clear All Holding Bins: This option clears all contents saved in the holding bins, reducing the file size. Active Input Sheets are not affected. • Clear All Input Sheets. This option resets all of the input sheets to blank entries. Use this feature before starting a new case to ensure that no legacy entries are included in the input sheets from prior analyses. Holding bins are not affected. For Table 1 Project Global Inputs you can: • SAVE a copy of the Active Global Input Table to The Global Inputs Holding Bin. This option allows you to save a copy of this table and then to make modifications to the respective input sheet without losing the saved set of inputs. When you SAVE the contents to the Holding Bin, the current contents of the Holding Bin are overwritten. • RESTORE a copy of the Global Input Table that has been previously saved to the Global Inputs Holding Bin. This option allows you to recover the copy of the Global Inputs Table that has been previously saved. When you RESTORE the contents from a Holding Bin, the current contents of the Active Inputs Sheet are overwritten. • EXCHANGE a copy of the Active Global Input Table with copies that have been previously saved in the Global Inputs Holding Bin. This option allows you to swap the copy of the input table that has been previously saved with the active Table 1 Project Global Inputs Sheet. When you EXCHANGE the contents with a Holding Bin, the current contents of the Active Global Inputs Sheet are saved in the Holding Bin and the current contents of the Holding Bin are written to the Active Global Input Sheet. Neither is lost. • RESET Global Inputs to 0’s. This option clears the Global Inputs Sheet of virtually all inputs allowing you to restart with a fresh analysis. Revised 7/14/03 Page 40 EconExpert-DG Users Manual – Copyright 2001 - 2005 For Table 1C Project Annual Inputs: • SAVE copies of the Active Annual Input Table to the Annual Inputs Holding Bin. This option allows you to save a copy of the Annual Inputs Table and then to make modifications to the respective input sheet without losing the saved sets of inputs. When you SAVE the contents to the Holding Bin, the current contents of the Holding Bin are overwritten. • RESTORE the copy of the Annual Input Tables that has been previously saved to the Annual Inputs Holding Bin. This option allows you to recover the copy of the Annual Input Tables that has been previously saved. When you RESTORE the contents from a Holding Bin, the current contents of the Active Inputs Sheet are overwritten. • EXCHANGE the copy of the Active Annual Input Table with the copy that has been previously saved in the Annual Inputs Holding Bin. This option allows you to swap the copies of the input table that has been previously saved with the active Table 1 Project Global Inputs Sheet. When you EXCHANGE the contents with a Holding Bin, the current contents of the Active Annual Inputs Sheet are saved in the Holding Bin and the current contents of the Holding Bin are written to the Active Annual Input Sheet. Neither is lost. • RESET Annual Inputs to 0’s. This option clears the Annual Inputs Sheet of all inputs. For the Monthly Data Sheet: • SAVE a copy of the Active Monthly Data Sheet to the Monthly Data Holding Bin. This option allows you to save a copy all of the inputs in this sheet and then to make modifications to the respective inputs without losing the saved sets of inputs. When you SAVE the contents to the Holding Bin, the current contents of the Holding Bin are overwritten. • RESTORE the saved copy of the Monthly Data Sheet that has been previously saved. This option allows you to recover the copy of the Monthly Data Table that has been previously saved. When you RESTORE the contents from the Holding Bin, the current contents of the Active Monthly Data Sheet are overwritten. • EXCHANGE a copy of the Active Monthly Data Sheet with the copy that has been previously saved in the Monthly Data Holding Bin. This option allows you to flip the copies of input tables that have been previously saved with the active Monthly Data Sheet. When you EXCHANGE the contents with a Holding Bin, the current contents of the Active Monthly Data Sheet are saved in the Holding Bin and the current contents of the Holding Bin are written to the Active Monthly Data Sheet. Neither is lost. Revised 7/14/03 Page 41 EconExpert-DG Users Manual – Copyright 2001 - 2005 For the Simplified Data Sheet: • SAVE a copy of the active Simplified Inputs Sheet to the Simplified Inputs Holding Bin. This option allows you to save a copy Simplified Inputs Table and then to make modifications to the respective inputs. When you SAVE the contents to the Holding Bin, the current contents of the Holding Bin are overwritten. • RESTORE the saved copy of the Simplified Inputs Sheet that has been previously saved. This option allows you to recover the copy of the Simplified Inputs Table that has been previously saved. When you RESTORE the contents from the Holding Bin, the current contents of the Active Simplified Inputs Sheet are overwritten. • EXCHANGE a copy of the Active Simplified Inputs Sheet with the copy that has been previously saved in the Simplified Inputs Holding Bin. This option allows you to flip the copies of input tables that have been previously saved with the active Simplified Inputs Sheet. When you EXCHANGE the contents with a Holding Bin, the current contents of the Active Simplified Inputs Sheet are saved in the Holding Bin and the current contents of the Holding Bin are written to the Active Simplified Inputs Sheet. Neither is lost. In addition to processing the Global, Annual, Monthly and Simplified Inputs Sheets, this menu also allows you to: • RESET the Construction Drawdown Schedule to the S-Curve Default. Any inputs to a custom drawdown schedule will be cleared and the default S-Curve Drawdown that EconExpert-DG automatically calculates to match your construction period will be used. • Load the Example DG Case. The Example cases in EconExpert-DG are described in the Appendix to the User’s Manual as primers to assist you in becoming familiar with the model. These cases are provided for Illustrative Purposes Only and are not intended to represent a Real Commercial Situation. Discussions in the Appendix to this User’s Manual use these illustrative cases to describe examples of how to use EconExpert-DG. Inputs, examples and descriptions provided by CEI in the EconExpert-DG Model and in the User’s Manual are provided for example purposes only. CEI makes no representations or warranties with respect to the accuracy of such inputs, examples or descriptions. • Reset the EconExpert-DG Model to its original as-shipped setup. This macro clears all of the yellow free-form tables and holding bins and returns all of the input sheets to their original settings. Revised 7/14/03 Page 42 EconExpert-DG Users Manual – Copyright 2001 - 2005 d) Table Viewing / Format. Selecting this option will allow you to change the format of the Tables in the model. The options include: • Freezing Titles and Unfreezing Titles. Freezing titles allows you to set the header rows and columns of all tables in the model so that the row and column titles will remain on the screen as you scroll down or across the individual tables. You can also unfreeze the titles for all tables in the model. • Restore Original Formats to Input Sheets. This option restores all of the original formatting to the Time-of-Use Wizard, Simplified Inputs, Monthly Data, Global Inputs and Annual Inputs Sheets including all special and conditional formatting set by CEI. Use this feature if you have accidentally or intentionally changed an input cell format and would like to return the model to its original settings. • Zoom Settings. EconExpert-DG is equipped with a Command Menu module that allows you to optimize the appearance of the model on your computer monitor based on the Windows Display Settings that you have selected and the type of monitor that you have. The basic zoom formats in EconExpert-DG are 40%, 50%, 75% or 100% though when selecting each of these settings, some worksheets may be formatted to a slightly different Zoom Setting for optimal appearance. Note that for the recommended Windows Display setting of 1024 x 767 Pixels, 50% is the recommended Zoom setting in EconExpert-DG. If you have a lower resolution monitor and use a setting of 800 x 600 Pixels, the recommended Zoom Setting in EconExpert-DG is 40%. You can check your Windows Display Settings in Windows by selecting: Start Settings Control Panel Display Settings Zoom settings of 75% and 100% are also provided in the event that you would prefer to see a larger print format. This might be desirable if you are displaying results using a digital projector. To change the Zoom Setting from EconExpert-DG select: UTILITIES Table Viewing and Format Set Table Zoom e) Reformat Cells Because the sheets in EconExpert-DG are protected, you will not be able to change the cell formats from the Excel menu. This option is added to the UTILITIES Menu, allowing you to change the format of selected cells in the model. You can selectively change the number format, shading, font color, font bold or italics type, underline and Revised 7/14/03 Page 43 EconExpert-DG Users Manual – Copyright 2001 - 2005 column width of tables and cells in the model. You can also restore any individual input sheet to its original format settings. Revised 7/14/03 Page 44 EconExpert-DG Users Manual – Copyright 2001 - 2005 f) Trace Precedents or Dependents – Debugging Your Model. Subscribers to EconExpert-DG will be allowed to view the formulas in the model in the Excel Formula Bar. These user’s can also trace the various cell relationships using this option. The Trace option has been added to the UTILITIES Menu, allowing you to use the Excel Audit Functions to determine which cells in the model provide source data for any cell of interest, and which cells in the model depend on that cell. The Trace Function will not allow you to view certain hidden cells in EconExpert-DG. Note that if you are using a Demo copy of the model, all of the formulas in the model are hidden and so this feature will be disabled. g) Range Protection for Project Summary and Graphs Sheets. This option allows you to turn ON or to turn OFF the Range Protection for the Project Summary and the seven Graphs Sheets. This feature can be used to allow you to customize or enhance the model’s preprogrammed graphs, or to add new graphs to the model. Also, as various cases are run in any Excel model the formatting of graphs can change in ways that may not be desirable. For example, the graph area may be reduced resulting in a lot of empty space in the graph frame, or the legend may be displaced and cover the x-axis title. This is an acknowledged bug in Microsoft Excel. If the formatting of the graph is disrupted, it can be easily corrected by first turning OFF the range protection and then simply clicking on the graph to make the desired changes. After completing the corrections it is recommended that you turn the protection back ON. For Help on formatting graphs in Excel, see the Excel Help Menu and perform a search for “Charts”. Please note that when a graph is selected, the EconExpert-DG Command Menu will disappear. The Menu will reappear when the selected graph is closed. The graph can be closed by clicking on any cell in the model. h) Show / Hide Comments. You can turn on or off the Help comments that are provided throughout the model. The Help comments are described in more detail in the next section. i) Change the Name of the Company that Appears in EconExpert-DG Reports You can temporarily change the name of the company that will appear in the reports that are generated from the EconExpert-DG menu. When you reinitialize the model, the name will be reset to the default value of the company that the model is registered to. j) Create “Values-Only” Spreadsheet. From the UTILITIES MENU (or from the EconExpert-DG HELP Menu), you can create a “Values-Only” copy of the current EconExpert-DG case. This “Values-Only” copy of EconExpert-DG can be shared with others who may not be licensed to use EconExpertDG. It will not be possible to run new cases using the “Values-Only” copy, and once saved and reopened, the EconExpert-DG Command Menu will have limited functionality Revised 7/14/03 Page 45 EconExpert-DG Users Manual – Copyright 2001 - 2005 (the NAVIGATE, PRINT and HELP options will be “Fully Functional”). No special license codes will be required to open and view the “Values-Only” version from any PC that has Microsoft Excel Versions 97 or later. Values-Only spreadsheets will be protected WITHOUT passwords so the issuer may edit or modify any of the sheets in the model. Please note, DO NOT DELETE ANY OF THE WORKSHEETS IN THE MODEL AS SUCH WILL RESULT IN AN ERROR WHEN THE VALUES ONLY SHEET IS REOPENED. Since the Sensitivity Cases and Tornado diagrams included in a “Values-Only” copy of the model will only be accurate if they are updated to the current case, you will be offered the option to run all of the Model’s Sensitivity Cases prior to converting the model to “Values-Only”. If you elect to run all of the sensitivities in one batch, it will take several minutes for the over 250 different cases to be executed. The Tornado Diagrams must be individually generated. If you elect not to run the Sensitivities, the Sensitivity Tables, Tornado Tables, Sensitivity Graphs and Tornado Graphs can be deleted from the ValuesOnly Copy to ensure that the “Values-Only” copy that you send to others does not contain Sensitivity Graphs or Tornado Graphs that are inconsistent with the case you have modeled. Prior to executing a “Values-Only” conversion, you will be prompted with a number of warnings, advising you to save the original spreadsheet before making the conversion, and to save the “Values-Only” file to a new filename to avoid overwriting the “Fully Functional” Model. Note that saved “Fully Functional” electronic copies of EconExpert-DG that are not converted to “Values-Only” can be shared with others, however, those “Fully Functional” Electronic copies will not be enabled on an unlicensed computer unless the user has obtained the appropriate License Codes from CEI. Using this feature you can also generate a “Recoverable” Values-Only copy of the model. A Recoverable Values-Only copy preserves all of the formula references and customization that the user has incorporated into the model. A full working version of the associated case can be recovered from a Recoverable Values-Only copy using the Import option on the UTILITIES menu. This provides a convenient way to archive EconExpertDG spreadsheets in files that take up less space on your hard drive (typically ~1MB Zipped). Revised 7/14/03 Page 46 EconExpert-DG Users Manual – Copyright 2001 - 2005 k) Populate with Input Data from the Simplified Inputs or Monthly Data Sheets To complement the Global and Annual Inputs sheets which are always active in the model, EconExpert includes three other optional input sheets that can be used to add greater simplicity or sophistication to your model. i. The Simplified Inputs Sheet The Simplified Inputs Sheet provides a simplification of data entry to be used in the Global Inputs Sheet. Inputs are entered in the shaded cells based on Annual Averages. Red inputs indicate critical values for which it is highly recommended that input data should be entered. Like Table 1, Project Global Inputs, this input sheet is organized into sections associated with each class of inputs. You can locate a specific input by scrolling through the table. You may automatically populate Table 1 Project Global Inputs with entries in this table by selecting: UTILITIES Populate with Input Data from the Monthly Data, Simplified Input or Time-of-Use Wizard Sheets Transfer Simplified Input Data to Global Inputs Sheet from the EconExpert Command Menu. The data will be transferred as values. For additional explanation on the Simplified Inputs Sheet see page 115. Note that ALL of the inputs listed here will be transferred to the Global Inputs Sheet, treated as average annual values, overwriting the corresponding quarterly values that are currently in Table 1 Project Global Inputs. You will be provided with the option to save the Global Inputs Sheet before the data is overwritten. EconExpert will allow you to use default values for other assumptions for remaining inputs or to use assumptions that have been previously populated into the Global Inputs Sheet by you or others in your organization. Please note that this data input sheet WILL NOT be used in the proforma unless you select the option to Populate the Global Inputs Sheet using the Transfer Data option described above. If you select the option to use the default EconExpert values in Table 1 Project Global Inputs, the following will be assumed. Revised 7/14/03 Page 47 EconExpert-DG Users Manual – Copyright 2001 - 2005 When you use the Simplified Inputs Sheet, annual costs & savings are allocated quarterly. The user then has the option to use EconExpert's Default Assumptions for remaining inputs or to substitute their own assumptions. Figure 27 – EconExpert-DG’s Default Assumptions Associated with the Simplified Inputs Sheet * * * * * * * * * * * * * * * One Tranche of Debt The utility tariff will not change when DG is added No Tax-Loss Carry-Forward 50/50 Debt Equity No annual changes in Site Requirements or DG Plant Performance All cost and savings escalate at the GNP rate 6% Discount Rate for NPV Calculations 1.75% Interest Rate earned on Escrowed Funds No Demand Ratchets Apply No Forced Outages All Excess Production sold back to utility (NO Third Party Sales) No Capacity Payments or Thermal Sales to Third Parties Property Taxes & Insurance are each 1% of Asset Basis No Terminal Value 35% Federal Income Tax Rate The User may override the *'d items by entering their own values in the Global Input Sheet prior to transferring the data. All other inputs are set to 0. Other key assumptions when you utilize the Simplified Input Sheet include: o The debt term or lease term are equal to the project life o The depreciation life is the MACRS class that is less than and closest to the project life o Annual usage rates, costs & savings are prorated quarterly ii. Monthly Data Historical and Projected Tariff, Demand and DG Plant Performance Data can be entered into the Monthly Data Sheet in 12 Monthly Periods. Data on the hosts usage and tariffs WITHOUT and WITH DG (as the Tariffs may change as a result of implementing DG), and predicted DG plant performance are entered. Using this Command Menu feature, you can automatically populate the Historical Data to the Quarterly Format used in the Global Inputs Sheet and/or you can automatically reference the Projected Data in Quarterly Format in the Annual Inputs Sheet. Note that when historical data is transferred to the Global Inputs Sheet, that data will be overridden by values transferred to the Annual Inputs Sheet. For additional explanation of the Monthly Data Sheet see pages 64 and 135. Revised 7/14/03 Page 48 EconExpert-DG Users Manual – Copyright 2001 - 2005 iii. The Time-of-Use Wizard Time-of-Use Energy Pricing and Demand Pricing can be evaluated using this tool. Pricing data from a selected utility’s tariff can be entered into the Time-of-Use Wizard inputs Sheets in block Super-Peak, On-Peak, Mid-Peak and Off-Peak Periods, along with corresponding use and demand data to project time-of-use related pricing. Using this Command Menu feature, you can automatically populate the resulting aggregated quarterly time-of-use information to the Quarterly Format used in the Global Inputs Sheet and/or you can automatically reference the Projected Data in Quarterly Format in the Annual Inputs Sheet. For additional explanation of the Time-of-Use Wizard see page 145. l) Compare EconExpert-DG Files to Identify Changes EconExpert-DG offers two very powerful options for comparing different cases and quickly understanding the changes and differences between those cases. The options are: i. Comparing Input Sheets You can compare the INPUT SHEETS for two different cases to identify which inputs have changed. You can also 'Track' input changes between an active input sheet and a holding bin in the same model by saving the current model as two different file names, with the desired cases to be compared each respectively activated in one of the files. This feature allows you to compare each input category and identifies which specific input categories have been modified or changed. A new worksheet is created with copies of all of the input tables in the model, with the changed items highlighted on an orange background. Please note that this is a memory intensive procedure. It is recommended that you close all other applications and workbooks before proceeding. The procedure will involve three spreadsheets: o The ‘Target’ EconExpert-DG Model is the model that you want to identify the changes in. The ‘Target’ model MUST be opened FIRST. The Macro should be initiated with the ‘Target’ Model Selected. o The ‘Reference’ EconExpert-DG Model is the model that you want compare/track changes against. The ‘Reference’ model MUST be opened SECOND. Record (or copy/paste) the filename of the ‘Reference’ Model as you will need to enter this information. o A New 'COMPARISION' file (which you will name) that highlights the fields that have been changed. Note that: o The ‘Target’ and ‘Reference’ models must each have at least two available windows, and Revised 7/14/03 Page 49 EconExpert-DG Users Manual – Copyright 2001 - 2005 o The ‘Target’ and ‘Reference’ models MUST have different names AND BOTH MUST BE ENABLED." A copy of the each of the respective Input Sheets from the ‘Target’ model will be created in the new 'COMPARISON' file including: o o o o o o Table 1 Project Global Inputs Table 1C Project Annual Inputs Simplified Inputs Monthly Data Table 3 Construction (Custom Construction Drawdown) Table 11 Depreciation (User Defined Depreciation Schedules) The names of the Identification of the Cases that are compared will appear in the NOTES section of the COMPARISION FILE Global Inputs Sheet. Once initiated, you will not be able to terminate this macro until it is completed. ii. Compare all Tables in the Model and Quantify Differences You can compare ALL OF THE SHEETS in two models, quantifying the magnitude of (the 'delta') the changes between two cases. You can also compare and quantify differences between an active input case and that in a holding bin in the same model by saving the current model with two different file names. Then, activate each of the respective cases in one file and run the comparison macro. This feature allows you to compare every input and calculation in the model and to quantify the change (the Delta) between the cases. A new worksheet is created with copies of all of the tables in the model. Every cell in the model (inputs or calculations) that has changed is identified (by highlighting on an ORANGE BACKGROUND) and the amount of the difference between the two cases (either positive or negative) is quantified. This Macro works only with IDENTICAL VERSIONS of the EconExpert-DG model. Also note that the Target and Reference cases must have identical start-up years in order to be compared and that this is a memory intensive procedure. It is recommended that you close all other applications and worksheets before initiating this procedure. The procedure will involve three spreadsheets: o The ‘Target’ EconExpert-DG Model is the model that you want to quantify the changes in. The ‘Target’ model MUST be opened FIRST. The Macro should be initiated with the ‘Target’ Model Selected. o The ‘Reference’ EconExpert-DG Model is the model that you want compare changes against. The ‘Reference’ model MUST be opened SECOND. Record the filename of the ‘Reference’ Model as you will need to enter this information. o The NEW 'COMPARISION' file (which you will name) that quantifies and highlights the fields that have been changed. Revised 7/14/03 Page 50 EconExpert-DG Users Manual – Copyright 2001 - 2005 Note that: o The ‘Target’ and ‘Reference’ models MUST each have at least TWO available windows, and o The ‘Target’ and ‘Reference’ models MUST have different names AND BOTH MUST BE ENABLED." o Comparisons will show the difference of the Target Model MINUS the Reference Model. Copies of the each of the respective Input and Results Sheets from the ‘Target’ model will be created in the 'COMPARISON' file. All changes will be quantified and HIGHLIGHTED on an ORANGE Background. The names of the cases that have been compared will appear in the NOTES section of the COMPARISION FILE Global Inputs Sheet. Once initiated, you will not be able to terminate this macro until it is completed. m) Import Data. EconExpert-DG is equipped with a utility that allows you to transfer input data from one copy of the model to another. This feature is most useful when you have received an update or upgrade to the model and need to easily transfer data to the new version without having to manually re-enter the data. If this option is selected, the model will guide you through the steps to initiate the data transfer. Typically all formula references that you use in either the input cells and the yellow free-form sections at the bottom of each table will be preserved. Such reference may be changed when importing from very early versions of the model. It is always recommended that you check any cell reference inputs that you have added to the model if you transfer data between different version numbers of the model. When comparing different versions of the model you will be prompted with the option for EconExpert to automatically compare the input sheets and notify you of any references that have changed. The procedure to perform a data import is as follows: • From the UTILITIES menu select: Import Data • Transfer Data from another EconExpert Model The following screen will then appear Revised 7/14/03 Page 51 EconExpert-DG Users Manual – Copyright 2001 - 2005 Figure 28 – Instructions for Data Import Between Copies of EconExpert-DG This is the complete set of instructions for data transfer. Important points include: • • Open the “destination” model first. The destination model is the new version of EconExpert-DG that you would like to import data to. Open the “source” model second. This is the version of EconExpert-DG that contains the input data that you would like to transfer from. Note that the Source Data model MUST have two windows available. If it does not, an error message will be issued. To rectify the error, select the Source Model and from the Excel Command Menu select: Window Add New Window To initiate the transfer, select yes and all input data in Tables 1, 1C and Table 3 will be transferred to the new model. The source model will be automatically closed after the transfer. It can be deleted, if desired. Revised 7/14/03 Page 52 EconExpert-DG Users Manual – Copyright 2001 - 2005 6) EconExpert-DG On-Line HELP EconExpert-DG has three useful On-Line Help Features: The EconExpert HELP Menu. Comments posted in individual cells throughout the model, providing descriptions of the functions of individual inputs and overviews of tables provided in the model. The EconExpert-DG Tutorial. a) The EconExpert-DG HELP Menu EconExpert-DG is equipped with a Customized Help Menu to assist you in using the model. The menu provides other instructions and helpful hints on using the model, technical definitions, and access to special features of the model. Items on the EconExpert HELP Menu include: Tutorial. Access to the EconExpert-DG On-Line Tutorial. The Tutorial will walk you through the model and all of its important features. Command Menus – Descriptions of the purpose and functions of each of the options provided on the EconExpert-DG Command Menu. Definitions and Explanations. Helpful definitions of much of the terminology used. Input Tables 1 and 1C – Descriptions of the functions of Table 1 Project Global Inputs and Table 1C Project Annual Inputs. License Information – Information on the status of your license and how to contact CEI. Saving EconExpert-DG to Disk – Discussion how to save and reuse “Fully Functional” and “Values-Only” copies of EconExpert-DG. Sources of Help – What automated help options are available to the user. Customizing the Proforma – Helpful suggestions on how you can customize EconExpert-DG to perform “project specific” analyses. Populating the Global or Annual Inputs Sheets with Simplified or Monthly Input Data Windows in EconExpert – Explanation of how EconExpert uses two operating windows. Worksheet Tabs – Descriptions of the purpose and functions of each of the 26 Worksheets included in EconExpert-DG. About EconExpert-DG – Extending My License – Important information regarding the EconExpert-DG copyright, how to contact CEI, and how to enable or extend a license to the model. Revised 7/14/03 Page 53 EconExpert-DG Users Manual – Copyright 2001 - 2005 b) Help Comments Individual input cells and tables throughout the EconExpert-DG Model include Comments that provide helpful information about the purpose and function of the respective input cell or results table. Cell Comments can be turned ON or turned OFF from the EconExpert-DG UTILITIES Menu. If the Cell Comments feature is turned ON, a Red Triangle comment indicator will appear in the upper right corner of the affected cells in the model. The corresponding Help Comment will appear as you move the cursor near to or over the Red Triangle. This Help Comments feature can be DISABLED by selecting: UTILITIES Show or Hide Help Comments in Cells Hide All Comments If disabled, Comments can ENABLED from this same Show or Hide menu option. Figure 29 – Example of EconExpert-DG’s On-Line Help Comments Revised 7/14/03 Page 54 EconExpert-DG Users Manual – Copyright 2001 - 2005 C) Worksheet Tabs Tabs at the bottom of the spreadsheet identify the various worksheets and tables in the EconExpert-DG Model. Figure 30 – EconExpert Worksheet Tabs The Worksheet Tabs are listed below and described individually in more detail in the pages that follow. License – This sheet includes the EconExpert-DG Software License Agreement. Users are required to acknowledge acceptance of the License Agreement in order to enable the model. You can print the license by clicking either of the two buttons at the top of this sheet. The license can be accepted or declined by clicking on the buttons at the bottom of the License Agreement. Title – This is the EconExpert-DG Title Sheet and Copyright notice. You may link directly to the CEI/EconExpert Website http://www.CEInsight.comby clicking on the Revised 7/14/03 Page 55 EconExpert-DG Users Manual – Copyright 2001 - 2005 EconExpert Logo shown on the Title Sheet. Information on how to contact CEI is also provided. Status – This sheet provides you with valuable information on the status of the current setup of the model. Potential conflicts between inputs and special circumstances are flagged and the user is notified of instances where Annual Inputs entered in Table 1C will override or be added to results calculated using a Global Input to Table 1. Sensitivities – This sheet is used to perform automated Sensitivity Analyses and Tornado Diagrams to evaluate how incrementing key parameters will affect the Project’s Internal Rate of Return, Net Present Value and Payback. The Sensitivity Increments for each sensitivity analysis are entered in this sheet. The IRR Term used in all of the Sensitivity Studies is specified in IRR Summary at the top of Table 1. • Monthly Data – This sheet allows you to automatically convert Monthly Customer Demand, Tariff Pricing and DG Plant Performance data into the quarterly EconExpertDG Energy Pricing Periods used in the Global and Annual Inputs Sheets. After the data is input to this sheet (it can be cut and pasted as values from another model), the data is automatically converted and can be automatically transferred to the Global or Annual Inputs Tables. • Simplified Inputs - The Simplified Inputs Sheet provides a simplification (one-screen) of data entry to be transferred to and used in the Global Inputs Sheet. Inputs are entered in the shaded cells based on Annual Averages. After the data is input to this sheet the data is automatically converted for transfer to the Global Inputs Table. Time-of-Use Wizard – The Time-of-Use Wizard allows you to more fully evaluate the time-of-use related pricing elements of individual utility tariffs. Using this tool in combination with the Table 1C Project Annual Inputs you can break each month down into block pricing periods (i.e. off-peak, mid-peak, on-peak, etc.) for the purposes of analyzing time-related energy and demand charges. The Time-of-Use Wizard is described in more detail in the appendix. Project Summary – This sheet provides a 1-page summary of key project results. You can turn the protection off on this sheet and customize it as desired. As long as you stay within the white section of the table, you can insert or delete columns or rows of data and the resulting printed report will automatically format to a single 8 ½ in. by 11 in. sheet. Table 1 Project Global Inputs – Table 1 is the PRIMARY input sheet to the model and its use is mandatory. Global Inputs are premises that typically apply over the life of the project, or input values that are escalated at a constant rate over the life of the Project. Once the Global Inputs Sheet is set up (or automatically populated from the Simple Inputs Sheet), the user can refine the model by selectively refining any input parameter in the Annual Input Sheet. More detailed discussions of Global Inputs are provided on page 86. Revised 7/14/03 Page 56 EconExpert-DG Users Manual – Copyright 2001 - 2005 • Table 1C Project Annual Inputs – Annual Inputs apply only to a given year in the life of the project. You can use Annual Inputs any time that you would like to more precisely model a variable than can be accomplished using Table 1 Project Global Inputs. Any non-zero entry is read as an Annual Input and included in the calculations in the model Where appropriate, this means that Global Inputs from Table 1 will be overridden in the years that Annual Inputs are entered. Table 1C also allows you to introduce new categories of revenues of expenses that might not have been available in Table 1. More detailed discussions of Annual Inputs are provided on page 118. Table 2 Summary – This sheet provides a summary of the results for the current case including IRR, NPV and Payback summaries, debt coverage ratios and revenue and income summaries. Table 3 Construction – This sheet provides the monthly Construction Period Drawdown. The model includes a default drawdown schedule for any duration from 1 – 24 months. The user may also specify a custom drawdown schedule. Interest accrued during construction (IDC) is calculated in this sheet based on a standard "S-Curve" drawdown schedule. The user may also override the default “S-Curve” schedule with a custom drawdown schedule. Soft costs are also allocated over the specified construction term. Table 4 Operating Costs – This sheet provides breakdowns of operating cost factors including consumption rates of fuel and raw materials, escalation indices and calculation of annual Fixed and Variable O&M and other operating expenses. Input summaries and intermediate calculations are displayed at the top of the sheet leading to a summary table (Table 4A) at the bottom of the sheet. Table 5 Debt Service or Lease o Debt Equity Financing or Capital Leases - This sheet provides parameters for two tranches of debt and resulting computations of debt service requirements or capital lease payments. Debt or Capital Lease terms can be customized to include interest only payments, accelerated or deferred principal repayments and variable interest rates. o Operating Leases – If the Operating Lease switch is selected in Table 1, Lease Payments for an Operating Lease are alternatively provided. Table 6 Revenues & Savings – This sheet provides calculation of energy, demand and thermal expenses with and without DG, and of any other revenues associated with sales of excess heat or power, etc. Input summaries and intermediate calculations are displayed at the top of the sheet leading to a summary table (Table 6A) at the bottom of the sheet. Table 7 Cash Flow – This sheet provides calculations of the Net Cash Flow before-tax, income taxes, and Net Cash Flow after-tax, on a leveraged basis (i.e. including all debt). Depreciation is reported from Table 11, and resulting state and federal income taxes, Revised 7/14/03 Page 57 EconExpert-DG Users Manual – Copyright 2001 - 2005 capital gains taxes and tax loss carry forwards are calculated. Net Cash Flow is reported during the construction phase and operating phases of the Project. Calculations of revenues minus expenses, deprecation, and taxes are provided, to be used in the calculations of before and after-tax Net Present Value (NPV to date of financial closing) and Internal Rate of Return (IRR). Table 8 Returns – This sheet provides calculations of before and after-tax Internal Rate of Return (IRR), Net Present Value (NPV) and Payback using the results from Table 7 Cash Flow. Table 9 Financials – This sheet provides the Project’s Income Statement, Cash Flow Statement and Balance Sheet using Generally Accepted Accounting Practice (GAAP) accounting format. Table 10 Cents per KWH – This sheet provides computation of revenues and expenses expressed in cents/kwh, including a Sources and Uses Statement expressed in cents/kwh. Table 11 Depreciation – This sheet provides detailed itemization of depreciation expenses for book and for cash purposes, including depreciation on the Initial Capital Investment. The user can also enter custom depreciation schedules as alternatives to the programmed US IRS MACRS schedules. Custom schedules might be utilized for projects outside of the US. Graphs Sheets – The remaining sheets provide graphs illustrating results for the current case and for automated sensitivities and tornado diagrams that can be run for the current case. Expanded discussions of the individual tables follows. Revised 7/14/03 Page 58 EconExpert-DG Users Manual – Copyright 2001 - 2005 1) License The License Sheet provides the Software License Agreement. EconExpert-DG may only be used under the terms of the applicable License Agreement and the user must acknowledge their acceptance of those terms in order to enable the model. The terms of the software license should be read carefully BEFORE using the model. Prior to using the model the first time, to enable the model the user must click the button labeled “I Have Read and Accept to the Terms of the EconExpert-DG License” located at the end of the License Agreement. Figure 31 – EconExpert License Agreement Revised 7/14/03 Page 59 EconExpert-DG Users Manual – Copyright 2001 - 2005 2) Title The Title Sheet includes the EconExpert-DG and CEI Logos, and notification of the product copyright. You may link directly to the CEI/EconExpert Website http://www.CEInsight.com by clicking on the EconExpert Logo shown on the Title Sheet. Information on how to contact CEI is also provided. The Macro Buttons on the right side of this sheet allow you to refresh the menu or to proceed directly to the Global Inputs Sheet. Figure 32 – Title Sheet 3) Status The Status Sheet provides Alerts and Warnings to the User that are relevant to the current configuration of the model. Warnings include detection of potentially conflicting inputs (e.g. a specified loan term that is longer than the project life), special circumstances and notification that Annual Inputs to Table 1C will produce results that will override or will be added to results otherwise generated from corresponding inputs to Table 1. Revised 7/14/03 Page 60 EconExpert-DG Users Manual – Copyright 2001 - 2005 It is highly recommended that the user check this sheet prior to reporting final results to help insure that the current case has been modeled correctly. Figure 33 – Status Sheet Revised 7/14/03 Page 61 EconExpert-DG Users Manual – Copyright 2001 - 2005 4) Sensitivities The Sensitivities Sheet is where Sensitivity Analyses and Tornado Diagrams are generated to study the impacts of variations of key project parameters on the calculated IRR and NPV. The Sensitivities Sheet contains a series of tables, each of which are used for a respective Sensitivity Analysis or Tornado Diagram. The user may specify individual increment amounts to be applied to each of the respective sensitivities. The term used for the Sensitivity Studies in input in the IRR Summary Section at the top of Table 1. Additional discussion of how to use EconExpert-DG’s automated Sensitivity Features is provided on page 167. Figure 34 – Sensitivities Sheet Revised 7/14/03 Page 62 EconExpert-DG Users Manual – Copyright 2001 - 2005 5) Project Summary This sheet provides a one 8 ½ in. x 11in. report summary of key project parameters. Project Highlights that are provided include: • IRR, NPV and Payback Summary • Project Operating and Fuel Parameters • Project Schedule • Investment Costs • Energy Pricing • Fuel Pricing • Sources and Uses of Operating Funds in cents/kwh • Cash Flows The figure below provides a screen shot of the top section of the Project Summary Sheet. Figure 35 – Project Summary Sheet The user is free to modify and customize this summary. To do so, select: UTILITIES Range Protection of Graphs and Project Summary Sheets. You may then modify the sheet, change entries, add or delete rows, etc., tying formulas in the table to other cells throughout the model. As long as you do not make changes outside of the boxed section of the sheet, the resulting summary that you create can be printed to one 8 ½ x 11 page using the PRINT option on the Command Menu. Revised 7/14/03 Page 63 EconExpert-DG Users Manual – Copyright 2001 - 2005 6) Monthly Data Historical and Projected Pricing and DG Plant Performance Data can be entered into the Monthly Data Sheet in 12 Monthly Periods. This can include Historical Data on the host’s usage and costs of electricity and gas, and predicted inputs on forward fuel and energy pricing, DG plant performance and other variables. The values entered here will be aggregated to quarterly values that can be transferred to the Global Inputs Sheet or automatically referenced in the Annual Inputs Sheet. As described below, you can automatically populate the Historical Data to the Quarterly Format used in the Global Inputs Sheet and/or you can automatically reference the Projected Data in Quarterly Format in the Annual Inputs Sheet. Note that when historical data is transferred to the Global Inputs Sheet, that data will be overridden by values transferred to the Annual Inputs Sheet. Table 1 Project Global Inputs and Table 1C Project Annual Inputs provide a flexible input structure for entering data in annual or quarterly formats. The Monthly Data sheet provides additional flexibility to utilize Forward Energy and Fuel Pricing and Plant Performance data. The Figure below provides a screen shot of the Monthly Data Table. Figure 36 – The Monthly Data Table Revised 7/14/03 Page 64 EconExpert-DG Users Manual – Copyright 2001 - 2005 The light blue shaded input cells can be used to enter Historical Data or projected site data WITHOUT DG, including tariff data and host demand. EconExpert will automatically convert this monthly information to the quarterly format used in Table 1 Project Global Inputs, applying escalation from the stated year using the escalation indices in Table 1. This data should be entered in Base Year $. The Base Year is an input to the Table 1 Project Global Inputs Sheet. The light green shaded input cells can be used to enter Projected Data on DG Plant Performance. EconExpert-DG will automatically convert this monthly historical pricing information to the quarterly format used in Table 1C Project Annual Inputs. The values entered in this table should be in current $. Only the applicable months will apply during the first and last year of the project. You may automatically populate Table 1 Project Global Inputs sheet with entries in this table by selecting: UTILITIES Populate with Input Data from the Monthly Data, Simplified Input or Time-of-Use Wizard Sheets Transfer Historical Monthly Data to the Global Inputs Sheet ------------------------------------------------------------------UTILITIES Populate with Input Data from the Monthly Data, Simplified Input or Time-of-Use Wizard Sheets Reference Projected Monthly Data in the Annual Inputs Sheet. from the EconExpert Command Menu. Please note the following points when you use the Monthly Data Table: • • • • Historical data should be entered in Base Year $ for transfer to Table 1 Project Global Inputs. Projected data should be entered in current $ (escalated) for transfer to Table 1C Project Annual Inputs. EconExpert will automatically account for a partial year of operation when transferring data to the Annual Inputs Sheet. Data can be copied and pasted from other sources. The pasted data should be pasted AS VALUES or as formulas from the source data file, or can be linked using formulas. Data will be aggregated to quarterly format and transferred to the Global Inputs Sheet or automatically referenced in the Annual Inputs Sheet, overwriting the current data. Revised 7/14/03 Page 65 EconExpert-DG Users Manual – Copyright 2001 - 2005 • • If period data is transferred, it is probably preferable to ensure that data is transferred for the whole project life (up to 20 years). If the data is not available for the whole project life, use formulas in the cells to project the data over the entire project life. Otherwise, the Global Inputs data will be applied in years where 0’s or no inputs appear. If desired as an alternative to transferring the data using the macros described above you may set up formulas in the Global or Annual Inputs Sheets that selectively reference the parameters that you would like to model on a monthly basis. If you do this, the Monthly Data sheet will become an active input sheet to the model by reference to the Global or Annual Inputs Sheets. 7) Simplified Inputs The Simplified Inputs Sheet provides a simplification of data entry to be used in the Global Inputs Sheet. Inputs are entered in the shaded cells based on Annual Averages. Red inputs indicate critical values for which it is highly recommended that input data should be entered. Like Table 1, Project Global Inputs, this input sheet is organized into sections associated with each class of inputs. You can locate a specific input by scrolling through the table. You may automatically populate Table 1 Project Global Inputs with entries in this table by selecting: UTILITIES Populate with Input Data from the Monthly Data, Simplified Input or Time-of-Use Wizard Sheets Transfer Simplified Input Data to Global Inputs Sheet from the EconExpert Command Menu. For additional explanation on the Simplified Inputs Sheet see page 115 . Note that ALL of the inputs listed here will be transferred to the Global Inputs Sheet, treated as average annual values, overwriting the corresponding quarterly values that are currently in Table 1 Project Global Inputs. You will be provided with the option to save the Global Inputs Sheet before the data is overwritten. EconExpert will allow you to use default values for other assumptions for remaining inputs or to use assumptions that have been previously populated into the Global Inputs Sheet by you or others in your organization. Please note that this data input sheet WILL NOT be used in the proforma unless you select the option to Populate the Global Inputs Sheet using the Transfer Data option described above. Revised 7/14/03 Page 66 EconExpert-DG Users Manual – Copyright 2001 - 2005 If you select the option to use the default EconExpert values in Table 1 Project Global Inputs, the following will be assumed. When you use the Simplified Inputs Sheet, annual costs & savings are allocated quarterly. The user then has the option to use EconExpert's Default Assumptions for remaining inputs or to substitute their own assumptions. Figure 37 – EconExpert-DG’s Default Assumptions Associated with the Simplified Inputs Sheet * * * * * * * * * * * * * * * One Tranche of Debt The utility tariff will not change when DG is added No Tax-Loss Carry-Forward 50/50 Debt Equity No annual changes in Site Requirements or DG Plant Performance All cost and savings escalate at GNP 6% Discount Rate for NPV Calculations 1.75% Interest Rate earned on Escrowed Funds No Demand Ratchets Apply No Forced Outages All Excess Production sold back to utility (NO Third Party Sales) No Capacity Payments or Thermal Sales to Third Parties Property Taxes & Insurance are each 1% of Asset Basis No Terminal Value 35% Federal Income Tax Rate The User may override the *'d items by entering their own values in the Global Input Sheet prior to transferring the data. All other inputs are set to 0. Other key assumptions when you utilize the Simplified Input Sheet include: o The debt term or lease term are equal to the project life. o The depreciation life is the MACRS class that is less than and closest to the project life o Annual usage rates, costs & savings are prorated quarterly Please note that this data input sheet WILL NOT be used in the proforma unless you select the option to Populate the Global Inputs Sheet using the Transfer Data option described above. The Figure below provides a screen shot of the Simplified Inputs Sheet. This sheet provides all of the inputs, on a single screen, that can be used to run the model at the most simplified level. Each individual input is described in the comment statements identified by the red triangles in each cell. Revised 7/14/03 Page 67 EconExpert-DG Users Manual – Copyright 2001 - 2005 Figure 38– The Simplified Inputs Sheet Revised 7/14/03 Page 68 EconExpert-DG Users Manual – Copyright 2001 - 2005 8) Table 1 Project Global Inputs Table 1 is the PRIMARY input sheet to the model and its use is mandatory. Global Inputs are premises that typically apply over the life of the project, or input values that are escalated at a constant rate over the life of the Project. Examples of Global Inputs include the Plant Capacity and Fuel Use (if those values do not change over life of the project), and the cost of energy, fuel or fixed O&M (which can each be entered as constant dollar values with respective real escalation components to be applied over the life of the project). Once the Global Inputs Sheet is set up (or automatically populated from the Simple Inputs Sheet), the user can refine the model by selectively refining any input parameter in the Annual Input Sheet. A screen shot of the top section of the Global Inputs Table is provided below: Figure 39 – Screen Shot of Table 1 – Global Inputs Revised 7/14/03 Page 69 EconExpert-DG Users Manual – Copyright 2001 - 2005 The Macro Button on the top of this sheet will allow you to Refresh the EconExpert Command Menu. If you Refresh the menu, the labels you assign to all User-Defined Inputs will be updated on the menu. Inputs to Table 1 are organized into categories of inputs that can be located using the NAVIGATE Menu or by scrolling through the Table. Table 1 is Range Protected, allowing you to enter data ONLY into specified Blue or Green shaded input cells. The blue shaded cells represent data that is typically represented by historical information on the customer’s site, before installation of the DG project. This input data can include historical information such as the customer’s / site’s historical gas or electric usage, tariff data, electrical chiller operation, etc. If monthly bills are available from the customer, that data can be entered into the Monthly Data sheet and then automatically aggregated and populated into the quarterly format in the Global Inputs Sheet in these blue shaded cells. The green shaded cells represent data that is typically associated with the new CHP facility. This input data includes parameters such as DG plant performance, fuel pricing, operating and maintenance costs, financing and tax structure. The Input Categories in Table 1 are included in three columns separated by a bold red line. Column 1 Switches Economic Factors Equity and Debt Ratios Project Schedule Plant Capacity, Heat Rate and Fuel Type Quarterly Data o Historical Information on the Users Electric, Gas and Chiller Use o Predicted DG Plant Performance o Electricity Pricing o Gas Pricing Other Revenue Sources Variable Operating Costs Fixed Operating Costs Property Taxes and Insurance Column 2 Investment Costs o Phase 1 – Project Development o Phase 2 – Engineering, Construction and Start-up o Soft Costs o Plant Salvage Value Revised 7/14/03 Page 70 EconExpert-DG Users Manual – Copyright 2001 - 2005 Column 3 Construction Financing Permanent Financing o Primary Debt or Capital Lease Structure o Subordinated Debt Structure Operating Lease Structure Sources of Capital Summary Depreciation Income Taxes and Investment Tax Credits The individual Global Inputs are discussed in more detail starting on page 86. The Appendix also provides examples on how to use the various Global Inputs. A variety of Cell Help Comments also appear with each input in Table 1. To view the comments first enable them from the EconExpert-DG Help Menu and then place the cursor over the red triangle on the corner of the respective cell. PLEASE NOTE: Cost premises are input to Table 1 Project Global Inputs in BASE YEAR $. This means that the cost and revenue entries to Table 1 will be escalated by ADDING the GNP Deflator and the Real Escalation applied to each item. All results calculated using the Global Inputs Sheet will be prorated based on partial years of operation in the first and last years of the project life, as appropriate. Locations where a red asterisk appears (*) identify cells where a potential warning message is located but not needed. Also note that when inputs that result in overriding of a particular entry to Table 1 Project Global Inputs are entered in Table 1C Project Annual Inputs, the format of the value of the input in Table 1 will change to Bold Red and an Annual Input indicator will appear next to the respective input. This feature is provided just to advise you that a particular input to Table 1 is being overridden somewhere in the proforma. Revised 7/14/03 Page 71 EconExpert-DG Users Manual – Copyright 2001 - 2005 9) Table1C Annual Inputs Annual Inputs apply only to a given year in the life of the project. You can use Annual Inputs any time that you would like to more precisely model a variable than can be accomplished using Table 1 Project Global Inputs. Any non-zero entry is read as an Annual Input and included in the calculations in the model. If it is desired to enter a 0 for Annual Input, use a very small number like 0.0000001, and the zero value will be used in the model. Where appropriate, this means that Global Inputs from Table 1 will be overridden in the years that Annual Inputs are entered. The Figure below provides a Screen Shot of Table 1C: Figure 40 - Screen Shot of Table 1C Revised 7/14/03 Page 72 EconExpert-DG Users Manual – Copyright 2001 - 2005 For more discussion on each of the Annual Inputs to Table 1C that override Global Inputs, see the section above on Table 1C – Project Annual Inputs, which starts on page 118. Descriptions of the Annual Inputs that provide you with additional functionality in EconExpert-DG, rather than overriding a Global Input are provided in this section. The blue shaded cells represent information associated with the site WITHOUT DG in operation. The Green shaded cells represent data that is projected for the host’s site, after installation of the DG project. This input data can include information such as the customer’s / site’s expected gas or electric usage, gas or electric pricing, electrically driven chiller operation, etc., or DG Plant Parameters. Data populated from the Projected Data in the Monthly data sheet will be transferred into this sheet. Table 1C is Range Protected, allowing you to enter data ONLY into specified blue shaded Input cells. Table 1C is organized into sections associated with each class of Input Categories. Input Categories are organized with their related inputs listed in rows under that category. The columns to the right in Table 1C, each represent a year in the life of the Project, with Column F used for the first year of the project life. You can locate a specific Input Categories in Table 1C by either scrolling through the table, or by using the NAVIGATE Feature on the Command Menu. Non-zero inputs to Table 1C will be reformatted by the model to Red on Text Yellow Background. Individual input titles in Table 1C appear on the left of the table followed by the “Input Indicator” and notes about the group of inputs. On the right side of the table, shaded cells provide locations for inputs of annual data starting in the first operating year of the project life. Table 1C is organized in the following sections. Escalation – Annual GNP Deflator Quarterly Performance and Pricing Data o Site Electric Demand and Gas Use WITHOUT and WITH DG o DG Plant Performance o Absorption Chiller Performance o Tariff Data WITHOUT and WITH DG Forced Outages Estimates Other Revenues DG Plant Operations and Maintenance Costs Debt Services or Capital Lease Terms Property Taxes, Insurance and Income Taxes Examples of how you can use Annual Inputs to Table 1C to perform custom calculations include: • Using any of six User Defined Additional Annual Revenue Sources and six User Defined Additional Annual Expenses categories to model special contracts or agreements o Power Purchase, Fuel Supply and Maintenance Agreements o Energy or Steam Sales Agreements Revised 7/14/03 Page 73 EconExpert-DG Users Manual – Copyright 2001 - 2005 • • • • • • • • o O&M Contracts Step changes or single year events such as plant expansions. To model the impacts of Forced Outages of the DG Plant on loss of revenues and added demand charges. To model changes for forward electricity or gas Tariffs To model predicted changes in the performance of the DG Plant. To model customized debt including o Floating Interest Rates on Debt. o Accelerated or Deferred Principal Payments (Sweeps) tied to the Debt Coverage Ratio. o Interest Only Payments on Debt o Lump sum principal repayments To model foreign tax rates To customize income tax depreciation schedules Virtually any other way that you desire allowing you to customize EconExpert for any set of circumstances. Note that you can also enter formulas into annual input cells. These formulas can be linked to other parts of EconExpert-DG, to tables in the yellow Free-Form sections of the model or to sheets that you insert into the model. Results generated using Annual Inputs entries to Table 1C will either override results produced from a corresponding entry to Table 1, or will be added to those results. Examples of specific inputs where results are added rather than overriding Global Inputs include: Forced Outages User Defined Revenue Sources (6 Categories that you can define) User Defined Expenses (6 Categories that you can define) Additional Tax Deductions Additional State Taxes, and Additional Federal Taxes Each of these is noted in Table 1C. All of the other inputs will override Table 1 Inputs in, AND ONLY IN, the years that values are entered in Table 1C. If Annual Inputs are entered in every year of the project life the corresponding Global Inputs entered in Table 1 will be totally overridden and will not be used in the analysis. If Annual Inputs are only entered in some years, then the Global Inputs will be used in all other years, applying escalation where appropriate. If Annual Inputs are entered into any cell in Table 1C, the respective “Input Indicator” will show the value 9999999 (Column C) and the corresponding inputs will be reformatted to Bold Red Text on Yellow Background. If there are no entries in a row, then a red 0 will appear. The corresponding input to Table 1 will also be reformatted to Bold Red and a red the warning Annual Inputs will appear next to the corresponding input in Table 1. This advises you that an Annual Input value has been entered and that the corresponding Global Input will be overridden. The Status Sheet will also provide a notice that this has occurred. Revised 7/14/03 Page 74 EconExpert-DG Users Manual – Copyright 2001 - 2005 A feature is provided on the EconExpert-DG UTILITIES Menu that allows you to clear and reset the Annual Input Table to all 0s, meaning that none of the inputs to Table 1 will be overridden. To RESET the Annual Inputs Table from the UTILITIES menu select: Save or Reset Inputs Reset Annual Inputs to 0’s Note that if you do this, the current Annual Inputs will be lost. You will be provided with a warning. If desired, you can save the Annual Inputs to the Holding Bin before Resetting them. This can be initiated from this same menu option. The individual Annual Inputs are discussed in more detail starting on page 118. Examples provided in the Appendix also give examples on how to use the various Global Inputs. A variety of Cell Help Comments also appear with each input in Table 1. PLEASE NOTE: Cost entries are input to Table 1C in CURRENT $, and represent the actual amount spent in a given year. This means that the cost and revenue entries to Table 1C will not be impacted by escalation rates entered elsewhere in the model, and fixed values will not be impacted by partial year operation. The values will be used by the model as entered. Note: * are items where SAVINGS are realized as a result of DG, ** are items that result in NEW COSTS that may be incurred as a result of DG Revised 7/14/03 Page 75 EconExpert-DG Users Manual – Copyright 2001 - 2005 10) Table 2 Summary Table 2 provides consolidated summaries of the results generated in Tables 3 – 11. Two summaries are provided in Table 2: o Top Section - Basic Summary Annual before and after-tax IRRs, NPVs and Payback Return on Equity Debt Coverage Ratios Other Revenues o Bottom Section - Expanded Summary Revised 7/14/03 Commodity Sales - MWH, 1000 lb/hr Cash Flow Summary Consolidated Cash Flow Statement including: - Revenues Summary - Expenses Summary - Debt Service Summary - Depreciation - Income Taxes - Net Cash Flow After-tax Page 76 EconExpert-DG Users Manual – Copyright 2001 - 2005 11) Table 3 Construction Table 3 provides calculations of monthly and cumulative monthly construction expenditures based on a standard S-Curve Drawdown schedule. Interest during construction and soft costs (Start-up/mobilization/spares, working capital, debt reserve, and up-front loan fees, etc.) are also allocated over the construction term. As an alternative to the Default "S-Curve" Capital Cost Drawdown Schedule generated by EconExpert-DG, you may input your own custom Capital Cost Drawdown schedule by entering the percentage of Capital Costs that are expended monthly during the Construction Phase. It is important to note that non-zero entries to this schedule will override the Default values, in the months that they are entered. Since the resulting schedule must sum to 100%, it is recommended that you provide the complete drawdown schedule if custom drawdown entries are made. A warning will be issued if the resulting drawdown schedule does not sum to 100%. Table 3 is organized as follows: o Construction Drawdown Factors. o Monthly Construction Cost Schedule o Cumulative Monthly Construction Cost Schedule The total monthly drawdown during the construction phase is computed as follows: Land and Development Costs (which may actually occur prior to closing) are scheduled as a "one-time" expense, lumped in the first month of the construction phase. Capital Costs and Loan Commitment Fees are expended according to the Drawdown Schedule. Start-up, Mobilization and Spares costs are spread evenly overly the last six months of the Construction Schedule. If the Schedule is shorter than six months they are divided evenly over the period. Working Capital is accumulated over the last three months of the Construction Schedule. If the Schedule is shorter than three months they are divided evenly over the period. Debt Reserves and Up-Front Financing Fees are deposited in the last month of the schedule. Interest During Construction is calculated and added to other construction term costs based on the percent of construction costs that are debt financed, using the Construction Term Debt parameters, and the resulting monthly expenditures described above. Loan commitment fees are calculated based on the undrawn balance. Revised 7/14/03 Page 77 EconExpert-DG Users Manual – Copyright 2001 - 2005 12) Tables 4 Operating Costs Table 4 provides calculation of all operating expenses and related escalation factors. Escalated annual fixed and variable operating expenses are computed in $/yr, based on inputs to Tables 1 and 1C. Table 4 is organized as follows: The top Section of Table 4 Provides Operating Cost Factors and Escalation Rates including: o Planned Hours of Operations o DG Plant Operating Statistics o Escalation Indices o Escalated Operating Costs assuming 100% Load Factor and 100% Ownership Table 4A shown in the bottom section of Table 4 provides Escalated Annual Operating Costs in $/year based on the capacity factor of the DG plant. Itemized operating cost categories provided in Table 4A include: Quarterly Fuel Costs Variable Operations and Maintenance Costs Standby Charges Fixed Operations and Maintenance Costs User Defined Expense Categories Entered in Table 1C Expensed Major Maintenance Property Taxes Insurance Payments for an Operating Lease if Applicable Revised 7/14/03 Page 78 EconExpert-DG Users Manual – Copyright 2001 - 2005 13) Table 5 Debt Service or Lease Table 5 provides detailed calculations of principal and interest payments on primary and subordinated debt, or annual lease payments. EconExpert-DG lets you choose from multiple financing options including: • • • Debt Equity Financing Capital Leases Operating Leases Permanent financing, or a Capital Lease, can be divided into two parallel Tranches, each with its own financing terms. Terms entered here will apply to the life of the lease or loan. A Capital Lease may provide 100% financing. A Capital Lease is structured much the same as debt, so that the Owner (the Lessee) holds title to the project assets on their books. As a result, the owner will capture all of the associated tax depreciation. Often times a Capital Lease will provide 100% financing. If the Operating Lease Switch is NOT selected EconExpert will assume a Debt/Equity or Capital Lease structure. If special financing terms are required, such a variable interest rates or accelerated principal payments, those amounts can be entered as annual inputs and will override the amounts entered here where they apply. a) Operating Leases The Operating Lease Option can be selected by clicking on the related checkbox in the Switches Section of the Global Inputs Sheet. This switch is also duplicated in the Operating Lease Section of the Global Inputs Sheet. Selection of either checkbox will accomplish the same result. An Operating Lease is structured so that the Leasing Company (the Leasor) takes title to the project’s assets on the Leasor’s books. As a result, the Leasor is able to capture all of the associated tax depreciation at the Leasing Company's income tax rates. This can provide advantages for the Leasee (the Customer) as the Leasee might not be able to as fully take advantage of the associated depreciation write-offs, or might benefit from the Leasor’s higher relative income tax bracket. If the Operating Lease option is selected, it will be assumed that 100% of the project investment during the term of the lease will be financed by the leasing company. The leasing company (the “Leasor”) will assume title to the project during the lease period and will receive all depreciation credits for cash tax purposes. At the end of the lease, the Leasee will have the option to purchase the asset from the Leasor at the Residual (Fair Market) value. Revised 7/14/03 Page 79 EconExpert-DG Users Manual – Copyright 2001 - 2005 The lease payments will be treated as a periodic fixed operating expense to the project (the Leasee). Consult your leasing company for rates and terms. Please Consult your Tax Advisor to confirm this information. The following four criteria must be satisfied for a lease to qualify as an Operating Lease: • • • • The lease does NOT transfer ownership to the Leasee at the end of the term. The lease does NOT contain a "Bargain Purchase" option. The lease term is NOT equal to or longer than 75% of the economic life of the asset. The present value of the lease payments does NOT equal or exceed 90% of the fair value of the leased property. If any of these criteria are not satisfied, the lease is a Capital Lease and so must remain on the books of the customer. The Operating Lease criteria are subject to review and approval by the IRS. When you select the Operating Lease checkbox, sections of the Global Input Sheet that relate to an Operating Lease will be activated in bold text, and sections related to Debt Financing/Capital Leases will be greyed out. When you unselect this checkbox, the status of those sections will be reversed. Debt/Lease Terms entered in Tables 1 and 1C are reported and resulting annual debt service/lease requirements are calculated and displayed. Debt/Lease Coverage Ratios are also reported. b) The Organizational Structure of Table 5 Table 5 is organized as follows: o The top section of Table 5 provides the factors used for the Debt Service or Capital Lease calculations. Custom Debt Treatment - Accelerated Principal Payments, Interest Only Payments Schedules – Breakdown of Interest Rates, Interest Payments, Principal Repayments, Etc. o Table 5A located on the bottom section of Table 5 provides Annual Debt Service, Capital Lease or Operating Lease Expenses in $, as applicable. Annual Debt Service, Capital Lease or Operating Lease Payments Interest Payments Principal Payments Annual Lease Payments Cash Available to Cover Debt or Lease Debt/Lease Coverage Ratios Revised 7/14/03 Page 80 EconExpert-DG Users Manual – Copyright 2001 - 2005 14) Table 6 Revenues & Savings Table 6 provides calculation of gross revenues associated with energy, capacity and byproduct sales and savings associated with the displacement of purchases of electric energy and gas. Annual energy sales are reported for each of the specified Quarterly Periods. Associated escalation factors are also displayed, and the resulting escalated annual revenues are reported in current $. Table 6 is organized as follows: The Top Section of Table 6 provides Revenue Factors and Escalation Rates including: o DG Plant Operating Statistics o Site Electric Energy and Thermal Use that can be displaced by DG o The Energy Sales Profile by Energy Pricing Period o Sales of Other Commodities including steam and other byproducts o Escalation Rates used for Revenues o Escalated Prices for Energy and Commodities Table 6A located in the bottom section of Table 6 provides Escalated Annual Revenues in current $. Revenue streams are itemized in detail. Itemized revenue categories provided in Table 6A include: A breakdown of revenues from energy sales into the available 4 Quarterly Periods A breakdown of all taxable revenue sources including: o Savings Associated with Displaced Electric Purchases o Savings Associated with Reduced Demand Charges o Savings Associated with Displaced Gas Purchases o Revenues from Sales of Excess Electric Energy o Capacity Payments o Additional Annual Revenue (from Table 1C Project Annual Inputs) o Steam or Hot Water Sales o Interest Income from Debt Reserves Other sources of revenue associated with recovery of reserves and disposition of the land and asset at the end of the debt term or the end of the project life. Revised 7/14/03 Page 81 EconExpert-DG Users Manual – Copyright 2001 - 2005 15) Table 7 Cash Flow Table 7 provides calculations of the Net Cash Flow before-tax, income taxes and Net Cash Flow after-tax. Results provided in this table are calculated on a leveraged basis (i.e. including construction phase and operating phase debt). The resulting Cash Flow is reported during the construction phase and through the operating phase. Calculations of revenues minus expenses, deprecation and taxes, are provided to be used in the calculations of Internal Rate of Return (IRR), Net Present Value (NPV) and Payback provided in Table 8. 16) Table 8 Returns Table 8 provides calculation of the before-tax and after-tax Internal Rate of Return (IRR), Net Present Value (NPV) and Payback using results from Table 7. The IRR (Internal Rate of Return over 20 years) represents the after-tax return on the Owner’s investment. The NPV (Net Present Value) is calculated to the year of Financial Closing at the specified Discount Rate. A negative NPV does not necessarily indicate that a project is losing money, but rather that the IRR achieved by the project is less than the discount rate specified for the NPV calculation. An NPV of 0 means that the IRR and Discount Rate are equal. The Debt Service Coverage Ratios (DSCRs) from the debt sheet are reported. DSCR is a common metric used by banks and financing institutions to measure project performance versus debt obligations. DSCR’s are provided on both a before-tax and an after-tax basis. Debt Coverage Ratio "Before-tax" on the Debt or Lease is defined as the Earnings Before Interest, Taxes and Depreciation (EBITAD) divided by the debt service payment and the fees on the Senior Debt or Lease. Coverage Ratio "After-tax" on the Debt or Lease is defined as the net cash flow after-tax available to cover debt divided by the debt service payment and the fees on the Senior Debt or Lease. Payback is a hypothetical calculation of the amount of time (in years) that it will take for the owner to recover their initial equity investment in the project and/or the total capital cost for the facility. 17) Table 9 Financials Table 9 provides the Project's Financial Statements including the Income Statement, Cash Flow Statement and Balance Sheet. These statements are prepared using Generally Accepted Accounting Principals (GAAP) and are representative of the impacts on the owners Book Financials. Since some or all of the revenues associated with the project are based on savings, often times the resulting Financial Statements provide an incremental view of how the project would impact the owner’s full financial statements. Table 9 is organized as follows: Revised 7/14/03 Page 82 EconExpert-DG Users Manual – Copyright 2001 - 2005 • • • Table 9 – Income Statement - The Income Statement is used to calculate Net Income (Revenues minus expenses, deprecation and taxes) for the Project, using Book Accounting Methods. Table 9A - Cash Flow Statement - The Cash Flow Statement identifies sources of project cash and amounts available for potential distribution to the Owner. Table 9B - Balance Sheet - The Balance Sheet identifies assets, equity and liabilities attributed to the Project, where Total Annual Assets are in balance with Total Annual Equity and Liabilities in each year and over the project life. EconExpert-DG uses the 'Deferral Method' of Generally Accepted Accounting Principles (GAAP) for all Book Analyses including the Income Statement, Cash Flow Statement and Balance Sheet in Table 9. 18) Table 10 Cents per kwh Table 10 provides costs and revenues calculated in cents/kwh during the operations phase. These calculations are performed by dividing the annual revenues and expenses by the net annual power generation from the DG facility. Table 10 includes the following expressed in Escalated (current) cents/kwh: • • • • • • Revenues by category including savings, energy sales, capacity sales and other revenues sources, Operating Costs by category including individual contributions to fixed and variable operating costs, Debt Service / Lease Expenses including a breakdown of Primary and Subordinated Debt payments, Sources of Funds including revenues from savings, energy sales, capacity sales and other income sources, Uses of Funds including identification of net income after-tax, A Summary Breakdown of Revenues, Expenses, Debt Service, Income Taxes and Net Income. 19) Table 11 Depreciation Table 11 provides calculations of Depreciation for Cash and for Book Purposes. Depreciation is used to recover investment costs for items that have multi-year lives including the initial Capital Investment. Table 11 includes the following: • Depreciation for Tax - Initial Capital Investment - IRS Modified Accelerated Cost Recovery (MACRS) Schedules. Note that the user can also specify custom depreciation schedules in addition to the standard IRS MACRS schedules provided in the model. • Depreciation for Book - Initial Capital Investment o The Initial Capital Investment is depreciated using the Straight-Line methods specified in Tables 1 and 1C. Revised 7/14/03 Page 83 EconExpert-DG Users Manual – Copyright 2001 - 2005 20) Graphs Sensitivity 1 - 4 Four worksheets in EconExpert-DG provide plots showing results of Sensitivity Analyses to study how the after-tax NPV and IRR of a project will be impacted by incrementing individual inputs to the model. The corresponding Sensitivity Cases must be executed from the EconExpert-DG Command Menu in order to reflect results consistent with the current case. The Sensitivity Increment for each case is entered in the respective tables that appear for each variable in the Sensitivity Sheet. The term used for all of the Sensitivity Analyses is entered at the top of Table 1. The Sensitivity Graphs provide plots of NPV and IRR versus the variations in the selected parameter. It is important to note that the Sensitivity Graphs are not updated automatically. Prior to printing the Sensitivity Graphs, they must be updated by running the corresponding Sensitivity Analysis for the current case. This can be accomplished by selecting the SENSITIVITIES Option on the EconExpert-DG Command Menu. All of the Sensitivities can be run as a batch from the EconExpert-DG SENSITIVITIES Menu. 21) Graphs Tornado 5 One worksheet in EconExpert-DG provides plots showing all of the respective Tornado Diagrams used to study how the IRR of a project will be impacted by incrementing multiple project inputs. The corresponding Tornado Diagrams must be executed from the EconExpert-DG Command Menu in order to reflect results consistent with the current case. The Increments Diagram are entered into a Data Input Sheet provided by EconExpert-DG when you select the respective Tornado Diagram Option from the Command Menu. The term used for all of the Tornado Diagrams is entered at the top of Table 1. The Tornado Diagrams provide plots of Leveraged and Unleveraged IRR versus the variations in the selected parameter. It is important to note that the Tornado Diagrams are not updated automatically. Prior to printing the Tornado Diagrams, they must be updated by running the corresponding Tornado Diagrams for the current case. This can be accomplished by selecting the SENSITIVITIES Option on the EconExpert-DG Command Menu. Each of the Tornado Diagrams must be individually generated. 22) Graphs Current Case 6 - 7 Two worksheets in EconExpert-DG provide the graphical results that are produced for the current case in the model. Graphs on these sheets are updated each time the spreadsheet is calculated. This will occur automatically if the Excel Calculation setting is set to Automatic, when F9 is pressed or whenever a Current Case Graph is printed using the EconExpert-DG Command Menu. It is not necessary to execute a macro from the EconExpert-DG Command Menu to update these graphs. Revised 7/14/03 Page 84 EconExpert-DG Users Manual – Copyright 2001 - 2005 D) Inputs to the EconExpert-DG Model Five options are available for data entry into the EconExpert model: o Table 1 Project Global Inputs, is the only input sheet that you will ALWAYS use when running the model. Table 1 uses values that typically apply (and may escalate or increase at a constant annual rate) over the life of the project. o Simplified Inputs. This sheet allows you to set up the model using a minimum number of inputs. EconExpert-DG will make simplifying assumptions for you which are described in the User's Manual or under the explanation of the Simplified Inputs sheet located in the EconExpert-DG Help menu. o Table 1C Project Annual Inputs, uses values entered for a given year. The user my selectively customize the results obtained for any Global Input or may introduce new categories of inputs into the model. Non-Zero entries in Table 1C will either be added to or will override their counterpart Inputs to Table 1, in the years that the non-zero entries appear. o Monthly Data. This sheet allows you to enter data directly from the Customer's electric and gas bills. The Monthly data you enter will be aggregated into quarterly equivalents for import or reference into the corresponding locations in the Global or Annual Inputs Sheets for use by the model. An automated macro located on the 'UTILITIES' Menu can be used to 'Populate' the aggregated Monthly Data into the correct locations o Time-of-Use Wizard. The Time-of-Use Wizard allows you to more fully evaluate the time-of-use related pricing elements of individual utility tariffs. Using this tool, in combination with the Table 1C Project Annual Inputs, you can break each month down into block pricing periods (i.e. off-peak, mid-peak, on-peak, etc.) for the purposes of analyzing time-related energy and demand charges. The Time-of-Use Wizard is described in more detail on page 145. Revised 7/14/03 Page 85 EconExpert-DG Users Manual – Copyright 2001 - 2005 1) Discussion of Individual Inputs to Table 1 Project Global Inputs Table 1 is the only input table in EconExpert-DG that you will ALWAYS USE. Table 1 and is where Global Inputs are entered. From this table, most projects can be fully modeled, in fact Table 1 provides a complete checklist of the inputs that typically apply to any DG Project. Using this table, moving down each of the three columns separated by a BOLD RED LINE, the user is prompted with an organized list of DG related inputs. The strengths and limitations of Table 1 Project Global Inputs lie in the same point. Using Table 1 the inputs entered will typically apply over the life of the project. Input categories to Table 1 include: • Switches to turn on/off modeling features such as tri-generation, operating leases and tax benefits • Characteristics of the site WITHOUT DG (“the host’s appetite”) • DG Plant design and performance parameters • Tariff pricing, WITHOUT and WITH DG Operational • Other sources of savings and revenues • DG facility operating costs • DG facility capital costs • Financing Options • Depreciation and Income Tax Considerations A screen shot of Table 1 is provided below: Start here*** Figure 41 – Screen Shot of Table 1 – Global Inputs Revised 7/14/03 Page 86 EconExpert-DG Users Manual – Copyright 2001 - 2005 Inputs to Table 1 are organized into categories of inputs that can be located using the NAVIGATE Menu or by scrolling through the Table. Table 1 is Range Protected, allowing you to enter data ONLY into specified (shaded) input cells. Table 1 is organized into three columns that are separated by a bold red vertical line. The Input Categories in Table 1 are: Column 1 Switches to Control Program Options Economic Factors Equity and Debt Percentages Project Schedule Quarterly Performance and Pricing Data including: o Site Electric and Gas Demand o DG Plant Performance o Absorption Chiller Performance o Electric Energy Prices Savings/Revenues Due to DG o Thermal Energy Prices Other Revenues Variable and Fixed Operations and Maintenance Expenses Property Taxes and Insurance Column 2 Investment Costs o Phase 1 – Project Development o Phase 2 – Engineering, Construction and Start-up Revised 7/14/03 Page 87 EconExpert-DG Users Manual – Copyright 2001 - 2005 o Soft Costs o Plant Salvage Value Column 3 Construction Financing Permanent Financing o Primary Debt Structure o Subordinated Debt Structure Sources of Capital Summary Cash Tax and Book Depreciation Classes Income Tax Rates, Capital Gains Rates and Investment Tax Credit Rates A variety of Cell Help Comments also appear with each input in Table 1. To view the comments first enable them from the EconExpert-DG Help Menu and then place the cursor over the red triangle on the corner of the respective cell. PLEASE NOTE: Operating Expense and Revenue premises are input to Table 1 in BASE YEAR $. This means that the cost and revenue entries to Table 1 will be escalated by ADDING the “real” escalation rate for each item to the GNP escalation rate. Entries to the Global Input Sheet will also be prorated for partial year operation in the first or last year of the project life if applicable. Locations where a red asterisk appears (*) identify cells where a potential warning message is located but not needed. Also note that when inputs are entered in Table 1C Project Annual Inputs, these entries will result in over-riding of a particular entry to Table 1 Project Global Inputs, the format of the value of the input in Table 1 will change to Bold Red and an Annual Input indicator will appear next to the respective input. This feature is provided just to advise you that a particular input to Table 1 is being overridden somewhere in the proforma. Individual inputs to Table 1 Project Global Inputs are described below: a) Switches Switches in Table 1 provide the user with the options to turn ON or OFF special calculations in the model. To select an option controlled by a switch, simply click on the associated check box as shown in the figure below. Figure 42 - Table 1 Project Global Inputs – Switches Revised 7/14/03 Page 88 EconExpert-DG Users Manual – Copyright 2001 - 2005 The Switches in EconExpert-DG are described below: i. Tri-Generation Switch (Global Inputs) EconExpert-DG offers the ability to evaluate Cogeneration or Tri-Generation Applications. Cogeneration provides two forms of savings. • • Electric Energy Production from the CHP Plant is used to offset Electricity Purchases from the Utility. Waste Heat from the CHP Plant is used to offset consumption fuel used to generate hot water or steam. Tri-Generation includes a third option • Waste Heat from the CHP Plant is used to operate absorption chillers. Typically these chillers were originally electrically driven so additional electricity purchases are offset. Relative to options 1 or 2 above o Electric consumption by the chillers is offset by the use of waste heat rather than direct self-generation of electricity. o Waste heat from the CHP Plant is used to offset electricity purchases in addition to the offset of gas purchases used to produce hot water or steam. To Select Tri-Generation Simply Select the Checkbox in the Switches Section of Table 1 Project Global Inputs. ii. Operating Lease Switch (Global Inputs) An Operating Lease is structured so that the Leasing Company (the Leasor) takes title to the project assets on their books. As a result, they are able to capture all of the associated tax depreciation at the Leasing Company's income tax rates. This can provide advantages for the Leasee (the customer) as the Leasee might not be able to as fully take advantage of the associated depreciation write-offs. If an Operating Lease is selected by selecting the corresponding Checkbox, EconExpert will assume that the project is 100% financed by the Operating Lease and that title will be held in the name of the Leasing Company. The Operating Lease Payment will be treated as an operating expense. At the end of the Lease a Purchase option will be provided at the Residual ('Fair Market') value. After purchase by the owner, the asset will be depreciated on the owner's books using straight-line deprecation over the remaining asset life. The following four criteria must be satisfied for a lease to qualify as an Operating Lease: Revised 7/14/03 Page 89 EconExpert-DG Users Manual – Copyright 2001 - 2005 • • • • The lease does NOT transfer ownership to the Leasee at the end of the term. The lease does NOT contain a 'Bargain Purchase' option. The lease term is NOT equal to or longer than 75% of the economic life of the asset. The present value of the lease payments does NOT equal or exceed 90% of the fair value of the leased property. If any of these criteria are not satisfied, the lease is a Capital Lease and so must remain on the books of the customer. Please Consult your Tax Advisor to confirm this information. iii. Carry Forward Tax Losses (Global Inputs) EconExpert allows you to capture tax losses in the current year, or to carry them forward to be applied against future project earnings. Sometimes reported tax losses may be larger than the amount of net taxable income realized by the owner. This situation can commonly occur if Production or Investment Tax Credits are applied as the resulting accelerated depreciation can result in a very large tax writeoff in the first year of operations. If the tax write-offs in any year of the project are greater than the applicable taxable income, then IRS will require those losses to be carried forward. However, if the losses at the project level can be applied to other earnings realized by the owner or Leasor (profits from other parts of the owner's income), those write-offs can be realized in the year that they occur, independent of the fact that the project on a stand-alone-basis was not profitable. If the Tax Carry Forward Checkbox is selected, any tax losses and their associated depreciation write-offs will be carried forward and applied to future project earnings during any year that the project experiences losses. If this option is not selected, the project will be credited with net income associated with tax losses in the year that those losses occur. This latter scenario assumes that losses can be transferred and fully applied against other before-tax profits realized by the owner. Consult you Tax Advisor to confirm this information and how it applies to your situation." b) Economic Factors (Global Inputs) Economic Factors are entered in the next section, which is shown in the Figure below: Revised 7/14/03 Page 90 EconExpert-DG Users Manual – Copyright 2001 - 2005 Figure 43 – Table 1 Project Global Inputs - GNP Escalation Rate and Real Escalation Rates Inputs include: The Base Year is the time frame from which all escalation calculations for revenues and expenses entered in Table 1 will be performed. Operating Cost and Revenue inputs to Table 1 are expressed in Base Year $ and will be escalated to the current year by ADDING the Real Escalation Rate assigned to that component with the GNP Escalation Rate described below. The GNP Escalation Rate in Table 1 is the life-of-project rate of general inflation. Each cost or revenue input in Table 1 also includes a Real Escalation entry, which when ADDED to the GNP Escalation Rate provides the effective (or “Nominal”) rate of escalation for that item. So, if the rate of escalation for an input is equal to the GNP Escalation Rate, that input’s Real Escalation Rate would be 0.0%. If an input escalates at a rate higher than inflation, its Real Escalation Rate would be greater than 0.0%, and similarly it would be negative if the input escalates at a rate lower than the general inflation rate. The Discount Rates used for before and after-tax NPV Calculations. These are the rates used in Table 8 for calculating the Net Present Value of the Project. They are normally the cost of capital for the corporation. Rate on 6-Month Certificate of Deposit. This is the rate earned on escrowed Debt Reserve funds. If desired, the user may alternatively provide an annual schedule of GNP Escalation Rates in Table 1C. c) Equity and Debt Percentages (Global Inputs) The Figure below shows the inputs included in this section of Table 1. Figure 44 - Table 1 Project Global Inputs – Equity and Debt Percentages (Applies to Debt Financing and Capital Leases Only) Inputs in this section include: Equity During the Construction Phase. This is the percentage of the costs realized during the construction phase that are funded with Owner’s Equity. If set to 0, debt will be used to finance 100% of the construction period costs. Costs during the construction phase are calculated based on the Drawdown Schedule with Interest During Construction calculated based on the resulting debt. The percent debt is calculated by difference. Revised 7/14/03 Page 91 EconExpert-DG Users Manual – Copyright 2001 - 2005 Equity During Operations. The is the percentage of the Total Investment Cost, including Soft Costs and Interest During Construction, that is funded with Equity when Permanent Debt or a Capital Lease is selected during the Operating Phase. If an Operating Lease is selected, all equity will be assigned to the Leasor as described in the overview of Operating Leases on page 79. The terms specified for Primary and Subordinated Debt and Capital Leases, are discussed on page 108. The percent debt is calculated by difference. d) DG Project Schedule (Global Inputs) The Project Schedule Inputs to Table 1 are shown in the Figure below: Figure 45 – Project Schedule Inputs to this section include: Month and Year of Financial Closing. This point sets the start of the project schedule and of the construction phase drawdown in Table 3, and is the year that the NPV calculation is discounted to. Construction Term (Months). This specifies the length of the construction phase and the length of the corresponding drawdown schedule. Project Life, Years. This is the term of the analysis. If the Project Life is shorter than the debt term or the applicable depreciation life then the residual principal balance and depreciation will be accelerated in the final year of operations. Other items such as Land Value and Working Capital are also recovered at the end of the Project Life. Tables throughout the model will show results over the project life and columns after the end of the Project Life will show 0 at the top of the column indicating that the project is inactive during that period. The maximum project life if 20 years. Using the factors listed above, the dates for Financial Closing, Start of Operations and Project Retirement are reported. If the Start of Operations results in part year operations in the first year, costs in the first and last year of the project life will be prorated based on the percent of the year that the plant is in service. e) Quarterly Performance and Pricing Data This section allows you to enter life-of-project related historical and projected pricing, and DG plant performance data, on a quarterly basis. Corresponding costs will be itemized in Revised 7/14/03 Page 92 EconExpert-DG Users Manual – Copyright 2001 - 2005 the calculations performed by EconExpert-DG on a quarterly basis. Cells highlighted in BLUE indicate input locations where the user may automatically transfer Historical Monthly Data that has been entered in the Monthly Data Sheet to the Global Inputs Sheet. Such data might be available (or might be determined from) actual monthly electric and gas bills received by the site owner. Also note that items where SAVINGS are realized as a result of DG are identified by a * and items that result in NEW COSTS associated with the addition of DG are identified by a **. For additional explanation on transferring monthly data from the Monthly Data Sheet to the Global Input Sheet see page 135. Inputs in the Quarterly Performance and Pricing Data Section are shown in the figure below which illustrates Quarters 1 (Jan-March) and 2 (April-June). The third and fourth quarters are similarly provided to the right in the model. The input categories are described in more detail in the text that follows the figure. Figure 46 - Table 1 – Project Global Inputs Quarterly Performance Data Inputs Inputs Continued for rd 3 and th 4 Quarters Inputs Continued for rd 3 and th 4 Quarters Inputs Continued for rd 3 and th 4 Quarters Revised 7/14/03 Page 93 EconExpert-DG Users Manual – Copyright 2001 - 2005 i. Maximum Site Electric Energy Demand, kw (Global Inputs) This is the Average MAXIMUM electric energy demand at the location and is calculated by averaging the peak demand in each month of the respective quarter. This amount should include electric chillers if applicable but not include any power generated or used by the DG Facility, during the applicable period. If the Maximum demand varies from month to month, the values entered should represent the “Average” for the period since the quarterly demand charges will be an aggregate of the individual monthly charges during the quarter. The values entered here will be used to estimate the costs associated with demand charges to ensure that adequate capacity is available from the utility if the DG facility is not available. If MAXIMUM electric energy demand is not expected to be constant in a given quarter (or is not expected to increase at a constant annual rate) over the life of the project annual electric energy usage rates can be entered in Table 1C Project Annual Inputs. Historical data entered in the Monthly Sheet can be transferred into this blue shaded cell by executing the UTILITIES Populate with Data From… option on the EconExpert Command Menu. ii. Site Displaceable Electric Energy Use, 1000 kwh/period – WITHOUT DG (Global Inputs) This is the Total Energy used at the location in each quarter if DG were not operating, NOT including electric chiller consumption. The values entered here will be used to estimate savings associated with the direct displacement of electric energy purchases from the utility by self- generation. The Chiller power requirements will be separately itemized below. Using TriGeneration, that power will be displaced by the use of waste heat used to drive Absorption Chillers rather than the original Electrically Driven Chiller Configuration. If electric Energy Use is not expected to be constant (or is not expected to increase at a constant annual rate) over the life of the project annual electric energy usage rates can be entered in Table 1C Project Annual Inputs. Historical data entered in the Monthly Sheet can be transferred into this blue shaded cell by executing the UTILITIES POPULATE with Data From… option on the EconExpert Command Menu. Project Monthly Prices can also be transferred to the Annual Inputs Sheet. iii. Chiller Electric Power Consumption, 1000 kwh/period – WITHOUT DG (Global Inputs) This is the electric chiller power use at the location in each quarter (in 1000 kwh/quarter WITHOUT DG. Revised 7/14/03 Page 94 EconExpert-DG Users Manual – Copyright 2001 - 2005 If the Tri-Generation switch is selected, the values entered here will be used to estimate savings associated with the displacement of electric energy purchases from the utility because of use of absorption chillers to displace electrically driven chillers. If electric chiller energy use is expected to change (or is not expected to increase at a constant annual rate) over the life of the project, annual electric energy usage rates can be entered in Table 1C Project Annual Inputs. Historical data entered in the Monthly Sheet can be transferred into the blue shaded cells by executing the UTILITIES POPULATE WITH DATA FROM... option on the EconExpert Command Menu. iv. Site Displaceable Thermal Use, 1000 Therms/Period WITHOUT DG (Global Inputs) These are the quarterly total amounts of thermal use (supplied by natural gas or other fuel in each quarter) consumed at the site without DG operational, in 1000 Therms/quarter. The values entered in each quarter will be used to calculate the heat consumption at the site in Therms/period, and the amount of waste heat that can be displaced by the CHP Facility. If waste heat use is not expected to be constant (or is not expected to increase at a constant annual rate) over the life of the project, annual waste heat usage rates can be entered in Table 1C Project Annual Inputs. Historical data entered in the Monthly Sheet can be transferred into this blue shaded cells by executing the UTILITIES Populate with Data From... option on the EconExpert Command Menu. v. Net DG Plant Electric Generating Capacity, kw (Global Inputs) This is the net Capacity of the DG Plant (in kw). It is also the basis from which Demand Charge Savings and Standby Charges will be calculated as it represents the incremental demand reduction at the site or the incremental amount of stand-by power that the site will require if the DG Plant experiences an unscheduled forced outage. Net Electric Production will be calculated based on the net capacity and the capacity factor. If the Net Capacity is not expected to be constant over the life of the project annual values can be entered or calculated in Table 1C Project Annual Inputs. Monthly NET Capacities can also be entered or calculated in the Monthly Data Table. Revised 7/14/03 Page 95 EconExpert-DG Users Manual – Copyright 2001 - 2005 vi. Waste Heat from DG Available For Non-Chiller Thermal Use, Therms/hr (Global Inputs) This is the rated useable thermal production from the DG in therms/hr (= 100,000 Btu/hr) in each quarter and is equivalent to the amount of fuel displaced by waste heat. This includes applicable steam or hot water applications. The values entered here will be used to estimate savings associated with the displacement of purchases of natural gas or other fuel. If the amount of waste heat available from the DG Plant is greater than the amount of thermal energy that can be displaced at the site, the excess waste heat can be sold to a third party or will be vented. If the facility uses absorption chillers, the heat requirements for the absorption chillers should NOT be included in this input. If the available waste heat is not expected to be constant over the life of the project annual NET waste heat values can be entered in Table 1C Project Annual Inputs. Monthly rates can also be entered in the Monthly Data Table. vii. Engine Average Operating Heat Rate, Btu/kwh net OR Heat Input (Global Inputs) This is the average net heat input (Btu /kwh net) of the engine based on the higher heating value (HHV) of the fuel. If the plant will be cycled during the year, this represents the composite average operating heat rate for the respective quarter. Note that the OR indicates that the fuel input can also be entered in Therms/Hour as indicated in the next item. If heat input is not expected to be constant over the life of the project (i.e. due to performance degradation, changes in operating philosophy, upgrades to the project, etc.), annual heat input entries can be entered in Table 1C Project Annual Inputs for each quarter. Note that if the Heat Input is entered in the next row or in the Annual Inputs Table, it will take precedence over this Heat Rate Input. Monthly rates can also be entered in the Monthly Data Table. viii. DG Plant Gross Fuel Input (Therms/hr - HHV Basis) (Global Inputs) As an alternative to entering the heat rate, this is the average quarterly gross heat input (MMBtu/hr) based on the higher heating value (HHV) of the fuel. If the plant will be cycled during the year, this represents the composite average for the respective quarter. If heat input is not expected to be constant over the life of the project (i.e. due to performance degradation, changes in operating philosophy, upgrades to the project, Revised 7/14/03 Page 96 EconExpert-DG Users Manual – Copyright 2001 - 2005 etc.), annual heat input entries can be entered in Table 1C Project Annual Inputs for each quarter. Note that if the Heat Input is entered here, it takes precedence over the Heat Rate Input. Monthly rates can also be entered in the Monthly Data Table. ix. DG Plant Capacity Factor in Each Quarter, % (Global Inputs) This is the percentage of the potential plant output that will occur during each quarter, accounting for number of hours in service, and level of operation when the facility is operated. For example, if the plant will be operated at full capacity during 50% of the hours in the period, this entry would be 50%. Similarly, if the plant were to be operated at 50% capacity for the whole period, the entry would also be 50%. Annual Inputs can be entered in the Annual Inputs table. Monthly rates can also be entered in the Monthly Data Table. x. Maximum Coincident Electric Chiller Demand Displaced by Waste Heat, kw (Global Inputs) These inputs are applied ONLY if the Tri-Generation Switch is selected. The inputs should reflect the average each of the coincident peaks that can be offset from available waste heat over the three months in the quarter. The result might be limited by the available amount of waste heat from the Tri-Generation Plant. This is the maximum quarterly demand for the chillers (in kw) which will be displaced by waste heat from the DG Unit (i.e. if absorption chillers replace or offset electrically driven chillers). The values entered in each quarter will be used to calculate the amount of electric energy demand for chillers that can be displaced by use of waste heat from the CHP Facility. The “coincident demand” is the demand that occurs at the same time as the Maximum site demand, and so represents that amount of electric chiller Maximum demand that can be displaced by absorption chillers. If the electric energy demand for chilling is not expected to be constant (or is not expected to increase at a constant annual rate) in a given quarter over the life of the project, the annual electric energy usage rates can be entered in Table 1C Project Annual Inputs. Historical data entered in the Monthly Sheet can be transferred into this blue shaded Cell by executing the UTILITIES POPULATE WITH DATA FROM... option on the EconExpert Command Menu. Revised 7/14/03 Page 97 EconExpert-DG Users Manual – Copyright 2001 - 2005 xi. Displaced Electric Chiller Electric Consumption , 1000 kwh / period (Global Inputs) These inputs are applied ONLY if the Tri-Generation Switch is selected. The inputs should reflect the amount of chiller electric energy use that can be offset from available waste heat used in absorption chillers and so might be limited by the available amount of waste heat from the Tri-Generation Plant. This is the maximum coincident quarterly amount of electric energy use by the chillers (in 1000 kwh/quarter) that will be displaced by waste heat from the DG Unit (i.e. if absorption chillers replace or offset electrically driven chillers). The values entered in each quarter will be used to calculate the amount of electric consumption by the chillers that can be displaced by use of waste heat from the CHP Facility during the specified period. If electric energy consumption for chilling is expected to change (or is not expected to change at a constant rate) over the life of the project, annual electric energy usage rates can be entered in Table 1C Project Annual Inputs. Historical data entered in the Monthly Sheet can be transferred into this blue shaded cell by executing the UTILITIES Populate with Data From... option on the EconExpert Command Menu. xii. Absorption Chiller Capacity Factor in Each Quarter Based on Maximum, % (Global Inputs) This is a calculated value and represents the capacity factor of the chillers relative to the annual Maximum. xiii. Cost of Electric Energy Purchased from Utility, c/kwh WITHOUT DG This is the value of displaced electric energy which the DG facility will displace, expressed in cents/kwh. This is the quarterly "weight averaged" (or aggregated) power price based on the amount of power displaced during each period at the corresponding time-of-use rate. If needed, this aggregated value can be estimated using the Time-of-Use Wizard. The quarterly average power price should reflect the cost of power purchased during on-peak, mid-peak, off-peak conditions and super-off-peak periods, etc. during that month, and the amount of power used during each of those respective periods. If the cost of electric energy purchased from the utility is not expected to be constant (or is not expected to increase at a constant annual rate) annual Electric Energy Cost values can be entered in Table 1C Project Annual Inputs. This rate is usually the energy price WITHOUT DG but if there is a change in the tariff it is the resulting value of the energy that is displaced. Revised 7/14/03 Page 98 EconExpert-DG Users Manual – Copyright 2001 - 2005 Historical data entered in the Monthly Sheet can be transferred into this blue shaded cell by executing the UTILITIES Populate with Data From... option on the EconExpert Command Menu. xiv. Cost of Electric Energy Purchased from Utility, c/kwh WITH DG This is the value of displaced electric energy which the DG facility will displace, expressed in cents/kwh. This is the quarterly "weight averaged" (or aggregated) power price based on the amount of power displaced during each period at the corresponding time-of-use rate. If needed, this aggregated value can be estimated using the Time-of-Use Wizard. The quarterly average power price should reflect the cost of power purchased during on-peak, mid-peak, off-peak conditions and super-off-peak periods, etc. during that month, and the amount of power used during each of those respective periods. If the cost of electric energy purchased from the utility is not expected to be constant (or is not expected to increase at a constant annual rate) annual Electric Energy Cost values can be entered in Table 1C Project Annual Inputs. This rate is usually the energy price WITHOUT DG but if there is a change in the tariff it is the resulting value of the energy that is displaced. Historical data entered in the Monthly Sheet can be transferred into this blue shaded cell by executing the UTILITIES Populate with Data From... option on the EconExpert Command Menu. xv. Demand Charges for Maximum Metered Power, $/kw mo, WITHOUT DG (Global Inputs) Demand Charges are reflective of the maximum meter reading experienced by the customer during the target period. Often times a portion of the customer's bill is based on the maximum power demand that is used, either as a monthly average or during a specific on-peak period. The utility then includes in the power bill a fixed annual Demand Charge for capacity required to support that amount of demand. This input is the demand charges that will be paid to the utility in $/kw mo to ensure firm power to meet the annual load requirements WITHOUT DG. When the DG Facility is brought on-line, the customer should realize a savings in demand charges associated with the fact that as a result of self-generation, they no longer have as large of a demand requirement. If the Demand Charges are not constant (or do not escalate at a constant rate) over the life of the project annual Demand Charges can be entered in Table 1C Project Annual Inputs. Historical data entered in the Monthly Sheet can be transferred into this blue shaded cell by executing the UTILITIES Populate with Data From... option on the EconExpert Command Menu. Revised 7/14/03 Page 99 EconExpert-DG Users Manual – Copyright 2001 - 2005 xvi. Demand Charges for Maximum Metered Power, $/kw mo, WITH DG (Global Inputs) Demand Charges are reflective of the maximum meter reading experienced by the customer during the target period. Often times a portion of the customer's bill is based on the maximum power demand that is used, either as a monthly average or during a specific on-peak period. The utility then includes in the power bill a fixed annual Demand Charge for capacity required to support that amount of demand. This input is the demand charges that will be paid to the utility in $/kw mo to ensure firm power to meet the annual load requirements WITH DG Operational. When the DG Facility is brought on-line, the customer should realize a savings in demand charges associated with the fact that as a result of self-generation, they no longer have as large of a demand requirement. If the DG Facility does not operate reliably, the savings in demand charges may be reduced or eliminated, and a demand ratchet may apply in the succeeding period The calculation of savings associated with reassessment of demand charges is based on the following: o If Standby Charges are assessed, there will be no reassessment of demand charges or demand charge savings. o If there are no Standby Charges, the Demand Charges (or resulting savings) in each year will be assessed on the current quarter’s established demand and the current quarter’s demand charge rate. If it is desired to model a partial quarter in the Annual Inputs Sheet simply prorate the value for the number of applied months in the quarter and divide by three. o If the facility experiences an unplanned outage during the year, the basis for demand charges in the quarter will be the maximum demand in the current quarter (i.e. there may be no demand charge credit). If the Demand Charges are not constant (or do not escalate at a constant rate) over the life of the project annual Demand Charges can be entered in Table 1C Project Annual Inputs. Historical data entered in the Monthly Sheet can be transferred into this blue shaded cell by executing the UTILITIES Populate with Data From... option on the EconExpert Command Menu. xvii. Value of Excess Electricity Sold BACK TO Utility, c/kwh (Global Inputs) This is the price of electric energy sold back to the utility in each quarter, expressed in cents/kwh. Energy sales back to the utility will be calculated by the model based on excess electric generation after accounting for use at the site and any sales under contract to third parties. Revised 7/14/03 Page 100 EconExpert-DG Users Manual – Copyright 2001 - 2005 Projected monthly prices can also be entered in the Monthly Data Table, and transferred to the Annual Inputs Sheet using the UTILITIES Populate with Data From... option on the EconExpert Command Menu. xviii. Standby Charges to Ensure Firm Backup Power, $/kw mo (Global Inputs) Standby Charges are a Monthly fee, expressed in $/kw mo that represent new charges to the customer of the utility to ensure that in the event of an outage in the CHP facility, the utility will provide firm backup power. Normally, if standby charges are imposed, there are no additional penalties or demand charges paid by the customer even if the DG Facility experiences interruptions in service. If the standby charges are not expected to escalate at a constant factor over the life of the project, annual standby charges can be entered in Table 1C Project Annual Inputs. Non-Zero values entered in Table 1 C will override this value in the years that they are entered. Projected prices can also be entered in the Monthly Data Table, and transferred to the Annual Inputs Sheet using the UTILITIES Populate with Data From... option on the EconExpert Command Menu. xix. Value of Site Uses of Thermal Energy, $/Therm WITHOUT DG (Global Inputs) This is the quarterly average price of thermal energy (gas or other fuel) in $/Therm in Base Year $ at the site if WITHOUT DG. The entered amount will be escalated by the GNP Escalator plus the Real Escalation Factor input to the right. These equivalent fuel prices will be used to determine THERMAL SAVINGS associated with offset fuel purchases due to use of waste heat from the DG plant. If the quarterly fuel prices do not vary at a constant escalation rate over the life of the project, annual fuel prices by quarter can be entered in Table 1C Project Annual Inputs. Historical data entered in the Monthly Sheet can be transferred into this blue shaded cell by executing the UTILITIES Populate with Data From... option on the EconExpert Command Menu. Revised 7/14/03 Page 101 EconExpert-DG Users Manual – Copyright 2001 - 2005 xx. Value of Site Uses of Thermal Energy, $/Therm WITH DG (Global Inputs) This is the quarterly average price of thermal energy (gas or other fuel) in $/Therm in Base Year $ at the site if WITH DG in Operation. The entered amount will be escalated by the GNP Escalator plus the Real Escalation Factor input to the right. These equivalent fuel prices will be used to determine THERMAL SAVINGS associated with offset fuel purchases due to use of waste heat from the DG plant. If the quarterly fuel prices do not vary at a constant escalation rate over the life of the project, annual fuel prices by quarter can be entered in Table 1C Project Annual Inputs. Historical data entered in the Monthly Sheet can be transferred into this blue shaded cell by executing the UTILITIES Populate with Data From... option on the EconExpert Command Menu. xxi. DG Plant - Fuel Price, $/Therm (Global Inputs) This is the price of gas or other fuel in $/Therm in Base Year $ for the DG Facility. The entered amount will be escalated by the GNP Escalator plus the Real Escalation Factor input to the right. Fuel prices will be used to determine the cost of fuel for the DG Plant. If the quarterly fuel prices do not vary at a constant escalation rate over the life of the project, annual fuel prices by quarter can be entered in Table 1C Project Annual Inputs. Projected monthly prices can also be entered in the Monthly Data Table, and transferred to the Annual Inputs Sheet using the UTILITIES Populate with Data From... option on the EconExpert Command Menu. Revised 7/14/03 Page 102 EconExpert-DG Users Manual – Copyright 2001 - 2005 xxii. Other Revenues (Global Inputs) In addition to revenues from Energy Sales to the Utility, the user may specify other sources of Project Revenues that involve third parties including: Capacity Payments – Inputs include the: o Number of Months/year that the payment applies o $/kw month payment rate (expressed in Base Year $) o Real Escalation Rate of the payment amount. Hot Water or Steam Sales – Inputs include the: o 1000 lb/hr of steam sold o $/1000 lb value of the steam (expressed in Base Year $) o Real Escalation Rate of the steam price. Note that the net plant heat rate is computed based on the Rated Net Plant Capacity and does not include steam sales. Waste Heat Sales – Inputs include the: o Therms/hour o $/Therm (expressed in Base Year $) o Real Escalation Rate. Electric Energy Sales – Inputs include the: o Kilowatts o Cents/kwh o Real Escalation Rate EconExpert-DG will deduct any electric energy sales to third parties from excess sales of energy before allocating remaining excess electricity back to the utility. Figure 47 - Table 1 Project Global Inputs – Other Revenues If desired, the user may alternatively specify over riding Annual Capacity Payments and Steam Pricing in Table 1C. xxiii. Variable Operating and Maintenance Costs (Global Inputs) Variable Operations and Maintenance costs are costs that relate to the operating load and number of hours of operation of the facility. Thus, these costs will increase or decrease depending on how much energy is produced from the facility. Revised 7/14/03 Page 103 EconExpert-DG Users Manual – Copyright 2001 - 2005 Two “User-Defined” categories of Variable O&M are provided. The user can name these categories and the names will be carried into the various tables and charts throughout the model. There are also two options for inputting of Variable O&M costs in each of these categories, 1) cents/kwh , and 2) $/year at 100% capacity factor. Both are expressed in Base Year $. The calculated annual variable O&M costs will be the sum of these two entries and will reflect the annual plant capacity factor. Variable O&M inputs to Table 1 are expressed in Base Year $, and a Real Escalation factor is provided. Note that real escalation will be computed by adding the GNP Escalator to the Real Escalation, to arrive at the “Nominal” escalation for that item. For additional information on escalation, see page 90. Figure 48 - Table 1 Project Global Inputs - Variable O&M xxiv. Fixed Operations and Maintenance Costs (Global Inputs) Fixed Operations and Maintenance costs are costs that do not depend on the level or duration of operation of the facility. An example of fixed O&M is any labor associated with the plant which is available and must be paid for regardless of whether or not, or at what level the facility is operated. Fixed O&M Inputs to Table 1 can be entered in either of two User-Defined categories. The user can name these categories and the names will be carried into the various tables and charts throughout the model. The annual Fixed O&M can be entered in $/year for a full calendar year of operations. The names of the Fixed O&M categories defined by the user will be carried to the appropriate tables and reports in the model. In addition to the two User-Defined Fixed O&M categories, a separate input category is provided for Expensed Major Maintenance. Expensed Major Maintenance is costs incurred during annual scheduled outages when refurbishment of the plant is provided. If partial-year operations occur in the first or last year of the project, the resulting Fixed O&M costs discussed above will be prorated. These costs are also expressed in Base Year $. A Real Escalation factor is provided which is ADDED to the GNP Escalator, to arrive at the effective (or “Nominal”) escalation for that component. For additional information on escalation, see page 90. Figure 49 - Table 1 Project Global Inputs – Fixed O&M Revised 7/14/03 Page 104 EconExpert-DG Users Manual – Copyright 2001 - 2005 xxv. Property Taxes and Insurance (Global Inputs) Property Taxes and Insurance can be individually input in Table 1 as amounts in $/year, and as a “Factored” amount (if both entries are used, they are summed) as follows: The Factor for estimation of life-of-project yearly Property Taxes and Insurance is the % of estimated valuation of the Asset based on an assumption of straight-line depreciation over the specified project life. As the Asset is depreciated and the valuation declines, the annual Property Taxes and Insurance will decline. If a $ amount is entered for Property Taxes or Insurance, the amount is used in each year of the project life and is escalated with the GNP deflator. The user may also enter annual property taxes and annual insurance costs in the Annual Inputs Table, where specific amounts can be entered in each year. Figure 50 - Table 1 Project Global Inputs – Property Taxes and Insurance xxvi. Capital Investment Costs (Global Inputs) Capital Investment Costs, are input only in Table 1. These are costs incurred during the project development, engineering and construction phases of the project, but prior to commercial operations of the facility. Please note that these costs are not escalated by the model, and are used as the exact amounts entered by the user. These costs are broken into two main categories: • Phase 1 – Development Costs (Global Inputs) These “at-risk” costs are typically incurred prior to financial closing and are treated by EconExpert-DG as a lump sum expense in the first month of the construction phase. A number of default cost categories are provided as well as two optional User-Defined Categories. The user may also add contingency as a percentage of the Development Costs and as a fixed amount in $ (the two entries will be summed if both are entered). You can specify up to 5 categories of Phase 1 Development Costs. Figure 51 - Table 1 Project Global Inputs – Development Costs Revised 7/14/03 Page 105 EconExpert-DG Users Manual – Copyright 2001 - 2005 • Phase 2 – Engineering, Construction and Start-up Costs (Global Inputs) These are costs that occur after financial closing, including interest during construction, which is calculated using the Construction-Phase Drawdown Schedule in Table 3. Land and Soft Costs (e.g. Start-up/Mobilization/Spares, Working Capital, Debt Reserves, Up-Front Financing Fees, Interest During Construction), which are concentrated at the start or end of the construction phase, are also entered here. You can specify up to 5 categories of Phase 2 Costs. The user may also add contingency as a percentage of the other Phase 2 Costs and as a fixed amount in $ (the two entries will be summed if both are entered). Soft costs can be estimated using a Factored amount and a $ amount. If both are entered, they will be summed. Factored amounts are calculated as follows: Start-up, Mobilization Costs – Start-up costs are up front expenses incurred to get the plant operational. They can include fuel, labor and other capitalized expenses that are incurred prior to acceptance of the facility. Start-up costs are included in the plant basis and are depreciated for book or for cash purposes. These costs can be entered and/or estimated as a percentage of the total Fixed O&M Costs (excluding Expensed Major Maintenance) in Base Year $. Working Capital – Working Capital covers cash flow associated with the difference between payables and receivables. Working Capital is NOT included in the plant basis and is NOT depreciated for book or for cash purposes. Working Capital is recovered at the end of the project life. The amount of Working Capital can be entered and/or estimated based on a number of months of fuel costs in Base Year $. Debt Reserves – Debt Reserves are funds that the bank may require the owner to hold in reserve to ensure payment of debt for a specified period. Debt Reserves are NOT included in the plant basis and are NOT depreciated for book or for cash purposes. Debt Reserves are recovered when the debt is retired. Spare Parts - Spare parts are parts stored in inventory at the site. The investment in residual spare parts will be recovered when the project is retired. Spare parts costs are not included in the basis and are not depreciated for book or for cash purposes. The cost of spare parts can be input and/or estimated as a percentage of the total Fixed O&M Costs (excluding Expensed Major Maintenance) in Base Year $. Up Front Financing Fees – Up-Front Financing fees are charged at the end of the construction term towards the cost of permanent financing. They are capitalized with the project investment cost. The user may enter the amount of the fees or have EconExpert estimate them as a percentage of the approximate amount borrowed. Revised 7/14/03 Page 106 EconExpert-DG Users Manual – Copyright 2001 - 2005 Figure 52 - Table 1 Project Global Inputs – Engineering and Construction Phase Costs Revised 7/14/03 Page 107 EconExpert-DG Users Manual – Copyright 2001 - 2005 • Plant Salvage Value at the End of the Project Life (Global Inputs) Following the Capital Investment Cost table, the user is provided with the option to recover a salvage (or terminal) value on the plant investment at the end of the Project Life. The salvage value is specified either as a $ amount or as a percentage of the original plant basis. This input is shown in the Figure below: Figure 53 – Salvage Value at the End of the Project Life If a plant salvage is included, the % of the plant basis that is depreciated should either be reduced by the percentage of the salvage value or a capital gains tax should be specified to be applied against the lump sum income that is recovered against a fully depreciated asset. xxvii. Financing (Global Inputs) EconExpert-DG lets you choose from multiple financing options including: • • • Debt Equity Financing Capital Leases Operating Leases xxviii. Permanent Financing (Global Inputs) Permanent financing, or a Capital Lease, can be divided into two parallel Tranches, each with its own financing terms. Terms entered here will apply to the life of the lease or loan. A Capital Lease normally provides 100% financing. A Capital Lease is structured much the same as debt, so that the Owner (the Leasee) holds title to the project assets on their books. As a result, the owner will capture all of the associated tax depreciation. Often times a Capital Lease will provide 100% financing. If the Operating Lease Switch is NOT selected EconExpert will assume a Debt/Equity or Capital Lease structure. Please Consult your Tax Advisor to confirm this information. Revised 7/14/03 Page 108 EconExpert-DG Users Manual – Copyright 2001 - 2005 If special financing terms are required, such as variable interest rates or accelerated principal payments, those amounts can be entered as annual inputs and will override the amounts entered here where they apply. Construction Financing – The user can specify the interest rate applied during the term of the construction loan. Interest During Construction is calculated in Table 3, using either the Default or User-Defined Drawdown Schedule. Permanent Debt OR Capital Lease Financing, Primary Debt and Subordinated Debt The user can specify the “mortgage type” loan parameters including the: o Term of the loan o Fixed interest rate o Annual Financing Fees For the purposes of calculating debt coverage ratios, the coverage ratio for Primary Debt is calculated assuming funds available to cover debt including all expenses and Subordinated Debt Costs. Please note that if the “Operating Lease” option is selected, the Permanent Debt or Capital Lease Financing section of this table will be grayed out and will be inactive in the model. Figure 54 - Table 1 Project Global Inputs – Financing Terms Revised 7/14/03 Page 109 EconExpert-DG Users Manual – Copyright 2001 - 2005 xxix. Operating Leases (Global Inputs) In an Operating Lease, the title and tax benefits are retained by the Leasor (the Leasing Company) and the Leasee makes a periodic lease payment. At the end of the lease term, the Leasee may have the option to purchase the facility at a "Fair Market" Value. An Operating Lease is structured so that the Leasing Company (the Leasor) takes title to the project assets on their books. As a result, they are able to capture all of the associated tax depreciation at the Leasing Company's income tax rates. This can provide advantages for the Leasee (the Customer) as the Leasee might not be able to as fully take advantage of the associated depreciation write-offs. The following four criteria must be satisfied for a lease to qualify as an Operating Lease: • • • • The lease does NOT transfer ownership to the Leasee at the end of the term. The lease does NOT contain a "Bargain Purchase" option. The lease term is NOT equal to or longer than 75% of the economic life of the asset. The present value of the lease payments does NOT equal or exceed 90% of the fair value of the leased property. If these conditions are satisfied, you may select this option and EconExpert will treat the lease as a fixed operating cost for book and for tax purposes. If any of these criteria are not satisfied, the lease is a Capital Lease and so must remain on the books of the customer. The Operating Lease criteria are subject to review and approval by the IRS. Please Consult your Tax Advisor to confirm this information. Please note that if the “Operating Lease” option is not selected, the Operating Lease section of this table will be grayed out and will be inactive in the model. This checkbox is duplicated in the Switches Section of Table 1. Selection of either checkbox will accomplish the same result. Revised 7/14/03 Page 110 EconExpert-DG Users Manual – Copyright 2001 - 2005 Figure 55 – Table 1 Project Global Inputs – Operating Lease xxx. Sources of Capital A summary of sources of capital for the project is provided in this section. The figure below shows these amounts. Figure 56 – Sources of Capital Summary in Table 1 There are no inputs in this section. The table is provided as a summary to assist in setting up the Depreciation Schedules that follow. xxxi. Depreciation (Global Inputs) EconExpert-DG uses the 'Deferral Method' of Generally Accepted Accounting Principles (GAAP) for all Book Analyses including the Income Statement, Cash Flow Statement and Balance Sheet in Table 9. Depreciation is calculated using the cost basis of the plant (Capital Investment minus working capital, debt reserves, land and spare parts). In this section of Table 1, the user specifies the percentages of the original plant Cost Basis that are depreciated for Cash Tax and for Book Tax purposes. Depreciation for cash taxes is calculated using IRS Modified Accelerated Cost Recovery (MACRS) depreciation schedules. Book depreciation uses Straight-Line Methods. Both methods prorate depreciation for partial operation in the first year and accelerate capture of depreciation in the last year of operation if the project is retired before the end of the depreciation life. Deferred taxes are calculated by the model based on the difference between book and cash taxes, resulting from the differences between these two depreciation calculations. Revised 7/14/03 Page 111 EconExpert-DG Users Manual – Copyright 2001 - 2005 Figure 57 - Table 1 Project Global Inputs – Depreciation for Book and Cash In addition to the 5 standard (5, 7, 10, 15 and 20 years) MACRS depreciation Classes that are programmed in the model, the user may select from two additional categories that can be defined by the user. To use either or both of these categories, first name the category in the unprotected cells titled “User Defined in Table 11” and then specify the % of the tax basis to be depreciated in each of your user defined categories. Next from the NAVIGATE menu select: NAVIGATE Results Tables Table 11 Depreciation In the shaded cells, specify the amount (in decimal fraction 0.100 = 10.0%) to be depreciated in each year such that the total sums to 1.000. User Defined Depreciation Schedules in Table 11 Depreciation xxxii. Income Taxes and Investment Tax Credits (Global Inputs) This is the area in Table 1 where the user specifies the tax rates to be applied for Federal and State Income Taxes. State Income Taxes are treated as a deduction for the purpose of estimating Federal Income Taxes. You may also customize the annual Federal and State Tax rates in Table 1 Annual Inputs. Revised 7/14/03 Page 112 EconExpert-DG Users Manual – Copyright 2001 - 2005 The user may also select an Investment Tax Credit to be applied towards Federal or State Income Taxes. The Investment Tax Credit (ITC) is calculated as a percentage of the project capital costs. If the Investment Tax Credit is selected, the total annual depreciation basis for Cash Tax purposes should be reduced by the amount of any Investment Tax Credit that is applied. Figure 58 - Table 1 Project Global Inputs – Income Taxes and Investment Tax Credit If desired, the user may alternatively provide annual additional deductions and tax amounts in Table 1C. Revised 7/14/03 Page 113 EconExpert-DG Users Manual – Copyright 2001 - 2005 f) Calculation of IRR and the IRR Guess (Global Inputs) Calculation of the Project's Internal Rate of Return (IRR) is an important analysis feature in EconExpert-DG. The IRR (and Net Present Value - NPV) are summarized at the top of Table 1 where you can continuously view how they react to changes in Inputs to Table 1. Microsoft Excel uses an iterative technique for calculating IRR. The guess is a number that you believe is close to the result you expect for the IRR. Starting with guess, the IRR calculation cycles until the result is accurate within 0.00001 percent. If IRR can't find a result that works after 20 tries, the #NUM! error value is returned. In most cases you will not need to provide guess for the IRR calculation. If a guess is omitted, a guess of 0.1 (10 percent) is assumed by Excel. If the IRR result gives the #NUM! error value, or if the result is not close to what you expected, try again with a different value for guess. The IRR Guess is entered in Column I, just above Table 1. Figure 59 - Table 1 Project Global Inputs – The IRR Guess Note that the IRR Summary Table at the top of the Global Input sheet allows the user to specify what IRR period will be monitored in the Pop-Up and in the Table 1 IRR/NPV summary. The third input column of this table is especially important because it specifies the IRR Term that will be used in EconExpert-DG’s Automated Sensitivity Analyses and Tornado Diagrams. Revised 7/14/03 Page 114 EconExpert-DG Users Manual – Copyright 2001 - 2005 2) Simplified Inputs The Simplified Inputs Sheet provides a simplification of data entry to be used in the Global Inputs Sheet. Inputs are entered in the shaded cells based on Annual Averages. Red inputs indicate critical values for which it is highly recommended that input data should be entered. (Note: Not available in Excel 97). Like Table 1, Project Global Inputs, this input sheet is organized into sections associated with each class of inputs. You can locate a specific input by scrolling through the table. You may automatically populate Table 1 Project Global Inputs with entries in this table by selecting: UTILITIES Populate with Input Data from the Monthly Data, Simplified Input or Time-of-Use Wizard Sheets Transfer Simplified Input Data to Global Inputs Sheet from the EconExpert Command Menu. Note that ALL of the inputs listed here will be transferred to the Global Inputs Sheet, treated as average annual values, overwriting the corresponding quarterly values that are currently in Table 1 Project Global Inputs. You will be provided with the option to save the Global Inputs Sheet before the data is overwritten. EconExpert will allow you to use default values for other assumptions for remaining inputs or to use assumptions that have been previously populated into the Global Inputs Sheet by you or others in your organization. Please note that this data input sheet WILL NOT be used in the proforma unless you select the option to Populate the Global Inputs Sheet using the Transfer Data option described above. If you select the option to use the default EconExpert values in Table 1 Project Global Inputs, the following will be assumed. When you use the Simplified Inputs Sheet, annual costs & savings are allocated quarterly. The user then has the option to use EconExpert's Default Assumptions for remaining inputs or to substitute their own assumptions. Revised 7/14/03 Page 115 EconExpert-DG Users Manual – Copyright 2001 - 2005 Figure 60 – EconExpert-DG’s Default Assumptions Associated with the Simplified Inputs Sheet * * * * * * * * * * * * * * * One Tranche of Debt The utility tariff will not change when DG is added No Tax-Loss Carry-Forward 50/50 Debt Equity No annual changes in Site Requirements or DG Plant Performance All costs and savings escalate at GNP 6% Discount Rate for NPV Calculations 1.75% Interest Rate earned on Escrowed Funds No Demand Ratchets Apply No Forced Outages All Excess Production sold back to utility (NO Third Party Sales) No Capacity Payments or Thermal Sales to Third Parties Property Taxes & Insurance are each 1% of Asset Basis No Terminal Value 35% Federal Income Tax Rate The User may override the *'d items by entering their own values in the Global Input Sheet prior to transferring the data. All other inputs are set to 0. Other key assumptions when you utilize the Simplified Input Sheet include: o The debt term or lease term are equal to the project life. o The depreciation life is the MACRS class that is less than and closest to the project life o Annual usage rates, costs & savings are prorated quarterly. Revised 7/14/03 Page 116 EconExpert-DG Users Manual – Copyright 2001 - 2005 Figure 61 – The Simplified Inputs Sheet Revised 7/14/03 Page 117 EconExpert-DG Users Manual – Copyright 2001 - 2005 3) Table 1C Project Annual Inputs Annual Inputs apply only to a given year in the life of the project. You can use Annual Inputs any time that you would like to more precisely model a variable than can be accomplished using Table 1 Project Global Inputs. Any non-zero entry is read as an Annual Input and included in the calculations in the model. If it is desired to enter a 0 for Annual Input, use a very small number like 0.0000001, and the zero value will be used in the model. Where appropriate, this means that Global Inputs from Table 1 will be overridden in the years that Annual Inputs are entered. The blue shaded cells represent the site WITHOUT DG Operating. The Green shaded cells represent data that is typically projected for the customer’s site, after installation of the DG project and WITH the DG plant Operational. This input data can include information such as the customer’s / site’s expected gas or electric usage, gas or electric pricing, electrically driven chiller operation, etc., or DG Plant Parameters. Data populated from the Projected Data in the Monthly data sheet will be transferred into this sheet. The Figure below provides a Screen Shot of Table 1C: Figure 62 - Screen Shot of Table 1C Project Annual Inputs Revised 7/14/03 Page 118 EconExpert-DG Users Manual – Copyright 2001 - 2005 Table 1C is Range Protected, allowing you to enter data ONLY into specified blue shaded Input cells. Table 1C is organized into sections associated with each class of Input Categories. Input Categories are organized with their related inputs listed in rows under that category. The columns to the right in Table 1C each represent a year in the life of the Project, with Column F used for the first year of the project life. You can locate a specific Input Category in Table 1C by either scrolling through the table, or by using the NAVIGATE feature on the Command Menu. Individual input titles in Table 1C appear on the left of the table followed by the “Input Indicator” and notes about the group of inputs. On the right side of the table, shaded cells provide locations for inputs of annual data starting in the first operating year of the project life. Table 1C is organized in the following sections. Escalation – Annual GNP Deflator Quarterly Performance and Pricing Data o Site Electric Demand and Tariff Data WITHOUT and WITH DG o DG Plant and Absorption Chiller Performance o Electric Energy Prices o Thermal Energy Prices Chiller Performance Other Revenues DG Plant Operations and Maintenance Costs Debt Services or Capital Lease Terms Property Taxes, Insurance and Income Taxes After-tax Dividends Examples of how you can use Annual Inputs to Table 1C to perform custom calculations include: • • • • • • Using User Defined Additional Annual Revenue Sources and User Defined Additional Annual Expenses to model special contracts or agreements o Power Purchase Agreements o Fuel Supply Agreements o Energy or Steam Sales Agreements o O&M Contracts To model the impacts of Forced Outages of the DG Plant on loss of revenues and added demand charges To model changes for forward electricity or gas prices or markets To model predicted changes in the performance of the DG Plant. To model customized debt o Variable interest rates o Accelerated or deferred principal payments (Sweeps) tied to the Debt Service Coverage Ratio (DSCR) o Interest only payments o Lump sum principal repayments Step changes or single year events Revised 7/14/03 Page 119 EconExpert-DG Users Manual – Copyright 2001 - 2005 • • To customize income tax depreciation schedules Virtually any other way that you desire allowing you to customize EconExpert for any set of circumstances Note that you can also enter formulas into annual input cells. These formulas can be linked to other parts of EconExpert-DG, to sheets that you insert into the model, and to sections at the bottom of each table that are available for you to perform your own calculations. Results generated using Annual Inputs entries to Table 1C will either override results produced from a corresponding Global Inputs to Table 1, will be added to those results, or will allow the user to introduce new “User-Defined” categories. Examples of specific inputs where results are added rather than overriding Global Inputs include: Forced Outages User Defined Revenue Sources (6 Categories that you can define) User Defined Expenses (6 Categories that you can define) Additional Tax Deductions Additional State Taxes, and Additional Federal Taxes Each of these is noted in Table 1C. All of the other inputs will override Table 1 Inputs in, AND ONLY IN, the years that values are entered in Table 1C. If Annual Inputs are entered in every year of the project life, the corresponding Global Inputs entered in Table 1 will be totally overridden and will not be used in the analysis. If Annual Inputs are only entered in some years, then the Global Inputs will be used in all other years, applying escalation where appropriate. If Annual Inputs are entered into any cell in Table 1C, the respective “Input Indicator” will show the value 9999999 (Column C), along the left side of the respective inputs and the corresponding non-zero inputs are also reformatted to Bold Red on Yellow Background. If there are no non-zero entries in a row, then a red 0 will appear in Column C. The corresponding input to Table 1 will also be reformatted to Bold Red and a red warning labeled Annual Inputs will appear next to the input in Table 1, advising you that an Annual Input value has been entered and that the corresponding Global Input will been overridden. The Status Sheet will also provide a notice that this has occurred. A feature is provided on the EconExpert-DG UTILITIES Menu that allows you to clear and reset the Annual Input Table to all 0s, meaning that none of the inputs to Table 1 will be overridden. To RESET the Annual Inputs Table from the UTILITIES menu select: Save or Reset Inputs Reset Annual Inputs to 0’s Note that if you do this, the current Annual Inputs will be lost. You will be provided with a warning. If desired, you can save the Annual Inputs to the Holding Bin before Resetting them. This can be initiated from this same menu option. Revised 7/14/03 Page 120 EconExpert-DG Users Manual – Copyright 2001 - 2005 The individual Annual Inputs are discussed in more detail starting on page 118. Examples provided in the Appendix also give examples on how to use the various Global Inputs. A variety of Help Comments also appear with each input in Table 1. PLEASE NOTE: Cost entries are input to Table 1C in CURRENT $, and represent the actual amount spent in a given year. This means that the cost and revenue entries to Table 1C will not be impacted by escalation rates entered elsewhere in the model, and fixed values will not be impacted by partial year operation. The values will be used by the model as entered. Note: * are items where SAVINGS are realized as a result of DG, ** are items that result in NEW COSTS that may be incurred as a result of DG a) General Inflation Rate for Revenues & Expenses, % (Annual Inputs) This is the Gross National Product Inflation Rate, applied for each year during the life of the project. The GNP Escalation rate is the core rate of general inflation used by the model. Escalation rates for individual components can be adjusted up or down from this core rate by entering the Real Escalation of that component, which is added to the GNP Escalator. If the GNP escalation rate is not constant over the life of the project, the escalation rate can be entered here for any year or period of years. Values entered to the right will override the value entered in Table 1 in the years that they are input in this table. Figure 63 – General Inflation Rate (GNP) for Revenues and Expenses b) Quarterly Inputs to the Annual Inputs Sheet This section allows you to enter ANNUAL projected pricing and DG plant performance data on a quarterly basis. Corresponding costs will be itemized in the calculations performed by EconExpert-DG on a quarterly basis. Such data might be projected from actual monthly electric and gas bills received by the site owner. Also note that items where SAVINGS are realized as a result of DG are identified by a * and items that result in NEW COSTS associated with the addition of DG are identified by a **. Revised 7/14/03 Page 121 EconExpert-DG Users Manual – Copyright 2001 - 2005 For additional explanation on transferring projected monthly data from the Monthly Data Sheet to the Annual Input Sheet see page 135. Site Electric and Gas Demand (Excluding DG) (Annual Inputs) i. Average Maximum Site Electric Energy Demand, kw (Annual Inputs) This is the Average MAXIMUM electric energy demand at the location, including electric chillers if applicable but not including any power generated or used by the DG Facility, during the applicable period. If the Maximum demand varies from month to month, the values entered should represent the “Average” for the period since the quarterly demand charges will be an aggregate of the individual monthly charges during the quarter. The values entered here will be used to estimate the costs associated with demand charges to ensure that adequate capacity is available from the utility if the DG facility is not available. Projected data entered in the Monthly Sheet can be transferred into this sheet by executing the UTILITIES Populate with Data From... option on the EconExpert Command Menu. ii. Site Displaceable Electric Energy Consumption, 1000 kwh/period WITHOUT DG (Annual Inputs) This is the Average of the three month PEAK electric energy demands at the location, including electric chillers but WITHOUT DG. Facility, during the applicable period. If the peak demand varies from month to month, the values entered should represent the “Average” for the period since the quarterly demand charges will be an aggregate of the individual monthly charges during the quarter. The values entered here will be used to estimate the costs associated with demand charges to ensure that adequate capacity is available from the utility if the DG facility is not available. Inputs entered here will override inputs to Table 1 Project Global inputs in the years that non-zero entries appear. iii. Electric Chiller Electric Energy Use, 1000 kwh/period WITHOUT DG (Annual Inputs) This is the total electric energy demand (in 1000 kwh/quarter) at the location, not including any power used or generated by the DG Facility and EXCLUDING the electric chillers. The quarterly values entered here will be used to estimate savings associated with the displacement of electric energy purchases from the utility by self- generation. Revised 7/14/03 Page 122 EconExpert-DG Users Manual – Copyright 2001 - 2005 The Chiller requirements will be separately input in the next section. In TriGeneration has been selected, power for the Electric Chillers will be displaced by the use of Absorption Chillers. Values entered here will override Global Inputs in the years that non-zero entries appear. iv. Site Displaceable Use of Thermal Energy, 1000 Therms/Period (Annual Inputs) These are the Annual quarterly total amounts of thermal use (supplied by natural gas or other fuel in each quarter) consumed at the site, in 1000 Therms/quarter. Non-zero values or formulas resulting in non-zero results will override inputs to the Global Inputs sheet in the years that the non-zero results appear and will be used to calculate the heat consumption at the site in Therms/period, and the amount of waste heat that can be displaced by the CHP Facility. Projected data entered in the Monthly Sheet can be transferred into this sheet by executing the UTILITIES Populate with Data From... option on the EconExpert Command Menu. DG Plant and Absorption Chiller Performance (Annual Inputs) v. Net DG Plant Electric Generating Capacity, kw (Annual Inputs) This is the net Capacity of the DG Plant (in kw). It is also the basis from which Demand Charge Savings and Standby Charges will be calculated as it represents the incremental demand reduction at the site or the incremental amount of stand-by power that the site will require if the DG Plant experiences an unscheduled forced outage. Non-zero values or formulas resulting in non-zero results will override inputs to the Global Inputs sheet in the years that the non-zero results appear. Net Electric Production will be calculated based on the net capacity and the capacity factor. Projected Monthly NET Capacities can also be entered to and transferred from the Monthly Data Table. vi. Waste Heat from DG Available For Non-Chiller Thermal Use, Therms/hr (Annual Inputs) This is the rated NET plant waste heat in therms/hr (= 100,000 Btu/hr) in each quarter. This includes applicable steam or hot water applications. Non-zero values or formulas resulting in non-zero results will override inputs to the Global Inputs sheet in the years that the non-zero results appear and will be used to estimate savings associated with the displacement of purchases of natural gas or other fuel. Revised 7/14/03 Page 123 EconExpert-DG Users Manual – Copyright 2001 - 2005 If the amount of waste heat available from the DG Plant is greater than the amount of thermal energy that can be displaced at the site, the excess waste heat can be sold to a third party or will be vented. If the facility uses absorption chillers, the heat requirements for the absorption chillers should NOT be included in this input. Projected Monthly rates can also be entered in the Monthly Data Table and the aggregated values can be transferred to the Annual Inputs Sheet. vii. DG Plant Gross Fuel Input (Therms/hr - HHV Basis) (Annual Inputs) As an alternative to entering the heat rate in the Global Inputs Sheet, this is the average quarterly gross heat input (MMBtu/hr) based on the higher heating value (HHV) of the fuel. If the plant will be cycled during the year, this represents the composite average for the respective quarter. Non-zero values or formulas resulting in non-zero results will override inputs to the Global Inputs sheet in the years that the non-zero results appear. Note that if the Heat Input is entered here, it takes precedence over both the Heat Rate Input to the Global Inputs Sheet and the Gross Fuel Inputs in the Global Inputs Sheet. Aggregated monthly rates entered in the Monthly Data Table can be transferred to this sheet. viii. DG Plant Capacity Factor in Each Quarter, % (Global Inputs) This is the percentage of the potential plant output that will occur during each quarter, accounting for number of hours in service, and level of operation when the facility is operated. For example, if the plant will be operated at full capacity during 50% of the hours in the period, this entry would be 50%. Similarly, if the plant were to be operated at 50% capacity for the whole period, the entry would also be 50%. Non-zero values or formulas resulting in non-zero results will override inputs to the Global Inputs sheet in the years that the non-zero results appear. Monthly rates can also be entered in the Monthly Data Table. The monthly data will be aggregated in that sheet and can be automatically reference to the Annual Inputs Sheet by selecting the UTILITIES POPULATE WITH …. Option on the EconExpert-DG Command Menu. ix. Forced Outage Rate (Annual Inputs) This section is used ONLY to assess impacts of forced outages on reversal of Demand Charges which will be applied ONLY if Stand-By charges have NOT been assessed. While a forced outage of the facility would result in an impact on Revised 7/14/03 Page 124 EconExpert-DG Users Manual – Copyright 2001 - 2005 operating expenses and lost revenues, those impacts MUST be addressed through the capacity factor entry. In periods where a forced outage occurs during a peak demand period, (if there are NO Standby Charges) any savings in demand charges will be reduced reflecting a penalty imposed by the utility in the current quarter. The reduction will be equal to the calculated MW of cogen plant capacity that is lost during the outage and Tariff requirements associated with an outage. If the entire facility goes off-line, the quarterly amount is equal to 100% times the number of months applied / 3. If charges will be assessed for a period that exceeds the current quarter, the outage should be modeled for multiple quarters. If the charges will be assessed for only one month, the outage should be modeled as 1/3 of the amount representing 1/3 of the quarter. If the DG Facility does not operate reliably, the savings in demand charges may be reduced or eliminated, and a demand ratchet may apply in the succeeding period The calculation of savings associated with reassessment of demand charges is based on the following: o If Standby Charges are assessed, there will be no reassessment of demand charges or demand charge savings. o If there are no Standby Charges, the Demand Charges (or resulting savings) in each year will be assessed on the current quarter. o If the facility experiences an unplanned outage during the year, the basis for demand charges in that quarter will be the new demand basis for that quarter. This rate is usually the demand charge WITHOUT DG but if there is a change in the tariff it is the resulting value of the demand that is displaced. If the Demand Charges are not constant (or do not escalate at a constant rate) over the life of the project annual Demand Charges can be entered here. If it is desired to model the impacts of a special demand charge penalty associated with an outage (i.e. one that is different than the demand charges that have been entered) those alternative penalties can be addressed by entering an additional "Demand Charge" penalty in the Additional User Defined Annual Expenses Inputs below. Figure 64 - Forced Outage Rate Revised 7/14/03 Page 125 EconExpert-DG Users Manual – Copyright 2001 - 2005 Absorption Chillers x. Maximum Coincident Electric Chiller Demand Displaced by Waste Heat, kw (Annual Inputs) These inputs are applied ONLY if the Tri-Generation Switch is selected in the Global Inputs Sheet. The inputs should reflect the amount of chiller electric energy load that can be offset from available waste heat and so might be limited by the available amount of waste heat from the Tri-Generation Plant. This is the maximum quarterly demand for the chillers (in kw) which is be displaced by waste heat from the DG Unit (i.e. if absorption chillers replace or offset electrically driven chillers). Non-zero values or formulas resulting in nonzero results will override inputs to the Global Inputs sheet in the years that the nonzero results appear. The values entered in each quarter will be used to calculate the amount of electric energy demand for chillers that can be displaced by use of waste heat from the CHP Facility. The “coincident demand” is the demand that occurs at the same time as the Maximum site demand, and so represents that amount of electric chiller Maximum demand that can be displaced by absorption chillers. Projected aggregated data entered in the Monthly Sheet can be transferred into this sheet by executing the UTILITIES Populate with Data From... option on the EconExpert Command Menu. xi. Displaced Electric Chiller Electric Consumption , 1000 kwh/period (Annual Inputs) These inputs are applied ONLY if the Tri-Generation Switch is selected. The inputs should reflect the amount of chiller electric energy use that can be offset from available waste heat used in absorption chillers and so might be limited by the available amount of waste heat from the Tri-Generation Plant. This is the maximum coincident quarterly amount of electric energy use by the chillers (in 1000 kwh/quarter) which will be displaced by waste heat from the DG Facility (i.e. if absorption chillers replace or offset electrically driven chillers). Non-zero values or formulas resulting in non-zero results will override inputs to the Global Inputs sheet in the years that the non-zero results appear. The values entered in each quarter will be used to calculate the amount of electric consumption by the chillers that can be displaced by use of waste heat from the CHP Facility during the specified period. Projected data entered in the Monthly Sheet can be transferred into this sheet by executing the UTILITIES Populate with Data From... option on the EconExpert Command Menu. Revised 7/14/03 Page 126 EconExpert-DG Users Manual – Copyright 2001 - 2005 Tariff Data – Basis of Savings and Revenues (Annual Inputs) xii. Cost of Electric Energy Purchased from Utility, c/kwh WITHOUT DG This is the value of displaced electric energy at the site WITHOUT DG, in cents/kwh. This is the quarterly "weight averaged" (or aggregated) power price based on the amount of power displaced during each period at the corresponding time-of-use rate. If needed, this aggregated value can be estimated using the Timeof-Use Wizard. The quarterly average power price should reflect the cost of power purchased during on-peak, mid-peak, off-peak conditions and super-off-peak periods, etc. during that month, and the amount of power used during each of those respective periods. If the cost of electric energy purchased from the utility is not expected to be constant (or is not expected to increase at a constant annual rate) annual Electric Energy Cost values can be entered here. xiii. Cost of Electric Energy Purchased from Utility, c/kwh WITH DG This is the value of displaced electric energy at the site WITH DG, in cents/kwh. This is the quarterly “weight averaged” (or aggregated) power price based on the amount of power displaced during each period at the corresponding time-of-use rate. If needed, this aggregated value can be estimated using the Time-of-Use Wizard. The quarterly average power price should reflect the cost of power purchased during on-peak, mid-peak, off-peak conditions and super-off-peak periods, etc. during that month, and the amount of power used during each of those respective periods. If the cost of electric energy purchased from the utility is not expected to be constant (or is not expected to increase at a constant annual rate) annual Electric Energy Cost values can be entered here. xiv. Demand Charges for Maximum Metered Power, $/kw mo WITHOUT DG (Annual Inputs) These are the Demand Charges WITHOUT or Prior to DG. Demand Charges are reflective of the maximum meter reading experienced by the customer during the target period. Often times a portion of the customer's bill is based on the maximum power demand that is used, either as a monthly average or during a specific on-peak period. The utility then includes in the power bill a fixed annual Demand Charge for capacity required to support that amount of demand. This input is the demand charges that will be paid to the utility in $/kw mo to ensure firm power to meet the annual load requirements. When the DG Facility is brought on-line, the customer should realize a savings in demand charges associated with the fact that as a result of self-generation, they no longer have as large of a demand requirement. Revised 7/14/03 Page 127 EconExpert-DG Users Manual – Copyright 2001 - 2005 If the DG Facility does not operate reliably, the savings in demand charges may be reduced or eliminated, and a demand ratchet may apply in the succeeding period xv. Demand Charges for Maximum Metered Power, $/kw mo WITH DG (Annual Inputs) These are the Demand Charges WITH or After DG is introduced. Demand Charges are reflective of the maximum meter reading experienced by the customer during the target period. Often times a portion of the customer's bill is based on the maximum power demand that is used, either as a monthly average or during a specific on-peak period. The utility then includes in the power bill a fixed annual Demand Charge for capacity required to support that amount of demand. This input is the demand charges that will be paid to the utility in $/kw mo to ensure firm power to meet the annual load requirements. When the DG Facility is brought on-line, the customer should realize a savings in demand charges associated with the fact that as a result of self-generation, they no longer have as large of a demand requirement. If the DG Facility does not operate reliably, the savings in demand charges may be reduced or eliminated, and a demand ratchet may apply in the succeeding period The calculation of savings associated with reassessment of demand charges is based on the following: o If Standby Charges are assessed, there will be no reassessment of demand charges or demand charge savings. o If there are no Standby Charges, the Demand Charges (or resulting savings) in each quarter will be assessed on the current quarter. If it is desired to model a partial quarter using the Annual Inputs Sheet simply prorate the value for the number of applied months in the quarter and divide by three. o If the facility experiences an unplanned outage during the year, the basis for demand charges in that quarter will be the new demand basis for that quarter. xvi. Demand Ratchet (Annual Inputs) The Demand Ratchet is a special condition used in some tariff or utility rate schedules which requires the customer to pay a premium on each bill during a specified period, typically related to peak demand or usage during a previous billing period. Ratchets are often used by utilities as a means to recover costs associated with installed capacity which the utility deems a customer previously used and so therefore should continue to fund for some period. As an example, some utility tariffs will require the customer to pay demand charges for the first year of operation of a DG facility which are based on the demand over the year prior to the operation of the DG facility. Similarly, after a forced outage of the DG facility (especially during an on-peak period), the utility may charge the customer higher demand fees for a specified period (often up to a year) following the outage event. Revised 7/14/03 Page 128 EconExpert-DG Users Manual – Copyright 2001 - 2005 This section of the Annual Inputs Sheet allows the user to evaluate the impact of Ratchets if they apply. The user may specify the 3 month average amount of the demand ratchet (in kw) which will apply during each respective quarter, resulting in a calculation of additional demand charges by EconExpert-DG in the months where non-zero ratchets are identified. xvii. Value of Excess Electricity Sold to the Utility, c/kwh (Annual Inputs) This is the price of electric energy sold back to the utility in each quarter, expressed in cents/kwh. Energy sales back to the utility will be calculated by the model based on excess electric generation after accounting for use at the site and any sales under contract to third parties. Non-zero values or formulas resulting in non-zero results will override inputs to the Global Inputs sheet in the years that the non-zero results appear. Projected monthly prices can also be entered in the Monthly Data Table, and transferred to the Annual Inputs Sheet using the UTILITIES Populate with Data From... option on the EconExpert Command Menu. xviii. Standby Charges to Ensure Firm Backup Power, $/kw mo (Annual Inputs) Standby Charges are a Monthly fee, expressed in $/kw mo that represent new charges to the customer of the utility to ensure that in the event of an outage in the CHP facility, the utility will provide firm backup power, in the current quarter. Normally, if standby charges are imposed, there are no additional penalties or demand charges paid by the customer even if the DG Facility experiences interruptions in service. If the standby charges are not expected to escalate at a constant factor over the life of the project, annual standby charges can be entered in Table 1C Project Annual Inputs. Non-Zero values entered in Table 1 C will override this value in the years that they are entered. Projected prices can also be entered in the Monthly Data Table, and transferred to the Annual Inputs Sheet using the UTILITIES Populate with Data From... option on the EconExpert Command Menu. Thermal Energy Prices (Annual Inputs) xix. Value of Site Uses of Thermal Energy WITHOUT DG, $/Therm (Annual Inputs) This is the value of Thermal Energy (the DELIVERED price of gas or other fuel in $/Therm) in current $ at the site WITHOUT DG. Fuel prices will be used to determine SAVINGS associated with the use of waste heat from the DG Plant. These fuel prices will be used to determine FUEL SAVINGS associated with offset gas purchases due to use of DG waste heat and will not be used to estimate costs of fuel for the DG Plant. Revised 7/14/03 Page 129 EconExpert-DG Users Manual – Copyright 2001 - 2005 If the quarterly fuel prices do not vary at a constant escalation rate over the life of the project, non-zero fuel prices entered in here will override entries to Table 1 Project Global Inputs. xx. Value of Site Uses of Thermal Energy WITH DG, $/Therm (Annual Inputs) This is the value of Thermal Energy (the DELIVERED price of gas or other fuel in $/Therm) in current $ at the site WITH DG in Operation. Fuel prices will be used to determine SAVINGS associated with the use of waste heat from the DG Plant. These fuel prices will be used to determine FUEL SAVINGS associated with offset gas purchases due to use of DG waste heat and will not be used to estimate costs of fuel for the DG Plant. If the quarterly fuel prices do not vary at a constant escalation rate over the life of the project, non-zero fuel prices entered in here will override entries to Table 1 Project Global Inputs. xxi. DG Plant - Fuel Price, $/Therm (Annual Inputs) This is the price of gas or other fuel in $/Therm in Base Year $ for the DG Facility. The entered amount will be escalated by the GNP Escalator plus the Real Escalation Factor input to the right. Non-zero values or formulas resulting in non-zero results will override inputs to the Global Inputs sheet in the years that the non-zero results appear. Fuel prices will be used to determine the cost of fuel for the DG Plant. Projected monthly prices can also be entered in the Monthly Data Table, and transferred to the Annual Inputs Sheet using the UTILITIES Populate with Data From... option on the EconExpert Command Menu. c) Capacity Payments (Annual Inputs) Capacity Payments are fixed payments received from the local utility or a third party for guarantees of the availability of electric capacity (in kw) when needed. If the annual $/kw mo price does not follow a constant escalation pattern, annual ancillary services in $/kw mo can be entered here in current $. These cost entries will not be escalated. Non-Zero values entered here will override this value entered in Table 1 in the years that they are entered. d) Price of Steam or Hot Water Sold to Third Parties (Annual Inputs) If excess steam or hot water is generated by the facility, this steam or hot water can be sold to a neighboring facility at the value entered here. If the annual hot water or steam sales price does not follow a constant escalation pattern, annual steam price values can be entered here in current $. These cost entries will not be escalated. Revised 7/14/03 Page 130 EconExpert-DG Users Manual – Copyright 2001 - 2005 e) User Defined Additional Revenue Sources (1 to 6) (Annual Inputs) Six User-Defined Categories are provided allowing you to model any custom revenue streams available to the project. You may define the names of these categories and the names will be shown on the reports throughout the model. You may also run individual sensitivities on each of these categories. These entries are in addition to any other revenues calculated based on inputs to Table 1 or Table 1C including Electric Energy Sales, Capacity Sales, Hot Water or Steam Sales, Waste Heat Sales, etc. Entries in this section do not override any entries included in Table 1, but rather are provided so that additional revenue sources can be included in any year of the project. User-Defined Revenues should be entered in current $/yr. These costs will not be escalated. These fields are freely available to the user but will be over ridden if data is imported from the Tariff Model into EconExpert-DG. If this procedure is initiated and there is a risk of data being replaced, the user will be notified with a warning. Figure 65 – Annual Inputs - User Defined Additional Revenue Sources (1, 2 and 3) f) User Defined Additional Expenses (1 - 6) (Annual Inputs) Six User-Defined Categories are provided allowing you to model any other expense streams associated with the project. You may define the names of these categories and the names will be shown on the reports throughout the model. You may also run individual sensitivities on each of these categories. These entries are in addition to any other expenses calculated based on inputs to Table 1 or Table 1C including Fuel, Fixed O&M and Variable O&M. Entries in this section do not override any entries included in Table 1, but rather are provided so that additional expenses can be included in any year of the project. User Defined Expenses should be entered in current $/yr. These costs will not be escalated. Figure 66 – Annual Inputs - User Defined Additional Expenses (1, 2 and 3) These fields are freely available to the user but will be over ridden if data is imported from the Tariff Model into EconExpert-DG. If this procedure is initiated and there is a risk of data being replaced, the user will be notified with a warning. Revised 7/14/03 Page 131 EconExpert-DG Users Manual – Copyright 2001 - 2005 g) Debt Service or Capital Lease, Custom Principal Payments or Interest Rates Permanent financing (Capital Lease or Debt) can be divided into two parallel Tranches of debt, each with their own financing terms. If special financing terms are required, such as variable interest rates or accelerated principal payments, those amounts can be entered as Annual Inputs and so will override the amounts entered here. If the quarterly interest rates or principal payments do not follow a standard fixed rate mortgage repayment schedule over the life of the loan, non-zero rates entered here will override corresponding entries to Table 1 Project Global Inputs. Figure 67 – Annual Inputs - Debt Service or Capital Lease, Custom Principal Payments or Interest Rates h) Property Taxes (Annual Inputs) Annual Property Tax Amounts can be entered here and will override the % of Basis or fixed amount entered in Table 1 - Global Inputs. This should represent only incremental property taxes due to the CHP Project. If the annual property taxes do not follow the rules specified for Table 1 Project Global Inputs over the life of the project, tax amounts entered here will override corresponding entries to Table 1 Project Global Inputs. i) Insurance (Annual Inputs) Annual Insurance amounts can be entered here and will override the % of Basis or fixed amount entered in Table 1 - Global Inputs. This should represent only incremental Insurance Expenses due to the CHP Project. If the annual insurance costs do not follow the rules specified for Table 1 Project Global Inputs over the life of the project, tax amounts entered here will override corresponding entries to Table 1 Project Global Inputs. j) Annual State Depreciation for Cash Tax Purposes (Annual Inputs) The user can select annual depreciation amounts applied to State Taxes, in any year that such might occur for Cash Tax Calculations. An example of where this might apply is when losses are carried to the project from a subsidiary or for special depreciation credits for Wind Projects. Non-Zero entries will override the depreciation that is calculated as a result of entries to Table 1, in the years where those non-zero entries appear. k) Annual Federal Depreciation for Cash Tax Purposes (Annual Inputs) Revised 7/14/03 Page 132 EconExpert-DG Users Manual – Copyright 2001 - 2005 The user can select annual depreciation amounts applied to Federal Taxes, in any year that such might occur for Cash Tax Calculations. An example of where this might apply is for a Wind Project, or in the event Major Maintenance Expenses qualify for special Tax Treatment. Non-Zero entries will override the depreciation that is calculated as a result of entries to Table 1, in the years where those non-zero entries appear. l) Additional Tax Deductions Applied to State and Federal Taxes (Annual Inputs) The user can enter additional deductions from State and Federal Taxes in any year that they might occur. An example of where this might apply is when losses are carried to the project from a subsidiary. These entries are in current $, are not escalated, and are added to any other deductions or taxes calculated for the project. m) Federal Income Tax Rate (Annual Inputs) This row of inputs allows the user to specify annual federal income tax rates that (where non-zero entries are entered) will override the corresponding rate entered in Table 1 Project Global Inputs in the specified years. n) State Income Tax Rate (Annual Inputs) This row of inputs allows the user to specify annual state income tax rates that (where non-zero entries are entered) will override the corresponding rate entered in Table 1 Project Global Inputs in the specified years. Note that State Income Taxes are deductible in the calculation of Federal Taxable Income. o) Additional State Taxes (Annual Inputs) The user can enter Additional State Income Tax Amounts in any year that they might occur. An example of when this might apply is where special taxes or fines are imposed on the project. These entries are in current $, are not escalated, and are added to any other deductions or taxes calculated for the project. Additional Taxes should be entered as a positive number. Tax Credits should be entered as a negative number. p) Additional Federal Taxes (Annual Inputs) The user can enter Additional Federal Income Tax Amounts in any year that they might occur. An example of when this might apply is where special taxes or fines are imposed on the project. These entries are in current $, are not escalated, and are added to any other deductions or taxes calculated for the project. Additional Taxes should be entered as a positive number. Tax Credits should be entered as a negative number. Revised 7/14/03 Page 133 EconExpert-DG Users Manual – Copyright 2001 - 2005 q) After-Tax Dividends (Annual Inputs) The user can enter Dividend Amounts to be withdrawn from the project After-Tax as a % of after-tax net income or as a set amount. If both entries are made they will be summed. The resulting dividends are deducted from the net income after-tax and will result in a reduction to the project's IRR and NPV after-tax. Revised 7/14/03 Page 134 EconExpert-DG Users Manual – Copyright 2001 - 2005 4) Monthly Data Historical and Projected Tariff and Host Requirements (WITH and WITHOUT DG) and DG Plant Performance Data can be entered into the Monthly Data Sheet in 12 Monthly Periods. Values entered here will be aggregated to quarterly values that can be transferred to or referenced by formula in the Global or Annual Inputs Sheets. The real power of this Monthly Data sheet is that it can be integrated with / populated by time-of-use data to predict and evaluate the hourly operating characteristics of a facility based on the facilities design parameters and the applicable tariff structure. As described below, you can automatically populate the Historical Data to the Quarterly Format used in the Global Inputs Sheet and/or you can automatically reference the Projected Data in Quarterly Format in the Annual Inputs Sheet. Note that when historical data is transferred to the Global Inputs Sheet, that data will be overridden by values transferred to the Annual Inputs Sheet. Table 1 Project Global Inputs and Table 1C Project Annual Inputs provide a flexible input structure for entering Forward Energy Pricing data. The Figure below provides a screen shot of the Monthly Data Table. Figure 68 – The Monthly Data Table Revised 7/14/03 Page 135 EconExpert-DG Users Manual – Copyright 2001 - 2005 The light blue shaded input cells in the top section of the table can be used to enter Historical Data and Projected Data WITHOUT DG in Operation on pricing and use of electric energy and fuel at the site. EconExpert will automatically convert this monthly historical pricing information to the quarterly format used in Table 1 Project Global Inputs, applying escalation from the stated year using the escalation indices in Table 1. This data should be entered in Base Year $. The Base Year is an input to the Table 1 Project Global Inputs Sheet. The light green shaded input cells can be used to enter Projected Data for the site WITH DG including Tariff Data and DG Plant Performance. EconExpert will automatically convert this monthly historical pricing information to the quarterly format used in Table 1C Project Annual Inputs. The values will be used literally so you must include escalation in the inputs if it applies. You may automatically populate Table 1 Project Global Inputs sheet with entries in this table by selecting: UTILITIES Populate with Input Data from the Monthly Data, Simplified Input or Time-of-Use Wizard Sheets Transfer Historical Monthly Data to the Global Inputs Sheet ----------------------------------------------------------UTILITIES Populate with Input Data from the Monthly Data, Simplified Input or Time-of-Use Wizard Sheets Reference Projected Monthly Data in the Annual Inputs Sheet. from the EconExpert Command Menu. Please note the following points when you use this feature: • • • • • Historical data should be entered in Base Year $ for transfer to Table 1 Project Global Inputs. Projected data should be entered in current $ (escalated) for transfer to Table 1C Project Annual Inputs. You must allow for a partial year of operation if applicable. Data can be copied and pasted from other sources. The pasted data should be pasted AS VALUES from the source data file, or can be linked using formulas. Data will be aggregated to quarterly format and transferred to the Global Inputs Sheet or automatically referenced in the Annual Inputs Sheet, overwriting the current data. If period data is transferred, it is probably preferable to ensure that data is transferred for the whole project life (up to 20 years). If the data is not available for the whole project life, use formulas in the cells to project the data over the entire project life. Revised 7/14/03 Page 136 EconExpert-DG Users Manual – Copyright 2001 - 2005 • Otherwise, the Global Inputs data will be applied in years where you have not entered data. If desired as an alternative to transferring the data using the macros described above you may set up formulas in the Global or Annual Inputs Sheets that selectively reference the parameters that you would like to model on a monthly basis. If you do this, the Monthly Data sheet will become an active input sheet to the model by reference to the Global or Annual Inputs Sheets. In the next section of the sheet, intermediate calculations are performed that show the results of the Monthly Data Sheet, and in the lower section of the sheet values are computed that can be transferred to the Global (Historical Data) or Annual (Projected Data) Inputs sheets. The categories of data that can be entered in the Monthly Data Sheet are: Site Electric and Gas Demand (Excluding DG) (Monthly Data) a) Maximum Site Electric Energy Demand, kw (Monthly Data) This is the MAXIMUM electric energy demand at the location (including electric chillers if applicable) but not including any power generated or used by the DG Facility. Monthly values will be aggregated into quarterly averages for the purposes of estimating quarterly demand charges and aggregated savings. Historical Data entered in the blue shaded cells in the Monthly Data Sheet can be transferred into the corresponding blue shaded cells in the Global Inputs Sheet and Projected Data in the Green Shaded cells can be transferred to the Annual Inputs sheet by executing the UTILITIES Populate with Input Data ... option on the EconExpert Command Menu b) Site Displaceable Non-Chiller Electric Energy Use, 1000 kwh/period (Monthly Data) This is the monthly electric energy consumption (in 1000 kwh/month) EXCLUDING ELECTRIC CHILLERS and WITHOUT DG. The values entered here will be used to estimate savings associated with the displacement of electric energy purchases from the utility by self- generation. The Chiller requirements will be separately itemized below. In Tri-Generation power for the Chillers will be displaced by the use of waste heat used to drive Absorption Chillers in place of the original Electrically Driven Chillers. The values entered here will be aggregated to quarterly values that can be transferred to the Global Inputs Sheet or automatically referenced in the Annual Inputs Sheet. . Revised 7/14/03 Page 137 EconExpert-DG Users Manual – Copyright 2001 - 2005 c) Chiller Electric Energy Use, 1000 kwh/period (Monthly Data) This is the Electric Chiller energy consumption (in 1000 kwh/month) at the location WITHOUT DG. The values entered here will be used to estimate savings associated with the displacement of electric energy purchases from the utility by self- generation. In Tri-Generation power for the Chillers will be displaced by the use of waste heat used to drive Absorption Chillers in place of the original Electrically Driven Chillers. The values entered here will be aggregated to quarterly values that can be transferred to the Global Inputs Sheet or automatically referenced in the Annual Inputs Sheet. d) Site Displaceable Use of Gas or Other Fuel, 1000 Therms/Period (Monthly Data) These are the monthly amounts of thermal use (supplied by natural gas or other fuel) consumed at the site, in 1000 Therms/Month. The values entered in each quarter will be used to calculate the heat consumption at the site in Therms/period, and the amount of waste heat that can be displaced by the CHP Facility. The values entered here will be aggregated to quarterly values that can be transferred to the Global Inputs Sheet or automatically referenced in the Annual Inputs Sheet. Historical Data entered in the blue shaded cells in the Monthly Data Sheet can be transferred into the corresponding blue shaded cells in the Global Inputs Sheet and Projected Data in the Green Shaded cells can be transferred to the Annual Inputs sheet by executing the UTILITIES Populate with Input Data ... option on the EconExpert Command Menu. Revised 7/14/03 Page 138 EconExpert-DG Users Manual – Copyright 2001 - 2005 DG Plant and Absorption Chiller Performance (Monthly Data) e) Net DG Plant Electric Generating Capacity, kw (Monthly Data) Savings and Standby Charges will be calculated as it represents the incremental demand reduction at the site or the incremental amount of stand-by power that the site will require if the DG Plant experiences an unscheduled forced outage. Net Electric Production will be calculated based on the net capacity and the capacity factor. If the Net Capacity is not expected to be constant over the life of the project annual values can be entered or calculated in Table 1C Project Annual Inputs. f) Waste Heat from DG Available For Non-Chiller Thermal Use, Therms/hr (Monthly Data) This is the rated NET plant waste heat available from the DG Facility in therms (= 100,000 Btu/hr) in each month. If the amount of waste heat available from the DG Plant is greater than the amount of thermal energy (usually as hot water or steam) that can be displaced at the site, the excess waste heat can be sold to a third party or will be vented. g) DG Plant Gross Fuel Input (Therms/hr - HHV Basis) (Monthly Data) As an alternative to entering the heat rate in the Global Inputs Sheet, the user may enter the average quarterly gross heat input (MMBtu/hr) based on the higher heating value (HHV) of the fuel. If the plant will be cycled during the year, this represents the composite average for the respective quarter. If heat input is not expected to be constant over the life of the project (i.e. due to performance degradation, changes in operating philosophy, upgrades to the project, etc.), annual heat input entries can be entered in Table 1C Project Annual Inputs for each quarter. If transferred to the Annual Inputs sheet, the corresponding values will take precedence over any Heat Rate Inputs in the Global Inputs Sheet. i. DG Plant Capacity Factor in Each Month, % (Monthly Data) This is the percentage of the potential plant output that will occur during each month, accounting for number of hours in service, and level of operation when the facility is operated. For example, if the plant will be operated at full capacity during 50% of the hours in the period, this entry would be 50%. Similarly, if the plant were to be operated at 50% capacity for the whole period, the entry would also be 50%. Revised 7/14/03 Page 139 EconExpert-DG Users Manual – Copyright 2001 - 2005 ii. Maximum Coincident Electric Chiller Demand Displaced by Waste Heat, kw (Monthly Data) These inputs can be used ONLY if the Tri-Generation Switch is selected. The inputs should reflect the amount of chiller electric energy demand that can be offset from available waste heat and so might be limited by the available amount of waste heat from the Tri-Generation Plant. This is the average monthly amount of electric energy demand for the chillers ( in kw) which could be displaced by waste heat from the DG Unit (i.e. if absorption chillers replace or offset electrically driven chillers). The values entered in each month will be used to calculate the amount of electric energy used by the chillers that can be displaced by use of waste heat from the CHP Facility. The “coincident demand” is the demand that occurs at the same time as the Maximum site demand, and so represents that amount of electric chiller Maximum demand that can be displaced by absorption chillers. iii. Displaced Electric Chiller Electric Consumption , 1000 kwh / period (Monthly Data) These inputs can be used ONLY if the Tri-Generation Switch is selected. The inputs should reflect the amount of chiller electric energy demand that can be offset from available waste heat and so might be limited by the available amount of waste heat from the Tri-Generation Plant. This is the total monthly amount of electric power used by the chillers ( in 1000 kwh/month) which could be displaced by waste heat from the DG Unit (i.e. if absorption chillers replace or offset electrically driven chillers). The values entered in each month will be used to calculate the amount of electric energy used by the chillers that can be displaced by use of waste heat from the CHP Facility. Tariff Data – Basis of Savings and Revenues Due to DG (Monthly Data) iv. Cost of Electric Energy Purchased from Utility, c/kwh WITHOUT DG From the UTILITY Tariff, this is the monthly average value displaced electric energy purchases from the utility in each period, expressed in current cents/kwh, under the tariff that applies WITHOUT DG. This is the monthly "weight averaged" or aggregate Power purchase price based on the amount of power usage at each specified rate. So, the quarterly average power price should reflect the cost of power purchased during on-peak, mid-peak and off-peak conditions, etc. during that month, and the amount of power used under each of those respective periods. Revised 7/14/03 Page 140 EconExpert-DG Users Manual – Copyright 2001 - 2005 Values entered here will be aggregated to quarterly values that can be automatically reference in the Annual Inputs Sheets. v. Cost of Electric Energy Purchased from Utility, c/kwh WITH DG (Monthly Data) This is the monthly average value displaced electric energy purchases from the utility in each period, expressed in current cents/kwh, under the tariff that applies WITH DG operational. This is the monthly “weight averaged” or aggregated power purchase price based on the amount of power usage at each specified rate. So, the quarterly average power price should reflect the cost of power purchased during onpeak, mid-peak and off-peak conditions, etc. during that month, and the amount of power used under each of those respective periods. Values entered here will be aggregated to quarterly values that can be automatically reference in the Annual Inputs Sheets. vi. Demand Charges for Maximum Metered Power, $/kw mo WITHOUT DG (Monthly Data) Demand Charges are reflective of the maximum meter reading experienced by the customer over the a specified period. Often times a portion of the customer's bill is based on the maximum power demand that is used, either as a monthly average or during on-peak period. The utility then includes in the power bill a fixed annual Demand Charge for capacity required to support that amount of demand. This input is the displaced monthly period demand charges in $/kw mo UNDER THE TARIFF THAT APPLIES WITHOUT DG . The values entered here will be aggregated to quarterly values that can be transferred to the Global Inputs Sheet or automatically referenced in the Annual Inputs Sheet. vii. Demand Charges for Maximum Metered Power, $/kw mo WITH DG (Monthly Data) Demand Charges are reflective of the maximum meter reading experienced by the customer over the a specified period. Often times a portion of the customer's bill is based on the maximum power demand that is used, either as a monthly average or during on-peak period. The utility then includes in the power bill a fixed annual Demand Charge for capacity required to support that amount of demand. This input is the displaced monthly period demand charges in $/kw mo under the tariff that applies WITH DG Operational, and represents the money that will be saved when the DG Facility is brought on-line. Revised 7/14/03 Page 141 EconExpert-DG Users Manual – Copyright 2001 - 2005 If the DG Facility does not operate reliably, the savings in demand charges may be reduced or eliminated, and a demand ratchet may apply in the succeeding period The calculation of savings associated with reassessment of demand charges is based on the following: o If Standby Charges are assessed, there will be no reassessment of demand charges or demand charge savings. o If there are no Standby Charges, the Demand Charges (or resulting savings) in each quarter will be assessed when the outage penalty is specified. o If the facility experiences an unplanned outage during the year, the basis for demand charges in the quarter will be the maximum demand in the current quarter (i.e. there may be no demand charge credit). The values entered here will be aggregated to quarterly values that can be transferred to the Global Inputs Sheet or automatically referenced in the Annual Inputs Sheet. viii. Demand Ratchet (Monthly Data) The Demand Ratchet is a special condition used in some tariff or utility rate schedules which requires the customer to pay a premium on each bill during a specified period, typically related to peak demand or usage during a previous billing period. Ratchets are often used by utilities as a means to recover costs associated with installed capacity which the utility deems a customer previously used and so therefore should continue to fund for some period. As an example, some utility tariffs will require the customer to pay demand charges for the first year of operation of a DG facility which are based on the demand over the year prior to the operation of the DG facility. Similarly, after a forced outage of the DG facility (especially during an on-peak period), the utility may charge the customer higher demand fees for a specified period (often up to a year) following the outage event. This section of the Annual Inputs Sheet allows the user to evaluate the impact of Ratchets if they apply. The user may specify the 3 month average amount of the demand ratchet (in kw) which will apply during each respective quarter, resulting in a calculation of additional demand charges by EconExpert-DG in the months where non-zero ratchets are identified. ix. Value of Excess Electricity Sold to the Utility, c/kwh (Monthly Data) This is the price of electric energy sold back to the utility in each month, expressed in cents/kwh. Energy sales back to the utility will be calculated by the model based on excess electric generation after accounting for use at the site and any sales under contract to third parties. The values entered here will be aggregated to quarterly values that can be transferred to the Global Inputs Sheet or automatically referenced in the Annual Inputs Sheet. Revised 7/14/03 Page 142 EconExpert-DG Users Manual – Copyright 2001 - 2005 x. Standby Charges to Ensure Firm Backup Power, $/kw mo (Monthly Data) Standby Charges are a Monthly fee, expressed in $/kw mo that represent new charges to the customer of the utility to ensure that in the event of an outage in the CHP facility, the utility will provide firm backup power. Standby Charges are calculated in the model based on the maximum established generating capacity of the DG Facility over the current quarter. Normally, if standby charges are imposed, there are no additional penalties or demand charges paid by the customer even if the DG Facility experiences interruptions in service. Thermal Energy Prices (Monthly Data) xi. Value of Site Uses of Thermal Energy WITHOUT DG, $/Therm (Monthly Data) This is the monthly price of gas or other fuel in $/Therm in current $ for uses at the site WITHOUT DG present (i.e. hot water or steam). The entered amount will be escalated by the GNP Escalator plus the Real Escalation Factor input to the right. Fuel prices will be used to determine savings associated with the use of waste heat. The values entered here will be aggregated to quarterly values that can be transferred to the Global Inputs Sheet or automatically referenced in the Annual Inputs Sheet. xii. Value of Site Uses of Thermal Energy WITH DG, $/Therm (Monthly Data) This is the monthly price of gas or other fuel in $/Therm in current $ for uses at the site WITH DG operational (i.e. hot water or steam). The entered amount will be escalated by the GNP Escalator plus the Real Escalation Factor input to the right. Fuel prices will be used to determine savings associated with the use of waste heat. The values entered here will be aggregated to quarterly values that can be transferred to the Global Inputs Sheet or automatically referenced in the Annual Inputs Sheet. xiii. DG Plant - Fuel Price, $/Therm (Monthly Data) This is the price of gas or other fuel in $/Therm in Base Year $ for the DG Facility. The entered amount will be escalated by the GNP Escalator plus the Real Escalation Factor input to the right. Fuel prices will be used to determine the cost of fuel for the DG Plant. h) Conversion to EconExpert Quarterly Format for Import to Table 1C Revised 7/14/03 Page 143 EconExpert-DG Users Manual – Copyright 2001 - 2005 In this bottom section of the sheet, monthly data is aggregated to a quarterly format that can be transferred to the Global (Historical Data) or Annual (Projected Data) Inputs sheets using the UTILITIES Populate With Data From... option on the EconExpert Command Menu The values entered here will be aggregated to quarterly values that can be transferred to the Global Inputs Sheet or automatically referenced in the Annual Inputs Sheet. Revised 7/14/03 Page 144 EconExpert-DG Users Manual – Copyright 2001 - 2005 5) Time-of-Use Wizard While commercial electric customers typically receive their utility electric bills on a monthly billing cycle, costs for electric use are usually computed based on time-of-use, with the lowest rates for electric energy consumption charged during low demand periods and progressively higher rates billed as system demand. The corresponding rate “block” periods (super-peak, on-peak, mid-peak, off-peak, etc.) are established in association with the time of day, day of the week and month/season of the year when these system load variations occur. Since the customers use of electricity, and potentially their need for DG may also vary as a function of the time-of-day, day of the week and season of the year, the ultimate calculation of the electric bill before and after the implementation of DG can be relatively complex. Similar to the variation of the cost of electricity as a function of the corresponding time-of-use, some utilities also have monthly or seasonal variations in their demand charges as a function of how they value their capacity investments to meet that demand during different months of the year. The Time-of-Use Wizard allows you to proceed into the next level of DG Project Economic Analysis by analyzing time-of-use electric energy pricing and time-related demand charges. Time-of-use energy prices and time-related demand charges from the appropriate tariff(s), the Host’s energy usage and demand, and DG plant performance data can be entered into the Time-of-Use Sheet in Rate Blocks during each month. These data entries will be then be aggregated into quarterly equivalents that can be transferred to the Annual Inputs Sheet, or referenced by formulas in the Annual Inputs Sheet, for application in the model. The Time-of-Use Wizard has two primary sections, which are identified by the border shading that outlines each of the respective tables. The sections are: • • Sections 1&2 - Time-of-Use Energy Price Wizard – Dark Blue Border o TW1 - Time-of-Use Energy Consumption Rates at the site WITHOUT DG Monthly and Quarterly Non-Chiller Consumption, Displaceable 1000 kwh/mo Monthly and Quarterly Electric Chiller Consumption, Displaceable 1000 kwh/mo Total Monthly and Quarterly Electric Consumption, Displaceable 1000 kwh/mo Aggregated Monthly and Quarterly Energy Prices, c/kwh o TW2 - Time-of-Use Energy Consumption Rates associated with the DG FACILITY Generator Operation, Displaced 1000 kwh/mo Chiller Operation, Displaceable 1000 kwh/mo Aggregated Monthly and Quarterly Energy Prices, c/kwh Sections 3&4 - Time-Related Demand Charge Wizard – Dark Purple Border o TW3 - Time-Related Demand Charges at the site WITHOUT DG Maximum Demand by Rate Block, kw Demand Rates by Rate Block, $/kw mo Annual Time-Related Demand Charges, $/year o TW4 - Time-Related Demand Charges at the site WITH DG Maximum Demand by Rate Block, kw Demand Rates by Rate Block, $/kw mo Annual Time-Related Demand Charges, $/year Revised 7/14/03 Page 145 EconExpert-DG Users Manual – Copyright 2001 - 2005 The Time-of-Use Wizard is color-coded as illustrated in the figure below Figure 69 – Time-of-Use Wizard - Color Legend The input cells in the Time-of-Use Wizard are shaded to identify input classes. The light blue shaded inputs can be used to enter data on pricing and demand for electricity associated with the site WITHOUT DG. The light green shaded input cells can be used to enter Projected Data associated with the DG Facility and the site WITH DG in operation. The yellow shaded cells represent locations where CEI has provided computational logic which the user may override if desired. The conditions / assumptions provided with the computational logic are described in the help comments in the model, and are discussed further below. You may automatically populate the Annual Inputs sheet with aggregated results produced by the Time-of-Use Wizard by selecting: UTILITIES Populate with Input Data from the Monthly Data, Simplified Input or Time-of-Use Wizard Sheets Transfer Time-of-Use Energy Data to the Annual Inputs Sheet UTILITIES Populate with Input Data from the Monthly Data, Simplified Input or Time-of-Use Wizard Sheets Transfer Time-Related Demand Data to the Annual Inputs Sheet from the EconExpert-DG Command Menu. Revised 7/14/03 Page 146 EconExpert-DG Users Manual – Copyright 2001 - 2005 Please note the following points when you use this feature: • All data is escalated Base Year $ entered in the Global Inputs Sheet. • The project schedule is based on data entered in the Global Inputs Sheet. The Timeof-Use Wizard will automatically adjust for a partial year of operation. • Data can be copied and pasted from other sources. The pasted data should be pasted as values or formulas from the source data file, or can be linked using formulas. • Data will be aggregated to quarterly format and can be automatically referenced in the Annual Inputs Sheet. a) Pre-Loaded Default Tariff – SCE TOU-8 and GS-2 Option A The EconExpert-DG Time-of-Use Wizard comes preloaded with example tariffs based on the SCE-TOU-8 and GS-2 Option A Tariffs required by Southern California Edison. These tariffs became effective on and were last updated by CEI on the date specified in the Description. Inputs, examples and descriptions provided by CEI in the Model and in the User's Manual are provided for example purposes only. CEI makes no representations or warranties with respect to the accuracy of such inputs, examples or descriptions. If you use these SCE example tariffs in an actual analysis that you are performing, please confirm that the tariffs provided are the applicable current tariff for your situation. The example tariffs provided are based on the following simplifying assumptions: All changes in rates coincide with the first day of the month. If changes take effect mid-month this can be addressed by prorating in proportion to the number of days in each month that apply under each respective rate. February is 28 days - Leap Years are ignored. Where holidays that fall on a calendar day are applicable, the probability of a holiday falling on a weekday versus a weekend is prorated by 5/7. The examples do not address Special Conditions where applicable. Please note that the inputs, examples and descriptions provided by CEI in the Model and in the User's Manual are provided for example purposes only. CEI makes no representations or warranties with respect to the accuracy of such inputs, examples or descriptions. Revised 7/14/03 Page 147 EconExpert-DG Users Manual – Copyright 2001 - 2005 b) TW1 - The Time-of-Use Energy Price Wizard – Site Energy Consumption WITHOUT DG The first table in the Time-of-Use Wizard (TW1) is used to calculate Time-of-Use Energy Prices at the site if DG were not implemented. This is accomplished by segregating the non-chiller and electric chiller loads by time-of-use and assigning the associated Rate Block times and rates. The results calculated from these inputs are used to determine the customer’s appetite for electric and thermal energy and the aggregated price of electric energy in each period. The figure below shows an illustration of the Site Energy Consumption without DG input table. The light blue shaded cells in this input table provide locations for data entry. The yellow shaded cells represent locations where CEI has provided computational logic which the user may override if desired Figure 70 – TW1 - Time-of-Use Energy Price Wizard – Site Energy Consumption and TOU Prices WITHOUT DG Revised 7/14/03 Page 148 EconExpert-DG Users Manual – Copyright 2001 - 2005 Input fields in table TW1 are: • • • • • Description – This description is used to annotate the name of the applicable tariff WITHOUT DG. Base Year and Start of Operations – The Time-of-Use Wizard must be with the schedule selected in the Global Inputs Sheet so these values are determined from entries to the Global Inputs Sheet. All escalation calculated by the Time-of-Use Wizard will be from the Base Year. Non-Chiller Load, Chiller Load and Capacity Factor – These entries are used ONLY for circumstances of continuous 7 x 24 operation, subject only to shut downs for maintenance. Based on entries to these cells the Non-Chiller and Chiller 1000 kwh/period provided below can be automatically calculated. Alternatively, the user can enter the kwh generated in each period, overriding the formulas provided. Capacity Factor. For 7/24 operation, this represents the annual capacity factor accounting for site outages. Rate Block - A Rate Block or Time-of-Use Period corresponds to the time interval over which a certain pricing structure applies. These default Rate Blocks (i.e. SuperPeak, On-Peak, Mid-Peak, Off-Peak or other) correspond to periods when rates make step changes due to variations in system-wide demand, but the user may rename any of these periods to match the desired tariff. Based on the applicable tariff, there will be a characteristic number of hours that typically apply to each Rate Block in each month. For example, if the On-Peak period is from 10 am - 4 pm on weekdays, in the month of January this would typically represent: 6 hours/day x 5 days/week x 4 weeks/month x 31/28 = 133 hours of on-peak hours in a typical month of January. • • • • Note that the actual number of hours will vary from year to year as a function of when the week starts, so this represents an average for all January periods. Hours in Each Period. If the facility will operate 7 x 24, then the number of hours per period can be entered and used to calculate the energy consumption during each period WITHOUT DG. Non-Chiller and Chiller 1000 kwh/period – For non-continuous or cycling operation, the user can override the calculated 7 X 24 amounts with actual period consumption rates. Host’s Appetite for Electric Energy, 1000 kwh - This is the sum of the Non-Chiller and Chiller electric energy use in each Rate Block. Aggregated Energy Price in Each Period, c/kwh. Based on the Applicable Tariff, the user may enter the Time-of-Use Energy Prices during each period WITHOUT DG. The model will then weight average the pricing and corresponding consumption rates to produce weight averaged (Aggregated) monthly, quarterly and annual energy prices. Revised 7/14/03 Page 149 EconExpert-DG Users Manual – Copyright 2001 - 2005 Figure 71 – TW1A, TW1B and TW1C Projected Site Displaceable Chiller and NonChiller Consumption (“Host’s Appetite”) • • • Site Displaceable 'Non-Chiller' Electric Consumption, 1000 kwh/period - This table is used to project Non-Chiller Electric Consumption over the life of the project. Site Displaceable ‘Chiller' Electric Consumption, 1000 kwh/period - This table is used to project Chiller Electric Consumption over the life of the project. Total Non-Chiller and Chiller Consumption, 1000 kwh/period – Sum of the above. If site consumption will change during the project life, annual increases in the individual non-chiller and chiller electric energy consumptions can be entered in any year using the light blue shaded cells. If the rate of change of consumption is not constant across all periods in a given year the amounts must be manually adjusted in the Annual Inputs Sheet after transferring the data. Revised 7/14/03 Page 150 EconExpert-DG Users Manual – Copyright 2001 - 2005 Figure 72 – TW1D - Aggregated Cost of Electric Energy Purchased fm Utility, c/kwh (WITHOUT DG) Based on the period energy consumption rates and the associated time-of-use energy pricing, aggregated (weight) average electric energy prices are calculated on a monthly, quarterly and annual basis. Annual nominal (GNP + Real) escalation rates can be entered to establish the rate of increase of these prices going forward. Results will be transferred to the corresponding section in the Annual Inputs Sheet. Please note that the proportional mix of Rate Block energy consumption is assumed to remain constant over the life of the project (i.e. the relative percentages of super-peak, on-peak, mid-peak and off-peak remain constant). Revised 7/14/03 Page 151 EconExpert-DG Users Manual – Copyright 2001 - 2005 c) TW2 - The Time-of-Use Energy Price Wizard – DG Facility Now it is necessary to calculate the aggregated pricing WITH the DG Facility operational. This is accomplished by tracking the time-of-use electric energy generation produced by the DG Facility and the offset to electric energy from the use of absorption chillers. The resulting energy production is subtracted from the hosts appetite for energy calculated from TW1 to determine the net consumption WITH DG. Figure 73 – TW2 Time-of-Use Energy Price Wizard WITH DG Operational (Jan-June Excerpt) Revised 7/14/03 Page 152 EconExpert-DG Users Manual – Copyright 2001 - 2005 Inputs to TW2 include the following data: • Description – This description is used to annotate the name of the applicable tariff WITH DG operational. • Base Year and Start of Operations – It is necessary for the Time-of-Use Wizard to be fully synchronized with the case modeled in the Global Inputs Sheet and so these values are determined from entries to the Global Inputs Sheet. All escalation calculated by the Time-of-Use Wizard will be from the Base Year. • Generator Capacity – This represents the design net electric generation capacity of the DG facility in kw. • Absorption Chiller Tonnage – This is the capacity of the Absorption Chillers in tons. • Absorption Chiller Offset– This factor is used to calculate the effective kw of Electric Chiller Consumption that will be offset / ton of Absorption Chiller Capacity. • DG Plant Capacity Factor - This is the percentage of the potential plant output that will occur during each period, accounting for the potential number of hours in service, and level of operation when the facility is operated. For example, if the plant will be operated at full capacity during 50% of the hours in the period, this entry would be 50%. Similarly, if the plant were to be operated at 50% capacity for the whole period, the entry would also be 50%. • Rate Block - A Rate Block or Time-of-Use Period corresponds to the time interval over which a certain pricing structure applies. These Rate Blocks (i.e. Super-Peak, On-Peak, Mid-Peak, Off-Peak or other) correspond to periods when rates make step changes due to variations in system-wide demand are the same as those specified in Table TW1. Based on the applicable tariff, there will be a characteristic number of hours that typically apply to each Rate Block in each month. For example, if the OnPeak period is from 10 am - 4 pm on weekdays, in the month of January this would typically represent: 6 hours/day x 5 days/week x 4 weeks/month x 31/28 = 133 hours of on-peak hours in a typical month of January. • • • Note that the actual number of hours will vary from year to year as a function of when the week starts so this represents an average for all January Period. Generator Operation, hrs/month – This is the number of hours/month that the electric generator will be operated, assuming full load operation when the facility is on-line. If cycling or part load operation is anticipated, the number of hours can be proportionately adjusted to result in the desired number of 1000 kwh/month produced. Chiller Operation, hrs/month - This is the number of hours/month that the absorption chillers will be operated, assuming full load operation when the facility is on-line. If cycling or part load operation is anticipated, the number of hours can be proportionately adjusted to result in the desired number of 1000 kwh/month produced. Direct Electric Production, 1000 kwh - Based on the capacity and efficiency of the absorption chillers and the number of hours operated in each period, this is the calculated 1000 kwh of electric chiller energy consumption that is displaced during each period. Revised 7/14/03 Page 153 EconExpert-DG Users Manual – Copyright 2001 - 2005 • • • • • Absorption Chiller Electric Offset, 1000 kwh - Based on the capacity and efficiency of the absorption chillers and the number of hours operated in each period, this is the calculated 1000 kwh of electric chiller energy consumption that is displaced during each period. Total Benefits of Self Generation and Chillers, 1000 kwh – This is the sum of the Direct Electric Production and the Absorption Chiller Electric Offset. Host’s Appetite for Electric Energy, 1000 kwh - This is the sum of the Non-Chiller and Chiller electric energy use in each Rate Block from TW1 Above. Total Electric Energy Use WITH DG Operational - This is the difference between the Host's Appetite for Electric Energy and the Benefits of Self-Generation and Absorption Chillers, yielding the net electric energy use WITH DG Operational in 1000 kwh. Aggregated Energy Price in Each Period, c/kwh - Based on the Applicable Tariff, the user may enter the Time-of-Use Energy Prices during each period WITHT DG Operational. The model will then weight average the pricing and corresponding consumption rates to produce weight averaged (or aggregated) monthly, quarterly and annual energy prices. Figure 74 – TW2A - PROJECTED DG Plant Capacity Factor Table TW2A provides the calculation of the DG Plant’s capacity factor based on the number of hours that the facility is operated during each period entered in Table TW2 described above. Revised 7/14/03 Page 154 EconExpert-DG Users Manual – Copyright 2001 - 2005 The user may enter annual increases in the capacity factor to project rates in future years, either increasing or decreasing. The increases are additive. If different rates of increases are anticipated in different quarters of the year those adjustments must be made by the user in Table 1C after the data is transferred. The quarterly values computed in this table can be automatically populated into the annual inputs sheet by selecting UTILITIES POPULATE WITH DATA FROM… on the Command Menu. Or, you may reference the respective cells on this table from the Monthly Data or Annual Inputs sheets. Figure 75 – TW2B - Projected Displaced Electric Chiller Consumption, 1000 kwh/period Table TW2B is used to calculate the electric consumption that is displaced in each period based on the hours of operation and the DG plant capacity, and the capacity and efficiency of the Absorption Chillers, specified in Table TW2 above. If the amount displaced will change during the project life, annual changes in operating rates of the Absorption Chillers can be entered in any year. If the rate of change of consumption is not constant across all periods in a given year the amounts must be manually adjusted after transferring the data in the Annual Inputs Sheet. Annual changes are entered as a percentage increase or decrease from the prior year. Revised 7/14/03 Page 155 EconExpert-DG Users Manual – Copyright 2001 - 2005 Figure 76 – TW2C Projected Aggregated Cost of Electricity Purchased from Utility with DG Operational, c/kwh Table TW2C provides projections of the aggregated electric energy prices during each period based on the amount of energy displaced, entered and calculated in Table TW2 above. The resulting period electric energy consumption rates WITH DG in operation, and the associated time-of-use energy pricing, aggregated (weight) average electric energy prices are calculated on a monthly, quarterly and annual basis. Annual nominal (GNP + Real) escalation rates can be entered to establish the rate of increase of these prices going forward. Results will be transferred to the corresponding section in the Annual Inputs Sheet. Please note that the proportional mix of Rate Block energy consumption is assumed to remain constant over the life of the project (i.e. the relative percentages of super-peak, on-peak, mid-peak and off-peak remain constant). Revised 7/14/03 Page 156 EconExpert-DG Users Manual – Copyright 2001 - 2005 6) The Time-Related Demand Charge Wizard In addition to Time-of-Use Energy Pricing, some utilities also have Time-Related Demand Charges in their tariff. Where applicable, this will result in supplemental demand charges at certain times of the year based on the maximum demand during one or more Rate Blocks. This Wizard can be used to calculate and incorporate time-related demand charges into your analysis. The annual savings computed in this table can be automatically populated into an available section of the Other Revenues and Savings Section the annual inputs sheet by selecting UTILITIES Populate with Data from the Monthly, Simplified Data or Time-of-Use Wizard Sheets Transfer Time-Related Demand Data to the Annual Inputs Sheet Option on the Command Menu. Or, you may reference the respective cells on this table from the Monthly Data or Annual Inputs sheets. a) Time-related Demand Charges WITHOUT DG The figure below illustrates Table TW3, where the user can enter tariff and peak demand data associated with the site WITHOUT DG. Figure 77 – TW3 - Time-related Demand Charge Wizard – Site WITHOUT DG Revised 7/14/03 Page 157 EconExpert-DG Users Manual – Copyright 2001 - 2005 Sections of this table include: • Base Year and Start of Operations – It is necessary for the Time-of-Use Wizard to be fully synchronized with the case modeled in the Global Inputs Sheet and so these values are determined from entries to the Global Inputs Sheet. All escalation calculated by the Time-of-Use Wizard will be from the Base Year. • Rate Block - A Rate Block or Time-of-Use Period corresponds to the time interval over which a certain pricing structure applies. These default Rate Blocks (i.e. SuperPeak, On-Peak, Mid-Peak) correspond to periods when rates will make step changes due to variations in system-wide demand. The user may rename these blocks to match the specified tariff. Based on the applicable tariff, there will be a characteristic number of hours that typically apply to each Rate Block in each month. For example, if the On-Peak period is from 10 am - 4 pm on weekdays, in the month of January this would typically represent: 6 hours/day x 5 days/week x 4 weeks/month x 31/28 = 133 hours of on-peak hours in a typical month of January. Note that the actual number of hours will vary from year to year as a function of when the week starts so this represents an average for all January Period. • Maximum Demand, kw. This is the maximum demand established during the respective Rate Block during each month. The corresponding charge is then used to calculate that Rate Block's contribution to the Time-Related Demand Charge in $/mo, $/quarter and $/year. • Aggregated Energy Price in Each Period, c/kwh. Based on the Applicable Tariff, the user may enter the Time-of-Use Energy Prices during each period WITHOUT DG. The model will then weight average the pricing and corresponding consumption rates to produce weight averaged (or aggregated) monthly, quarterly and annual energy prices. Revised 7/14/03 Page 158 EconExpert-DG Users Manual – Copyright 2001 - 2005 Figure 78 - TW3A - Projected Time-related Demand Charges WITHOUT DG, $ Table TW3A provides projections of the aggregated monthly, quarterly and annual TimeRelated Demand Charges WITHOUT DG, based on maximum energy use during each Rate Block and the applicable fees. entered and calculated in Table TW3 above. Annual nominal (GNP + Real) escalation rates can be entered to establish the rate of increase of these fees going forward. Results will be used in combination with the corresponding fee WITH DG Operational to calculate the savings associated with reductions in Time-Related Demand Charges. Revised 7/14/03 Page 159 EconExpert-DG Users Manual – Copyright 2001 - 2005 b) Time-related Demand Charges WITH DG The figure below illustrates Table TW4, where the user can enter tariff and peak demand data associated with the site WITH DG. Figure 79 - Time-related Demand Charge Wizard – Site WITH DG Sections of this table include: • Base Year and Start of Operations – It is necessary for the Time-of-Use Wizard to be fully synchronized with the case modeled in the Global Inputs Sheet and so these values are determined from entries to the Global Inputs Sheet. All escalation calculated by the Time-of-Use Wizard will be from the Base Year. Revised 7/14/03 Page 160 EconExpert-DG Users Manual – Copyright 2001 - 2005 • Rate Block - A Rate Block or Time-of-Use Period corresponds to the time interval over which a certain pricing structure applies. These default Rate Blocks (i.e. SuperPeak, On-Peak, Mid-Peak) correspond to periods when rates will make step changes due to variations in system-wide demand. The names for these blocks are specified in Table TW3. Based on the applicable tariff, there will be a characteristic number of hours that typically apply to each Rate Block in each month. For example, if the OnPeak period is from 10 am - 4 pm on weekdays, in the month of January this would typically represent: 6 hours/day x 5 days/week x 4 weeks/month x 31/28 = 133 hours of on-peak hours in a typical month of January. Note that the actual number of hours will vary from year to year as a function of when the week starts so this represents an average for all January Period. • Maximum Demand, kw - This is the maximum demand established during the respective Rate Block during each month. The corresponding charge is then used to calculate that Rate Block's contribution to the Time-Related Demand Charge in $/mo, $/quarter and $/year. • Aggregated Energy Price in Each Period, c/kwh - Based on the Applicable Tariff, the user may enter the Time-of-Use Energy Prices during each period WITH DG. The model will then weight average the pricing and corresponding consumption rates to produce weight averaged (or aggregated) monthly, quarterly and annual energy prices. Revised 7/14/03 Page 161 EconExpert-DG Users Manual – Copyright 2001 - 2005 Figure 80 - TW4A - Projected Time-related Demand Charges WITH DG, $ Table TW4A provides projections of the aggregated monthly, quarterly and annual TimeRelated Demand Charges WITH DG operational, based on maximum energy use during each Rate Block and the applicable fees entered and calculated in Table TW4 above. Annual nominal (GNP + Real) escalation rates can be entered to establish the rate of increase of these fees going forward. Results will be used in combination with the corresponding fee WITH DG Operational to calculate the savings associated with reductions in Time-Related Demand Charges. Revised 7/14/03 Page 162 EconExpert-DG Users Manual – Copyright 2001 - 2005 Figure 81 – Table TW4B – Projected Savings in Time-Related Demand Charges Table TW4B provides calculated projections of the aggregated monthly savings in TimeRelated Demand Charges based on the difference in fees WITH and WITHOUT DG. The resulting ANNUAL SAVINGS can be imported into the Other Revenues and Savings section of Table 1C Project Annual Inputs by selecting: UTILITIES Populate with Data from the Monthly, Simplified Data or Time-of-Use Wizard Sheets Transfer Time-Related Demand Data to the Annual Inputs Sheet from the EconExpert-DG Utilities Menu. Revised 7/14/03 Page 163 EconExpert-DG Users Manual – Copyright 2001 - 2005 E) Saving EconExpert-DG Spreadsheets 1) Saving “Fully Functional” Copies of the Model During the term of your license you may save and reuse installed copies of fully functioning EconExpert-DG Models as you would save any other Excel Spreadsheet. To do so, simply use the Excel Save or Save As selections on the Excel Command Menu. The spreadsheets you save will only work on computers that have authorized installations of EconExpert-DG. If a saved copy of EconExpert-DG is provided to other parties who do not have a valid license, they will be prompted to contact CEI to obtain License Codes to enable the model. By entering these codes, the models you send them can be fully enabled, and users who receive and license EconExpert-DG from files shared by others will experience the same full functionality of the model as you will. Without the appropriate codes, transferred copies of the model will not function properly unless they are converted to a “Values-Only” using the EconExpert-DG Command Menu. “Values-Only” copies will function on any computer, but are limited to providing the results for the individual case studied when the model was converted. If you purchase a subscription to the EconExpert model, any copies of the model that you save will be recoverable as values-only versions even after your license expires. It is also important to note that when you perform a Save, EconExpert-DG will be temporarily disabled showing Div!/0 results throughout the various tables. The Input Sheet Titles will also disappear. This is normal behavior that is caused by a Security Feature in EconExpert-DG that is intended to prevent use of the model by unauthorized persons. During your license period, if you always select the Enable Macros option when you open EconExpert-DG, you will always be able to clear this Div!/0 result by selecting ENABLE MODEL from the EconExpert-DG Command Menu. If Macros are NOT enabled, you will not be able to remove the Div!/0 result. When you select Save or Revised 7/14/03 Save As you will see the following message box: Page 164 EconExpert-DG Users Manual – Copyright 2001 - 2005 After saving the model, to eliminate the Div!/0s and re-enable the model select: ENABLE MODEL Enable [Filename] from the EconExpert Command Menu. If two copies of EconExpert-DG are opened, the Enable Model Menu will list the names of each of 2 opened EconExpert files. If you have set Recalculation to Manual, you will also be required to press the F9 key to perform the calculations necessary to re-enable the model. : Figure 82 – Deleted Revised 7/14/03 Page 165 EconExpert-DG Users Manual – Copyright 2001 - 2005 2) Creating a “Values-Only” Copy of the EconExpert-DG Model That You Can Share with Others Who Don’t Have a License From the UTILITIES MENU or EconExpert-DG HELP Menu, you can create a “ValuesOnly” copy of the current EconExpert-DG Model for sharing with others who may not be licensed to use EconExpert-DG. The “Values-Only” copy that this module creates, will work on any computer but will have limited functionality. No special license codes will be required to view the “Values-Only” copy on any PC but the “Values-Only” model will not be capable of performing any new calculations. Values-Only spreadsheets will be protected WITHOUT passwords so the developer may edit or modify any of the sheets in the model but DO NOT DELETE ANY OF THE WORKSHEETS IN THE MODEL AS SUCH WILL RESULT IN AN ERROR WHEN THE VALUES ONLY SHEET IS REOPENED. Since the Sensitivity Cases included with a “Values Only Copy” cannot be updated after the model is converted, you will be offered the option to run all of the Sensitivity Cases and Tornado Diagrams prior to the conversion. If you decline this option, the Tables on the Sensitivity Sheet, Tornado Diagrams and Sensitivity Graphs can be deleted to ensure that the “Values-Only” copy does not contain Sensitivity Cases that are inconsistent with the case provided. Depending on the speed of your computer, running all of the Sensitivity Cases as a batch should take between 1 and 3 minutes. If desired, you can create a “Values-Only” copy of the model that can be restored by a licensed user to a full working version of the model. To restore a full working version from a “Recoverable” Values-Only copy, use the Import option on the UTILITIES MENU. Prior to executing a “Values-Only” conversion, you will be prompted with a number of Warnings, advising you to save the results before making the conversion, and to save the “Values-Only” file to a new name. These Warnings are to ensure that you don’t accidentally overwrite your original copy of the Fully Functioning model. Please be aware that under the terms of the Software License Agreement, all printed reports and copies of EconExpert-DG must contain the original copyright notices. If you purchase a subscription to the EconExpert model, any copies of the model that you save will be recoverable as values-only versions even after your license expires. Revised 7/14/03 Page 166 EconExpert-DG Users Manual – Copyright 2001 - 2005 F) Sensitivity Analyses EconExpert-DG is equipped with the capability to run automated sensitivity analyses on a variety of important project parameters. Options on the SENSITIVITIES menu include: • Tornado Diagrams - Tornado diagrams are described in more detail in the next section. They illustrate in a horizontal bar chart how the significance of various sensitivities compare to each other. • Individual Sensitivity Analyses - You can run and print graphs for all of the sensitivity analyses in one batch. Depending on the speed of your computer, running all of the Sensitivity Cases as a batch should take between 1 and 3 minutes. Parameters for which Individual Sensitivity Analyses can be performed include sensitivities of after-tax IRR, NPV and Payback for the following inputs. • • • • • • • Capital Cost DG Plant Operations o Fuel Savings o Fuel Purchases o Capacity Factor Demand and Standby Charges Electric Energy Prices o Savings in Power Purchased from Utility o Revenues from Excess Power Sales to Utility Financing o Operating Lease Monthly Payment o Operating Lease Term o Interest Rate on Primary Debt o Term of Primary Debt o Interest Rate on Subordinated Debt o Term of Subordinated Debt o Percent Owner’s Equity Fuel Use or Price o Fuel Savings (use of DG Waste Heat) o Fuel Use (Fuel for DG Plant) o Operations and Maintenance Costs 1 to 6 o Expensed Major Maintenance o Fixed Operating and Maintenance Costs o Variable Operating and Maintenance Costs Revenues and Savings o Savings in Power Purchased from Utility o Revenues from Excess Power Sales to Utility o User Defined Revenue Categories 1 to 6 Revised 7/14/03 Page 167 EconExpert-DG Users Manual – Copyright 2001 - 2005 The SENSITIVITIES Menu provides you with the ability to run these sensitivity cases either individually, or as a group, and to report how the project’s after-tax Net Present Value (NPV), Internal Rate of Return (IRR) or Payback will be impacted by variations in these parameters. You can specify the term (in years) of the IRR Analysis that is used in the Sensitivities by entering the desired number of years in the third column of the IRR Summary Table at the top of Table 1. The location of the entry is identified by the red bold-faced title IRR TERM FOR SENSITIVITY STUDIES. Figure 83 – The IRR Sensitivity Term (Input to Table 1) Sensitivity Analyses in EconExpert-DG are executed by incrementing the selected variable over a range of values that can be defined by the user. The Sensitivity Increment is used to define the range, by iterating the model over 7 intervals, from the base case value minus 3 times the increment to the base case value plus 3 times the increment. When you run a Sensitivity Analysis, you will be prompted to enter the respective Increment to be used. If you run all of the Sensitivities as a batch, you will be advised of the current values and asked if you want to use them or change them manually in the Sensitivity Sheet. So, for example, when performing a Sensitivity Analysis on the Capital Investment Cost of the Project, the user might specify a Sensitivity Increment of 5%. Econ Expert will then iterate the model using values of 85%, 90%, 95%, 100%, 105%, 110% and 115% of the Capital Cost used for the current case, and will then report in tabular and graphic format how the project’s after-tax NPV, IRR and Payback will vary as a function of the resulting changes in the Total Investment Cost (Incl. Development Costs, Capital Costs, Soft Costs and Interest During Construction). The Sensitivity Increment is specified in an Input Cell in the respective Capital Cost Sensitivity Table, as shown in the figure below. Revised 7/14/03 Page 168 EconExpert-DG Users Manual – Copyright 2001 - 2005 Figure 84 – Sensitivity Tables – Input of Sensitivity Increments After executing a Sensitivity Analysis, the user will be taken to the resulting graph that illustrates how the Project IRR is impacted by changes in the selected variable. A sample of that graph is shown on the next page. Figure 85 – Graphs Produced from Sensitivity Analyses Sensitivities of IRR and NPV After Tax (10 yrs) to Capital Investment Cost for the SENSITIVITY NOT UPDATED Each Tick Mark Equals 5.0% Change % Change in Capital Investment Cost from Base Case -15.0% 45.0% -10.0% -5.0% 0.0% 5.0% 10.0% 15.0% $5,500,000 40.0% $5,300,000 35.0% $5,100,000 $4,900,000 $4,700,000 25.0% $4,500,000 20.0% $4,300,000 15.0% $4,100,000 10.0% $3,900,000 5.0% $3,700,000 0.0% $4,126,750 $4,369,500 $4,612,250 $4,855,000 $5,097,750 $5,340,500 $3,500,000 $5,583,250 Capital Investment Cost (Excluding Soft Costs and IDC), $ IRR After Tax 10 Years Revised 7/14/03 NPV After Tax 10 Years at 6.0% Discount Rate Page 169 NPV IRR % 30.0% EconExpert-DG Users Manual – Copyright 2001 - 2005 Important Notes regarding Sensitivities: • Sensitivities analysis are performed for a specific case in the model, showing upside and downside variations relative to the current case. If Inputs to Table 1 or Table 1C are changed, the current sensitivity cases may need to be updated to reflect the new case. • The formatting of Charts (or Graphs) in Excel may require adjustments as the values that are charted are changed. You may also want to customize a Chart. To modify or customize a Chart created by EconExpert-DG, first Disable Range Protection using the UTILITIES Menu. Then click on the appropriate Chart to view / edit the Excel Chart Options. After finishing it is recommended that you re-enable the Range Protection. For help on formatting Excel Charts, use Microsoft Excel Help and search for “CHARTS”. Revised 7/14/03 Page 170 EconExpert-DG Users Manual – Copyright 2001 - 2005 G) Tornado Diagrams The SENSITIVITIES Menu also provides you with options to generate Tornado Diagrams. Whereas the individual Sensitivities on this menu allow you to selectively study effects of changes individual inputs, Tornado Diagrams illustrate how the NPV or IRR of the current case will be impacted by individually incrementing multiple inputs. (Note: You can also construct your own Payback Tornado Diagrams) Each of the respective Tornado Diagrams are generated by varying the inputs for the life of the project, based on inputs to either Table 1 or Table 1C. You can specify the term (in years) of the IRR and NPV analyses that are used in the Tornado Diagrams by entering the desired number of years in the third column of the NPV and IRR Summary Tables at the top of Table 1. The location of the entry is identified by the red boldfaced title IRR TERM FOR SENSITIVITY STUDIES as shown the Figure below: Figure 86 - Inputting the Term of Sensitivity Analyses or Tornado Diagrams Tornado Diagrams show respectively how the after-tax IRR and NPV will be impacted by changes in inputs to the program that fall into the following classes: • Capital, Debt and Equity Related Inputs, o Capital Investment Cost o Operating Lease Payment o Operating Lease Term o Owner’s Equity o Interest Rate on Construction Debt o Interest Rate on Primary Debt o Interest Rate on Subordinated Debt o Term of Primary Debt o Term of Subordinated Debt Revised 7/14/03 Page 171 EconExpert-DG Users Manual – Copyright 2001 - 2005 • Fuel and O&M Related Inputs, o Annual Capacity Factor o DG Plant Fuel Price o Variable O&M Expenses o Fixed O&M and Major Maintenance Expenses o User Defined Expense 1 o User Defined Expense 2 o User Defined Expense 3 o User Defined Expense 4 o User Defined Expense 5 o User Defined Expense 6 o Standby Charges • Revenue and Savings Related Inputs o Capacity Payments o Price of Electric Energy Purchased from Utility (drives Savings) o Price of Electric Energy Sold Back to Utility o Steam Sales o Demand Charges (drives Savings) o Fuel Use or Price for facilities other than DG (drives Savings) o User Defined Revenues 1 o User Defined Revenues 2 o User Defined Revenues 3 o User Defined Revenues 4 o User Defined Revenues 5 o User Defined Revenues 6 The Sensitivity Sheet is used to generate the tables used for the Tornado Diagrams. The Increments used for the Tornado Diagrams are entered in the Data Input Sheet that is opened when you select the respective Tornado Diagram from the SENSITIVITIES Menu. An example of the Data Input Sheet that will be opened is provided below. Revised 7/14/03 Page 172 EconExpert-DG Users Manual – Copyright 2001 - 2005 Figure 87 – Tornado Diagrams Data Input Sheet The white boxes in this sheet are the locations where you tell EconExpert-DG over what +/range (“Increment”) that you would like the model to vary each of the specified inputs. Once you have established the Increments, one of the blue buttons at the bottom of the data form may be selected to generate the Tornado Diagram. The first button will run the selected sensitivities and will sort the horizontal bars in the Tornado Diagram based on the after-tax IRR, showing the parameter which if changed would have the most consequential impact on IRR at the top of the chart and the least consequential parameter on the bottom of the chart. The second button will run the selected sensitivities and will sort the horizontal bars in the Tornado Diagram based on the after-tax NPV, showing the parameter which if changed would have the most consequential impact on NPV at the top of the chart and the least consequential parameter on the bottom of the chart. The third button will allow you to cancel the operation and to return to the EconExpert-DG model. Revised 7/14/03 Page 173 EconExpert-DG Users Manual – Copyright 2001 - 2005 Revised 7/14/03 Page 174 EconExpert-DG Users Manual – Copyright 2001 - 2005 Figure 88 – Sample Tornado Diagram Tornado Diagram - Sensitivity of After Tax IRR to Changes in Fuel Costs, Fixed and Variable O perating Costs, and Capacity Factor Related Inputs Base Case 10 yr. IRR = 35.5% % Change in Leveraged IRR from Base Case -2.5% -2.0% -1.5% -1.0% -0.5% 0.0% Annual Capacity Factor (life- of- project avg)= 84.5% + / - 5.0% 0.5% 1.0% -1.89% -0.70% 0.70% Cogen Annual Fuel Price (5 yr avg) = $0.350/ Therm + / - 5.0% -0.68% 0.67% User Defined Additional Annual Expenses 2 (5 yr avg. O &M) $90,595* + / - 25.0% -0.68% Standby Charges (5 yr avg) $3.000$/ kw mo + / - 25.0% 2.0% 1.79% User Defined Additional Annual Expenses 3 (5 yr avg. O &M) $141,417* + / - 25.0% User Defined Additional Annual Expenses 1 (5 yr avg. O &M) $55,716* + / - 25.0% 1.5% 0.62% -0.60% -0.47% 0.58% 0.47% Variable O &M Costs (5 yr avg) $0,000cents/ kwh + / - 25.0% -0.19% 0.19% Fixed & Expensed Major Maintenance Costs (5 yr avg)$54,000*) + / - 25.0% -0.19% 0.19% The horizontal bars illustrate how +/- changes in the identified inputs would impact the project’s IRR. The results are sorted in order of significance, giving the “Tornado” effect. Note that the titles on the left axis identify the base case Leveraged and Unleveraged IRRs, the Base Year $ value for the input, and the Increment that was used. Please note that due to the nature of cash flow timing and discount rate effects on the IRR and NPV calculations, the ordering of consequential impact of the parameters on the respective IRR and NPV Tornado Diagrams may be different for the same base case. Revised 7/14/03 Page 175 EconExpert-DG Users Manual – Copyright 2001 - 2005 H) Customizing EconExpert-DG One of the beauties of EconExpert-DG is the flexibility it offers allowing you to accurately model virtually any Power Generation Project. While the core tables in the model are locked and cannot be modified by the user, in the vast majority of cases, custom analysis can be accomplished using a combination of EconExpert-DG's Global and Annual Inputs Sheets, Tables 1 and 1C. In addition to entering values into these cells, formulas may also be entered. These formulas can be tied to other cells in the model or to custom tables that you develop. Useful approaches for customizing the model include: 1) Yellow Free-Form Tables At the bottom of each sheet, a blank unprotected area (formatted as Yellow Cells), is provided where you can develop your own custom calculations. In these areas you can set up your own tables, which can be linked to other tables and calculations in the model. Figure 89 - Example of Free-Form at the Bottom of Each Sheet Where You Can Perform Custom Calculations You can select the format of cells in these tables using the: UTILITIES Reformat Cells option on the EconExpert-DG Command Menu, which allows you to select various number, $ or % formats. • You can also insert a new sheet into the model. To do this, right click on any of the Sheet Tabs and select: Insert Worksheet To take best advantage of customization, link your custom formulas to Annual Inputs in Table 1C. In this way, all of the functionality of the model will reflect your customization. Note: Be careful not to create 'Circular Calculations' using these approaches. Revised 7/14/03 Page 176 EconExpert-DG Users Manual – Copyright 2001 - 2005 Appendices 1. EconExpert-DG Software License Agreement EconExpert-DG Financial Model by Competitive Energy Insight, Inc. SOFTWARE LICENSE AGREEMENT Read Carefully Before Using This Software. Before the installation of this software can be completed, you must accept the terms of the License Agreement (the “Agreement”) below by pressing the ACCEPT button at the end of the Agreement. If you do not accept the Agreement’s terms, the EconExpert-DG Model will not function properly. This is a legal agreement between you (the “Licensee”) (either an individual or an entity as the original purchaser) and CEI. By pressing the ACCEPT button below, you agree to be bound by the terms of this Agreement. If you do not agree to the terms of this Agreement, press the DECLINE button below and destroy the software, and all accompanying items (including printed materials and packaging if applicable). 1. Description of the Model. The EconExpert-DG Financial Model (the “Model”) is a spreadsheet designed to assist users with the financial analysis of electric power generation projects. The Model requires the installation and use of Microsoft Excel®, for which Licensee must possess valid licenses. Licensee, and Licensee’s authorized users of the Model, must use software and hardware that satisfy the minimum requirements specified in the Model’s User’s Manual. 2. License Rights. This Agreement provides Licensee and its Authorized Users with a limited, nonexclusive, nontransferable, license right to install and to use the Model on specific desktop and laptop computers. Both the specific users (“Authorized Users”) and the specific computers must be authorized in writing, fax or email by CEI. Neither Licensee nor its Authorized Users may sublicense, assign, or transfer the license granted hereunder to any third party, and any attempt at any such sublicense, assignment, or transfer is void. Licensee and its Authorized Users may not copy, distribute, modify, reverse engineer or create Derivative Works (as hereinafter defined) except as expressly authorized by this Agreement and the Model. Authorized Users are authorized to use the Model only on the computers specified in writing, fax or email by CEI and the list of such computers shall only be modified with documented approval by CEI which may be by written agreement, fax or email. 3. Termination. In the event of a breach of this Agreement by Licensee, CEI may terminate this Agreement. Upon termination or expiration of the term of this Agreement, Licensee’s and Authorized Users’ license to the Model shall terminate. At the end of the term of this license, or upon its earlier termination, unless this Agreement is extended by a written, faxed or emailed notice provided by CEI, Licensee shall destroy all electronic copies of the Model. 4. License Fees and Term: Fees for use of, and the term of a license the Model are on a periodic subscription basis. The fees payable under this Agreement have been set forth in a separate written, faxed or emailed communication between CEI and Licensee. 5. Warranty. CEI makes no warranties or representations with respect to the accuracy, use or application of the Model, nor any technical assistance provided by CEI to Licensee or Authorized Users, except that CEI will make reasonable efforts to correct defects in the Model after they are identified and will promptly provide Licensee with updates containing such corrections as CEI deems appropriate when they are available. These reasonable efforts to correct defects in the Model do not apply to Derivative Works developed by Users of the Model and CEI assumes no Revised 7/14/03 Page 177 EconExpert-DG Users Manual – Copyright 2001 - 2005 responsibility for or obligation relative to the performance of or defects in Microsoft Excel. EXCEPT FOR THE WARRANTIES AND REPRESENTATIONS EXPRESSLY SET FORTH HEREIN, COMPETITIVE ENERGY INSIGHT, INC. DISCLAIMS ANY AND ALL WARRANTIES AND REPRESENTATIONS, EXPRESS OR IMPLIED, WITH RESPECT TO THE MODEL AND ITS CONFORMITY TO ANY SPECIFICATIONS OR DESCRIPTION, INCLUDING WITHOUT LIMITATION ANY IMPLIED WARRANTIES OF MERCHANTABILITY, FITNESS FOR A PARTICULAR PURPOSE OR THAT THE MODEL OR THE RESULTS THEREFROM SHALL BE ERROR FREE. 6. Technical Assistance. Licensee and its Authorized Users shall be entitled to 30-days of free technical assistance applied only to the installation and use of the Model, which will be provided via phone or e-mail. Technical assistance beyond this 30-day period, or any on-site technical assistance, shall be provided at the discretion of CEI and shall be billed to client at CEI’s then-current consulting rates for technical assistance. 7. Installation of the Model. The electronic software provided by CEI under this Agreement will be subject to a limited installation period, after which the software provided may not install properly on the User’s Computer(s). If appropriate, CEI can provide replacement electronic copies of the software during the period of this Agreement with a new authorized period of installation. 8. Inputs, Examples and Derivative Works. The Model includes sections that have been designated as “Unprotected” where Authorized Users may input data or may perform custom analyses using the results generated within the Model, both of which analyses and generated results are defined as and described in this Agreement as “Derivative Works.” Users may only make changes to the Model in such designated “Unprotected” areas and such changes are only for the use of Licensees and Authorized Users of the Model. CEI provides no warranties relative to such Derivative Works of the Model or relative to Licensee’s or Authorized Users’ application of such Derivative Works. Inputs, examples and descriptions provided by CEI in the Model are provided for example purposes only and CEI makes no representations or warranties with respect to the accuracy of such inputs, examples or descriptions. 9. Sharing of Electronic Copies of the Model and Printed Materials Generated by the Model. Electronic copies of the Model and printed materials generated by the Model may be generated and shared with third parties ONLY as specified below: All Electronic Copies of the Model and Printed Materials must include the original Copyright notices provided by CEI. 9.1 Saving of Electronic Copies of the Model. Users may make, save and reuse electronic copies of the Model, as required, for use on the Authorized Computers or as otherwise designated in writing by CEI. 9.2 Sharing of fully functional Electronic Copies of the Model. Users may share electronic copies of the Model with others including third parities who have a current and valid License with CEI for the Model, but such Electronic Copies will not work properly on computers that are not Licensed and Authorized by CEI. The shared copies can be made to be Fully Functional on a new user's computer by obtaining the proper License Extension Codes from CEI, which can be provided to new Authorized Licensees as described when the Model is opened on an unauthorized computer, in the EconExpert-DG HELP Menu and in the User's Manual. 9.3 Sharing of Electronic (Values Only) Copies of the Model. The Model includes preprogrammed algorithms accessible through the Model’s Command Menu that will generate electronic copies of the Model which contain only the values generated by a specific case and contain no formulas capable of analyzing other cases with the Model. Users may share with third parties such “Values Only” copies of the Model that have been generated using macros that are accessed by the Model’s Command Menu. All such electronic copies shall include the EconExpert-DG Trademark and copyright notices as provided by CEI in the Model. 9.4 Sharing of Printed Reports Generated by the Model. The Model includes preprogrammed algorithms accessible through the Model’s Command Menu that will generate printed copies of reports which contain only the values generated by a specific case and contain no formulas capable of analyzing other cases with the Model. Users may share with third parties such printed “Values Only” copies of the Model that have been generated using macros that are accessed by the Model’s Command Menu. No other form of printed copies may be shared with third parties who do not have a current and valid license to the Model. All such printed Revised 7/14/03 Page 178 EconExpert-DG Users Manual – Copyright 2001 - 2005 copies shall include the EconExpert-DG trademark and copyright notices as provided by CEI in the Model and on all reports generated using the Model. 10. Limitation of Liability. In no event shall Competitive Energy Insight, Inc., its owners, employees, affiliates, representatives, or assigns, be liable for indirect, incidental, consequential, special, or punitive damages, or for loss of profits or sales in connection with the use of the Model. In addition, CEI’s total aggregate liability to Licensee under this Agreement shall not exceed the amount of the current annual subscription fee for one user, that was most recently paid by a Licensee. This limitation of liability shall apply to all claims made by Licensee or its affiliates without regard to which other provisions of this Agreement have been breached or have proved to be ineffective. 11. Copyright Notice: The Model and accompanying documentation are protected by copyright law and international treaties. The Model and accompanying documentation include copyright notices prominently displayed in the Model, on reports generated and produced by the Model, and in the User’s Manual. Use of the Model outside of the License term is expressly prohibited. For information regarding the Model please contact: Competitive Energy Insight, Inc. 12025 Blue Diamond Court San Diego, CA 92131 Telephone: Fax Email: Website: (858) 566 – 0221 (858) 566 - 0287 [email protected] http://www.CEInsight.com 12. Jurisdiction: This Agreement shall be governed by and interpreted in accordance with the laws of the State of California, without reference to its rules on conflicts of laws. The sole jurisdiction and venue for any litigation arising out of this Agreement shall be an appropriate federal or state court in California, San Diego County. 13. Entire Agreement. This Agreement and any other addenda hereto that have been signed by CEI and Licensee contain the entire Agreement between the parties hereto with respect to the subject matter hereof and supersede any and all prior understandings, correspondence and Agreements, oral or written, between the parties with respect thereto. No change, amendment or modification of this Agreement shall be valid or binding upon the parties unless such change, amendment or modification shall be in writing and duly executed by both parties. 14. Survival. In the event of termination or expiration of this Agreement, the obligations of Sections 3 (“Termination”), 5 (“Warranty”), 10 (“Limitation of Liability”), 11 (“Copyright Notice”), 12 (“Jurisdiction”), 15 (“Indemnification”), and 16 (“Attorneys Fees”) shall survive such termination or expiration. 15. Indemnification. Licensee shall indemnify, defend, and hold CEI harmless from any and all third party claims, demands, suits, and actions alleging injury to persons, damage to property, or other loss or liability resulting from Licensee’s use of the Model. 16. Attorneys Fees. The prevailing party in any dispute, mediation, arbitration, or litigation concerning this Agreement shall be entitled to receive from the other party its attorneys’ fees and costs incurred in connection therewith. 17. Successors and Assigns. Subject to the prohibition on Licensee’s assignment, this Agreement and all of the provisions hereof shall be binding upon and inure to the benefit of the parties hereto and their respective successors and permitted assigns. By clicking on the button provided on the bottom of the License Sheet in the EconExpertDG Financial Model, User ACCEPTS or DECLINES acceptance of the terms of this Software License Agreement. If the License is declined, the EconExpert-DG Model will not be fully installed and should not be used. Revised 7/14/03 Page 179 EconExpert-DG Users Manual – Copyright 2001 - 2005 A) Comparing EconExpert Files and Identify / Quantify Differences Between Cases EconExpert offers two very powerful options for comparing different cases and quickly understanding the changes and differences between those cases. Either of these Features can be accessed from the UTILITIES Menu by selecting: UTILITIES Compare EconExpert Files to Identify Changes Further Discussion of these Model Comparison Features is provided below: a) Feature 1. You can compare the INPUT SHEETS of two different cases and identify which inputs have changed. This procedure allows you to 'Track' input changes between two different EconExpert-DG Models. Input categories that have changed are compared and identified (by highlighting on an ORANGE BACKGROUND). A new worksheet is created with copies of all of the tables in the model, with the changed items highlighted. The procedure will involve three spreadsheets: • • • The ‘Target’ EconExpert-DG Model is the model that you want to identify the changes in o The ‘Target’ model MUST be opened FIRST. The ‘Reference’ EconExpert-DG Model is the model that you want compare/track changes against. o The ‘Reference’ model MUST be opened SECOND. o Record the filename of the ‘Reference’ Model as you will need to enter this information. The 'COMPARISION' file (which you will name) that highlights the fields that have been changed. Also note that the ‘Target’ and ‘Reference’ models MUST each have at least TWO available windows, and the ‘Target’ and ‘Reference’ models MUST have different names AND BOTH MUST BE ENABLED. A copy of the each of the respective Input Sheets from the ‘Target’ model will be created in the 'COMPARISON' file with a name that you designate. The COMPARISON FILE will contain copies of the respective Global Inputs, Annual Inputs and Data Conversion Input Sheets, with the changed input fields HIGHLIGHTED on a BRIGHT ORANGE Background. Once initiated, you will not be able to terminate this macro until it is completed. You will be requested to provide two pieces of information: • • The Name of the REFERENCE EconExpert-DG Data File. The REFERENCE file is the one that you want to compare the TARGET file against. The Name of the new 'COMPARISON' file you want to create that will highlight the changes between the cases. This 'COMPARISON' file will be saved in the same directory as the ‘Target’ File that you are identifying changes in. Other important requirements for running this macro include: • • • The name you entered for the REFERENCE Data file must be precisely correct. BOTH the TARGET AND REFERENCE models must be ENABLED. There must NOT be a file with the same name as the COMPARISON file that is currently opened. Revised 7/14/03 Page 180 EconExpert-DG Users Manual – Copyright 2001 - 2005 • Both the TARGET AND REFERENCE Files have at least two available windows. If they do not, to add a window from the Excel Command Menu select: Window New Window from the Excel menu to add a window to the file where it is required. The Figure on the next page illustrates how changes in the Global Inputs Sheet are highlighted. The current (Target) case is illustrated in a new worksheet with each of the input cells that have changed highlighted in ORANGE. Figure 90 – Comparing Data Files – Highlighting of Inputs that Changed in a TARGET File The ORANGE shaded cells indicate where input changes have occurred in the TARGET file relative to the REFERENCE file. Revised 7/14/03 Page 181 EconExpert-DG Users Manual – Copyright 2001 - 2005 b) Feature 2. You can compare ALL OF THE SHEETS, quantifying the magnitude of (the 'delta') changes between two cases. This Macro works only between IDENTICAL VERSIONS of EconExpert-DG. This procedure allows you to Compare and Quantify Differences between two different EconExpert-DG Models. You can also Compare and Quantify Differences between an active input sheet and a holding bin in the same model by saving the current model as two different file names, with the desired cases to be compared each respectively activated in one of the files. A new worksheet is created with copies of all of the tables in the model. Every cell in the model (inputs or calculations) that has changed is identified (by highlighting on an ORANGE BACKGROUND) and the amount of the difference between the two cases (either positive or negative) is quantified. PLEASE NOTE THAT THIS IS A MEMORY (RAM) INTENSIVE PROCEDURE! IT IS RECOMMENDED THAT YOU CLOSE OTHER APPLICATIONS AND SPREADSHEETS BEFORE IT IS INITIATED. The procedure will involve four spreadsheets: • • • • The ‘Target’ EconExpert-DG is the model that you want to identify the changes in. o The ‘Target’ model MUST be opened FIRST. The ‘Reference’ EconExpert-DG Model is the model that you want compare changes against. o The ‘Reference’ model MUST be opened SECOND. o Record the filename of the ‘Reference’ Model as you will need to enter this information. The 'COMPARISION' file (which you will name) highlights the fields that have been changed. A Temporary File that EconExpert will create and then delete. Note that the ‘Target’ and ‘Reference’ models MUST each have at least TWO available windows, AND the ‘Target’ and ‘Reference’ models MUST have different names AND BOTH MUST BE ENABLED. A copy of each of the respective Input and Results Sheets from the ‘Target’ model will be created in the 'COMPARISON' file with a name that you designate. All changes will be quantified and HIGHLIGHTED on a BRIGHT ORANGE Background. Once initiated, you will not be able to terminate this macro until it is completed. You will be asked for two items when this procedure is initiated: • • The Name of the REFERENCE EconExpert-DG Data File. The REFERENCE file is the one that you want to compare the TARGET file against. The Name of the new 'COMPARISON' file you want to create that will quantify and highlight the DIFFERENCES between the cases. This 'COMPARISON' file will be saved in the same directory as the ‘Target’ File that you are identifying changes in. Other important requirements for running this macro include: • • • • The name you entered for the REFERENCE Data file must be precisely correct. BOTH the TARGET AND REFERENCE models must be ENABLED. There must NOT be a file with the same name as the COMPARISON file that is currently opened. Both the TARGET AND REFERENCE Files have at least two available windows. If they do not, to add a window from the Excel Command Menu select: Window New Window from the Excel menu to add a window to the file where it is required. The Figure on the next page illustrates how changes in the Global Inputs Sheet are highlighted. The current (Target) case is illustrated in a new worksheet with each of the input cells that have changed highlighted in ORANGE. Revised 7/14/03 Page 182 EconExpert-DG Users Manual – Copyright 2001 - 2005 Figure 76 – Comparing Data Files – Quantifying the Difference in Inputs and Results in a TARGET File versus a REFERENCE FILE The ORANGE shaded cells indicate where input changes have occurred in the TARGET file relative to the REFERENCE file and identify the amount and direction of the change. Revised 7/14/03 Page 183 EconExpert-DG Users Manual – Copyright 2001 - 2005 c) Demand Ratchets The Demand Ratchet is a special condition used in some tariff or utility rate schedules which requires the customer to pay a premium on each bill during a specified period, typically related to peak demand or usage during a previous billing period. Ratchets are often used by utilities as a means to recover costs associated with installed capacity which the utility deems a customer previously used and so therefore should continue to fund for some period. As an example, some utility tariffs will require the customer to pay demand charges for the first year of operation of a DG facility which are based on the demand over the year prior to the operation of the DG facility. Similarly, after a forced outage of the DG facility (especially during an on-peak period), the utility may charge the customer higher demand fees for a specified period (often up to a year) following the outage event. This section of the Annual Inputs Sheet allows the user to evaluate the impact of Ratchets if they apply. The user may specify the 3 month average amount of the demand ratchet (in kw) which will apply during each respective quarter, resulting in a calculation of additional demand charges by EconExpert-DG in the months where non-zero ratchets are identified. Revised 7/14/03 Page 184 EconExpert-DG Users Manual – Copyright 2001 - 2005 d) Time-of-Use Wizard While commercial customers typically receive their electric bills on a monthly billing cycle, costs for electric use are usually computed based on time-of-use, with the lowest rates for electric energy consumption applied during off-peak demand period and progressively higher rates applied as system demand increases through mid-peak, on-peak and super-peak periods. The corresponding block time periods when these tiered rate structures apply and the rates charged during those periods usually then vary as a function of the time of day, day of the week and season of the year. Since the customers use of electricity, and potentially their need for DG may also vary as a function of the time-of-day, day of the week and season of the year, the ultimate calculation of the electric bill is the result of a relatively complex set of calculations. Similar to the variation of the cost of electricity as a function of the corresponding time-of-use, some utilities also have monthly or seasonal variations in their demand charges as a function of how they value their capacity investments to meet that demand. The Time-of-Use Wizard allows you to proceed into the next level of DG Project Economic Analysis by analyzing time-of-use electric energy pricing and time-related demand charges. Time-of-Use Tariff Prices, Host Energy Usage and Demand, and DG Plant Performance Data can be entered into the Time-of-Use Sheet in Rate Blocks during each month. The data entered here will be then be aggregated into quarterly values that can be transferred to or referenced by formulas in the Annual Inputs Sheets. As described below, you can automatically populate time-of-use Data into the Quarterly Format used in the Annual Inputs Sheet, taking advantage of the flexible input architecture. Revised 7/14/03 Page 185 EconExpert-DG Users Manual – Copyright 2001 - 2005 2) Glossary of Terms Capital Lease - A Capital Lease is structured much the same as debt, so that the Owner (the Leasee) holds title to the project assets on their books. As a result, the owner will capture all of the associated tax depreciation. Often-times a Capital Lease may provide 100% financing. If the Operating Lease Switch is NOT selected EconExpert-DG will assume a Debt/Equity or Capital Lease structure. Cogeneration - EconExpert-DG offers the ability to evaluate Cogeneration or Tri-Generation Applications. Cogeneration provides two forms of savings. • Electric Energy Production from the Cogeneration Plant is used to offset Electricity Purchases from the Utility. • Waste Heat from the Cogeneration Plant is used to offset consumption fuel used to generate hot water or steam. Debt/Equity Financing - Debt/Equity financing is conventional financing where the owner puts up a proportion of the project cost as equity and the remainder is financed by a bank or other financial institution. Demand Charges - Demand charges are usually monthly fees ($/kw mo) charged by the utility. Demand Charges are usually related to the maximum metered power reading over a calendar year. Demand charges may be separately based on demand during 'on-peak' periods. A DG facility can reduce the peak meter reading and so reduce Demand Charges. However, if the DG facility goes off-line, the metered peak power requirements may not be reduced, decreasing or eliminating the demand charge savings for a some period. EconExpert-DG allows you to input historical and projected Demand Charge rates in the Global, Annual or Monthly Data Sheets and to evaluate the associated savings. The Annual Inputs sheet also includes a 'Forced Outage' option that will allow you to better understand impacts that DG plant outages might have on reducing Demand Charges. Please consult the fee structures for your local utility for more and specific information on their Demand Charge structure. Demand Ratchet - The Demand Ratchet is a special condition used in some tariff or utility rate schedules which requires the customer to pay a premium on each bill during a specified period, typically related to peak demand or usage during a previous billing period. Ratchets are often used by utilities as a means to recover costs associated with installed capacity which the utility deems a customer previously used and so therefore should continue to fund for some period. As an example, some utility tariffs will require the customer to pay demand charges for the first year of operation of a DG facility which are based on the demand over the year prior to the operation of the DG facility. Similarly, after a forced outage of the DG facility (especially during an on-peak period), the utility may charge the customer higher demand fees for a specified period (often up to a year) following the outage event. Distributed Generation - Distributed Generation Projects in EconExpert-DG are 'Inside-theFence' independently owned power generation projects where an owner or operator uses a Revised 7/14/03 Page 186 EconExpert-DG Users Manual – Copyright 2001 - 2005 power generation facility to self-generate electricity to offset purchases from the local utility. In addition, the facility may produce waste heat which can be used to offset use of gas or other fuels or to run thermally driven chillers. In these cases the economics of the project are largely driven by giving the entity some element of independence from the local power and gas providers providing savings and potentially better surety of supply. Enable Model - After you save EconExpert, cells throughout the model will be converted to #Div/0!. This is associated with a security feature in the model designed to prevent misuse by unauthorized or unlicensed persons. If you are an authorized user, the model can be easily re-enabled by clicking on the: ENABLE MODEL Enable EconExpert selection on the Command Menu. Macros must be 'Enabled' in Excel for this feature to function properly. Energy Price Profiles - EconExpert-DG allows input of Energy and Fuel Prices, and DG Plant Performance in quarterly periods. EconExpert-DG will calculate a composite yearly energy price for use in the proforma, and will calculate yearly net revenues from energy sales during each of the specified periods. In the Monthly Data Sheet, the user can specify detailed 'Historical' and projected performance and pricing data for up to 12 Monthly periods. These inputs include historical gas and electric usage and rates and projected DG Plant performance parameters. Fixed Costs - Fixed Operations and Maintenance costs are not dependent on annual net generation. These costs can be entered either as either of two 'User-Defined' Fixed Cost Categories. Forced Outage - A Forced Outage is a condition where the production of the DG facility is partially or fully interrupted due to an operational upset. This situation is most critical to a DG facility if it occurs during a time period (usually on-peak) when the utility will apply penalties (a “Ratchet”) for not achieving required demand reductions. Te impacts of Forced Outages on savings can be studied using Table 1C Project Annual inputs. Fuel Price Profiles - EconExpert-DG allows input of Forward Fuel Prices ($/Therm) in quarterly periods corresponding to the Energy Pricing Periods. EconExpert-DG will calculate a composite life-of-project yearly fuel price for use in the proforma, and will calculate yearly net expenses for fuel during each of the periods. Table 1C also allows input of annual fuel pricing data in quarterly periods. If desired, forward pricing and performance profiles can be specified monthly using the Monthly Data Sheet. Internal Rate of Return, IRR - The Internal Rate of Return is the discount rate at which a series of cash flows would have a Net Present Value (NPV) of 0. IRR Guess - Calculation of the Project's Internal Rate of Return (IRR) is an important analysis feature in EconExpert. The IRR (and NPV to Date of Financial Closing) are Revised 7/14/03 Page 187 EconExpert-DG Users Manual – Copyright 2001 - 2005 summarized at the top of Table 1 where you can continuously view how they react to changes in Inputs to Table 1. Microsoft Excel uses an iterative technique for calculating IRR. The guess is a number that you guess is close to the result you expect for the IRR. Starting with guess, the IRR calculation cycles until the result is accurate within 0.00001 percent. If IRR can't find a result that works after 20 tries, the #NUM! error value is returned. In most cases you do not need to provide guess for the IRR calculation. If guess is omitted, it is assumed to be 0.1 (10 percent). If IRR result gives the #NUM! error value, or if the result is not close to what you expected, try again with a different value for guess. The IRR Guess is entered in Column I, just above Table 1. Major Maintenance - Major Maintenance Costs are costs incurred for major repairs. In EconExpert-DG, these costs are expensed for book and tax purposes in the year they occur. Net Present Value, NPV – The Net Present Value is the equivalent value of a stream of cash flows discounted to a specified time at the specified discount rate. In EconExpert-DG, the NPV is expressed as of the date of Financial Closing of the Project. Operating Lease - An Operating Lease is structured so that the Leasing Company (the Leasor) takes title to the project assets on their books. As a result, they are able to capture all of the associated tax depreciation at the Leasing Company's income tax rates. This can provide advantages for the Leasee (the customer) as the Leasee might not be able to as fully take advantage of the associated depreciation write-offs. If an Operating Lease is selected by selecting the corresponding Checkbox, EconExpert-DG will assume that the project is 100% financed by the Operating Lease and that title will be held in the name of the Leasing Company. The Operating Lease Payment will be treated as an operating expense. At the end of the Lease a Purchase option will be provided at the Residual ('Fair Market') value. After purchase by the owner, the asset will be depreciated on the owner's books using straight-line depreciation over the remaining asset life. The following four criteria must be satisfied for a lease to qualify as an Operating Lease: • The lease does NOT transfer ownership to the Leasee at the end of the term. • The lease does NOT contain a 'Bargain Purchase' option. • The lease term is NOT equal to or longer than 75% of the economic life of the asset. • The present value of the lease payments does NOT equal or exceed 90% of the fair value of the leased property. If any of these criteria are not satisfied, the lease is a Capital Lease and so must remain on the books of the customer. Please consult your Tax Advisor to confirm this information. Plant Capacity Factor - The Plant Capacity Factor is the % of potential annual generation that is produced over the year, accounting for plant dispatch and plant availability. So, a capacity factor of 80% means that the net annual kwh sold from the facility is 80% of the plant's generating capacity times 8760 hours / year. Table 1 allows you to input individual capacity factors during the life of the project. Alternatively, annual capacity factors can be specified for any year during the project life in Table 1C. Revised 7/14/03 Page 188 EconExpert-DG Users Manual – Copyright 2001 - 2005 Pop Up - IRR NPV Summary - The IRR and NPV Summary is a convenient pop-up that you can access from the UTLITIES menu from any location in the model. It provides with you with an update of the current After-Tax IRR, NPV and Payback results which are calculated in Table 8 Results, and are also presented at the top of the Global Inputs Sheet. To close the summary simply click on the 'X' box on the top right of the form. Standby Charges - Standby Charges are usually a Monthly fee, ($/kw mo) that represent new charges to the customer of the utility to ensure that in the event of an outage in the cogeneration facility, the utility will provide firm backup power. Normally, if standby charges are imposed, there are no additional penalties or demand charges paid by the customer even if the DG Facility experiences interruptions in service. Standby Charges are calculated in the model based on the maximum established generating capacity of the DG Facility. EconExpert-DG allows you to input projected Standby Charge rates in the Global, Annual or Monthly Data Sheets and to evaluate the associated savings. Please consult the fee structures for your local utility for more and specific information on their Standby Charge structure. Switches - The 'Switches' in the Global Inputs Sheet provide the user with the capability to turn ON, or to turn OFF, special calculations in the model. To select an option controlled by a switch, simply click on the associated check box. Discussions of the purposes of each 'Switch' are provided in respective comment statements in the Global Inputs Sheet. • Select Tri-Generation or Cogeneration • Select Operating Lease or Conventional Debt/Equity/Capital Lease Financing • Select to Carry Forward Tax Losses or to write-off losses in the current year even if the project is not profitable." Tax Loss Carry Forward - "Consult you Tax Advisor to confirm this information and how it applies to your situation." EconExpert-DG allows you to capture tax losses in the current year, or to carry them forward to be applied against future project earnings. Sometimes reported tax losses may be larger than the amount of net taxable income realized by the owner. This situation can commonly occur if the Production or Investment Tax Credits are applied as the resulting accelerated depreciation can result in a very large tax write-off in the first year of operations. If the tax write-offs in any year of the project are greater than the applicable taxable income, then the IRS will require those losses to be carried forward. However, if the losses at the project level can be applied to other earnings realized by the owner or Leasor (profits from other parts of the owner's income), those write-offs can be realized in the year that they occur, independent of the fact that the project on a standalone-basis was not profitable. If the Tax Carry Forward Checkbox is selected, any tax losses and their associated depreciation write-offs will be carried forward and applied to future project earnings during any year that the project experiences losses. If this option is not selected, the project will be credited with net income associated with tax losses in the year that those losses occur. This latter scenario assumes that losses can be transferred and fully applied against other beforetax profits realized by the owner. Revised 7/14/03 Page 189 EconExpert-DG Users Manual – Copyright 2001 - 2005 Tornado Diagrams - Tornado Diagrams are a unique tool that will help you to identify which economic parameters/inputs, if they were to change, would have greatest consequential impacts on the analysis. They illustrate how the IRR, NPV or Payback of the Project would be impacted by changes, in order or significance. This provides valuable insight into which parameters might warrant further investigation to determine how changes would impact the economic case you have set up. When you select to create a Tornado Diagram from the SENSITIVITIES Tornado Diagrams Menu Option, you will be prompted with a Data Entry Form which asks you over what ranges you would like to study the selected parameters. After completing the form, click on the button at the bottom of the form to create the diagram. Tri-Generation - EconExpert-DG offers the ability to evaluate Cogeneration or TriGeneration Applications. Cogeneration provides two forms of savings. • Electric Energy Production from the Cogeneration Plant is used to offset Electricity Purchases from the Utility. • Waste Heat from the Cogeneration Plant is used to offset consumption fuel used to generate hot water or steam. • Tri-Generation includes a third option: Waste Heat from the Cogeneration Plant is used to operate thermally driven chillers. Typically these chillers were originally electrically driven so additional electricity purchases are offset. Relative to options 1 or 2 above: o Electric consumption by the chillers is offset by the use of waste heat rather than direct self-generation of electricity. o Waste heat from the Cogeneration Plant is used to offset electricity purchases in addition to the offset of gas purchases used to produce hot water or steam. To Select Tri-Generation Simply Select the Checkbox in the Switches Section of Table 1 Project Global Inputs. User Defined Inputs - You may define your own categories of certain costs and revenues in either Table 1 or Table 1C. The User can name each of two categories of both Variable and Fixed O&M costs in Table 1 Project Global Inputs. The titles you assign to each of these cost categories will appear on all of the associated tables and reports generated by the EconExpert-DG model. In Table 1C - The User can name each of six additional cost or revenue/savings categories. Variable Costs - Variable Operations and Maintenance costs are dependent on annual electric power production. Two User-Defined categories are available in the Global Inputs Sheet. Revised 7/14/03 Page 190 EconExpert-DG Users Manual – Copyright 2001 - 2005 VI) Special Insert - Table 1P – Partner Return Calculations Table 1P Partner Returns and Table 11P Partnership Financials are architected to model various schemes that might be written into a partnership agreement. This module is designed to model most partnership arrangements, and to provide automated calculations to support those arrangements. Also, proper capital account tracking, and individual tax treatments are used. Please refer to the Glossary at the end of this section for any terms that are unfamiliar to you. Figure 91 - Table 1P Partner Returns Revised 7/14/03 Page 191 EconExpert-DG Users Manual – Copyright 2001 - 2005 1) Partnership Overview and Disclaimer Partnerships are pass-through entities and therefore all items of partnership income, expense and depreciation are reflected on each partner or investor's separate capital account. This is in contrast to the tax treatment of a regular corporation, where all items of income, expense, and tax liability remain at the corporate level. Because of the complexities that arise when multiple parties form a partnership or limited liability partnership to own a wind power project, CEI provides additional calculations to aide the user in understanding the financial returns to each partner. These calculations assume that all partners are general partners versus limited partners, so that special allocations may be incorporated. Table 1P offers inputs to allocate taxable income and losses, tax credits and cash distributions to each partner. Each partner’s capital account and basis are tracked throughout the lifetime of the project, as well as each partner’s estimated tax liability, cash flows, and after-tax returns. Table 11P lays out the partnership financial statements, and most importantly calculates cash availability for distribution. While these spreadsheets are tools that allow you to model partnership financials and individual partner returns, whatever special allocations or distributions are assumed, you should always review those allocations and distributions with your tax advisor so that they meet US tax Code, and are allowed in your partnership agreements. There are two methods to extract cash out of the partnership to each partner. First, there are cash distributions, which withdraw cash from a partner’s capital account. Second, there are guaranteed payments to partners that do not decrease the partner’s capital account, but might be taxed differently depending on the partner’s situation. 2) Defining Partners Initial Capital Contribution Up to three partners can be defined on Table 1P, with their initial capital contributions also defined as a percentage of the total equity investment. For the purposes of a partnership, the percentage specified for Operations is the initial percentage invested in the partnership. If a partner is given interest in the partnership but does not contribute any capital, enter the partner name in the space available but leave the initial contribution blank or enter zero. The next version of the model will allow for investors to bring property to the partnership, as is done in many circumstances. Property contributions are not enabled in this version as the US tax Codes is written differently for partners who contribute property instead of cash. For simplicity sake, we focused only on cash contributions to the partnership, and assume that each partner enters the partnership at the same time. Revised 7/14/03 Page 192 EconExpert-DG Users Manual – Copyright 2001 - 2005 Additional Annual Contributions Once the partners are defined with their initial contributions, additional annual contributions can be inserted in Table 1P Partner Returns on lines 46-48. The total amount contributed by each partner is summarized directly below on lines 57-60. Tax Rates Partner specific federal income, federal self-employment, and state income tax rates can be specified in the table located in cells K18:M20. Note that self-employment taxes apply to guaranteed payments and will be calculated on ordinary income for general partners that are individuals, partnerships, or LLCs. Corporations do not pay a self-employment tax. Figure 92 – Table 1P Partner Returns – Tax Rates In the Figure above please note that the Pane is frozen, which is why the Tax section appears next to the Warnings. The tax rates are applied on lines 263-406 in the cash flow calculations for each partner. Taxable Loss Appetite Additionally, partners have their own tax appetite, which is called the “External Partner Taxable Income” in Table 1P. If a partner has any ability to utilize taxable losses at the federal or state level, simply specify “No” for the “Taxable Loss Carry Forward”. If their tax appetite is limited, specify “Yes” for the “Taxable Loss Carry Forward” and then enter the federal or state tax appetite in rows 179-192. These entries are values that are outside of the modeled wind project. If the partner’s tax appetite is unlimited, you can leave these entries blank and if no taxable loss carry forwards are assumed then all tax benefits will be assumed in the current year. NPV and IRR Calculations At the top of Table 1P, the after-tax IRR and NPV for each defined partner is shown, along with their initial capital contributions and Capital Share of the project. The calculations for the NPV and IRR are t the bottom on Table 1P, from lines 407-420. The cash flows for each partner are detailed on lines 263-406. Revised 7/14/03 Page 193 EconExpert-DG Users Manual – Copyright 2001 - 2005 3) Partnership Financial Statements On Table 11P – Partnership Financial income statement, balance sheet and cash flows are provided to match the partner allocation specifications on Table 1P – Partner Returns. The following statements compare the differences between Table 11 – Financials (“the project”) and Table 11P – Partnership Financial (“the partnership”): Income Statement First, the partnership income statement lacks any tax expense. Second, depreciation for the partnership is based on Tax depreciation, while Book depreciation is used to the project financials. Cash Flow Under Cash from Operations, the differing depreciation schedules appear again. The Cash from Investing line items are identical on both financials, unlike Cash from Financing which has several varying items. The partnership financials list the contributions and distributions, while the project financials only list the changes in equity contributions. Balance Sheet There are several differences in the project and partnership balance sheets. On the partnership balance sheet, under Assets, the cash amount will vary because cash is being pulled out of the partnership and distributed to the partners. Next, the Property, Plant & Equipment will differ because of the different depreciation amounts. Under Liabilities, Deferred Taxes appear on the project financials, but are not relevant to partnership financials. Instead of Equity on the project financials, there are Partners’ Capital Accounts on the partnership financials. Likewise the balances, contributions and distributions to and from the capital accounts are detailed on the partnership financials where the retained earnings exist on the project financials. Figure 93 – Comparison of Table 11 and Table 11P Financial Statement Variation Income Statement Depreciation Income Taxes, Tax Credits, Tax Deductions, Capital Gain Taxes Cash Flow Statement Cash From Operations Revised 7/14/03 Table 11 – Project Financials Table 11P – Partnership Financials Used Book depreciation – usually straight line Used to calculate Net Income Uses Tax depreciation – usually MACRS Not shown or used to calculate Net Income Net Income reflects taxes and Book Depreciation, show Deferred Taxes, and typically uses straight line depreciation Net Income does not reflect taxes and reflects Tax Depreciation, there are no deferred taxes, and typically uses MACRS depreciation Page 194 EconExpert-DG Users Manual – Copyright 2001 - 2005 Cash from Investing Cash from Financing Balance Sheet Assets Identical to Table 11P Shows total Equity in the project Identical to Table 11 Shows Contributions and Distributions from Table 1P Cash stays in the project, and Book Depreciation is used for PP&E Cash is pulled out of the partnership as defined on Table 1P, and Tax Depreciation is used for PP&E Does not include Deferred Taxes Tracks the sum of the Partners’ Capital Accounts, as well as Contributions and Distributions from Table 1P Liabilities Includes Deferred Taxes Equity/Capital Accounts Tracks total Equity in project and treats Net Income as Retained Earnings 4) Allocations There are many different ways partnership agreements can structure allocations of taxable income and loss. This model certainly does not handle all possible variations, but can handle many different types. Taxable Income, Loss and Depreciation The allocations available in Table 1P follow the typical allocations allowable under US partnership tax laws. While this model allows the user to allocate the economic items in any proportion, only your tax advisor can determine whether those allocations are allowable under US tax laws. At the top of Table 1P, in cells C13:C14, you can elect to set the sheet in one of two modes: • • Taxable Losses: This mode allows the user to allocate Taxable Income and Taxable Losses separately, with depreciation included in the Taxable Losses Allocation. Depreciation: This mode allows the user to allocate Taxable Income/Losses separately from Depreciation. Figure 94 – Table 1P – Partner Returns – Taxable Income Basis Whichever mode is selected, the custom allocations for each year of the project are set in rows 94-106. At the beginning of each row the percent of initial capital contributed is shown as a baseline. If no numbers are entered in these rows, the default values are Revised 7/14/03 Page 195 EconExpert-DG Users Manual – Copyright 2001 - 2005 these percentages. The Taxable Income or Taxable Income/Loss values entered in lines 96-98 are also used as the “Profit Share” values for cash distributions. Suspended Losses This model assumes that taxable losses, once assigned to a partner, will always be assigned to that partner regardless of the value of his capital account. If the amount of losses exceeds the partner’s basis for that year, a “Suspended Loss” account is created and that excess loss is carried forward until there is sufficient basis for the partner to utilize the loss. Tax Credits Production Tax Credits (PTCs) do not directly affect partners’ capital accounts. The user can set the allocation of PTCs on lines 113-115 on Table 1P. Again, while this model allows the user to allocate the PTCs in any proportion, only your tax advisor can determine whether those allocations are allowable under US tax laws. In this model the PTCs are figured into the tax calculations for each partner, beginning in row 472 and ending in row 672. Distributions There are several options for cash distributions in this model, and these options are explained in more detail below. 5) Cash Distributions Options Once allocations of taxable income and loss are established, it must be determined how each partner will extract cash from the partnership. There are four options for determining the total amount of cash available for distribution. The cash available is calculated on Table 11P on the Cash Flow Statement, with the Distributions appearing on line 104. Figure 95 – Table 1P – Partner Returns – Cash Distribution Options Distribute All Cash With this selection the model will automatically distribute the amount of cash available for the calendar year. Distribute Enough to Pay Taxes Once the project has a positive taxable income, partners will have a tax liability. Selecting this option distributes just enough cash to cover that tax liability. Additional cash distribution can then be determined using the Custom Distributions on lines 161-163 on Table 1P. Revised 7/14/03 Page 196 EconExpert-DG Users Manual – Copyright 2001 - 2005 Maintain Cap Account In some cases, either driven by partnership agreements or creditors, partners may have to keep a positive amount in their capital accounts. Selecting this option will determine whether or not distributions will lead to a negative capital account based on the given allocations, and suspend distributions until the time that the capital accounts will not go negative as a result of the distributions. In certain cases the accounts will be negative anyway because of the taxable losses. In these cases there will not be any distributions until the accounts are positive. Maintain Basis Similar to the above explanation for Capital Accounts, in some cases partners must attempt to keep positive basis. With this selection cash distributions will only occur up to the amount that will keep the basis positive, and in the case that the basis is already negative, no distributions will occur until the basis is again positive. For both account maintenance options (i.e. maintain capital account and maintain basis), there is a Minimum Account Balance option whereby the user can set the minimum amount to exist in the capital account or inside basis, in case such an amount is specific in a partnership agreement. The calculations for these options are performed in two locations – under each partner’s capital accounts, and at the bottom of the table, in rows 718-831. The idea for all options is to maximize the cash distributed under the given constraints. The following section describes the supporting calculations for each option. Distribute All Cash With this option the model will look at current and future cash obligations and distribute only cash that will not be required to meet an obligation, given future cash flows. In rows 742-753, current and future cash sources and obligations are identified and compared, with the result being a current Cash Available for Distribution. Distribute Enough to Pay Taxes In rows 719-740 the model determines each partners’ tax liability and distributes just enough cash, if available, to meet that liability. Maintain Cap Account and Basis In rows 757-826 the model attempts to adjust distributions to maintain positive values in each partner’s Capital Account or Inside Basis. In reality, if the partnership’s net income is negative over time, the Capital Account might go negative even without any distributions. In other words, no matter what accounting strategy is taken, the partners might show negative Capital Accounts. On the rows following each partner’s Capital Account, there are a few rows of calculations that look at future reductions in Liabilities and Basis, and compare them against future Net Income and other positive effects on the Capital Account. Then, in rows 757-829, the model will determine how much cash can be distributed, factoring in the future outlook of the Capital Account and Inside Basis. Revised 7/14/03 Page 197 EconExpert-DG Users Manual – Copyright 2001 - 2005 6) Cash Distribution Basis Once the distribution strategy is formulated, keeping in mind any partnership obligations, the allocation of cash distributions to each partner can be automatically set up as per a partnership agreement. The four options as provided in this model are as follows. Figure 96 – Table 1P – Partner Returns – Cash Distribution Basis Capital Accounts Capital Account values for each partner change yearly as allocations are made to reflect taxable income/loss allocations and/or cash distributions. In reality capital account values can change with more frequency (e.g. quarterly or monthly), but in this model all capital account changes are assumed to occur annually. By selecting this option, the end of year cash distributions will be paid to each partner proportionally according to their end-of-year Capital Account values. Profit Share Another option is to base the cash distributions on the designated profit sharing, which is defined in the Allocations section under Taxable Income, Loss and Depreciation Capital Share The third option is to set cash distributions to the amount of capital invested. None The last option is to only use custom distributions, which are done in lines 161-163 on Table 1P. Custom distributions can also be used if any of the Cash Distributions options except for Maximum Cash are selected, because there will be cash available that is not automatically distributed. If the partnership agreement contains language about preferred returns, then the user can put in formulas in these rows to reflect the preferred returns. 7) Guaranteed Payments The language in the partnership agreement governs the flow of income and expense items through the partners’ capital accounts as well as items such as guaranteed payments that are not capital account items. Guaranteed payments can either be a capitalized item or deductible for the partnership, depending on the nature of the payment, but are always a taxable event to the receiving partner. Revised 7/14/03 Page 198 EconExpert-DG Users Manual – Copyright 2001 - 2005 Capitalized Guaranteed Payments The model provides for two types of capitalized guaranteed payments, a Developer Fee and a Loan Guarantee Fee and both of which can be assigned to a partner or to an external party. In addition, both of these payments are one-time, capitalizable fees that represent a full-payment to the partner is the first year of the project, but are expensed over time to the partnership, as defined in the tax depreciation schedules on Table 1 Global Inputs. Deductible Guaranteed Payments The model provides for two types of deductible guaranteed payments, Developer Royalty and Guaranteed Return on Capital. These payments can occur in multiple years of the project and are hence ongoing and deductible from the partnership taxable income in the year that the payments occur. Guaranteed Return on Capital Near the top of Table 1P there is a table to provide any partner a Guaranteed Return on Capital. In this table the user can specify the percent of initial capital invested that will be returned to the partner each year for the years specified. The guaranteed return on capital differs from a preferred return in that the guaranteed return on capital does not affect the partner’s capital account. The payment is taxable to the partner receiving the Guaranteed Return and may be taxable as self-employment income depending on the partner’s situation. Figure 97 – Table 1P Partner Returns – Guaranteed Return on Capital 8) Glossary Most definitions from IRS Publication 541, except where noted Capital Account A capital account represents the equity that a partner has in the partnership. The Capital Account tracks the partner’s contributions, distributions, and the distributive share of income. Each year these capital accounts will change depending on the language of the partnership agreement, and how they will share in the profits and losses, and receive distributions. Revised 7/14/03 Page 199 EconExpert-DG Users Manual – Copyright 2001 - 2005 Capital Account Maintenance If partnerships make special allocations of income or distributions then each partner might have to take special care to keep a positive balance in their capital account. A partnership does not have to maintain book capital accounts in this manner, but might be required to by a creditor. Moreover, if special allocations are made, there is a higher risk that upon audit these allocations will not be respected. Account maintenance is another item that should be covered in a partnership agreement. Inside Basis (Adjusted Basis) of Partner’s Interest The initial basis of a partnership interest is the money the partner contributes, plus the partner’s distributive share of income and the partner’s assumption of partnership liabilities, minus any distributions and the partner’s distributive share of losses. For example, if the partnership takes on non-resource project debt, the partner’s assumption of that liability would the partner’s share of the partnership capital. A partner's distributive share of partnership loss is allowed only to the extent of the adjusted basis of the partner's partnership interest. The adjusted basis is figured at the end of the partnership's tax year in which the loss occurred, before taking the loss into account. Any loss that is more than the partner's adjusted basis is not deductible for that year. However, any loss not allowed for this reason will be allowed as a deduction (up to the partner's basis) at the end of any succeeding year in which the partner increases his or her basis to more than zero. Partnership Liabilities • A partner's basis in a partnership interest includes the partner's share of a partnership liability only if, and to the extent that, the liability: o Creates or increases the partnership's basis in any of its assets The term “assets” includes capitalized items allocable to future periods, such as organization expenses. o Gives rise to a current deduction to the partnership o Is a nondeductible, non-capital expense of the partnership • If a partner's share of partnership liabilities increases, or a partner's individual liabilities increase because he or she assumes partnership liabilities, this increase is treated as a contribution of money by the partner to the partnership. • If a partner's share of partnership liabilities decreases, or a partner's individual liabilities decrease because the partnership assumes his or her individual liabilities, this decrease is treated as a distribution of money to the partner by the partnership. • Assumption of liability. A partner or related person is considered to assume a partnership liability only to the extent that: o He or she is personally liable for it o The creditor knows that the liability was assumed by the partner or related person o The creditor can demand payment from the partner or related person o No other partner or person related to another partner will bear the economic risk of loss on that liability immediately after the assumption. Guaranteed Payment • Guaranteed payments are those made by a partnership to a partner that is determined without regard to the partnership's income. A partnership treats guaranteed payments for Revised 7/14/03 Page 200 EconExpert-DG Users Manual – Copyright 2001 - 2005 • • • • services, or for the use of capital, as if they were made to a person who is not a partner. This treatment is for purposes of determining gross income and deductible business expenses only. For other tax purposes, guaranteed payments are treated as a partner's distributive share of ordinary income. Guaranteed payments are not subject to income tax withholding. The partnership generally deducts guaranteed payments as a business expense. Guaranteed payments made to partners for organizing the partnership or syndicating interests in the partnership are capital expenses and are not deductible by the partnership. However, these payments must be included in the partners' individual income tax returns. Guaranteed payments are included in income in the partner's tax year in which the partnership's tax year ends. If guaranteed payments to a partner result in a partnership loss in which the partner shares, the partner must report the full amount of the guaranteed payments as ordinary income. The partner separately takes into account his or her distributive share of the partnership loss, to the extent of the adjusted basis of the partner's partnership interest. Cash Distribution • Partnership distributions include the following. o A withdrawal by a partner in anticipation of the current year's earnings o A distribution of the current year's or prior years' earnings not needed for working capital o A complete or partial liquidation of a partner's interest o A distribution to all partners in a complete liquidation of the partnership • A partnership distribution is not taken into account in determining the partner's distributive share of partnership income or loss. If the partner recognizes any gain or loss from the distribution, it must be reported on his or her return for the tax year in which the distribution is received. Money or property withdrawn by a partner in anticipation of the current year's earnings is treated as a distribution received on the last day of the partnership's tax year. • A partner's adjusted basis in his or her partnership interest is decreased (but not below zero) by the money distributed to the partner • A partnership generally does not recognize any gain or loss because of distributions it makes to partners. • A partner generally recognizes gain on a partnership distribution only to the extent any money included in the distribution exceeds the adjusted basis of the partner's interest in the partnership. Any gain recognized is generally treated as capital gain from the sale of the partnership interest on the date of the distribution. Partner’s Income or Loss • A partner's income or loss from a partnership is the partner's distributive share of partnership items for the partnership's tax year that ends with or within the partner's tax year. Self-Employment Income and Taxes • A partner is not an employee of the partnership. The partner's distributive share of ordinary income from a partnership is generally included in figuring net earnings from self-employment. However, a limited partner generally does not include his or her distributive share of income or loss in computing net earnings from self-employment. This exclusion does not apply to Guaranteed Payments made to a limited partner for services actually rendered to or on behalf of a partnership engaged in a trade or business. Revised 7/14/03 Page 201 EconExpert-DG Users Manual – Copyright 2001 - 2005 • If an individual partner has net earnings from self-employment of $400 or more for the year, the partner is liable for self-employment tax... Distributive Share • Generally, the partnership agreement determines a partner's distributive share of any item or class of items of income, gain, loss, deduction, or credit. However, the allocations provided for in the partnership agreement or any modification will be disregarded if they do not have substantial economic effect. If the partnership agreement does not provide for an allocation, or an allocation does not have substantial economic effect, the partner's distributive share of the partnership items is generally determined by the partner's interest in the partnership. Substantial Economic Effect • An allocation has substantial economic effect if both of the following tests are met. • There is a reasonable possibility that the allocation will substantially affect the dollar amount of the partners' shares of partnership income or loss independently of tax consequences • The partner to whom the allocation is made actually receives the economic benefit or bears the economic burden corresponding to that allocation Partner's Interest in Partnership • If a partner's distributive share of a partnership item cannot be determined under the partnership agreement, it is determined by his or her interest in the partnership. The partner's interest is determined by taking into account all the following items • The partners' relative contributions to the partnership • The interests of all partners in economic profits and losses (if different from interests in taxable income or loss) and in cash flow and other non-liquidating distributions • The rights of the partners to distributions of capital upon liquidation External Partner Taxable Income (CEI Definition) • The partner’s taxable income base from interest outside this power project, which would allow the partner to utilize any taxable loss or tax credit in the year in which it is earned. Revised 7/14/03 Page 202