1
Patrick Gundlach
erratum
meta-euro
The new currency, the euro, has not only brought new coins and bills to a lot of people
in europe, but it has also introduced a new symbol, which looks like this: ¤. It is not
just a capital C with two horizontal bars. There are angles at the left and right side of the
bars as well as at the upper left corner of the C. Even the opening angle of the C should
be the same in all the symbols. The european union (eu) tries to guide the font designers
and provides an official version of the symbol on their webpage. It looks like a geometric
construction that can be drawn with a ruler and a compass. And—since we are all used to
solve such tasks with a computer—this can certainly be done with MetaPost. MetaPost
is a companion to Don Knuth’s METAFONT and outputs encapsulated postscript (eps)
rather than fonts coded in bitmaps. MetaPost was written by John Hobby. It uses a language that is very close to the one described in the METAFONT book. MetaPost (as well
as the changes to METAFONT) is described in the MetaPost user’s manual (available as
mpman.ps on ctan or your local TEX installation) It is advisable, if you plan to program in
MetaPost, to have the users manual available as well as Knuth’s METAFONT book. But
the user’s guide will probably suffice at the beginning. There is also a nice introduction
to MetaPost in the MetaFun handbook. MetaFun is a macro package that is designed to
work well with the TEX macro package Context. But beginners should be aware of the
differences of plain MetaPost and the MetaFun extensions when reading the MetaFun
manual.
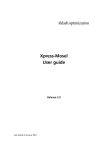
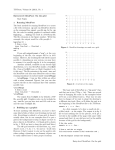
But back to the euro symbol. I have stated that there is an official version provided by
the eu, that looks as it can be constructed by geometrical means. It is depicted in figure 1.
Figure 1
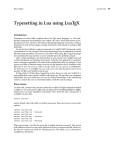
Figure 2
You will probably notice that there are some angles and some distances shown. But if
you look close enough, there are also some sizes unknown. For example it is not clear
how far the horizontal bars stick out to the left side. There is another construction by the
european central bank (ecb). You can see their version in figure 2.
This construction is about the same as the one mentioned before, but it adds some
additional values. You can see that the horizontal bars now stick out a well defined
amount. Most other constructions in the media are more or less exact copies of these
two. The eu one seems to be in favour. For the rest of this article that one will be used.
14
MAPS
erratum
I have mentioned earlier that there are some weaknesses of the official construction,
that makes it impossible to make an exact reproduction without measuring distances by
hand. The problems are
1. the length of the horizontal bars is unknown
2. the shape of the surrounding “circle” is not clear. Only the height and the relative
position of the horizontal bars is defined
3. the thickness of the “circle” is unknown
4. the thickness of the horizontal bars is unknown
5. and, not really a problem, the lables (x) on both angles are misleading and do not
seem to fulfill a real purpose.
Perhaps these points are unclear on purpose, so the font designer has some freedom to
let the euro symbol fit nicely into a given font. Whatever the reason is, we have to make
assumptions about the unclear parts, in order to be able to express the shape in terms of a
MetaPost program. I will, for the sake of clearness, assume that the surrounding shape
is a circle. While it looks like it in the eu construction, it looks a bit more squeezed in the
ecb one. In the official construction there is a variable x that seems to be some kind of a
unit. The diameter of the circle is 11x if the horizontal bars and the circle have a width
of 1x.
I will now show the MetaPost code. See below for an explenation on how to use it in
Latex or ConTEXt.
1
2
prologues
:= 2 ;
beginfig(1);
3
def tand expr x = (sind (x) / cosd (x)) enddef;
4
5
path unitcircle; unitcircle:=fullcircle scaled 2;
%unitcircle has radius of 1
Every MetaPost picture is enclosed in beginfig/endfig. The number in the parentheses
denotes the file extension. Say, for example, you have named the MetaPost-file mapseuro.mp, the figure gets written as maps-euro.1. In plain MetaPost there is no function
to calculate the tangens. Since it is needed below, I provide a definition here. I also
provide a circle with radius 1. I could of course have used the (predefined) fullcircle and
just multiply all values by two.
6
boolean show_dots, show_lines,show_labels ;
7
8
9
show_lines := false;
show_dots
:= false;
show_labels := false;
These lines are only for debugging purpose. The euro-symbol, when used in text, should
not have any labels or lines. But while constructing the symbol I would like to see if the
points are in the right place. And, of course, it should make it easier for the reader to
follow my thoughts as expressed in this code. Just set these variables to true if you want
to see more output.
show_lines := true;
show_dots
:= true;
show_labels := true;
What follows is declaration of some variables. In MetaPost you have to tell the system
whether your variable is a path, a pair or . . . .
Najaar 2002
15
erratum
Patrick Gundlach
10
11
12
13
14
15
16
17
path inner, outer; % the big circle: inner and outer part
path hbar;
% horizontal bar
path a[];
% aux paths for intersections
path clippath;
% path for clipping
pair topbarleft, bottombarleft;
pair o[];
% official points
pair c[];
% clip points
picture cp;
% currentpicture for clipping
18
19
20
21
x :=1cm;
radius:=5.5x;
topbarlength := 10x;
thickness:=1x;
These are the only user-changable parameters I provide. In a typical MetaPost program,
there are probably more values that can be influenced. x is our unit as given in the
official construction. It determines the overall size of the symbol. But since the picture
is scalable, it really does not matter too much to what value you set it.
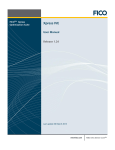
Now I will determine the points that are needed to draw the symbol. In the official
construction, the points o1, o2 and o3 are given, as well as the right slant. Alpha is the
angle between the horizontal line and the right slant.
22
23
24
25
o1 = (0 ,-radius-.5thickness);
o2 = dir 40 * (radius-.5thickness);
o3 = dir -40 * (radius-.5thickness);
alpha := angle (o2-o1);
26
27
a1 := o1 -- o2;
% the right slant
a2 := origin -- o3; % the lower 40deg. angle
Now, let us actually draw something. Start with the circle. This circle is a fullcircle.
The unwanted part at the right side will be clipped off later. After drawing the circle, we
determine the shape of the horizontal bars. There again, we draw more than we need and
clip the unwanted part off later.
28
29
draw unitcircle scaled radius
withpen pencircle scaled thickness;
30
31
hbar := unitsquare xscaled topbarlength yscaled thickness
slanted (1/tand (alpha));
32
33
% top bar lrcorner:
c3 := ((-infinity,0.5x) -- (infinity , 0.5x)) intersectionpoint a1;
34
35
topbarleft
:= (xpart c3 - topbarlength , 0.5x);
bottombarleft := (xpart c3 - topbarlength ,-0.5x - thickness);
36
37
fill hbar shifted topbarleft;
fill hbar shifted bottombarleft;
In line 33 we have found c3 just by asking MetaPost to find the intersection of the path
a1 and an infinite long horizontal line shifted 0.5 units above the origin. We do not assign
this line to a variable or even draw it. Now the shape of the horizontal bars are known,
so we can draw them.
At this time everything needed is drawn. But since we have put more in the picture than
necessary, some erasing must be done. There are several ways to accomplish this. You
can overdraw the unwanted parts with the background color. But since the background
color is not known at this time, we cannot use this method. Another solution is to clip the
16
MAPS
erratum
picture to a certain path. This is as if you take a pair of scissors and cut along the path.
We use clipping now:
38
cp := currentpicture;
39
40
41
c2 := a1 intersectionpoint a2;
c4 := o2 + dir alpha *2thickness;
c5 := (xpart o3, ypart lrcorner cp);
42
43
outer := unitcircle scaled (radius+.5thickness);
c1 := (o1--c4) intersectionpoint outer;
44
45
clippath := llcorner cp -- c5 -- o3 -- c2 -- c1 -(xpart c1,ypart urcorner cp) -- ulcorner cp -- cycle ;
46
clip currentpicture to clippath;
What is being done here, is to find a path that can be used for clipping. It has to be as
tight as possible to the symbol in order to avoid unnecessary space. Since the left side
of the horizontal bars is as far as we have drawn yet, we can use the left boundary of the
current picture (for example, llcorner denotes the lower left corner of a picture). c4 is
not used for clipping, it is merely an auxiliary point to find c1.
That’s it! With these few lines you draw the euro-symbol. But what is even more
important, is that you have not merely presented the shape (this could be done with most
drawing programs), you have expresed how to draw it. Contrary to the official version
provided by the european union, there is no part in the construction unclear. We have even
stated (although not derived from the official construction) which parts of the symbol may
be changed at user option (the radius for example). This is a great advantage over using
a simple (or not so simple) drawing program.
The rest of the program (except the endfig and end in the last two lines) is for debugging
purpose. Remember the show_line (and the other variables) you have set either to true
or false in the beginning? The drawoptions statement states a default for all following
draw commands.
47
48
49
50
51
52
53
54
55
56
57
58
if show_lines:
inner := unitcircle scaled (radius-.5thickness);
pickup pencircle scaled 1pt;
drawoptions (withcolor .7white);
draw inner; draw outer;
draw
draw
draw
draw
draw
draw
fi
Najaar 2002
a1 dashed evenly;
origin -- o2 dashed evenly;
a2 dashed evenly;
hbar shifted topbarleft;
hbar shifted bottombarleft;
clippath;
17
erratum
Patrick Gundlach
59
60
61
62
63
64
65
66
67
68
69
if show_dots:
pickup pencircle scaled 2pt;
drawoptions (withcolor .5white);
draw origin;
draw c1; draw c2;
draw c3; draw c4;
draw c5;
draw o1; draw o2;
draw topbarleft;
draw bottombarleft;
fi
70
71
72
73
74
75
76
77
78
79
80
81
82
83
84
if show_labels:
defaultfont:="ptmr8r";
drawoptions (withcolor .5black);
label.bot("origin",origin);
label.bot("bottombarleft",bottombarleft);
label.bot("topbarleft",topbarleft);
label.rt ("c1",c1);
label.rt ("c2",c2);
label.rt ("c3",c3);
label.rt ("c4",c4);
label.bot("c5",c5);
label.bot("o1",o1);
label.bot("o2",o2);
label.rt ("o3",o3);
fi
85
86
87
88
89
if show_lines:
draw bbox currentpicture dashed evenly withcolor .7white ;
fi
endfig;
end;
The endfig is just the opposite of the beginfig. It denotes the end of a picture. The end
instructs MetaPost to stop reading the input file and, in this case quit.
From this point on I will suppose that you have keyed in all the numbered lines into
your editor and saved the file with the name maps-euro.mp. You can run MetaPost by
typing the command
mpost maps-euro
into your favorite shell. MetaPost will generate a file called maps-euro.1. (For a description of the prologues command in line 1 see the MetaPost manual or the LatexGraphics Companion.) This is a regular eps file, except when you have used fonts in
your program. In our case if you turned on the show_labels switch. MetaPost does not
include the fonts in the output file, it merely includes a reference in the eps file. So if
you use a MetaPost picture with fonts, it is best to use it in conjuntion with TEX. The
following simple Latex wrapper will suffice:
\documentclass{article}
\usepackage{graphicx}
\begin{document}
\includegraphics{maps-euro}
\end{document}
18
MAPS
erratum
But this will work only if you have renamed maps-euro.1 to maps-euro.eps.
Using this symbol with ConTEXt is also possible. Just copy the lines starting after
the beginfig and ending just before the endfig into a file, say maps-euro.tex. Enclose
these lines in \startuseMPgraphic{maps-euro} and \stopuseMPgraphic. So you have
(in maps-euro.tex)
\startuseMPgraphic{maps-euro}
def tand expr x = (sind (x) / cosd (x)) enddef;
path unitcircle; unitcircle:=fullcircle scaled 2;
...
if show_lines:
draw bbox currentpicture dashed evenly withcolor .7white ;
fi
\stopuseMPgraphic
Actually you even do not need line 3 and 71, since tand is already defined in metafun
(ConTEXt uses the MetaFun macro package when running MetaPost) and the default
font is the current ConTEXt font. You can include the euro symbol as a picture by using
\useMPgraphic{maps-euro} in your file or you can use it as ‘character’ that can be typeset
in your text. It will be scaled to the current text size. What you have to do is write a small
graphic-wrapper that allows scaling to the demanded height:
\startuniqueMPgraphic{euro}{height}
\includeMPgraphic{maps-euro} ;
currentpicture := currentpicture ysized \MPvar{height} ;
\stopuniqueMPgraphic
Now you can use this intermediate graphic to define a symbol:
\definesymbol[euro][\uniqueMPgraphic{euro}{height=1.5ex}]
To get a ¤ you can use \symbol[euro] in your text.
Najaar 2002
19