1
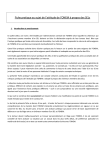
Nicolae Patrascoiu, Aron Poanta, Adrian Tomus, Bogdan Sochirca WSEAS TRANSACTIONS on CIRCUITS and SYSTEMS A software solution for mechanical change measurement through virtual instrumentation NICOLAE PATRASCOIU ARON POANTA ADRIAN TOMUS BOGDAN SOCHIRCA Automatics, Applied Informatics and Computers Engineering University of Petrosani Universitatii 20, 332006 Petrosani ROMANIA [email protected] http://ime.upet.ro/caiac/index.html Abstract: - This paper presents a software solution for implementing a method to measure a displacement and angular speed for a mobile that is moving in a linear or circular direction. In order to achieve this, we determine a function for sensing the direction of movement and also we propose the algorithm through which is made the measurement. In order to implement this we use a instrument built in LabVIEW. By this algorithm is possible to use a data acquisition boards for general use, such as PCI-6024E, which has no inputs for quadrature signals with a quadrature encoder, such as E6A2-CW5C (Omron) or HEDS – 5500 (Avago Technologies) that generates this type of signals. Key-Words: - quadrature encoder, data acquisition board, algorithm, virtual instrument, measurement 1 Introduction 2 Connecting quadrature encoders to data acquisition board Movement is defined as a physical quantity of a mechanical change through which is possible to provide information about position of a material point or mobile that is moving on linear or circular trajectory, against a reference system. Variables derivate from this are: position, distance or proximity. The measure of these quantities is represented by displacement against a reference. In many applications the displacement is considered as a vector, so it is necessary to calculate both size and direction for this variable. Usual procedure for calculating the size of the displacement is to use an incremental sensor that generates a pulse train so by counting these pulses a number that represent the size of the displacement is generated. Considering the physical relationship between displacement and velocity, by determining the size of displacement using an incremental sensor, methods for determining the size of velocity are obtained. Most used methods are based on measurement of elapsed time between successive pulses or counting the number of pulses during the prescribed time. Like in the displacement case, the velocity also should be considered a vector so it is necessary to determine the value and the direction of movement. Same incremental sensor can be used to detect the direction of movement if it provides two trains of pulses shifted by one quarter of the period, in which case it is named quadrature encoder. A quadrature encoder can have up to three channels – channels A, B, and Z. ISSN: 1109-2734 There are data acquisition boards (DAQ) such as the NI 622x, NI 625x, NI 628x (M series devices) or NI USB6211 that have direct support for quadrature encoder measurements so that these devices accept at their input counters signals provided by quadrature encoder. Values counter increases or decreases depending on the relative time of occurrence of the two trains of pulses. So, when channel A (Ch A) leads channel B (Ch B) in a quadrature cycle, the counter increments and when channel B leads channel A in the same quadrature cycle, the counter decrements. The amount of increments and decrements per cycle depends on the type of encoding – X1, X2, or X4. Fig.1 shows a quadrature cycle and the resulting increments and decrements for X1 encoding. When channel A leads channel B, the increment occurs on the rising edge of channel A. When channel B leads channel A, the decrement occurs on the falling edge of channel A [1]. Ch A ... Ch B ... Counter Value 5 6 7 7 6 5 Fig.1. The input signals for data acquisition board With an M-Series board, for these signals, can be used any PFI line for any of the encoder output. To select the desired PFI line it can be use a channel property node. In order to connect signals it can use the configuration presented in Table 1, where ctr0 and ctr1 746 Issue 12, Volume 9, December 2010 Nicolae Patrascoiu, Aron Poanta, Adrian Tomus, Bogdan Sochirca WSEAS TRANSACTIONS on CIRCUITS and SYSTEMS software solution using digital inputs and counters on the data acquisition board. The E series devices, with diagram bloc shown in Fig.3, use the National Instruments DAQ-STC system timing controller for time-related functions. The DAQSTC consists of three timing groups that control analog input, analog output, and general-purpose counter/timer functions. These groups include a total of seven 24-bit and three 16-bit counters and a maximum timing resolution of 50 ns. The DAQ-STC makes possible such applications as buffered pulse generation, equivalent time sampling, and seamless changing of the sampling rate [4]. are the two counters and PFIxx are programmable function terminals configured as inputs by default [1]. Table 1 Counter ctr0 ctr1 Ch A Input PFI8 PFI3 Ch B Input PFI10 PFI11 Z Input PFI9 PFI4 Another way to connect and use quadrature encoders with a data acquisition board is to use data acquisition systems using reconfigurable I/O such as PCI-7831R and PXI-7831R or other systems in this class (R series devices) [2]. These data acquisition boards are based on a reconfigurable FPGA core surrounded by fixed I/O resources for analog and digital input and output. It can configure the behavior of the reconfigurable core to match the requirements of the measurement and control system and it can implement this user-defined behavior as an FPGA application to create an application-specific I/O device. Thus, it is possible to use only two digital inputs, properly configured, to take appropriate signals channel A and channel B from a quadrature encoder. Fig. 2 below shows digital input channels DI0 and DI1 selected for quadrature encoder inputs A and B respectively and also an example of using FPGA functions in LabVIEW to retrieve information from displacement and velocity [3]. Fig. 3. DAQ PCI-6024E Block Diagram If the hardware solution will be chosen, specialized circuits for signal conditioning may be used. For example, the LS7084 quadrature clock converter from LSI Computer Systems, Inc. converts the A and B signals from an encoder into a clock signal and up/down signal that can connect directly to the data acquisition board. The LS7084 includes lowpass filters to prevent miscounts due to noise and jitter. In addition, the LS7804 uses dual one-shots to prevent the miscounting produced by vibration, or dither. In accordance with circuit operation, the CLK output, when in X4 mode, will pulse once for every transition of either the A or B signals [5]. The UP/DOWN output indicates the direction of rotation. It can connect the A and B signals from a quadrature encoder directly to the LS7084, and Fig.2. Using quadrature encoder with FPGA functions Quadrature encoder There are also data acquisition boards which have no specific inputs for quadrature signals or reconfigurable digital inputs like the NI PCI-6024 (E series devices). In this case it is necessary to build a logical system that detects the direction of motion and also increments or decrements a counting value depending on the direction of movement. Such a system can be achieved through hardware structure, but also can be done by a ISSN: 1109-2734 0.1 uF 6 2 4 A X4/X1 VDD DIO 5 B CLK 8 LS7084 1 DIO UP/DOWN RBIAS 7 RE 3 DGND Fig. 4. Encoder connection to DAQ-STC using LS7084 clock converter circuit 747 Issue 12, Volume 9, December 2010 Nicolae Patrascoiu, Aron Poanta, Adrian Tomus, Bogdan Sochirca WSEAS TRANSACTIONS on CIRCUITS and SYSTEMS pulse trains according to the direction of rotation. Following the signals chart presented in Fig. 5, 8 distinct states denoted by Si (i = 0 ... 7) can be identified, corresponding to 8 possible combinations of logic levels for both Channel A and Channel B signals and output signal Counting Selection. Based on this signals chart it is built the states transition graph presented in Fig. 6. The transition graph consists by nodes which connect the CLK and UP/DOWN outputs directly to the SOURCE and UP_DOWN inputs of the DAQ-STC. Fig. 4 illustrates the connections of the encoder to the data acquisition board using a LS7084 quadrature clock converter. 3 Direction of motion detection implemented by software As was mentioned above to determine either linear or angular motion is first necessary to find its direction. After that, we can control the counting direction of the counter. The value of the displacement is determined by counting the train of pulses. To measure the angular displacement and velocity we use PCI-6024E, a data acquisition board from National Instruments that has 8 digital I/O (DIO0 … DIO7) lines (TTL/CMOS) and two 24-bit counter/timers without having the dedicated inputs to connect a quadrature encoder. Other main features of this data acquisition boards are: 16 channels of analog input, two channels of analog output, a 68-pin connector and eight lines of digital I/O. Control of the operation of data acquisition boards is achieved through a program written in LabVIEW graphical programming language and called a virtual instrument. To achieve the determination of displacement direction is necessary, in these conditions, to use two digital inputs to connect the A and B signals carried from the quadrature encoder. Displacement value is obtained by counting the pulses A or B, and its direction is necessary for counting sense determination, otherwise said, for increment or decrement the counter value [6]. To realize the virtual instrument for angular displacement and velocity measurement, based on two trains of pulses shifted by one quarter of period, is necessary to synthesize a control command for counting direction [7], [8]. 00 10 10 S0 S1 0 1 11 00 S7 10 01 0 00 10 S6 11 1 1 S3 S5 01 00 11 0 00 01 10 0 11 S2 01 01 1 S4 00 Fig. 6. Transition graph of states represent the 8 states previously identified and arcs which represent binary combinations of both Channel A and Channel B signals through which is made the transition between states. Each node is characterized by the logical level of the signal Counting Selection and has an arc with logical combination of both Channel A and Channel B signals for which the status for state of respectively node does not change. Based on the transition graph, it is built the primitive matrix that contains on the columns the correlation between combination of the input signals Channel A and Channel B and at least one stable state. The rows contain all possible transitions from one internal stable state. This is accompanied by a full matrix of the output that contains the values of output variable during both states and 3.1 Generating the counting direction control signal For synthesizing the command control signal called Counting Selection is considered a signals chart (Fig.5.) that identifies all the possibilities of combining the two Channel A Channel B Counting Selection S0 S1 S2 S3 S4 S1 S2 S3 S4 S5 S6 S7 S0 S5 S6 S7 S0 S1 S2 S3 S4 S1 S2 S1 S4 S5 S6 S7 S0 S5 S6 S5 S0 S1 S2 S3 S4 Fig. 5. Signals chart that identify the direction of displacement ISSN: 1109-2734 748 Issue 12, Volume 9, December 2010 Nicolae Patrascoiu, Aron Poanta, Adrian Tomus, Bogdan Sochirca WSEAS TRANSACTIONS on CIRCUITS and SYSTEMS transitions. Number of columns is M = 2m where m is the number of input variables and in this case m = 2 then M = 4 columns. Columns are cyclic coded so that from one column to another more than one input variable does not change and therefore Gray code is used. Primitive matrix of states is presented in Fig. 7. States Counting Selection AB 00 01 11 10 S0 0 S0 S5 - S1 S1 S4 - S2 S1 1 S2 - S3 S2 1 S3 S4 S3 1 S4 1 S4 S5 - S1 S5 S0 S5 S6 0 S6 - S5 S6 S7 0 S7 S0 - S7 0 In order to eliminate the hazard, which can occurs due to simultaneous change of more than one input variable during transition between two states, the Gray code is used. The matrix that represents the encoding of reduced states is shown in Fig. 9 To construct the state functions, x1 and x2 it is necessary to build matrices of transition for reduced states and matrix number must be equal to the number of state variables. These matrices are shown in Fig. 10 in which notation ‘x’ means states impossible during operation. State x1 AB x1x2 00 01 11 10 Fig. 7. Primitive matrix of states and output To identify a minimal configuration of the sequentially system a reduced matrix of states is built. The technique used to reduce the number of states from primitive matrix, is based only on the equivalence from the theory of sequential automatic and reduction of state is made through merger or annexation in compliance with specific rules [9], [10]. Applying these rules the reduced matrix of states will be obtain and the corresponding output shown in Fig. 8. States Counting Selection AB 00 01 11 10 S0 S S 0 S0 5 1 S123 S4 S3 S2 S1 1 S4 1 S4 S5 - S1 S567 S0 S5 S6 S7 0 0 1 1 0 1 0 1 1 x 0 x 1 AB x1x2 00 01 11 10 Counting Selection 0 0 0 1 State x2 00 01 11 10 0 1 1 0 0 1 0 0 x 1 x 0 0 1 1 0 Counting Selection 1 1 1 0 0 1 1 0 Fig. 10. State transition matrix for x1 and x2 Applying the method of synthesis of logical functions based on Karnaugh diagrams the logical functions of the state variables x1, x2 respectively it can identified for function of output signal Counting Selection as follows: x 1 = B ⋅ x 1 + A ⋅ B ⋅ x 2 + B ⋅ x 1 ⋅ x 2 + A1 ⋅ x 1 ⋅ x 2 x 2 = x 1 ⋅ x 2 + A1 ⋅ x 1 + B ⋅ x 2 Fig. 8. Reduced matrix of states and output To obtain the state functions of the sequentially system is required to encode the reduced matrix states. We can observe the existence of 4 reduced states so that would be necessary to encrypt them by two state variables i.e. x1 and x2. States Counting AB Selection 00 01 11 10 x1x2 00 0 S0 S5 - S1 01 S4 S3 S2 S1 1 11 1 S4 S5 - S1 10 S0 S5 S6 S7 0 (1) Counting Selection = x 2 From equations (1) it can be seen that the output signal is identical to the state x2, which simplifies implementation with logic gates for the scheme that generates the control signal for counting direction. Based on logical functions (1) a logical diagram of the system can be created shown in Fig.11.. Through this system we can make a selection for direction of counting, Checking the correctness of system operation was achieved by simulation using Multisim® program from National Instruments [11]. Based on simulation results presented in Fig.12 we can observe that selection signal changes logical levels according to the direction of rotation given by the Fig. 9. Encoding reduced states ISSN: 1109-2734 00 01 11 10 749 Issue 12, Volume 9, December 2010 Nicolae Patrascoiu, Aron Poanta, Adrian Tomus, Bogdan Sochirca WSEAS TRANSACTIONS on CIRCUITS and SYSTEMS U11 Channel B NOT U12 NOT U1 AND2 U5 AND3 U4 AND3 U6 AND3 U2 AND2 U8 OR3 U9 OR4 x2 x1 U3 AND2 U7 AND2 Counting Selection U14 NOT U13 NOT Fig.11. Logical diagram of the Counting Selection function be the inputs Channel A and Channel B of the system developed used to determine the direction of C h a n n e l A displacement. The system generates the output signal named Counting Selection. In Fig.13 the structure of this system is shown, built C h a n n e l B with logical functions based on the logical diagram presented in Fig.7. Compound Arithmetic/Logic functions are used, through which, we can select basic arithmetic or logic operations with two or more input C o u n t i n g S e l e c t i o n variables. To observe two signals, two waveform chart indicators are used. For these charts, Property Nodes were created through which it is achieved an offset, Fig.12. Simulation results scaling and history for time axis [12]. sequence of pulse trains Channel A, respectively In Fig.14 is shown the front panel for the two Channel B. situations corresponding to two states of operation for the virtual instrument. We can observe in Fig.14 (two 3.2. Counting Selection function implemented in screen captures) that the direction is determined by the LabVIEW order of movement succession of the two trains of A program developed in LabVIEW is called a virtual pulses, Channel A and Channel B, which means the instrument (VI) and it has two components - the block phase shifts between them. diagram, that represents the program itself and the front panel that is the user interface. Through such a virtual instrument we can control the operation of the data 4. Angular displacement and velocity acquisition board PCI-6024 whose digital inputs DIO0 measurement and DIO1 are used for acquisition of Channel A and Determination of displacement is achieved by Channel B signals from quadrature encoder. counting the increments that corresponds to the slots of In order to implement a virtual instrument, DAQ incremental encoder. They are expressed in degrees and Assistant function is used for creating, editing, and the value of an increments for angular displacement running tasks. NI-DAQmx function represents a data correspond to the relation between the angle at the acquisition driver. Through this function is read an array center of the circle and the number of slots. with eight boolean components corresponding to the Angular velocity measurement is based on counting eight digital inputs of the data acquisition board. pulses during the prescribed time [13], [14]. The basic Through Index Array function are selected components measuring process of pulse during a prescribed time with index 0 and 1 that correspond to digital inputs method is shown in Fig.15. DIO0 respectively DIO1. Thus, the two components will ISSN: 1109-2734 750 Issue 12, Volume 9, December 2010 Nicolae Patrascoiu, Aron Poanta, Adrian Tomus, Bogdan Sochirca WSEAS TRANSACTIONS on CIRCUITS and SYSTEMS Fig.13. Diagram bloc of the virtual instrument Start counting Stop counting Prescribed time Start counting Stop counting Prescribed time Fig. 15. Pulse counting during prescribed time. The duration of a measurement cycle is fixed and set a priori. The speed pulse counter and the timer are both started at a rising edge of the speed pulse. The pulse counter is stopped when the timer runs to the end of the prescribed time. The angular velocity is then derived from the content of the pulse counter and the prescribed time. This method can result in a loss of up to one speed pulse. Because the duration of speed pulse increases with decreasing speed, this method has poor measurement accuracy at low speed. The algorithm used for the measure of the angular displacement and velocity is shown in Fig.16. The implementation of this algorithm, by a virtual instrument, called RPM, that is a SubVI in the main program, is shown in Fig.17. Value of angular velocity expressed in revolutions per minute (RPM) is calculated with relation (2): Fig.14. Front panel corresponding to the displacement in right and left direction ISSN: 1109-2734 751 Issue 12, Volume 9, December 2010 Nicolae Patrascoiu, Aron Poanta, Adrian Tomus, Bogdan Sochirca WSEAS TRANSACTIONS on CIRCUITS and SYSTEMS 1 N ⋅1000 ⋅ 60 RPM = ⋅ n 1 msec pulses / sec pulses / min Getting prescribed time necessary for calculating speed is achieved by using function Tick Count (msec) that returns the timer value, in milliseconds between consecutive loops in the While Loop. (2) 4.1 System Implementation with Virtual Instrument The main program algorithm is shown in Fig.18 and this includes SubVI's SELECT and RPM. We use a While Loop structure that ensures the continuous running of the program until the user stop it through the STOP button. where n represents the number of pulses corresponding to one complete revolution and N represents the counting pulses. Read N Yes N ≥ 107 countup countdown No N =224 - N N=N SELECT Number of pulses = N Angular displacement 3600 a [degree ]= ⋅N n Angular speed 1 N ⋅ 1000 ⋅ 60 RPM = ⋅ n 1 msec pulses/sec pulses/min No left movement RPML= - RPM αL= - α B2 = true RPM Yes right movement RPMR= RPM αR = α Fig.16. Angular displacement and velocity measurement algorithm Fig.18. Main program program algorithm Fig.5. Main algorithm Based on this algorithm the virtual instrument is built, and the block diagram is shown in Fig.19 Acquisition is executed in two sequences and the program begins with reset of the local variable CTR and timing setting that will be used to define the graphical representation of X-signal for the Channel A respectively Channel B graphical indicators. Fig.17. Algorithm implementation by virtual instrumentation ISSN: 1109-2734 752 Issue 12, Volume 9, December 2010 Nicolae Patrascoiu, Aron Poanta, Adrian Tomus, Bogdan Sochirca WSEAS TRANSACTIONS on CIRCUITS and SYSTEMS Fig.19. Diagram bloc of the virtual instrument this pulses number is calculated the displacement and angular speed values [16]. Clockwise motion is considered to be displayed with a positive sign and counterclockwise motion is considered to be displayed with a negative one. This convention requires continuous tracking of the value of the two counters. The continuous tracking is achieved by using local variable CTR whose value is loaded into each of the two counters selected according counting sense through the input parameter initial count of the DAQmx Create Virtual Channel function. Displaying number of pulses and calculating the displacement and angular speed, based on the relation between the direction of motion and sign of these dimensions, is achieved through a Case structure. Selection of the two cases is done through the comparison between the value N that represents the output of the function DAQmx Read and constant 107 (considered to be cover for measurements made under the following conditions: measurement time for one direction of displacement about 33 minutes, n = 200 slots and maximum speed 1500 revolutions per minute.) In Fig.20 we can observe screen captures of the front panel, which is also the user interface, corresponding to two states of operation for the virtual instrument for the two directions of movement. The sign "-" is chosen by convention for the values of movement to the left and The input signals Channel A and Channel B are taken from the incremental sensor by line 1 and line 0 of the digital port 0 port of the data acquisition board PCI – 6024E using DAQ Assistant function. As we mentioned above the direction is selected through Counting Selection signal [15]. Once direction is selected, this it will be displayed on the front panel. The selection signal is also used for selecting the direction of counting (Count Up or Count Down) by applying it to the selection terminal of the Case structure. Through this structure, we can also select one of the counters ctr1 or ctr0 so that the counting upwards is performed by counter ctr0 and counting downwards is performed by counter ctr1. For the two counters ctr1 and ctr0 counting values may increase (Count Up) when their value increases with each pulse applied to the entry CtriSource (i = 0 or 1) in domain [0 ... 224 = 16777216] or may decrease (Count Down) when its value decreases with each pulse applied to the entry CtriSource (i = 0 or 1) in domain [224 = 16777216 ... 0]. If it detects a number N higher than 107, counter ctr0 is considered selected and counting is carried downwards since (224) which represent the maximum counter value. Number of pulses is obtained by the difference between constant 224 and the value of N representing the output of function DAQmx Read (Counter U32 1CH 1Samp). Based on ISSN: 1109-2734 753 Issue 12, Volume 9, December 2010 Nicolae Patrascoiu, Aron Poanta, Adrian Tomus, Bogdan Sochirca WSEAS TRANSACTIONS on CIRCUITS and SYSTEMS Fig.20. User interface of the virtual instrument The sign "-” which appears before the displacement value is obtained by downward counting of pulses and corresponds to the convention mentioned above. Also, in the case of movement to the right by the N = 86 pulses counting is obtained an angular displacement, α: the sign "+” is chosen for the values of movement to the right. Experiments with this virtual instrument, whose results are shown in Fig.20, were performed with an incremental encoder with 4 slots, which means 4 pulses per revolution (n = 4). As we can see in the case of movement to the left by the N = 95 pulses counting is obtained angular displacement, α: α (degree) = − 3600 3600 ⋅N = − ⋅ 95 = −8550 n 4 ISSN: 1109-2734 α (degree) = (3) 3600 3600 ⋅N = ⋅ 86 = 7440 n 4 (4) The sign in this case is "+" and is obtained by upwards counting of pulses and corresponds to movement in the right (the same convention). 754 Issue 12, Volume 9, December 2010 Nicolae Patrascoiu, Aron Poanta, Adrian Tomus, Bogdan Sochirca WSEAS TRANSACTIONS on CIRCUITS and SYSTEMS [7] D.M. Purcaru, E. Niculescu, I. Purcaru, Measuring Method for Computerized Study of Rotary Incremental Encoders, WSEAS Transactions on Electronics, Vol. 3, 2006, pp. 349-355. [8] D. M. Purcaru, E. Niculescu, I. Purcaru, “Experimental Measuring System with Rotary Incremental Encoder” in WSEAS Transactions On Advances In Engineering Education, Volume 4, September 2007, pp.180-186 [9] Carroll J., Long D. Theory of Finite Automata. Prentice Hall, New Jersey, 1989 [10] Poanta A., Patrascoiu N. Circuite si echipamenete electronice in industrie. Ed. Didactica si Pedagogica, Bucuresti, 1997 [11] * * *. Multisim. User Manual. National Instruments Corporation. Austin, Texas, 2008. [12] Patrascoiu N. Sisteme de achizitie si prelucrare a datelor. Instrumentatie Virtuala. Ed. Didactica si Pedagogica, Bucuresti, 2004 [13] Yuhua L., Fengshou G. and others. The measurement of instantaneous angular speed. Mechanical Systems and Signal Processing 19 (2005) 786–805 [14] H. K. Jafari, Design and Implementation of DC Motor Speed Controller Using Fuzzy-Adaptive Controllers. WSEAS Transactions on Circuits and Systems. Vol. 7, April 2008. pp. 203-212 [15] Patrascoiu N, Poanta A. Tomus A, Sochirca B. Detection of motion direction implemented by virtual instrumentation. Recent Advanced in Automation & Information WSEAS Proceeding (ICAI’10), (72-75) [16] Patrascoiu N, Poanta A. Tomus A, Sochirca B. A software solution for displacement and angular speed measurement through virtual instrumentation. Applied Computing Conference WSEAS Proceeding (ACC’10), (11-15) [17] A. Valachi, M. Timis, M. Danubianu, Some Contributions to Synthesis and Implementation of Multifunctional Registers. 2nd WSEAS International Conference on Multivariate Analysis and its Application in Science and Engineering. pp. 146-149 5 Conclusion Using of this virtual instrument has a very high interest for data acquisition systems that do not accept at their counters signals provided by quadrature encoder, and these systems are used to measure displacements or angular velocities. Testing the functionality of the system was realized for direction displayed and also for measuring displacements and angular velocities. Tests were performed using quadrature encoders with 4, 200 (E6A2-CW5C) respectively 500 (HEDS – 5500) pulses per revolution for a wide range of speeds, connected to digital inputs of the PCI – 6024E data acquisition board, from which were used the two counters ctr1 and ctr0. The solution presented can be applied to any data acquisition boards which no accept to their input signals in quadrature but have a FPGAs chip embedded that make possible to implement the logic functions (1) and the algorithms shown in Fig.16 and Fig.18 Also, the same software solution can be implemented in an 8-bit microcontroller even making it possible to connect directly a quadrature encoder for local control of processes where there are rotation or translation movements. References: [1] * * *, M Series User Manual, National Instruments Corporation, 371022F-01, april 2006 [2] * * *, Reconfigurable I/O Devices for PCI/PXI/CompactPCI Bus Computers, National Instruments Corporation, 370489B-01, april 2004 [3] * * *, Quadrature Encoder Velocity and Acceleration Estimation with CompactRIO and LabVIEW FPGA, National Instruments Corporation, http://zone.ni.com/devzone/cda/tut/p/id/3921, may 2010 [4] * * *. 6023E/6024E/6025E User Manual. National Instruments Corporation. Austin, Texas, 2000. [5] * * *. LS7083/7084 Quadrature Clock Converter. Datasheet LSI Computer Systems, Inc., October 2000 [6] Webster.G.J. The measurement, Instrumentation and Sensors Handbook. CRC Press LLC, 2000 ISSN: 1109-2734 755 Issue 12, Volume 9, December 2010