1
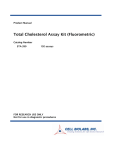
PROTOCOL
Using circular dichroism collected as a function of
temperature to determine the thermodynamics of
protein unfolding and binding interactions
Norma J Greenfield
Published online 29 December 2006; doi:10.1038/nprot.2006.204
Circular dichroism (CD) is an excellent spectroscopic technique for following the unfolding and folding of proteins as a function
of temperature. One of its principal applications is to determine the effects of mutations and ligands on protein and polypeptide
stability. If the change in CD as a function of temperature is reversible, analysis of the data may be used to determined the van’t Hoff
enthalpy and entropy of unfolding, the midpoint of the unfolding transition and the free energy of unfolding. Binding constants of
protein-protein and protein-ligand interactions may also be estimated from the unfolding curves. Analysis of CD spectra obtained as
a function of temperature is also useful to determine whether a protein has unfolding intermediates. Measurement of the spectra of
five folded proteins and their unfolding curves at a single wavelength requires B8 h.
INTRODUCTION
There are numerous reviews on the theory and use of CD1–7 as well
as a website with animated graphics http://www.enzim.hu/~szia/
cddemo/, which illustrates the production of circularly polarized
light, the CD of optically active molecules, and how passing planepolarized light through an asymmetric molecule results in the
production of elliptically polarized light. An introduction to CD
and a description of how to estimate the secondary structure of a
protein from its CD spectrum are in the first protocol in this series8.
Briefly, CD is the difference between the absorption of left-handed
(eR) and right-handed (eL) circularly polarized light. CD is
reported either in units of De, the difference in absorbance of eR
and eL by an asymmetric molecule, or in degrees ellipticity, which is
defined as the angle whose tangent is the ratio of the minor to the
major axis of the ellipse [y], the molar ellipticity in deg cm2 dmol–1 ¼
3,298DE. For illustrations of the phenomena of CD see Beychok2.
When proteins are folded they often have highly asymmetric
secondary structural elements, such as a-helices and b-pleated
sheets (b-helices), which have characteristic CD spectra (Fig. 1).
The spectra of some highly helical model proteins are shown in
Figure 2. When proteins unfold they lose these highly ordered
structures, and the CD bands change. Some proteins tend to unfold
completely and their unfolded spectrum resembles that of a mixture
of short polypeptides (e.g., see the spectrum of unfolded collagen,
Fig. 1). Other proteins and polypeptides only partially unfold and
may have considerable residual a-helical content in a ‘moltenglobule state’9–13. The changes in CD as a function of temperature,
at characteristic wavelengths, can be used to determine the thermodynamics of unfolding (or more precisely change of state), that is, the
van’t Hoff enthalpy (DH) and entropy (DS) of unfolding, the
midpoint of the unfolding transition (TM) and the free energy
(DG) of on folding. If the apparent TM of unfolding is changed as
a function of protein concentration or perturbed by changes in salt
or pH, the heat capacity change of unfolding (DCp) can also be
estimated from CD data. In addition, analysis of CD spectra obtained
as a function of temperature may also be useful in determining
whether a protein has unfolding or folding intermediates.
The thermodynamics of protein unfolding can be investigated by
either monitoring the ellipticity at a single wavelength or collecting
complete spectra as a function of temperature. Two additional
protocols on the use of CD to study protein folding cover the
determination of the free energy of folding and binding constants
from CD data collected as a function of denaturants, osmolytes or
ligands14 and determination of the kinetics of folding from CD data
collected as a function of time15.
Characterization of unfolding by following the change in
ellipticity at a single wavelength as a function of temperature.
When the CD of a protein and polypeptide or other asymmetric
polymer such as a polynucleotide or polysaccharide changes as a
80
60
[θ] × 10–3 deg cm2 dmol–1
© 2006 Nature Publishing Group http://www.nature.com/natureprotocols
Department of Neuroscience and Cell Biology, Robert Wood Johnson Medical School, Piscataway, New Jersey 08854-5635, USA. Correspondence should be addressed to
N.J.G. ([email protected]).
40
1
α-helix
2
antiparallel β
3
extended
4
collagen (triple helix)
5
collagen (denatured)
20
0
5
–20
2
1
–40 3
4
–60
190
200
210
220
230
240
250
Wavelength, nm
Figure 1 | CD spectra of polypeptides and proteins with some representative
secondary structures. CD spectra of poly-L-lysine in the (1) a-helical (black)
and (2) antiparallel b-sheet (red) conformations at pH 11.1, and (3) extended
conformation at pH 5.7 (green)44, and placental collagen in its (4) native
triple-helical (blue) and (5) denatured (cyan) forms45. Note that the extended
conformation of poly-L-lysine was original described as a ‘‘random coil’’, but
its spectrum is similar to the conformation of poly-L-proline II46,47, which
forms an extended left-handed helix.
NATURE PROTOCOLS | VOL.1 NO.6 | 2006 | 2527
a
300
1 CTD
2 NTD
200
Millidegrees
Figure 2 | Spectra of unbound tropomyosin and troponin model proteins and
protein-protein complexes. (a) Raw data. (b) Mean residue ellipticity. CTD is a
peptide containing residues 251–284 of rat striated tropomyosin with GCG at
the N terminus. The peptides are cross-linked by a disulfide bond40. NTD is a
model protein of the N-terminal domain of tropomyosin containing residues
1–14 of rat striated a-tropomyosin and the last 18 residues of the yeast
transcription factor, GCN4. The peptide is N-acetylated39,43. TNT70–170I79N is
residues 70–170 of human cardiac troponin with the mutation I79N and
glycine at the N terminus43. The protein concentrations were all 17.5 mM in
10 mM potassium phosphate, pH 6.5. Data were collected in cells with 1-mm
path lengths.
100
0
–100
–200
200
220
240
© 2006 Nature Publishing Group http://www.nature.com/natureprotocols
Wavelength, nm
function of temperature, the change can be used to analyze the
thermodynamics of unfolding or folding. In the simplest case a
molecule undergoes an unfolding transition between two states:
folded, F, and unfolded, U. At any temperature, T, the constant of
folding, K, is:
K ¼ ½F=½U
ð1Þ
where [F] and [U] are the concentrations of the folded and
unfolded forms, respectively.
The free energy of folding is:
DG ¼ RTlnK
ð2Þ
where R is the gas constant (1.98 cal mol–1) and T is the absolute
temperature (Kelvin).
The fraction folded at any temperature is a.
a ¼ ½F=ð½F+½UÞ
ð3Þ
a ¼ ðyt yU Þ=ðyF yU Þ
ð4Þ
where yt is the observed ellipticity at any temperature, yF is the
ellipticity of the fully folded form and yU is the ellipticity of the
unfolded form.
To fit the change of CD at a single wavelength as a function of
temperature, T (Kelvin), one uses the Gibbs-Helmholtz equation
that describes the folding as a function of temperature. If one
is following the unfolding of a monomer, the following equations
(7–10) are fitted:
DG ¼ DHð1 T=TM Þ DCp ððTM TÞ+TlnðT=TM ÞÞ
ð5Þ
K ¼ expðDG=ðRTÞÞ
ð6Þ
a ¼ K=ð1+KÞ
ð7Þ
½yt ¼ að½yF ½yU Þ+½yU
ð8Þ
TM is the temperature at which a ¼ 0.5, and DCp is the change in
heat capacity going from the folded to the unfolded state. DCp is
usually set at 0 for the initial calculations of the thermodynamics of
folding of a monomeric protein.
Initial values of DH, TM, [y]F and [y]U are estimated and used as
initial parameters for nonlinear least squares fitting routines. The
values giving the best fit to the raw data are found using the fitting
procedures found in the commercial curve fitting programs
described in MATERIALS. One can fit the unfolding of homoand heterodimers and trimers using similar equations16,17. If a
protein exhibits multiple unfolding transitions, CD data can be
fitted by the sum of multiple transitions.
2528 | VOL.1 NO.6 | 2006 | NATURE PROTOCOLS
260
b
80
[θ] × 10–3 deg cm2 dmol–1
PROTOCOL
60
40
20
0
–20
–40
200
220
240
260
Wavelength, nm
Occasionally there are regions in the curves of ellipticity as a
function of temperature, preceding or following the unfolding
transitions, where the ellipticity shows a change that is almost
linear as a function of temperature. One can add linear18 or
parabolic19 corrections to the equations to subtract these contributions. The entropy of unfolding, DS, at the temperature at which
K ¼ 1, can be calculated using the relationship: DG ¼ DH – TDS.
Equations for fitting unfolding/folding curves in SigmaPlot
format are available at http://www2.umdnj.edu/cdrwjweb and in
Supplementary Equations.
DCp is difficult to estimate from CD measurements for a
monomer, because there is insufficient information in a single
unfolding curve, obtained under one set of conditions, to estimate
this parameter19. For multimers DCp can be determined from
global analysis of unfolding as a function of both concentration and
temperature20–24. If the apparent TM of unfolding (a ¼ 0.5) of a
monomer changes as a function of pH or other perturbant, the
DCp of unfolding can be evaluated from the slope of the plot of the
enthalpy at the apparent TM, obtained under each condition, as a
function of the TM (Kelvin). This value can then be used as fixed
parameter for determining the enthalpy and TM of unfolding using
equations 5–8.
Direct fitting of unfolding curves is easy for monomers, dimers
and trimers (Fig. 3a), but it is difficult for higher order multimers.
An alternative method is to determine the midpoints of the
unfolding curves by taking derivatives of the spectra (Fig. 3b)
and to determine the enthalpy of unfolding using the van’t Hoff
equation (Fig. 3c). At two different temperatures, T1 and T2:
lnðK2 =K1 Þ ¼ DH=Rð1=T1 1=T2 Þ
ð9Þ
where K2 and K1 are the folding constants at T2 and T1 ,
respectively.
To determine the enthalpy of unfolding from van’t Hoff analysis,
the natural logarithm (ln) of the folding constant K is plotted as a
function of 1/T, where T is the absolute temperature (Kelvin). The
data are truncated to the region around the region giving a linear
curve with the highest slope. The enthalpy of unfolding equals
the slope of the line times the gas constant, R, which is equal to
1.98 cal mol–1.
Characterizing the unfolding of a protein by examining spectra
as a function of temperature. The information about the unfolding pathway is greatly increased by collecting full spectra as a
function of temperature. The set of spectra can then be deconvoluted using either the convex constraint algorithm (CCA)25–27 or
singular value decomposition (SVD)28–31 to obtain information
about the number of folded states contributing to the set of spectra.
The change in the fraction of each basis spectrum determined using
PROTOCOL
© 2006 Nature Publishing Group http://www.nature.com/natureprotocols
the CCA, contributing to the total CD as a function of temperature,
may also be used to estimate the thermodynamics of unfolding.
Comparison with related methods. When the unfolding of a
protein is reversible and two-state and there is only a single
unfolding transition, the thermodynamic parameters evaluated
by CD are almost identical to those that can be estimated using
scanning calorimetry32,33. When there are multiple unfolding
transitions, CD and scanning calorimetry will usually give the
same total enthalpy of unfolding, but the value of the enthalpy of
the individual transitions may vary because of the difficulty of
separating overlapping transitions. For an example of the unfolding
of tropomyosin and tropomyosin mutants, which have closely
spaced multiple reversible unfolding transitions, see the work of
Singh and Hitchcock-DeGregori34.
CD and other spectroscopic measurements, such as measuring
changes in absorption and fluorescence, will give similar results if
the unfolding of the protein or polypeptide represents a two-state
transition between totally folded and unfolded forms. Different
methods may give varying results if there are multiple transitions.
For example, if a region with aromatic chromophores loses its
tertiary structure packing before the molecule loses all of its
secondary structure, examining the unfolding by looking at the
CD of the aromatic region, or the fluorescence or aromatic groups,
will give thermodynamic parameters different from those obtained
by examining the CD of backbone a-helices by following the
unfolding at 222 nm20,35. For the most accurate determination of
protein unfolding thermodynamics and pathways, it is always
preferable to use multiple methods.
Applications. Measuring CD as a function of temperature can be
used to determine: the effects of mutations on protein stability, as
well as the binding constants of interacting proteins and proteinligand complexes.
CD can be used to determine whether the TM or slope of a
transition changes when mutations are present. If the unfolding is
reversible, true thermodynamic parameters can be obtained. Even if
the unfolding is irreversible, because the protein aggregates at high
temperature, the method can still give information about relative
stability, especially if the same apparent unfolding parameters are
obtained at different rates of heating, showing that kinetics of
aggregation are not perturbing the results.
If two proteins bind to each other only when they are folded, and
the protein complex unfolds cooperatively and reversibly, one can use
the change in stability upon binding to measure the binding constant.
In the simplest case both proteins (e.g., X and Y) are monomers, [XF]
and [YF] are the concentrations of folded X and Yand [XU] and [YU]
are the concentrations of unfolded X and Y, respectively.
1. The constant of folding of protein X is:
ð10Þ
kFX ¼ ½XF =½XU 2. The constant of folding of protein Y is:
kFY ¼ ½YF =½YU ð11Þ
3. The constant of folding of the dimer is:
kFXY ¼ ½XYF =½XU ½YU ð12Þ
4. The association constant:
KA ¼ ½XYF =½XF ½YF ð13Þ
5. Making the substitutions
KA ¼ kFXY =kFX kFY
ð14Þ
To determine the association constant:
1. Determine the DH and DS of folding of the individual
monomers X and Y and the stability of the dimer XY by following
their ellipticity as a function of temperature or denaturant.
2. Calculate the free energy of folding at any temperature using:
DG ¼ DH TDS
ð15Þ
3. Determine the folding constant from the relationship:
ð16Þ
KF ¼ expðDG=RTÞ
4. Divide the KF of folding of the dimer by the KF values of
folding of the two monomers to obtain the binding constant for the
dimer formation.
If a ligand binds to a protein only when it is folded, the increase
in stability of the complex as compared with the free protein can be
used to estimate the binding constant. If the changes in enthalpy of
folding upon binding are small, the binding constant can be
evaluated using the equation:
DTM ¼ ðTT0 R=DHÞ ln ð1+K½LÞ
ð17Þ
where DTM is the change in the midpoint of the thermal denaturation curve, T and T0 are the TM values in the present and absence of
ligand, DH is the enthalpy of unfolding of the protein in the
presence of the ligand, K is the equilibrium for the binding of the
ligand to the folded protein, [L] is the free concentration of ligand
and R is the gas constant18,36,37.
Experimental design. It is difficult to give a single protocol for
collecting data as a function of temperature, because the various
CD instruments use different methods of controlling temperature.
In some instruments temperature change is steady as a function of
time (this is called a temperature ramp). With other instruments
one sets the desired temperature increment and equilibration time
at each point. Some manufacturers have sample compartments
where measurements can be made on multiple samples at each
temperature. The machines also all have different methods of
programming the collection of data. Some allow one to make
macros to collect spectra as a function of temperatures. Consult the
manufacturer for details of individual instruments. The steps
described in the procedure for collecting data at a single wavelength, and for collecting spectra as a function of wavelength have
been used for data collection on Aviv Model 62D, Aviv Model 202
and Aviv Model 215 instruments equipped with a temperatureregulated five-compartment cell holder.
Preliminary experiments. Many proteins equilibrate slowly. For
accurate measurements of thermodynamic parameters, it is important to set the equilibration time long enough to allow full equilibration. Preliminary experiments should be performed to determine
how much time is required for a protein to fold and unfold at
selected temperatures and to insure that the protein will be fully
unfolded at the highest temperature studied. It is suggested to take
preliminary spectra at 5, 10, 25, 37, 50 and 70 deg and then take
spectra at 50, 37, 25 and 10 deg to determine whether the protein
refolds8. CD and all other spectroscopic techniques can only be used
to obtain true thermodynamic properties if the unfolding and
NATURE PROTOCOLS | VOL.1 NO.6 | 2006 | 2529
PROTOCOL
folding of a protein is reversible and curves obtained when the
sample is heated (e.g., from 10 to 70 1C) and cooled (from 70 to
10 1C) are identical. Collagen and related proteins fold and unfold
very slowly, and for accurate determination of the enthalpy and TM
values of folding, unfolding experiments are set to run overnight or
even longer periods of time.
© 2006 Nature Publishing Group http://www.nature.com/natureprotocols
MATERIALS
REAGENT SETUP
Five to six protein samples The number depends on multi-cell holder rotor
capacity. For example, one could use a single protein at different or replicate
concentrations; individual proteins containing different mutations; individual
proteins that interact and mixtures of interacting proteins; free proteins and
proteins with various ligands added; the same protein concentration dissolved in
buffers with different pH values. The preparations of protein samples, determination of protein concentration and buffers suitable for CD have been
discussed8. The samples should be preincubated at the desired starting temperature to ascertain that the proteins are fully folded. Most globular proteins
that are active at physiological temperature will fold fully at 25 1C within
minutes, but collagen-like triple helices can take several days to fold. If the study
involves short protein fragments or peptides about which little is known, they
should be folded on ice overnight. Folding conditions have been described in
greater detail elsewhere8.
To retard evaporation, melts can be done in cuvettes with Teflon stoppers.
Alternatively, a drop of mineral oil may be carefully placed on top of the
protein solutions to prevent evaporation.
EQUIPMENT
Sources of CD instruments and cuvettes have been described elsewhere8.
EQUIPMENT SETUP
Procedures for starting CD instruments have been detailed elsewhere8. Make
sure that the instrument is flushed with nitrogen before firing the lamp and
that circulating water baths (if needed for cooling the lamp or acting as a
heat trap for the temperature controllers) are activated before the CD software
is started.
Software A commercial graphic program that allows user-defined nonlinear
least squares curve fitting. Most of the commonly available commercial
programs use the Levenberg-Marquardt algorithm38 for fitting curves to nonlinear equations. Graphic packages include: GraphPad, http://www.graphpad.
com/; Psi-Plot, http://www.polysoftware.com/aboutpsi.htm; Origin, http://
www.originlab.com; and SigmaPlot, http://www.systat.com. Some of
these programs (e.g., SigmaPlot) allow global fits to multiple parameters.
Noncommercial software is available to analyze the spectra of proteins
obtained as a function of temperature using the CCA http://www2.chem.elte.
hu/protein/programs/cca/ or http://www2.umdnj.edu/cdrwjweb/. Commercial
software that can deconvolute CD spectra using SVD is also available from
some CD manufacturers (e.g., Olis and Applied Photophysics) and is available
as a stand-alone application from Olis (http://www.olisweb.com/software/
svd.php).
PROCEDURE
Data collection at a single wavelength in one direction TIMING 7–8 h for collecting initial baselines and spectra and
performing an unfolding study in one direction, 12–14 h for unfolding and refolding.
1| Set the desired temperature to start the measurements (0). In this and the following steps, suggested values are in
parentheses.
2| Take initial spectra of the protein samples to determine the wavelengths that have maximal ellipticity. For example,
proteins with high helical content have peaks at 222, 208 and 193 nm. Unfolding studies are usually performed at the 222-nm
peak, because data at higher wavelengths usually have lower absorption and higher signal-to-noise ratio.
? TROUBLESHOOTING
3| Set the desired wavelength (e.g., 222 nm for proteins with a high content of a-helices, 218 nm for proteins with a high
content of b-structure, or 225 or 200 nm for collagen-like peptides).
? TROUBLESHOOTING
4| Set the sample changer or rotor for the desired number of samples (5).
5| Set the desired temperature range (0 1C to 70 1C). To take spectra of the unfolded proteins after the melt, set the temperature to remain at the final temperature after the experiment is completed. If an unknown protein is under study and the protein
is not fully unfolded by 70 1C, one can collect a second set of data between 70 1C and 90 1C and combine the data sets. To
check whether unfolding is reversible, set the machine to collect the reverse scan from 70 deg to 0 deg using a negative increment at the completion of the run.
m CRITICAL STEP Do not set the upper temperature 490 1C, because prolonged use at high temperature may damage the
temperature controller.
6| Set the desired temperature interval (0.2 1C).
7| Set the equilibration time at each point (0.2 min).
8| Set the temperature tolerance (0.15 1C).
9| Set the number of seconds to collect data at each point (5 s) and the time constant for machine response (100 ms).
10| Set the rate of heating (5 deg min1).
11| Start the data collection.
12| Periodically examine the progress of unfolding by looking at the unfolding curves.
? TROUBLESHOOTING
2530 | VOL.1 NO.6 | 2006 | NATURE PROTOCOLS
PROTOCOL
13| Save the data in columns of ellipticity (y) versus temperature (x).
m CRITICAL STEP Make sure the data are saved on the hard drive or other permanent medium, because data will be lost if the
machine is turned off or the power fails before the data are saved.
’ PAUSE POINT The data collection can be ended here. If the machine has not been automatically set to return to the initial
temperature, make sure to cool the machine before removing the samples to prevent burns and to allow removal of cell stoppers,
which tend to stick at elevated temperatures because of the difference in the expansion of the Teflon stoppers and quartz cell.
If the stoppers stick in the cuvettes, plunging them upside down in an ice bath will usually loosen them
© 2006 Nature Publishing Group http://www.nature.com/natureprotocols
Data analysis TIMING 8 h
14| Import the data into a Graphics program with columns of ellipticity versus temperature, and plot the curves.
15| If data has been collected as a function of both heating and cooling, plot the data sets on the same graph and see whether
they overlay one another.
? TROUBLESHOOTING
16| If the data show only one folding transition, initially fit the data using curves describing the unfolding of a monomer
using equations 7–10 described earlier. Set the initial values for the ellipticity of the folded and unfolded proteins by examining
the graphs. Estimate the TM from the midpoint between the starting and ending ellipticity values. Initially set the estimated
enthalpy to between –20,000 and –50,000 cal mol–1 and the value of DCp to 0. If there are multiple transitions the data can be
initially fitted by the sum of two or more transitions. The number of transitions and their midpoints can be estimated by taking
the first derivative of the folding curve. The maxima will be at the midpoints of the folding transitions.
17| Run the curve fitting routine, and plot the fitted curve to the raw data. If the agreement is good you are finished. If the
fits are good around the midpoint of the transition but deviate at the ends, include linear corrections for pre- and post-transitions (see the sample fitting curves in Supplementary Equations).
? TROUBLESHOOTING
18| If the same protein gives different calculated values for the TM that increase as a function of concentration, try fitting the
data by equations that assume that the protein is forming dimers or trimers and evaluate the TM at K ¼ 1 (see Supplementary
Equations). If the correct oligomerization state is assumed, the calculated TM at K ¼ 1 should be independent of protein
concentration.
? TROUBLESHOOTING
19| If the protein or protein complex is a dimer or trimer, one can fit the data globally to determine the TM at K ¼ 1, and DH
and DCp of folding by performing Option A or Option B. To follow Option A, convert the data to mean residue ellipticity8, and
fit the data to folding equations using three variables, wherein the independent variables are temperature and protein concentration and the dependent variable is mean residue ellipticity (e.g., column 1, temperature; column 2, protein concentration;
column 3, mean residue ellipticity). Equations for performing global fits are in Supplementary Equations. To follow Option B,
fit the curves collected at each concentration individually using the equations for unfolding of a monomer with corrections for
any pre- or post-transition linear changes in ellipticity. Use the parameters determined for the ellipticities of the fully folded
and unfolded proteins and any linear changes as a function of temperature to convert the data to a scale of 1 to 0, where 1 is
the fully folded protein and 0 is the fully unfolded protein. Then fit the data globally, where the independent variables are
temperature and protein concentration and the dependent variable is the fraction folded.
Collecting spectra as a function of temperature TIMING 6–24 h
20| Program the CD instrument to collect spectra as a function of temperature if the machine has a macro writing program
using the following parameters. If the machine does not run macros, set the same parameters to collect the spectra, but you
will have to change the temperature manually.
21| Set the number of sample compartments used (5).
22| Set the equilibration time at each temperature (2–5 min).
23| Set starting temperature (0 1C).
24| Set the temperature interval (5 deg) and number of repeat increments, or set each temperature increment manually
to take points more closely spaced where the ellipticity changes rapidly as a function of temperature (determined from
Steps 12–14).
25| Set the wavelength range for data collection and the number of repeats8.
NATURE PROTOCOLS | VOL.1 NO.6 | 2006 | 2531
PROTOCOL
26| Save the macro, for example, with the name ‘tempscan’.
27| Run the macro ‘tempscan’ or manually collect data at each desired temperature.
? TROUBLESHOOTING
28| Save the data.
29| Import the data into a graphics program or spreadsheet. For use with the CCA the first column should be the wavelengths,
and the following columns should have the ellipticity values collected at each temperature. Save the file in a comma-delineated
format with a name that is no longer than eight characters with an extension of no more than three (e.g., ‘data.dat’ for analyzing the data using the CCA algorithm. Make a different set for each protein sample.
© 2006 Nature Publishing Group http://www.nature.com/natureprotocols
30| To combine data sets collected using different protein concentrations, convert the data to mean residue ellipticity8.
31| Analyze the data using the CCA or SVD to determine the number of basis sets need to reconstruct the data. Detailed instructions for use of the CCA program are in Supplementary Tutorial. If only two basis sets are needed to reconstruct the entire set
the protein does not have a folding intermediate that is detectable by CD.
? TROUBLESHOOTING
? TROUBLESHOOTING
Troubleshooting advice can be found in Table 1.
TABLE 1 | Troubleshooting table.
Step
2
Problem
The CD spectra have very low ellipticity
Solution
Check the protein concentration8
3
The signal-to-noise ratio is very low
Try opening the slit width to 2 nm, because the exact wavelength is
not critical. Try increasing the time of data collection. Signal-tonoise ratio increases as the square root of the signal averaging time
12
The samples precipitate when heated
Try using a different buffer or include stabilizing agents such as low
concentrations of glycerol
15
The samples refold to give the same spectra as the starting
material, but the unfolding and refolding curves are displaced
from each other
The samples are not at thermal equilibrium during the measurements.
Try increasing the equilibration time
17
The curve of ellipticity as a function of temperature appears to
have a typical sigmoidal shape, but none of the folding
equations fit the data and the error of the fit is large
Make sure that the initial parameters are close to the actual values of
the data and that the correct units are used for the initial estimates
of the ellipticity of the folded and unfolded protein (e.g., millidegrees or mean residue ellipticity). Make sure the initial estimate of
the TM of folding is close to the midpoint of the transition. If this
does not work, try increasing or decreasing the initial estimates of
the enthalpy of folding
18
The calculated TM values for different concentrations of
protein are not close to each other, even when the data are
modeled to fit the dissociation of dimers or trimers
Determine the oligomerization state of the protein using independent methods such as gel filtration or ultracentrifugation, and use
the van’t Hoff equation to determine the thermodynamic parameters
27
The macro does not work properly
Check the user’s manual to make sure you have programmed the
machine properly. Usually machines will have sample macros. Try to
program a single temperature step with using only one or two
samples
31
When the spectra are deconvoluted using the CCA some basis
curves only contribute to a spectrum obtained at a single
temperature
If a spectrum is noisy and has outlying points, the CCA will identify
the spectrum as a unique basis set. Try removing the spectrum from
the data set
When the spectra are analyzed using the CCA, some of the
curves have very similar shapes but are displaced from each
other
The CD spectra of the cells may change as a function of temperature,
leading to shifts in the baseline. Obtain spectra of the cuvettes filled
with water as a function of temperature, and correct the individual
data set for the contribution of the cells
If the spectra of the folded and unfolded proteins have maxima
(nodes) that are mutually identical, SVD of the solution may be
‘‘singular’’ and only one spectrum will be deconvoluted.
When the data are deconvoluted using SVD, although it is
clear that there are more than two states, only one principal
component is resolved
2532 | VOL.1 NO.6 | 2006 | NATURE PROTOCOLS
PROTOCOL
b
0
Ln (K)
Millidegrees
4
30
3
20
2
1 CTD
2 NTD
3 TnT(I79N)70–170
Mix NTD + CTD
Mix NTD + CTD + TnT(I79N)70–170
Add curves 1 and 2
Add curves 1, 2 and 3
–40
–60
–80
10
1
–100
–120
–140
© 2006 Nature Publishing Group http://www.nature.com/natureprotocols
c
40
–20
∆θ/∆T
a
0 10 20 30 40 50 60 70
Temperature, °C
0
0
–10
–1
3.10 3.20 3.30 3.40 3.50
1/T (Kelvin)
0 10 20 30 40 50 60 70
Temperature, °C
Figure 3 | Typical curves of ellipticity as a function of temperature used to determine the thermodynamics of folding. In all the panels the proteins, symbols
and conditions are the same as Figure 2. (a) Changes in ellipticity of tropomyosin and troponin model proteins and protein complexes as a function of
temperature. The raw data are fitted with equations for the unfolding of monomers (CTD and TnT70–170I79N), a dimer (NTD), a heterotrimer (NTD-CTD complex)
and a generic hyperbolic curve (CTD-NTD-TnT70–170I79N complex), respectively. (b) Van’t Hoff plots of the data in a. (c) The first derivatives of the curves in a.
The maxima correspond to the midpoints (TM values) of the unfolding and folding curves.
ANTICIPATED RESULTS
Melts at a single wavelength
Analysis of CD spectra of proteins as a function of temperature should allow determination of the thermodynamics of folding
and estimation of the binding constants of interacting proteins. Determination of the enthalpy of folding/unfolding using direct
fitting or van’t Hoff plots should give results within experimental error of one another, and the TM values of folding determined
from the direct fits and from the first derivative of the melts should be similar.
Figures 2 and 3 illustrate the use of CD to examine the interaction of model proteins containing the C- and N-terminal
domains (CTD and NTD, respectively) of tropomyosin, an actin-binding protein, with a fragment of the tropomyosin-binding
domain of troponin (TnT70–170), a protein that regulates contraction of striated muscles in response to calcium39–43. The NTD
and CTD model proteins form a binary complex, which binds the troponin T fragment to form a ternary complex. The troponin
fragment contains a mutation, I27N, found to cause cardiac myopathy. Figure 2a and b show the spectra of the model proteins
and protein complexes in millidegrees and in mean residue ellipticity, respectively. All are highly helical and have large ellipticities at 222 nm, which can be used to follow unfolding.
Figure 3 shows how changes in the ellipticity of the model peptides and peptide complexes as a function of temperature can
be used to derive the thermodynamic parameters of unfolding and the dissociation constants of protein-protein complexes. The
CTD model peptide is a two-chain coiled coil in which the peptide chains are linked by a disulfide cross-bridge. It unfolds as a
monomer. NTD is a two-chain coiled coil that unfolds as a dimer. The protein fragment TnT(I79N)70–170 is a monomer. Also
shown are a 1:1 complex of the NTD and CTD model proteins, which unfolds as a heterotrimer, and a 1:1:1 complex of the NTD,
CTD and TnT model proteins, which unfolds as a tetramer. Figure 3a shows the change in ellipticity of the five samples as a
function of temperature. When the NTD and CTD model proteins are mixed there is an increase in ellipticity and stability as
compared with the addition of the individual unfolding curves, showing that they form a complex. When TnT(I79N)70–170 is
added there is an even greater increase in total ellipticity and large increase in TM as compared with the unmixed components.
The data in Figure 3a for the CTD, NTD, TnT(I79N)70–170 fragments and the NTD-CTD and NTD-CTD-TnT(I79N)70–170 complexes
are fitted by equations for the unfolding of a monomer, dimer, monomer, heterotrimer and generic curve, respectively.
Figure 3b shows the van’t Hoff plots of the data in Figure 3a. Both methods give almost identical estimates of the enthalpy
of unfolding (Table 2). Figure 3c shows the first derivative of the data in Figure 3a. The TM values determined from the
maxima are also close to those determined by direct fitting of the data. The data in Figure 3 was used to determine the
dissociation constants of the CTD-NTD and CTD-NTD-TNT(I79N)70–170 complexes, which are 2.7 10–6 and 1.7 10–11 M
at 25 1C, respectively.
TABLE 2 | The enthalpies of unfolding of model proteins and protein-protein complexes calculated from the change in ellipticity as a function of
temperaturea.
Sample
CTD (monomer)
NTD (dimer)
TnT70–170 (monomer)
Mix CTD and NTD (trimer)
Mix CTD, NTD and TnT70–170 (tetramer)
aThe
Direct fita
van’t Hoff equation
DH, kcal mol–1
17.7 ± 0.3
30.3 ± 0.2
21.5 ± 0.2
36.8 ± 0.3
ND
DH, kcal mol–1
17.2 ± 0.3
30.1 ± 0.2
21.6 ± 0.1
36.5 ± 0.2
57.8 ± 0.3
raw data and fitted curves are shown in Figure 3.
NATURE PROTOCOLS | VOL.1 NO.6 | 2006 | 2533
PROTOCOL
–6
–9
–12
–15
–18
–21
–24
0
210 220 230 240 250 260
Wavelength, nm
0
–5
–10
–15
–20
0.8
0.6
0.4
0.2
0.0
–25
0
210 220 230 240 250 260
Wavelength, nm
e
10
20 30 40 50
Temperature, °C
60
12
8
4
0
–4
–8
–12
–16
–20
–24
–28
–32
0
210 220 230 240 250 260
Wavelength, nm
f
Fraction each curve
1.0
Figure 4 | Example of the analysis of set of spectra using the CCA.
0
(a,d) Spectra of a model protein containing the C-terminal domain of
0.8
rat striated muscle tropomyosin (CTD) and a fragment containing the
0.6
–10
mutation of a glutamine to leucine (CTDQ263L)40 collected as a function
0.4
of temperature, respectively. (b,e) The data in a and d deconvoluted into
–20
three basis curves using the CCA25. (c,f) The fraction of each basis curve
0.2
contributing to each spectrum at each temperature. The fractional weights
0.0
–30
of the two curves corresponding to the unfolded protein are summed in c
210 220 230 240 250 260
0
20
40
60
because they were almost identical. The protein samples were 1.67 mM in
Wavelength, nm
Temperature, °C
100 mM NaCl, 10 mM sodium phosphate buffer, pH 6.5. Data were collected
at 5-deg increments with 2 min equilibration at each point in cells with path lengths of 1 cm. CTD, model protein containing residues 251–284 of rat
striated tropomyosin with GCG at the N terminus. CTDQ263L, the same peptide with the mutation Q263L. The peptides are cross-linked by disulfide bonds.
[θ] × 10–3 deg cm2 dmol–1
© 2006 Nature Publishing Group http://www.nature.com/natureprotocols
d
1.0
Fraction each curve
[θ] × 10–3 deg cm2 dmol–1
–3
c
5
[θ] × 10–3 deg cm2 dmol–1
b
3
0
[θ] × 10–3 deg cm2 dmol–1
a
80
Spectra collected as a function of wavelength
Analysis of spectra collected as a function of temperature show the use of the CCA to deconvolute the spectra to obtain the
minimum number of basis spectra needed to fit the data. Figure 4a and d illustrate the spectra of the CTD model used here and
the same model protein with the mutation Q263L (ref. 40) (the numbering is that of intact tropomyosin) determined as a
function of temperature, respectively. The CD spectra suggest that the wild-type CTD model protein at 10 1C is 60–70% helical,
in agreement with nuclear magnetic resonance studies, which show that it is 73% helical (63% of the helices are in a canonical
coiled coil and the rest are in linear a-helices) and the rest is disordered41. Replacing Q263 at the coiled coil interface of the
CTD with a leucine increases the helical content to B90% (almost all coiled coil) and also increases the stability of the
molecule40.
Analysis of the change in the spectrum of the wild-type CTD model protein shows that it unfolds in a two-state transition.
When the set of spectra in Figure 4a are deconvoluted into basis spectra using the CCA into three spectra (Fig. 4b), two of the
basis spectra are almost identical, showing that only two conformations are needed to fit the all of the data in Figure 4a. The
percentage of each of the basis curves contributing to the spectra are shown in Figure 4c, where the fraction of each of the two
curves corresponding to the unfolded structure are added. The change in the spectrum of the curve corresponding to the folded
form unfolds with a TM of 25 1C (within experimental error of the TM of unfolding when the ellipticity change at 222 nm is
followed as a function of temperature).
When the set of spectra from the CTD molecule containing the Q263L mutation are deconvoluted, in contrast, at least three
curves are needed to fit the data. The helical peptide unfolds to give a spectrum similar to that of the wild-type CTD, but then
it begins to aggregate to give a spectrum with some b-sheet characteristics.
Two files are provided as supplementary materials. Supplementary Equations has routines in SigmaPlot formats for fitting a
variety of unfolding/folding curves for proteins with various numbers of subunits (e.g., monomers, dimers, trimers) to estimate
the enthalpy, TM of and heat capacity changes of folding. Supplementary Tutorial has instructions for using DOS versions of
the CCA for deconvoluting sets of CD spectra. A copy of the CCA that works in a command window in Windows 95, 98 and XP
is also supplied.
Note: Supplementary information is available via the HTML version of this article.
ACKNOWLEDGMENTS The work was supported by a National Institutes of Health
grant, GM-36326 to N.J.G. and Dr. Sarah E. Hitchcock-DeGregori, and by the
Circular Dichroism Facility at Robert Wood Johnson Medical School (UMDNJ).
I thank the late Dr. Gerald D. Fasman for supplying copies of programs to
deconvolute data sets using the CCA and Dr. Takashi Konno for supplying a
SVD program.
COMPETING INTERESTS STATEMENT The authors declare that they have no
competing financial interests.
2534 | VOL.1 NO.6 | 2006 | NATURE PROTOCOLS
Published online at http://www.natureprotocols.com
Reprints and permissions information is available online at http://npg.nature.com/
reprintsandpermissions
1. Velluz, L., Legrand, M. & Grosjean, M. Optical Circular Dichroism: Principles,
Measurements, and Applications (Verlag Chemie Academic Press Inc, New York and
London, 1965).
2. Beychok, S. Circular dichroism of biological macromolecules. Science 154,
1288–1299 (1966).
3. Adler, A.J., Greenfield, N.J. & Fasman, G.D. Circular dichroism and optical rotatory
dispersion of proteins and polypeptides. Methods Enzymol. 27, 675–735 (1973).
© 2006 Nature Publishing Group http://www.nature.com/natureprotocols
PROTOCOL
4. Johnson, W.C., Jr. Protein secondary structure and circular dichroism: a practical
guide. Proteins 7, 205–214 (1990).
5. Woody, R.W. Circular dichroism. Methods Enzymol. 246, 34–71 (1995).
6. Kelly, S.M., Jess, T.J. & Price, N.C. How to study proteins by circular dichroism.
Biochim. Biophys. Acta 1751, 119–139 (2005).
7. Miles, A.J. & Wallace, B.A. Synchrotron radiation circular dichroism spectroscopy
of proteins and applications in structural and functional genomics. Chem. Soc.
Rev. 35, 39–51 (2006).
8. Greenfield, N.J. Using circular dichroism spectra to estimate protein secondary
structure. Nat. Protocols 1, 2006 doi: 10.1038/nprot.2006.202.
9. Ohgushi, M. & Wada, A. ’Molten-globule state’: a compact form of globular
proteins with mobile side-chains. FEBS Lett. 164, 21–24 (1983).
10. Dolgikh, D.A., Abaturov, L.V., Brazhnikov, E.V., Lebedev In, O. & Chirgadze In, N.
[Acid form of carbonic anhydrase: ‘‘molten globule’’ with a secondary structure].
Dokl. Akad. Nauk. SSSR 272, 1481–1484 (1983).
11. Bolotina, I.A. [Secondary structure of proteins from circular dichroism spectra. V.
Secondary structure of proteins in a ‘‘molten globule’’ state]. Mol. Biol. (Mosk.)
21, 1625–1635 (1987).
12. Kuwajima, K. The molten globule state as a clue for understanding the folding and
cooperativity of globular-protein structure. Proteins 6, 87–103 (1989).
13. Goto, Y., Calciano, L.J. & Fink, A.L. Acid-induced folding of proteins. Proc. Natl.
Acad. Sci. USA 87, 573–577 (1990).
14. Greenfield, N.J. Determination of the folding of proteins as a function of
denaturants, osmolytes or ligands using circular dichroism. Nat. Protocols 1, 2006
doi: 10.1038/nprot.2006.229.
15. Greenfield, N.J. Analysis of the kinetics of folding of proteins and peptides using
circular dichroism. Nat. Protocols 1, 2006 doi: 10.1038/nprot.2006.244.
16. Greenfield, N.J. Circular dichroism analysis for protein-protein interactions.
Methods Mol. Biol. 261, 55–78 (2004).
17. Greenfield, N.J. Analysis of circular dichroism data. Methods Enzymol. 383,
282–317 (2004).
18. Pace, C.N. & McGrath, T. Substrate stabilization of lysozyme to thermal and
guanidine hydrochloride denaturation. J. Biol. Chem. 255, 3862–3865 (1980).
19. Yadav, S. & Ahmad, F. A new method for the determination of stability parameters
of proteins from their heat-induced denaturation curves. Anal. Biochem. 283,
207–213 (2000).
20. Eftink, M.R. Use of multiple spectroscopic methods to monitor equilibrium
unfolding of proteins. Methods Enzymol. 259, 487–512 (1995).
21. Johnson, C.R., Morin, P.E., Arrowsmith, C.H. & Freire, E. Thermodynamic analysis
of the structural stability of the tetrameric oligomerization domain of p53 tumor
suppressor. Biochemistry 34, 5309–5316 (1995).
22. Eftink, M.R. et al. Thermodynamics of the unfolding and spectroscopic properties
of the V66W mutant of staphylococcal nuclease and its 1–136 fragment.
Biochemistry 35, 8084–8094 (1996).
23. Boice, J.A., Dieckmann, G.R., DeGrado, W.F. & Fairman, R. Thermodynamic
analysis of a designed three-stranded coiled coil. Biochemistry 35, 14480–14485
(1996).
24. Horng, J.C., Moroz, V. & Raleigh, D.P. Rapid cooperative two-state folding of a
miniature a-b protein and design of a thermostable variant. J. Mol. Biol. 326,
1261–1270 (2003).
25. Perczel, A., Hollósi, M., Tusnády, G. & Fasman, G.D. Convex constraint analysis: a
natural deconvolution of circular dichroism curves of proteins. Protein Eng. 4,
669–679 (1991).
26. Greenfield, N.J. & Hitchcock-DeGregori, S.E. Conformational intermediates in the
folding of a coiled-coil model peptide of the N-terminus of tropomyosin and
a a-tropomyosin. Protein Sci. 2, 1263–1273 (1993).
27. Safar, J., Roller, P.P., Gajdusek, D.C. & Gibbs, C.J., Jr. Thermal stability and
conformational transitions of scrapie amyloid (prion) protein correlate with
infectivity. Protein Sci. 2, 2206–2216 (1993).
28. Staskus, P.W. & Johnson, W.C., Jr. Conformational transition of hyaluronic acid in
aqueous-organic solvent monitored by vacuum ultraviolet circular dichroism.
Biochemistry 27, 1522–1527 (1988).
29. McPhie, P. & Shrager, R.I. An investigation of the thermal unfolding of
swine pepsinogen using circular dichroism. Arch. Biochem. Biophys. 293,
46–53 (1992).
30. Konno, T. Conformational diversity of acid-denatured cytochrome c studied by a
matrix analysis of far-UV CD spectra. Protein Sci. 7, 975–982 (1998).
31. Ionescu, R.M., Smith, V.F., O’Neill, J.C., Jr. & Matthews, C.R. Multistate
equilibrium unfolding of Escherichia coli dihydrofolate reductase: thermodynamic
and spectroscopic description of the native, intermediate, and unfolded
ensembles. Biochemistry 39, 9540–9550 (2000).
32. Thompson, K.S., Vinson, C.R. & Freire, E. Thermodynamic characterization of the
structural stability of the coiled-coil region of the bZIP transcription factor GCN4.
Biochemistry 32, 5491–5496 (1993).
33. Taylor, J.W., Greenfield, N.J., Wu, B. & Privalov, P.L. A calorimetric study of the
folding-unfolding of an a-helix with covalently closed N and C-terminal loops.
J. Mol. Biol. 291, 965–976 (1999).
34. Singh, A. & Hitchcock-DeGregori, S.E. Local destabilization of the tropomyosin
coiled coil gives the molecular flexibility required for actin binding. Biochemistry
42, 14114–14121 (2003).
35. Ramsay, G.D. & Eftink, M.R. Analysis of multidimensional spectroscopic data to
monitor unfolding of proteins. Methods Enzymol. 240, 615–645 (1994).
36. Schellman, J.A. Macromolecular binding. Biopolymers 14, 999–1018 (1975).
37. Schellman, J.A. The effect of binding on the melting temperature of biopolymers.
Biopolymers 15, 999–1000 (1976).
38. Marquardt, D.W. An algorithm for the estimation of non-linear parameters. J. Soc.
Indust. Appl. Math. 11, 431–441 (1963).
39. Greenfield, N.J., Montelione, G.T., Farid, R.S. & Hitchcock-DeGregori, S.E. The
structure of the N-terminus of striated muscle a-tropomyosin in a chimeric
peptide: nuclear magnetic resonance structure and circular dichroism studies.
Biochemistry 37, 7834–7843 (1998).
40. Greenfield, N.J., Palm, T. & Hitchcock-DeGregori, S.E. Structure and interactions
of the carboxyl terminus of striated muscle a-tropomyosin: it is important to be
flexible. Biophys. J. 83, 2754–2766 (2002).
41. Greenfield, N.J. et al. The structure of the carboxyl terminus of striated atropomyosin in solution reveals an unusual parallel arrangement of interacting
a-helices. Biochemistry 42, 614–619 (2003).
42. Palm, T., Greenfield, N.J. & Hitchcock-DeGregori, S.E. Tropomyosin ends
determine the stability and functionality of overlap and troponin T complexes.
Biophys. J. 84, 3181–3189 (2003).
43. Palm, T., Graboski, S., Hitchcock-DeGregori, S.E. & Greenfield, N.J. Diseasecausing mutations in cardiac troponin T: identification of a critical tropomyosinbinding region. Biophys. J. 81, 2827–2837 (2001).
44. Greenfield, N. & Fasman, G.D. Computed circular dichroism spectra for the
evaluation of protein conformation. Biochemistry 8, 4108–4116 (1969).
45. Bentz, H., Bächinger, H.P., Glanville, R. & Kühn, K. Physical evidence for the
assembly of A and B chains of human placental collagen in a single triple helix.
Eur. J. Biochem. 92, 563–567 (1978).
46. Tiffany, M.L. & Krimm, S. Effect of temperature on the circular dichroism spectra
of polypeptides in the extended state. Biopolymers 11, 2309–2316 (1972).
47. Woody, R.W. Circular dichroism and conformation of unordered polypeptides.
Adv. Biophys. Chem. 2, 31–79 (1992).
NATURE PROTOCOLS | VOL.1 NO.6 | 2006 | 2535