1
QS – Qualitätssicherung
>
Across All Stages
<
QS Software Platform
Feed Monitoring Module
Quick start guide for laboratories
- Version 1.0 -
The present manual serves to demonstrate the QS feed monitoring process to laboratories
approved for QS feed monitoring and to aid in creating a laboratory profile and entering analysis results.
Participation in QS feed monitoring has been mandatory for manufacturers of feed and agricultural coordinators for quite some time now. Up to now, the analysis results of QS system partners have been archived decentrally. The entry of sample accompanying data and analysis
reports in the QS Software Platform is required starting 01.04.2008. Since 01.04.2008 it is
also new that feed material testing may only be conducted by QS-recognized laboratories.
The manual shall first describe the general process of QS feed monitoring. Chapter 1 describes
how laboratories receive their access data for the QS Software Platform. How laboratories can
set up their own employees and edit their laboratory profile is dealt with in chapter 2. Chapter
3 describes the functionalities surrounding the input of sample accompanying data for laboratory samplers. Finally, chapter 4 describes how analysis results are entered in the QS Software
Platform and chapter 5 briefly covers how completed data records/orders are archived.
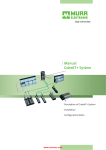
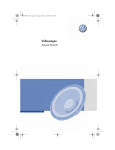
Three parties are essentially involved in the feed monitoring "process" via the QS Software
Platform (see illustration 1).
Ill. 1: The feed monitoring process
QS
Futtermittelhersteller
QS
SoftwarePlattform
Labore
Landwirt.
Bündler
Probebegleitdaten
Analyseergebnisse
On the one hand, the feed companies resp. the agricultural coordinators enter sample accompanying data into the application and commission labs with the sample analysis. On the other
Page 1 of 24
QS – Qualitätssicherung
>
Across All Stages
<
Page 2 of 24
hand, the laboratories enter the respective analysis results for the sample accompanying data.
Once the laboratory has entered the analysis results for the sample accompanying data, they
can be observed and evaluated by the client (and QS).
This user guide is organized as follows:
1. Logging into QS / Access to QS Software Platform
2. Administration of master data and laboratory profile
2.1 Setting up laboratory employees
2.1.1
Role "Laboratory Administrator"
2.1.2
Role "Laboratory Analyst"
2.1.2
Role "Laboratory Sampler"
2.1.2
Editing the laboratory profile
3. Sample accompanying data input
3.1
Commission sampler
3.2
Authorizing input of sample accompanying data
3.3
Transfer of sample accompanying data with a csv file
4. Analysis results entry
4.1
Enter analysis results (normal case)
4.2
Special case "clarification required"
4.3
Analysis order second test
4.4
csv upload and download
5. View of completed analysis results
1. Logging into QS / Access to QS Software Platform
Once the laboratory has received QS approval, QS records the master data of the laboratory of
the so-called "laboratory administrator" (see chapter 2.1) in the QS Software Platform. The
master data of the laboratory contains the name, the address and the contact data. This action
assigns a unique QS-ID (identification number) to the laboratory. QS sets up the laboratory
administrator as the person who was the contact during registration process. Chapter 2 shall
deal with the various roles of lab staff. When registering with QS, the laboratory states according to which parameters it performs tests and with which methods. In line with the parameters
recognized by the QS-System, QS sets up the lab profile for the laboratory in the QS Software
Platform. Only the laboratory profile for pesticides has to be set up by the laboratories themselves (see chapter 2.5).
Once the laboratory and the lab administrator has been set up by QS in the QS Software Platform, the laboratory administrator receives an email with his personal access data (user ID
and password) for the QS Software Platform.
QS – Qualitätssicherung
>
Across All Stages
<
Page 3 of 24
The functionalities of the QS Software Platform can be reached via
https://www.qs-platform.info
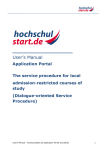
Illustration 2 shows the login screen of the QS Software Platform.
Ill. 2: Login Screen QS Software Platform
Enter the access data under "user ID" and "password" and click the "OK" button. Users that
wish to use another foreign language may choose their language from the drop-down field
"language" before they enter their log-in data. Then the main screen portrayed in illustration 3
is shown.
Ill. 3: Main Screen
Für das
Laborprofil
relevant
The menu item "master data" (see chapter 2) is relevant for the administration of the laboratory profile and the setup of laboratory employees. Functionalities such as "view sample accompanying data" or "input of analysis results" can be selected from the menu item "feed
monitoring" (see chapters 3 and 4). If the laboratory is also approved for "QS residue monitoring fruit, vegetables, potatoes", the menu bar shows the item "QS residue monitoring fruit,
vegetables, potatoes". These functions are described in a separate user manual.
QS – Qualitätssicherung
>
Across All Stages
<
Page 4 of 24
2. Administration of master data and laboratory profile
Once the laboratory administrator (set up by QS) has logged into the QS Software Platform, he
sees the screen depicted in illustration 3. Under the menu item "master data" he can register
further lab employees (chapter 2.1) and edit his laboratory profile (chapter 2.2).
2.1 Setting up laboratory staff
Once the laboratory administrator has called the functionality "laboratories" under "master
data", the screen shown under illustration 4 is shown.
Ill. 4: Laboratories "Tab"
The screen shown is divided into three of four tabs: "laboratory", "laboratory fruit, vegetables
and potatoes" (if the laboratory is approved), "laboratory profile feed" (is described in chapter
2.2) and "user".
The first tab "laboratory" (see illustration 4) shows the address and contact data of the laboratory that have been set up by QS. The laboratory administrator cannot make any changes
here. If something has to be changed (e.g. a new telephone number needs to be entered), the
laboratory administrator must contact QS and QS shall make the changes.
The "user" tab contains all employees set up by the laboratory and new ones can be added
(see illustration 5).
QS – Qualitätssicherung
>
Across All Stages
<
Page 5 of 24
Ill. 5: The “user” tab
In the QS Software Platform, there are three different user types for laboratories each with
different permissions. They shall be described in the following sections.
2.1.1 Role "Laboratory Administrator"
The laboratory administrator is set up when the laboratory is registered in the QS Software
Platform. The laboratory administrator is the only one who has permission to set up laboratory
employees each with their own respective permissions. For this, he clicks the "new" button on
the "user" screen (see illustration 5). Then the input screen portrayed in illustration 6 is
shown.
Ill. 6: Setting up a laboratory employee
QS – Qualitätssicherung
>
Across All Stages
<
Page 6 of 24
In the screen, name, role ("contact type" field) and contact data of the laboratory employee
are set up. It is important to enter an email address as the respective laboratory employee will
receive the QS Software Platform access data at this address.
Clicking the "save" button above the "user" tab saves the entry. However, the screen remains
open. The entries are saved and the screen is closed by pressing the "OK" button. Once the
data has been saved, the respective laboratory employee receives an email containing his
access data.
The laboratory administrator can assign the role of laboratory analyst (see chapter 2.1.2) or
"laboratory sampler" (see chapter 2.1.3). He cannot set up a further laboratory administrator.
This role can only be set up by QS.
Besides being able to set up laboratory employees, the laboratory administrator also has
access to sample accompanying data (that has been allocated to the laboratory) and all laboratory accompanying data as well as analysis results of the laboratory. In addition, he can
assign various laboratory analysts to the sample accompanying data for processing. The laboratory administrator can independently enter laboratory accompany data and analysis results
for sample accompanying data. These functions are described in chapter 4.
In addition, the laboratory administrator also has the same permissions as a laboratory sampler, i.e. he can be commissioned by a feed company or agricultural coordinator to enter sample
accompanying data (see chapter 3).
2.1.2 Role "laboratory analyst"
The laboratory analyst is set up by the laboratory administrator and receives his access data
via the email address that has been specified by the laboratory administrator. The analyst can
view the sample accompanying data that has been assigned to him. He is authorized to enter
respective laboratory accompanying data and analysis results. These functions are described in
more detail in chapter 4.
The laboratory analyst can download sample accompanying data as csv file and upload the
data into the lab's LIMS system. He can also upload data from their LIMS as csv files containing sample accompanying data and analysis results back to the QS Software Platform. This
variant is also further elaborated in chapter 4.
2.1.3 Laboratory "laboratory sampler"
The laboratory sampler is set up by the laboratory administrator and receives his access data
via the email address that has been specified by the laboratory administrator. The sampler is
authorized, by the order of a feed company or agricultural coordinator, to take samples and to
enter the respective sample accompanying data in the QS Software Platform. This can be done
either directly online or via csv-file upload in the QS Software Platform. These functions are
QS – Qualitätssicherung
>
Across All Stages
<
Page 7 of 24
described in chapter 3. The sampler however cannot enter or view the analysis results of the
sample accompanying data.
Lab employees can also each be set up with different roles and receive different access data to
the QS Software Platform respectively.
2.2. Editing a laboratory profile
The screen shown in illustration 7 is called via the menu item "master data", then the functionality "laboratories" and the tab "laboratory profile feed".
Ill. 7: "Laboratory profile feed monitoring" screen
Öffnen des
DetailDatensatzes
This screen lists all parameters for which the laboratory has received QS approval. Besides
these parameters, the laboratory is not authorized to create or change any other parameters.
For this, the lab must contact QS.
Clicking the circular grey "detail" symbol in front of each parameter opens the detail data
record for the respective parameter. The screen which then appears (see illustration 8) shows
which sub-parameters have been set up (e.g. lead and arsenic). The laboratory can also specify the analysis headroom with which the parameters are tested and how high the limit of determination is. The check "active" shows which sub-parameters of the laboratory have been
approved by QS.
QS – Qualitätssicherung
>
Across All Stages
<
Page 8 of 24
Ill. 8: Detail screen "Parameters"
Every change or sub-/parameter needs to be confirmed by clicking the "OK" button in the topright corner of the screen.
For the parameter "pesticides", the laboratory must themselves specify which sub-parameters
are possible. QS only sets this parameter if the laboratory has the respective approval. To
complete the laboratory profile, the laboratory administrator must open the detail data record
of the parameter "pesticide" in the list shown in illustration 7. If this detail data record is
opened for the very first time, all possible sub-parameters of the parameter "pesticide" are set
up and activated (see illustration 9). This means that all sub-parameters that have been activated can be analyzed by the laboratory. If the laboratory cannot analyze certain subparameters, the respective checkmarks should be removed from the sub-parameters. Specifications on the limit of determination and analysis headroom can be edited during each entry of
analysis results before the laboratory administrator and laboratory analyst can.
Ill. 9: Detail screen "Pesticide Parameter"
QS – Qualitätssicherung
>
Across All Stages
<
Page 9 of 24
The laboratory is required to keep the laboratory profile up to date. Only if the laboratory profile is kept complete and up to date can clients be able to commission the tests that they require.
3. Sample accompanying data input
If a laboratory is commissioned by a feed company or an agricultural coordinator to take samples and record sample accompanying data, the laboratory sampler can make use of the following functionalities in the QS Software Platform. How the laboratory administrator sets up a
sampler in the QS Software Platform is described in chapter 2.1.3. This chapter also explains
which permissions the laboratory sampler has.
The manner in which laboratories or laboratory samplers are commissioned with targeted
sampling is described in chapter 3.1. Chapter 3.2. describes how a laboratory can be authorized by the client to independently set up and enter sample accompanying data for certain
locations. Chapter 3.3. describes how to upload csv files via the laboratory sampler.
3.1 Commissioning a sampler
Generally, the client (the feed company or the agricultural coordinator) determines which location should be sampled and at which time. For this, the client sets up sample accompanying
data and specifies which lab is responsible for the sampling of a certain location. Optionally,
the client can also enter further information such as e.g. the type of feed from which the sample is to be taken.
Once the laboratory sampler has logged into the QS Software Platform with his own access
data, he sees the following view under "feed monitoring" and the functionality "sample accompanying data" shown in illustration 10.
Ill. 10: Sample accompanying data view
XXX
Standort A
Systemteilnehmer A
QS – Qualitätssicherung
>
Across All Stages
<
Page 10 of 24
The screen is divided into two sections: The upper half is designed for search queries, e.g. for
an order search by sample ID, for orders concerning the sampling of certain defined feeds or
by data records with certain statuses. For a laboratory sampler, data records have three relevant statuses:
a) "Sample accompanying data set up" (the sampler has independently set up the sample
accompanying data, however the input of all required information has not been completed)
b) "Sampler commissioned" (the client has set up the data record and commission the laboratory sampler with sampling and input of the remaining information)
c)
"Laboratory commissioned" (the laboratory sampler has entered all sample accompany data and sent the data record to the laboratory)
All other data statuses are not relevant to the laboratory sampler.
After entering the search terms, press the "update" button at the upper left-hand corner of the
screen.
The lower half shows a list of sampling orders or previously entered sample accompanying
data records. The status of the data record shows whether it is a (not yet processed) order
from a feed company or whether the data has already been entered and sent to the laboratory.
If the laboratory sampler would like to edit a sampling order, he has to click on the circular
grey "page" symbol. Then the screen portrayed in illustration 11 is shown.
Ill. 11: Detail screen sample accompanying data
XXX
XXX
Unternehmen A
Standort A
QS – Qualitätssicherung
>
Across All Stages
<
Page 11 of 24
All fields that have not been grayed out can resp. must be edited by the laboratory sampler if
the data record is to be transferred to the selected laboratory.
Depending on client and order, the fields of the commissioned sample may be filled differently.
The different fields have the following content resp. system:
a) Sample type:
There are two sample types: "regular" and "voluntary" samples. A regular sample is a sample that corresponds to the QS control plan, i.e. it is inspected in line with the parameters/sub-parameters that are defined for the sampled feed pursuant to the QS control plan.
A voluntary sample is a sample that is inspected by sub/parameters that are not defined for
feed in the QS control plan. No credit is given for voluntary samples in terms of QS control
plan compliance.
b) Sample ID:
The sample ID consists of two parts. The first part is always the QS location number of the
sampled location of a company and cannot be changed. The second part is a 10-digit alphanumeric field that can either be set up by an administrator or (if released) be created by
the application automatically.
c) Location:
The location for sampling was chosen by the client. This section cannot be changed by the
sampler.
d) Sampler:
In this field, the client specifies which laboratory shall be commissioned for sampling. As
soon as a sampler opens the data record of the laboratory, his user name is set in this field.
e) Commissioned laboratory:
In this field, the sampler must state which laboratory analyzes the sample and records the
results in the QS Software Platform. The selected laboratory can view the sample accompanying data in the QS Software Platform (and enter the respective analysis results) as soon
as the administrator has clicked the "confirm data" button, located above the tab "sample
accompanying data". The drop-down lists shows the sampler a list of favorite laboratories.
By clicking in the "folder" symbol located to the right of the field, a list of all approved laboratories appears (please click the "update" button for this). A laboratory for sampling can
be selected from this list. This selection is transferred to the sample accompanying data
screen.
f) Feed description:
Select the feed material for sampling from this field. For this, please click the "folder" symbol located to the right of the "feed description" field. After pressing the "update" button, a
feed selection list appears (cf. illustration 12). The search functionalities in the upper part of
QS – Qualitätssicherung
>
Across All Stages
<
Page 12 of 24
the screen can be used to search for the name of a feed material or its code. Each search
order has to be confirmed by pressing the "update" button. Clicking on the grey "arrow" in
front of each feed material selects that specific feed.
Ill. 12: Feed selection
g) Commissioned parameter resp. sub-parameter:
Select the parameters resp. sub-parameters according to which the feed is to be searched
in the table pictured beneath the "feed description". Selecting a parameter assigns testing
according to all sub-parameters associated with the parameter. By clicking the "screening"
checkbox behind the respective parameter, the analysis must be conducted with the aid of
the respective screening method.
If the feed should only be tested for certain sub-parameters (e.g. instead of "heavy metals"
just for "lead"), specify this by selecting the detail symbol. Then the sub-parameters belonging to the parameters are shown (see illustration 13). Clicking the sub-parameters also
assigns the selected parameters. After selecting the sub-parameter, the screen can be exited by pressing the "OK" button.
Ill. 13: Selection sub-parameter of the parameter "heavy metals"
QS – Qualitätssicherung
>
Across All Stages
<
Page 13 of 24
h) Sampling date:
In this field, the sampler must specify the date on which the sample was taken (using the
format "dd.mm.yyyy").
i) Manufacturing date and/or company-internal sample description:
At least one manufacturing date or company-internal sample description is entered here. Of
course, you can also enter both.
j) Sample quantity:
The quantity of the sample taken is entered in this field. The measuring unit is "kg".
k) Country of origin:
Select the country of origin of the sample from this field. The country in which the location
that is being sampled is situated is predefined here. However, this field can still be edited.
l) State:
The state is an optional field. The state from which the sample originates can be selected
with the drop-down function.
m) Product number:
This field is an optional field which serves to uniquely identify the sample and provide for
better traceability.
n) Trade description:
The field "trade description" is also an optional field for the feed company.
o) Remark:
In this user-defined text field, the sampler can make remarks concerning the sample. This
field can also be viewed by QS and the commissioned laboratory.
Once the sampler has filled in all required fields and clicked the "confirm data" button, the
information is saved. The data is sent to the selected laboratory and the data record receives
the status "laboratory commissioned". If the administrator alternatively clicks the "OK" button,
the entries are saved but not sent to the laboratory. The data record receives the status
"sampler commissioned". If not all required fields are filled but the button "confirm data" is
pressed, the data record is not transferred to the laboratory.
3.2. Authorizing creation of sample accompanying data
The feed company or the agricultural coordinator can authorize the laboratory to independently
create and enter sample accompanying data. If this is the case, the feed company or the agri-
QS – Qualitätssicherung
>
Across All Stages
<
Page 14 of 24
cultural coordinator shall independent of QS, contact the respective laboratory and discuss the
methodology with which the locations are to be sampled.
The laboratory samplers can then create sample accompanying data for the locations that have
been released to them.
For this the sampler logs into the QS Software Platform and calls under menu item "feed monitoring" the functionality "sample accompanying data". In the screen which then appears (cf.
illustration 14), the sampler clicks the button "new" in the upper left-hand corner of the
screen.
Ill. 14: Creating new sample accompanying data
After pressing the "new" button, the screen to enter sample accompanying data portrayed in
illustration 15 is shown.
Ill. 15: Entering new sample accompanying data
QS – Qualitätssicherung
>
Across All Stages
<
Page 15 of 24
The screen corresponds to the screen shown in illustration 11, only that the field "client" and
"location" are not yet filled.
The laboratory sampler must first select the sampling location. For this, he clicks the "folder"
symbol located to the right of the "location" field. A screen then appears (after clicking the
update button) listing all locations for which the laboratory can independently create sample
accompanying data (see illustration 16).
Ill. 16: Selection of the location for sampling
Such- und
Filterfeld
Standort
A
F00000XYZ
Mischfuttermittel
Standort
B
F00000ZZZ
Mischfuttermittel
Standort
C
F00000XXX
Mischfuttermittel
The upper part of the screen contains various search fields with which certain location numbers
or production types can be searched. After entering the search terms, press the "update" button at the upper left-hand corner of the screen. To select a location for sampling, the sampler
must click on the grey "arrow" symbol in front of the respective data record. This transfers the
location to the screen shown in illustration 15.
The entry of the remaining sample accompanying data is done as described in chapter 3.1.
3.3 Transfer of sample accompanying data with a csv file
Besides the options described in chapters 3.1 and 3.2, to enter the sample accompanying data
manually in the screens of the web application, it is also possible to upload and download sample requests to and from the QS Software Platform with a csv file.
If the laboratory sampler would like to download sample accompanying data from one (or
more) clients from the QS Software Platform, he calls the functionality "sample accompanying
data" under the "feed monitoring" menu item. The screen shows all previously created sample
accompanying data records (cf. illustration 17). With the filter function in the upper part of the
QS – Qualitätssicherung
>
Across All Stages
<
Page 16 of 24
list, the sampler can view only those data records that have the status "sampler commissioned" - those that can be edited by the sampler.
Ill. 17: "Upload and download of sample accompanying data" function
The buttons "download sample accompanying data" and "upload sample accompanying data"
are located to the upper right of the list view.
If the sampler clicks on the download button, he obtains a csv file containing all data records
portrayed in the list view. He can further process these and upload them back to the QS Software Platform.
Regardless, the sampler can also upload entirely new sample accompanying data and therefore
create new data (if he has been authorized accordingly by the client). The csv files however
have to correspond with a format defined by QS. A format template can be found at:
https://www.qs-platform.info/QSSoftware/Hilfe.html
Once the sampler has filled in all required fields in the csv file, the sample accompanying data
record uploaded as csv file is automatically set to the status "laboratory commissioned" and
the laboratory can view the data record.
4. Analysis results entry
Once the laboratory analyst has been registered in the QS Software Platform by the laboratory
administrator, he receives his access data via email. He logs into the QS Software Platform,
calls the menu item "feed monitoring" and then the functionality "sample accompanying data".
He then can view all sample accompanying data assigned to the laboratory, as depicted in
illustration 18. If the laboratory has several laboratory analysts, all analysts can view all data
records. Only once an analyst opens and edits a data record, will his username be stored with
the data record. From then on, this data record will no longer be visible for other analysts from
the same laboratory and can no longer be edited by anyone else.
Generally, the analyzed sample does not display any irregularities and the analyst can directly
enter the analysis results in the QS Software Platform. This process is described in chapter 4.1.
QS – Qualitätssicherung
>
Across All Stages
<
Page 17 of 24
The client must be informed in the event of an pre-defined exceedance. This process is described in detail in chapter 4.2. In the event of an exceedance, the client may decide to commission a second laboratory with the analysis of the respective parameter. Chapter 4.3 describes how the second laboratory is to process such a data record. Chapter 4.4. describes the
upload and download of sample accompanying data resp. analysis results from and to the QS
Software Platform.
4.1. Entry of analysis results
Opening the functionality "sample accompanying data" shows the laboratory analyst the sample accompanying data for which he can/should enter analysis results (cf. illustration 18).
Ill. 18: List view of allocated sample accompanying data
XXXXXX
XXXXXX
Standort A
Bündler A
Standort B
Bündler B
If not all data records are to be shown at the same time, the laboratory analyst can search for
certain data records on the basis of sample IDs on the upper part of the screen. Each search
request must be confirmed by pressing the "update" button.
If the laboratory analyst would like to edit a data record (view the sample accompanying data
or enter analysis results) he has to click the grey "page" symbol in front of the respective data
record. A screen then appears containing the three tabs "Sample accompanying data", "Laboratory accompanying data" and "Analysis results".
QS – Qualitätssicherung
>
Across All Stages
<
Page 18 of 24
Ill. 19: Detail screen "sample accompanying data" tabs
XXXXX
XXXXX
Bündler A
Standort A
This tab shows the sample accompanying data entered by the client/sampler. The sample accompanying data can no longer be changed by the laboratory analyst.
The laboratory analyst must enter all essential accompanying data of the laboratory in the tab
"laboratory accompanying data" (see illustration 20).
Ill. 20: Detail screen "laboratory accompanying data" tab
The name of the analyst processing the data record is set up in the grey "analyst" field. An
internal laboratory number can be entered in the field "laboratory-internal sample number"
(for internal laboratory traceability purposes). In the fields "sample entry", "analysis begin"
QS – Qualitätssicherung
>
Across All Stages
<
Page 19 of 24
and "analysis end", the analyst must enter data using the format "dd.mm.yyyy". Both fields
"problems or peculiarities" as well as "assessment" are optional text fields. If the laboratory
has assigned the analysis of certain parameters to another laboratory, the checkbox "suborder
assigned" can be activated and "suborder assigned to" with the respective laboratory name in
the free text field.
The results of the parameters tested by the analyst must be entered in the tab "analysis results" (see illustration 21).
Ill. 21: Detail view "Analysis results" tab" – Part 1
All sub-(parameters) for which there is an analysis order, are listed in this tab. Besides the
names of the sub-parameters, the testing method of the laboratory is shown with which the
laboratory has been approved for by QS. If for example, a screening method has been implemented instead of the commissioned testing method, the analyst can mark the checkbox
"screening". If conversely the test was ordered with a screening method but was not performed accordingly, the checkbox can be removed by the analyst.
The analyst enters the results in the "result value" column. Real values are allowed, n.v." for
"not verifiable", n.a. for "not analyzed", n.d. for "not determined", "negative" and "positive".
The analyst enters the lab's analysis headroom in the "analysis headroom" field as absolute
values (e.g. "+/- 0,002") or relative values (e.g. 2%). The analysis headroom is taken into
consideration when determining whether the result value exceeds the limit value.
After the analysis headroom, the analyst must enter the legal limit value (if one exists) for the
parameter and the respective product (cf. illustration 22). If there is a reference value for the
product/parameter combination, the column "reference value" must also be filled. The laboratories own determination limit must also be specified.
QS – Qualitätssicherung
>
Across All Stages
<
Page 20 of 24
The column "clarification required" shall be dealt with in chapter 4.2.
Ill. 22: Detail view "Analysis results" tab" – Part 2
Once the analyst has entered all laboratory accompanying data, the data is saved by pressing
the "confirm data" button and transferred to the client. If the analyst just wants to save the
entries but not send them to the client, he can click on the "OK" button in the upper right-hand
part of the screen.
If an analysis as a suborder was assigned to a different lab, the originally commissioned laboratory is responsible for the entry of all commissioned analysis results in the QS Software Platform.
If the entry for a data record is complete and the "confirm data" button has been pressed, the
respective record shall no longer be contained in the "sample accompanying data" list, but
rather under the menu function "analysis results" (see chapter 5).
4.2 Special case "clarification required"
If the laboratory determines that a parameter has exceeded the limit value, it is required to
contact the client and report this result. This must be done before the laboratory analyst enters the result in the QS Software Platform.
If the client accepts the exceedance, the analyst enters the respective sample accompanying
data record (incl. exceedance) in the QS Software Platform.
If however the client does not accept the exceedance, the analyst may not enter the result of
the disputed parameter. In this case, the analyst clicks the checkbox "clarification required"
(see illustration 23) and presses the button "confirm data". For undisputed analysis results, the
analyst must enter the results directly.
QS – Qualitätssicherung
>
Across All Stages
<
Page 21 of 24
Ill. 23: Activation of the checkbox "clarification required"
XXXX
After activation of the checkbox, the data record is visible to the laboratory, the client and QS
with the status "clarification required". The laboratory can now no longer change the status of
the data record.
The client shall now commission a second laboratory to re-analyze the controversial parameter. For this, the "old" sample accompanying data record is used and sent to the second laboratory. The second laboratory cannot see the initially commissioned laboratory nor can it see its
laboratory accompanying data. The tab "analysis results" only reveals the disputed parameter
and not the analysis results of the uncontroversial parameters (see chapter 4.3).
If the client commissioned a second laboratory, the data record obtains the status "2nd laboratory commissioned". Once the second laboratory has determined a result, the data record
receives the status "result available" (see chapter 4.3). Once QS enters a result, the data
record is closed and obtains the status "analysis complete".
4.3. Analysis order second test
If an analyst opens the view "sample accompanying data" he see the data records with the
status "laboratory commissioned (second test)". He can also perform separate searches for
data records with this status (see fig. 24). Data records with this status are records that had
been previously inspected by another laboratory with a result that was not accepted by the
client. This is why he commissioned a second laboratory with the analysis of the controversial
parameter. If an analyst sees records with this status, this means that the laboratory had been
commissioned with a second round of testing for this parameter.
QS – Qualitätssicherung
>
Across All Stages
<
Page 22 of 24
Ill. 24: List view second test
XXXXXX
Standort
A
Bündler A
Unternehmen A
If the analyst opens the detailed view of the data record, he can see the sample accompanying
data that the first laboratory has also received (cf. chapter 4.1). However, the analyst does not
see which laboratory performed the first test.
The second laboratory must also fill in the specs for the laboratory accompanying data (cf.
illustration 20). In the tab "analysis value" the second laboratory only sees the disputed parameter. The undisputed results for the other parameters cannot be seen by the second laboratory (cf. illustration 25).
Ill. 25: Input "result available" for second laboratory
XXXXXX
Once the analyst has determined the result for the controversial value, he clicks the checkbox
"result available" and then the button "confirm data". Now the data record has a second result.
The second laboratory has to now contact the client and communicate the analysis results.
The data record is then saved under the menu function "analysis results" (cf. chapter 5).
QS – Qualitätssicherung
>
Across All Stages
<
Page 23 of 24
4.4 csv upload and download
Besides the possibilities of viewing sample accompanying data individually on the web application, the analyst can also download sample accompanying data from the QS Software Platform.
Under the menu item "feed monitoring" he then opens the functionality "sample accompanying
data". In the upper right-hand corner of the screen there is a button "download sample accompanying data" (cf. illustration 26).
Ill. 26: "Download sample accompanying data" button
By pressing the button, all data records listed in the list view are downloaded as an csv file
from the application. If only certain sample accompanying data are to be downloaded (e.g. for
a certain location or status), the search function in the upper part of the screen can be used to
search for data records (after entering the search term, press the "update" button).
Besides directly entering the analysis results into the QS Software Platform screens, the analyst can also upload the analysis results as a csv file. For this, the analyst must once again call
the functionality "sample accompanying data". In the upper right-hand part of the screen and
below the button "download sample accompanying data" you see the "upload analysis results"
button (cf. illustration 27).
Ill. 27: "Upload analysis result" button
QS – Qualitätssicherung
>
Across All Stages
<
Page 24 of 24
You can only upload analysis results for sample accompanying data that has already been set
up. To ensure that the csv file is uploaded correctly, the format must correspond to that defined by QS. The format template for "analysis result upload" can be found at
https://www.qs-platform.info/QSSoftware/Hilfe.html
5. View of completed analysis results
Once an analysis report has been completed by the administrator or the laboratory analyst, the
status of the data record changes to "analysis completed" (or "clarification required", "2nd
laboratory commissioned" or "result available" - see chapter 4.2. or 4.3). Data records with
these statuses are no longer listed under the functionality "sample accompany data", but under the functionality "analysis results" (see illustration 28).
Ill. 28: Functionality "analysis results"
Similar to the functionality "sample accompany data", completed analysis reports are shown in
a list view. A search function in the upper part of the screen helps to find certain data records.
Clicking the grey "page" symbol shows the detailed data of the respective data record (sample
and laboratory accompanying data as well as analysis results).
This manual describes the functionalities of the Feed Monitoring module at the time of becoming operational. The application is successively enhanced with additional functionality (such as
for example the printout of sample accompanying data or evaluations of the analysis results).
QS will inform you about such enhancements.
Should you have any further questions regarding the functionality or the process of
feed monitoring please contact the QS Feed product area or Technical Support at
telephone number: 09001-774453 (0.49 €/minute) or [email protected].