1
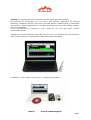
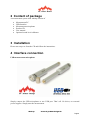
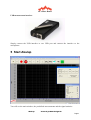
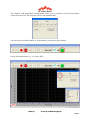
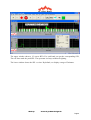
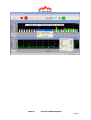
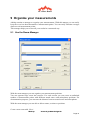
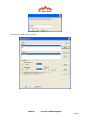
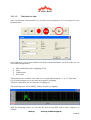
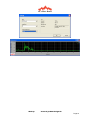
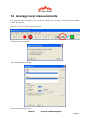
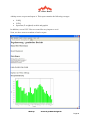
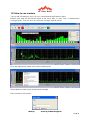
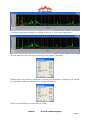
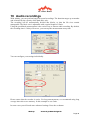
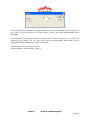
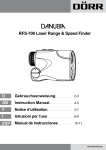
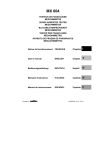
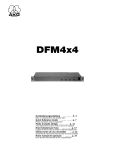
AkuLap
Professional Audio Measurement System
www.dr-jordan-design.de
User Manual
AkuLap
www.dr-jordan-design.de
Page 1
Preface
Modern acoustic measurement systems, such as AkuLap, offer a variety of sophisticated
methods of measurement. These processes are very complex and require normally a long-term
training.
Therefore, AkuLap has automatic measuring methods, which allow measuring reliably many
acoustic parameters by non - specialists. The experience of our designers and acousticians has
been summarized in this automated system. The goal is to require as little as possible user
interaction. At the same time, we can prevent operator errors. For experienced users we have
many advanced features even for very special use cases.
The measurement results are written in a clear report. Therefore, you can print this report to
easily archive or send them by email.
In this Quick Start Guide, the most important information is summarized. For more
information, please refer to the general guidance of AkuLap or the advanced literature.
AkuLap
www.dr-jordan-design.de
Page 2
1
General Description............................................................................................................ 5
2
Content of package ............................................................................................................. 6
3
Installation .......................................................................................................................... 6
4
Interface connection........................................................................................................... 6
5
Start Akulap ........................................................................................................................ 7
6
Verify the setup ................................................................................................................. 10
7
Select the measurement range.......................................................................................... 11
8
Calibration ........................................................................................................................ 12
9
Organize your measurements........................................................................................... 15
9.1
Use the Room-Manager........................................................................................................ 15
9.2
Directories.............................................................................................................................. 17
9.3
Archive measurements ......................................................................................................... 17
10
Narrow band analysis with FFT................................................................................... 18
11
Weighting Filters........................................................................................................... 19
12
Signal statistic................................................................................................................ 20
13
Starting a measurement ................................................................................................ 22
13.1.1
Analysis of the measurement ........................................................................................................ 23
14
Average level measurements ......................................................................................... 28
15
Marker ........................................................................................................................... 31
15.1
Overview ............................................................................................................................ 31
15.2
How to use markers........................................................................................................... 32
15.2.1
15.2.2
15.2.3
Marker type level .......................................................................................................................... 35
Marker overview ........................................................................................................................... 36
Report............................................................................................................................................ 37
16
Audio recordings ........................................................................................................... 38
17
Directory structure ........................................................................................................ 40
18
Expert mode................................................................................................................... 41
19
Sample report................................................................................................................. 42
AkuLap
www.dr-jordan-design.de
Page 3
AkuLap is a professional tool for powerful real-time signal and system analysis.
By using the PC environment, it is not only a cost efficient replacement for classical
laboratory equipment. AkuLap offers more powerful features combined with a comfortable
user interface. Typical applications are acoustic measurements, room and building acoustics
and noise monitoring.
If you run Akulap on a notebook or even a tablet PC, you can easily build a mobile
measurement system.
Akulap can use many different front ends. In most cases, you will have the most advanced
setup, which consists of a Laptop and a USB measurement microphone.
In addition, we offer other systems with e.g. constant current supply.
AkuLap
www.dr-jordan-design.de
Page 4
1 General Description
With this compact measuring system, you can perform a wide range of acoustic
measurements in a simple way.
The system consists of a computer and one measuring interface that you connect via USB.
Depending on your requirements and you can connect high-precision type approved
measurement microphones.
• By using the PC environment you get a large user interface
• Short learning curve
• Measurement results can be quickly and easily exported for documentation as a
graphic or table
• Modular system: You can use different vendors manufacturer for measurement
microphones.
• Modern computers provide high computing power. The functions are available for
advanced analysis. Today measurements are possible, which could not be offered so
far in this price range.
Features
•
•
•
•
•
•
•
•
•
•
•
•
•
•
•
With the large display it is very user-friendly compared to classic hand held sound
level meters
Measurement of noise according to international standards
Measure all parameters simultaneously e.g. LCeq, Lceq, LAFmax,
Lcpeak,LAFTeq,L95% etc
Automatic report generator
Real-time 1/3 octave analyzer according to IEC1260 class 0
FFT analysis
Level vs. Time plots
Signal statistics
Audio recorder (.wav/ .mp3) synchronous to the signal analysis
Tonal components IEC 45681
Supports Marker for post-processing
Loudness ISO 532B (Sone)
Easy export of measurement results via graphic or table
You can use different signal acquiring hardware. E.g. USB class 1 / 2 microphones
Akulap runs on different PC, notebook, Tablet
AkuLap
www.dr-jordan-design.de
Page 5
2 Content of package
A measurement system with Akulap consists of
•
•
•
•
•
•
Measurement PC
USB-Interface
Measurement microphone
Product CD
User manual
Optional sound level calibrator
3 Installation
Please run setup.exe from the CD and follow the instructions.
4 Interface connection
USB measurement microphone
Simply connect the USB microphone to one USB port. That’s all. No driver, no external
power supplies. Simply start the measurement.
AkuLap
www.dr-jordan-design.de
Page 6
USB measurement interface
Simply connect the USB interface to one USB port and connect the interface to the
microphone.
5 Start Akulap
You will see the main window, the predefined measurements and the signal statistics.
AkuLap
www.dr-jordan-design.de
Page 7
The window with predefined measurements allows you to perform several measurements
easily with one click. The program will be reset automatically.
You can always put this window to foreground by pressing the green button.
Select one measurement e.g. 1/3 octave RTA
AkuLap
www.dr-jordan-design.de
Page 8
The upper window shows a 1/3 octave RTA. For each band you get the corresponding SPL,
The red lines mark the peak SPL. The spectrum is always without weighting.
The lower window shows the SPL vs. time. By default, we display a range of 5minutes.
AkuLap
www.dr-jordan-design.de
Page 9
Note
With the green button you will always get the predefined measurements.
During a measurement, this window is hidden to save room for the measurements results.
6 Verify the setup
Connect a sound level calibrator carefully to the microphone and power on the calibrator. In
this example, we use a calibrator with 1kHz and 94dB.
The SPL meter should display 94dB. It is important that you see a peak at 1kHz. The A and Z
weighted level should have a deviation of max 0.3dB. A small mismatch between the two
AkuLap
www.dr-jordan-design.de
Page 10
values might be caused by a frequency deviation of the calibrator. At exact 1kHz, both values
are identical.
7 Select the measurement range
Some types of USB measurement systems have different measurement ranges. You will find
the available ranges in the lower right corner. Select the desired range with a mouse click.
The calibration does not change, if you select a different range.
AkuLap
www.dr-jordan-design.de
Page 11
8 Calibration
In this example we use a calibrator with 114dB. When we connect the calibrator, we get a
SPL reading of 116dB. Therefore, the system requires calibration.
AkuLap
www.dr-jordan-design.de
Page 12
Press the button „CAL“ from the toolbar.
You can freely select the calibration level. Common are 94dB, 114dB and 124dB for
pistonphones. Please ensure, that the level of the calibrator is within the measurement range.
If you select „save“, the system will save the calibration offset permanently.
If you select “disable”, no calibration is used. The reference level 0dB will be full scale of the
AD-converter. This feature is for advanced users.
Enter a level of 114dB and press ok. The system should now show the correct SPL of 114dB.
We recommend calibrating before each measurement. In addition, this simple step verifies the
complete measurement chain.
Please ensure that the level of the calibrator is within the range of the analyzer. The system
has detection for overload and underload. In this case, use a different calibration level or
measurement range.
AkuLap
www.dr-jordan-design.de
Page 13
AkuLap
www.dr-jordan-design.de
Page 14
9 Organize your measurements
Akulap contains a manager to organize your measurements. With this manger you can easily
keep the overview about thousands of measurement points. You can easily calculate averages
about several measurement points.
This manager helps you to store all your results in a structured way.
9.1 Use the Room-Manager
With the room manager you can organize your measurement positions.
You can separate large room into sections. For each section you can create an unlimited
number of measurement points with different sound source and microphone positions. For
documentation purposes, you can enter the distance between sound source and microphone.
With the room manager you can edit or delete rooms, sections or positions.
Create a new room with „New“
AkuLap
www.dr-jordan-design.de
Page 15
Enter the new name end press enter.
AkuLap
www.dr-jordan-design.de
Page 16
With “C” you can change the name later. With “X” you can delete a complete room.
In a similar way you can edit or delete sections of a room.
When you begin, a room contains a single section with the name “Standard” with one
measurement position.
9.2 Directories
The room manager saves all files at
„My Documents\Measurements\Level\__MANAGED__”
For each room a separate sub-directory is created. In each room you will find subdirectories
with the different sections. In each section you will find the directories with the individual
measurements.
The directory "MIC2_LS3" contains the measurement with the microphone position 2 and the
sound source position 3
This directory structure is stored in a database. You should NOT rename, move or delete any
directories by hand. Use the functions of the room manager to perform these tasks. If you
change directories, the program recognizes this and you receive an error message.
Therefore, use always the room manager to delete or rename rooms / sections etc.
9.3 Archive measurements
If you have a variety of rooms measured, the project can quickly get confusing. We therefore
recommend archiving older measurements.
1. Close AkuLap
2. Move the individual rooms to any directory. This can be done as usual by means of the
operating system, for example, File-Explorer
3. Start AkuLap and start the room manager
You receive a message that the room was not found and has been deleted from the database.
AkuLap
www.dr-jordan-design.de
Page 17
10 Narrow band analysis with FFT
If you need a narrow band analysis we recommend using the FFT. You can detect tonal
components or measure e.g. the base frequency of a power generator.
Select the mode FFT.
The default frequency resolution is 1.3Hz. You can increase the frequency resolution by
adjusting the FFT size. However, the higher is the frequency resolution, the lower the time
resolution. The system will "move slowly".
AkuLap
www.dr-jordan-design.de
Page 18
11 Weighting Filters
Akulap s the following weighting filters:
•
•
•
Z without weighting
A
C
You can change the current weighting in the status bar in the lower right area.
During a measurement all weighting filters are stored simultaneously.
AkuLap
www.dr-jordan-design.de
Page 19
12 Signal statistic
With the signal statistic window you get a quick overview:
LAeq
LCeq
LAFmax
LCpeak
LA95%
LAFteq
Energy equivalent average weighting A
Energy equivalent average weighting C
Maximum value from frequency weighting A und time weighting F
Peak value frequency weighting C
95% Percentile
“Taktmaximalwert” 5s energy equivalent average
With the buttons X1,X2,X4 you can enlarge the statistic window to read it easily from a
distance.
You can copy the current results to the clipboard with the button “->” and then export it easily
to Excel.
LAeq
LCeq
LCeq-LAeq
LAFteq
LCpeak
LAFmax
LAFteq-LAeq
LA95
100,3dB
109,6dB
9,3dB
119,4dB
129,4dB
119,4dB
19,1dB
99,8dB
AkuLap
www.dr-jordan-design.de
Page 20
AkuLap
www.dr-jordan-design.de
Page 21
13 Starting a measurement
Once you started Akulap, all measurement results are displayed in real-time. This interactive
mode is useful to analyze a device directly. Any measurement results are NOT stored.
Instead, you have to start a measurement manually to get all results over a period of time.
Press the start button from the tool bar. The measurement will stop automatically, when the
measurement time has elapsed. In addition, you can stop a measurement manually with the
stop button.
During a measurement the following parameters a stored.
Wide band:
• SPL with time weighting (F,S,I)
• LEQ
• “Taktmaximalwert”
• Peak value
These values are stored for the frequency weighting Z,A,C simultaneously.
In addition, Akulap stores the 1/3 octave spectrum un-weighted (Z).
By default, all measurement results are stored with in interval of 125ms for a duration of
5min. You can easily modify these settings.
AkuLap
www.dr-jordan-design.de
Page 22
The most important parameters are Average time and the number of measurements. If you
multiply the average time and number of measurements, you get the total duration of one
measurement.
For typical measurement durations we have pre-defined buttons. Alternatively, you can set the
time manually
13.1.1 Analysis of the measurement
Once you stopped y measurement, you can:
•
•
•
Save
Create a report
Plot level vs. time curves
AkuLap
www.dr-jordan-design.de
Page 23
13.1.1.1
Save
You can save a measurement to disk with the save button from the toolbar.
Later you can load such file to create e.g. a report.
All measurement results are organized by the room manager. We discuss this room manager
in a separate section of this user manual.
13.1.1.2
Report
AkuLap
www.dr-jordan-design.de
Page 24
From the measured data you can create an automated report. This report contains a variety of
statistics and can be archived easily, printed or exported to Word / Excel. The report is
generated as an HTML file and automatically open your Internet browser.
You will first be asked for the location to save the date. This is done through the room
manager. This is explained in a separate section. The data is stored at "My documents \
Measurements \ level" in an individual directory. A new subdirectory is created for each
measurement.
After a short time, your internet browser will open with the report. Here you can print the
report using the usual functions from your internet browser.
AkuLap
www.dr-jordan-design.de
Page 25
13.1.1.3
Plot level vs. time
Once you finished a measurement, you can plot various parameters. It is not required to save
the data before.
In the right part you see some detailed info about your measurement. On the left side you can
select different parameters
•
•
•
•
SPL with different time weighting (F,S,I)
LEQ
Taktmaximal
Peak value
All parameters are available wide band or for a single band using the 1/1 or 1/3 filter bank
For all wide parameters you can enter the frequency weighting.
All narrow band data uses no frequency weighting (Z)
The following curve shows SPL(F) with no frequency weighting
With the following section you can plot the narrow band SPL with a center frequency of
1000Hz.
AkuLap
www.dr-jordan-design.de
Page 26
AkuLap
www.dr-jordan-design.de
Page 27
14 Average level measurements
By using the room manager, you can easily calculate the average of several measurements
within one section.
Press the „AVG“ button from the tool bar.
Select level measurement
The room manager will start
Select a section and press ok
AkuLap
www.dr-jordan-design.de
Page 28
Akulap creates a report and opens it. This report contains the following averages:
•
•
•
LAEQ
LCEQ
Spectrum (Z-weighted) as table and graphic
In addition, several CSV files are created for easy import to excel.
Next, we show some screenshots of such a report.
AkuLap
www.dr-jordan-design.de
Page 29
AkuLap
www.dr-jordan-design.de
Page 30
15 Marker
15.1 Overview
Once you finished a measurement, in many cases you will need some post-processing. Let’s
assume you measured the noise 5min in a quiet office, but suddenly someone opens the door.
Of course, you can simply repeat the measurement. However, there are cases where this is not
possible. In this case you can remove the short noise from the calculation.
In addition, marker helps you to analyze noise of e.g. a machine with different working
phases.
Akulap supports the following type of markers:
1. Exclude of a section. Certain parts of the measurement are excluded from statistics
calculation
2. Include of a section. Akulap calculates all signal statistics from the marked sections.
3. Level. You change the level of marked sections.
Simply mark the sections with the mouse in the level plot. In addition, you can enter precise
times.
It is very useful to enter a name for a marker. The name is plotted in all graphics. Akulap
creates a table with all signal statistics for the markers.
When you change the length of a marker interactively with the mouse, all statistics are
updated in real-time. This feature is useful to analyze the effect of a marker.
If the measurement included a wav recording, you can listen to the recorded sound of the
marked section.
AkuLap
www.dr-jordan-design.de
Page 31
15.2 How to use markers
You set and edit markers, once you save a measurement and loaded it again.
Double click with the left mouse button in the lower SPL vs. time view. A measurement
rectangle opens. You can move or resize this rectangle with the mouse.
Press the right mouse button and a context menu opens.
Select Marker exclude from measurement rectangle.
Enter a name for the marker.
AkuLap
www.dr-jordan-design.de
Page 32
Close the measurement rectangle by clicking on the red ‚x’ in the upper right corner.
The red marked section will now be ignored for any statistic calculation.
Double click on the marker to deactivate it. In this case the marker is displayed, but ignored
for calculation. In this case the section is not ignored anymore.
In this case the difference for total LEQ is 0.1dB.
AkuLap
www.dr-jordan-design.de
Page 33
In addition, you can enter the exact marker position with the keypad. Select a marker and use
“time set” from the context menu.
Delete
Select a marker and press the”Del” key.
Rename
Select a marker and use “marker rename” from the context menu.
Listen
Select a marker and use “listen to marker” from the context menu.
AkuLap
www.dr-jordan-design.de
Page 34
Move
Each marker contains three active elements. With the middle box, you can move the marker.
With the left or right box you change its size.
15.2.1 Marker type level
With this type of marker you can reduce or increase the level within the section. Typically this
is used for certain periods of time e.g. during night. If the noise contains tonal components,
such markers are useful for adding a penalty level.
You can use this type of marker in a similar way. Select a measurement rectangle, choose
marker level, and enter the name and the level offset.
The level offset can be positive or negative.
The marker does not modify the SPL curve itself. Akulap considers this marker during
calculation of the statistics, only.
AkuLap
www.dr-jordan-design.de
Page 35
Hint
This type of marker is very useful for just marking sections without any influence to the
signal statistic. All reports will contain this marker and its statistic information. Simply enter a
level offset of 0dB.
15.2.2 Marker overview
Akulap can report all markers in a clear way. From the context menu select marker overview.
For each marker you will get the following statistical information
•
•
•
•
LAEQ
LCEQ
LAFMAX
LAFTEQ
Use the button „clipboard“ to copy the content to e.g. Excel.
AkuLap
www.dr-jordan-design.de
Page 36
15.2.3 Report
In a report, Akulap will summarize all markers in a clear table.
Name Type
Knall
Exclude
Sirene Level offset
Offset [dB]
LAEQ LCEQ LAFMAX LAFTEQ Start
[dB] [dB]
[dB]
[dB]
Duration
Ti me
--
52,1
51,7
71,6
68,6
22.44s
13.95s
Montag, März 11, 2013
17:55:04
6
44,7
50,4
61,1
56,2
1m:27s
20.25s
Montag, März 11, 2013
17:56:09
AkuLap
www.dr-jordan-design.de
Page 37
16 Audio recordings
With Akulap, you can perform long-term sound recordings. The duration ranges up to months
and is limited by the capacity of the hard disk, only.
The recording will be automatically divided into blocks, so that the file sizes remain
manageable. The block size is adjustable with a typical length of 15min.
Using the predefined measurements is the easiest way to start an audio recording. By default,
the recording time is 30 days. However, you can stop the measurement at any time.
You can configure your settings individually.
Please ensure that the recorder is active. For long measurements, we recommend using long
average intervals to save memory. In this example we use 5min.
In some cases you will need more advanced settings. Press the set button.
AkuLap
www.dr-jordan-design.de
Page 38
You can adjust the maximum file length. Small files are easier to handle. In this example we
use 30min. If you record 24h, you will get 48files. The files are named automatically with a
timestamp.
You can reduce your disk space when recording audio. Activate “decimate :4” to reduce the
sample rate by a factor of 4. Of course, this reduces the bandwidths. But in many cases a
bandwidth of 8kHz (Samplerate 16kHz) is sufficient.
All recordings are saved in the directory
„My documents \ Measurements \ Waves“
AkuLap
www.dr-jordan-design.de
Page 39
17 Directory structure
„My documents \ Measurements“
Level: This directory contains all level measurements. The room manager uses the directory
“__MANAGED__”. Do not modify these files by hand.
Waves: All audio recordings are saved to this directory.
AkuLap
www.dr-jordan-design.de
Page 40
18 Expert mode
The program has two modes of operation. This quick guide covers only a fraction of the
features. In order to simplify the operation, the program starts with clear and simple user
interface. This interface is tailored to the typical measurement tasks menus. You can switch
Akulap via Options-> Expert Mode . The program then restarts and displays the advanced
options. This setting is permanent. You can switch back to simplified mode at any time.
A description of the advanced options can be found in the extensive (about 400pages) user
manual. In addition, you will find there a lot of background information.
Of course, this manual cannot replace thorough acoustic knowledge. We provide individual
consultations on a fee basis. Please note that we offer free support only for the service /
technical support. Unfortunately, we cannot answer basic acoustic questions free of charge.
For this purpose, we offer training courses on different topics together with the company
“Stratenschulte-Messtechnik”.
AkuLap
www.dr-jordan-design.de
Page 41
19 Sample report
Akulap creates an automatic report with the following plots
• Level vs. time A F
• Taktmaximalpegel 5s A F
• Level vs. time LEQ A and C in one plot
• Average spectrum Z LEQ
The average spectrum and the level vs time data are saved as a table
Einstellungen
Beginn der Messung: Thursday, April 07, 2011 12:26:57
Anzahl der Datenpunkte: 2400
Meßintervall: 125ms
Meßdauer: 5m: 0s
Kalibrieroffset: 133.6dB
Pegel-Zeitverlauf A F
Taktmaximalpegel 5s A F
AkuLap
www.dr-jordan-design.de
Page 42
Pegel-Zeitverlauf LEQ
AkuLap
www.dr-jordan-design.de
Page 43
Mittleres Terz-Spektrum Z LEQ
TA_Lärm Parameter
TA Lärm
dB
LAeq
66,4
LCeq
71,5
LCeq-LAeq
5,1
LAFteq
74,3
LCpeak
111,8
LAFmax
86,5
LAFteq-LAeq 7,9
LA95
53,4
Perzentile A F
Perzentile dB
LAF95
53,4
LAF5
72,6
LAF1
78,5
LAF0.1
82,2
AkuLap
www.dr-jordan-design.de
Page 44
Statistiken breitbandig
Bewertung:Z
LEQ: 79.2dB
SPL (Fast): min: 75.3dB max: 87.6dB
SPL (Slow): min: 76.1dB max: 85.8dB
Spitzenwert (ohne Zeitbewertung): 113.1dB
Bewertung:A
LEQ: 66.4dB
SPL (Fast): min: 53.2dB max: 86.5dB
SPL (Slow): min: 53.4dB max: 80.1dB
Spitzenwert (ohne Zeitbewertung): 114.4dB
Bewertung:C
LEQ: 71.5dB
SPL (Fast): min: 53.5dB max: 87.0dB
SPL (Slow): min: 54.0dB max: 84.9dB
Spitzenwert (ohne Zeitbewertung): 111.8dB
Statistiken 1/3 Oktav Bewertung:Z
Frequenz [Hz] LEQ(Z)[dB] LEQ(A)[dB] LEQ(C)[dB]
5
39,2
-54,0
14,1
6
38,8
-46,6
17,5
8
37,2
-40,3
19,6
10
37,9
-32,6
23,5
13
38,8
-24,8
27,5
16
38,1
-18,3
29,7
20
39,7
-10,7
33,5
25
39,1
-5,7
34,7
32
37,4
-2,1
34,4
40
38,6
4,1
36,7
50
45,0
14,7
43,7
63
36,2
10,0
35,4
80
44,5
22,1
44,0
100
46,3
27,2
46,0
125
53,5
37,3
53,4
160
48,7
35,5
48,6
200
52,7
41,9
52,7
250
64,3
55,7
64,3
315
68,2
61,6
68,2
400
60,2
55,5
60,3
AkuLap
www.dr-jordan-design.de
Page 45
500
61,2
57,9
61,2
630
56,6
54,7
56,7
800
52,0
51,2
52,0
1000
51,1
51,1
51,1
1250
51,9
52,4
51,8
1600
48,6
49,6
48,5
2000
46,2
47,4
46,1
2500
47,4
48,7
47,1
3150
46,1
47,3
45,6
4000
44,8
45,8
44,0
5000
47,6
48,1
46,3
6300
53,1
53,0
51,1
8000
47,8
46,7
44,8
10000
44,6
42,1
40,2
12500
47,3
43,1
41,2
16000
45,6
38,9
37,0
AkuLap
www.dr-jordan-design.de
Page 46