1
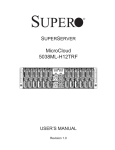
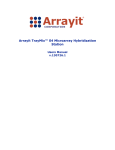
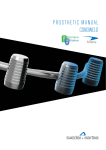
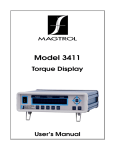
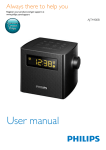
NeuronIQ (version 1.5) Manual
Installation:
NeuronIQ is running under Matlab environment, for both Windows and Linux.
Before the installation, the following should have been installed on the local machine:
1. Matlab version 7.0 or up (http://www.mathworks.com/products/matlab/).
• if you use matlab in Windows, download the NeuronIQ Windows version;
• if you use matlab in Linux, download the NeuronIQ Linux version.
2. Matlab toolbox:
• image processing toolbox
• bioinformatics toolbox
3. javax package, which is included in the freely available Java 2 Platform
(http://java.sun.com/products/archive/).
Then download correspond NeuronIQ package and unpacked into one folder on the local
machine. Change the current Matlab directory to the folder containing the unpacked files.
To run the software, type ‘NeuronIQ’ in the command window of Matlab.
Team Members:
Project Leader: Dr. Stephen TC Wong, Dr. Zhong Xue
Graphic User Interface: Dr. Jie Cheng, Dr. Yong Zhang
CADMOS : Dr. Yong Zhang
MADMOS: Dr. Jie Cheng
Software Improvement & Optimization: Kun Chen, Qing Li
Software Testing: Dr. Fei Cao, Ying Zhu, Dr. Peng Shi, Vinothini Kamalesan.
Contact:
Dr. Jie Cheng
The Methodist Hospital Research Institute Radiology Department
6565 Fannin Street, B5-022
Houston, Texas 77030
Office: (713) 441-8676
Email Address: [email protected]
Users’ Manual
Data Requirement:
NeuronIQ is designed to be used with datasets obtained by confocal or multi-photon
fluorescence microscopy. The program supports files in TIFF (Tagged Image File Format,
with suffix .tif or .tiff) or JPEG (.jpg or .jpeg) format, both in 3D volume data or 2D
single slice. Currently the program only accepts greyscale images of 8 or 16 bit-depth.
For other types of images, it should be converted to the TIFF or JPEG format before
using the software.
Menu:
1. File
Load an Image: load a single image to process
Load Directory: load all images in a directory to process
Save Result: Export the processing results of an image into an Excel file
Batch Export: Export the batch processing results into an Excel file
Save Current Image: Save the displayed image in .bmp format
Close Current Image: Close currently displayed image
Close Directory: Close currently opened directory
Exit: Exit NeuronIQ
2. Analysis
CADMOS: Curviline based spine detection and measurement
MADMOS: Morphology based spine detection and measurement
Single Processing: Automatic process for a single image
Batch Processing & Save Results: Automatic process for a collection of images
3. Tools
Filtering: Median filter for denoising
Interpolation: Interpolation of images with low resolution
4. Help
NeuronIQ Help: load NeuronIQ Manual
Online Resources:
Contact: Contact information
What’s New: Latest changes of NeuronIQ (new functions, bug corrections, etc.)
About NeuronIQ: Version and authorization information
Graphic User Interface
8
1
2
3
4
7
6
The above Graphic User Interface (GUI) is divided into 8 parts and each part is explained
in the following sections.
1. Algorithm Selection
CADMOS
MADMOS
:
:
Curvilinear based Automatic Detection and Measure of Spines
Morphology based Automatic Detection and Measure of Spines
The user can select any one of them for single processing or batch processing. The
MADMOS is selected by default. To learn more details about the algorithms, please refer
to our published paper [1][2].
2. Parameters:
Two parameters (Micron/Pixel, Min Sp Len) are required for MADMOS, while four
parameters (Micron/Pixel, Min Sp Len, MaxSTD, Lnk Rad) are for CADMOS. Details:
For both CADMOS and MADMOS:
5
•
•
•
Micron/Pixel: ratio between micron & pixel; default value is 0.084
Min Sp Len (Micron): the minimal length of a spine to be counted; default value
is 0.1 micron
MinSpLen(Pixel): the minimal length of a spine to be counted, equal to
MinSpLen(Micron) /(Micron/Pixel); This parameter can also be adjusted after the
processing.
For CADMOS Only:
• MinSTD:
minimum standard deviation. Default value is 1.
• MaxSTD:
maximum standard deviation. Based on the width of the dendrite.
MaxSTD > MinSTD and it is suggested that MaxSTD < 10. Default value is 7.5.
• Low Thr
vesselness response threshold to select the linking ending point,
default value is 1.
• Upp Thr:
vesselness response threshold to select the linking starting point,
default value is 4.
• Lnk Rad:
Linking radius. It is better to set 2 ≤ LnkRad ≤ 5 . Default value is
4.
• Lnk Dir:
Linking Direction. Default value is 0.7.
• MaxSpLen(Pixel): the threshold of the length to distinguish spine and dendrite.
Default value is 50 pixels.
3. View Image Stack
•
•
•
•
•
Slider:
draw to the slice index which you want to observe
Slide Number: input the slice index which you want to observe
Raw:
view the original image slide by slide
Project:
view the MIP (maximal intensity projection) image
Adjust image contrast: the image contrast will be adjusted when the user drags
rectangle in the view panel. It works when none of the manual editing functions is
selected. This adjustment is only for visual purpose.
4. View Mode
•
•
•
•
View Spine Boundary:
view the boundaries of detected spines. Blue means
valid, yellow means deleted, while cyan means this spine is clicked (cyan won’t
show in manual editing model).
View Spine Label:
view spine label information on image.
View Dendrite Boundary:
view the boundaries of detected dendrite. Draw with
color red.
View Dendrite Backbone:
view the backbone of the dendrites. Draw with
color magenta.
All the above modes can be viewed individually or in a combination mode,
superimposed on either original image (View Raw) or projected image (View Project).
If the image has been processed by both two algorithms, different results can be
viewed by selecting “CADMOS” or “MADMOS”.
5. Manual Edit
•
•
•
•
•
•
•
•
•
Erase spine: To erase/un-erase a spine, left-click on that spine, to erase/un-erase
all the spines attached to a dendrite piece, left-click on the dendrite piece.
Add spine: To add a spine, left-click once to change the mouse cursor to cross
shape; then left-click at a desired location as one spine-neck point; move mouse
around the spine, and then right-click or double click to finish the boundary
drawing. If the “Left_Ctrl” key is pressed, the nearest detected spine boundary
point will be searched as the current point. User will need to confirm the adding.
Split spine: To split a spine, left-click once to change the mouse cursor to cross
shape; then left-click at a desired location on one spine boundary point; then
right-click on another boundary point of the same spine to draw a line to split the
spine. User will need to confirm the split after the selection.
Erase Dendrite Boundary: To erase part of dendrite boundary, left-click once to
change the mouse cursor to cross shape; then left-click a dendrite boundary point
(note: this point does not need to be exactly the boundary point, but must be close
enough to a boundary point, the program is able to automatically find the nearest
boundary point around the clicked point), move mouse to select a segment, then
right-click or double click to erase it. User need to confirm after the selection.
Add Dendrite Boundary: To add a segment of dendrite boundary, left-click once
to change the mouse cursor to cross shape; then left-click at a desired location and
move mouse slowly (note: too fast mouse moving may result in some boundary
points missing), then right-click the desired ending location to connect them. If
the “Left_Ctrl” key is pressed, the program will automatically connect the nearest
detected dendrite boundary points. User will need to confirm the adding after the
selection.
Erase Dendrite Backbone: To erase part of dendrite backbone, left-click once to
change the mouse cursor to cross shape; then left-click at a location close to the
dendrite backbone, move mouse to select the segment, then right-click or double
click to select it. User will need to confirm the erasion after the selection.
Add Dendrite Backbone: To add part of the dendrite backbone, left-click once to
change the mouse cursor to cross shape; then left-click at a desired location as one
backbone point, move mouse slowly, then right-click at a desired location as the
other backbone point to connect them. If the “Left_Ctrl” key is pressed, the
program will automatically connect the nearest detected dendrite backbone points.
User will need to confirm the adding after the selection.
Save Manual Changes: To save the manual editing results in a separate .mat file.
Discard Manual Changes: To discard all manual editings.
6. Feature
• Dendrite Len:
total dendrite length in the image stack (micron)
•
•
•
•
•
•
•
•
•
Total Spine Num:
Spine Label:
Spine Status:
Spine Area:
Spine Length:
Sp Neck Wid:
detached spines
Spine Peri:
Spine Class:
Spine Head Wid:
7. Image Status
• Current image/dir:
directory
• Auto Processed:
• Manual Edited:
otherwise N/A.
number of currently marked spines
label number of a certain spine
if the spine is removed as “Deleted”
area of a certain spine (micron2)
length of a certain spine (micron)
width of the neck of a certain spine (micron); 0 for
perimeter of a certain spine (micron)
class of spine based on the spine length.
the maximum width perpendicular to the length
the name of the loaded image / the name of the loaded
Yes if the loaded image has been processed, otherwise N/A.
Yes if the loaded image has been manually edited,
8. Toolbar
Load an
Image
Save
Results
Save
Single
Close
Current Directory Process Zoom
Image
In
Batch
Load
Export
Directory
•
•
•
•
•
•
•
•
•
•
•
Close
Image
Exit
Batch
Process
Pan
Zoom
Out
Load an Image:
load single 3D neuron image stack or a single 2D image to
display, process, etc.
Load Directory:
load directory of neuron images to be batch processed
Save Result:
save the statistical information of the current image in excel
file.
Batch Export:
save the statistical information of the images in current
folder in two excel file. One is a single summary Excel file listing for each image,
the other is an Excel file with compiled spine data from all images
Save Current Image: save the current displayed figure as a bitmap image
Close Image Stack: close the current image.
Close Directory:
close the directory.
Exit:
quit NeuronIQ
Single Processing: processing single 3D neuron image.
Batch Processing:
processing all the 3D neuron images in current directory.
Zoom in / Zoom out /Pan
How to use NeuronIQ to process images:
1. Single Processing
1.1 Load image
1.2 Select algorithm & Set parameter
1) Algorithm Selection
CADMOS or MADMOS
2) Setting Parameter
If
•
•
•
•
•
•
•
•
CADMOS is selected, 10 parameters in Region 2 can be adjusted:
Micron/Pixel
MinSpLen(Micron)
Min STD
Max STD
MaxSTD > MinSTD. MaxSTD should not be too high. We
advised that MaxSTD is set under the “view project” model and MaxSTD < 10.
Low Thr
Upp Thr
Lnk Rad
Lnk Dir
•
•
MinSpLen(Pixel)
MaxSpLen(Pixel)
If MADMOS is selected, 2 parameters in Region 2 can be adjusted:
• Micron/Pixel :
• MinSpLen
:
1.3 Single processing
By press “single processing” button in Toolbar or “MenuÆAnalysisÆSingle
Processing”
1.4 View Result
1. If this image has been processed both by CADMOS and MADMOS, different result
can be viewed by changing in the Algorithm “CADMOS” or “MADMOS”.
2. The “Feature” block show the statistical information of the clicked spine with the cyan
color.
This figure shows the result of MADMOS in combined mode under “View Project”.
This figure shows the result of CADMOS in combined mode under “View Project”.
1.5 Manual Change
Including:
•
•
•
•
•
•
•
Erase Spine
Add Spine
Split Spine
Erase Den Boundary
Add Den Boundary
Erase Den Backbone
Add Den Backbone
Enter manual editing mode by clicking the button. Click the selected manual editing
button again if you want to quit manual editing mode.
1.6 Save Result
Press the “save result” button in the Toolbar, an excel file with the statistical information
will be saved.
1.7 Close Image Stack
2. Batch Processing
2.1 Load Directory
2.2 Algorithm Selection & Parameter
Same with Single Processing
2.3 Batch Processing & batch export
Two excel file will be generated:
Excel file 1: Statistical information of spines for all the images in current folder.
This file would report for each spine: spine length, spine head width, spine neck width,
spine head area, spine head perimeter and spine classes.
Excel file 2: Summary for all the images in current folder
This file listing for each image: dendritic backbone length, spine count in each class, total
spine count, spine density by class (=spine count in spine class N / dendritic backbone
length), total spine density (=total spine count / dendritic backbone length).
2.4 Close Directory
Press the “Close Directory” button in the Toolbar.
Note: During the batch processing, if some images can’t be processed by NeuronIQ, the
file names will be stored in “Error.txt”.
Reference
[1] J. Cheng, X. Zhou, E. Miller, R. M. Witt, J. Zhu, B. L. Sabatini, and S. T. Wong, A
novel computational approach for automatic dendrite spines detection in two-photon laser
scanning microscopy. J. of Neurosci. Methods 165: 122-134 (2007)
[2] Y. Zhang, X. Zhou, R. M. Witt, B. L. Sabatini, D. Adjeroh, and S. T. Wong, Dendritic
spine detection using curvilinear structure detector and LDA classifier. Neuroimag. 36:
346–360 (2007)