1
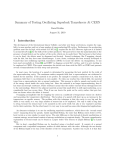
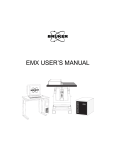
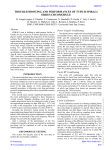
Additional Techniques
5
This chapter provides instructions for procedures that are routine
for some users, but may be infrequently encountered by others.
Specifically, the chapter will describe manually tuning the EMX
spectrometer, changing cavities, fine tuning the AFC, and performing automated 2D experiments.
Manually Tuning a Microwave Bridge
5.1
The Auto Tune routine of the EMX software is effective at tuning the cavity and bridge under most circumstances. However,
there are some circumstances where automatic tuning may have
difficulties. Lossy samples such as water can be problematic,
particularly when you work at high microwave power levels.
Following these instructions will help you to tune the spectrometer under these adverse conditions.
A klystron bridge
requires approximately
three minutes to warm
up after the console is
turned on. When the
Stand By indicator is
green, the software
allows you to switch to
Tune mode.
EMX User’s Manual
1.
Open the Microwave Bridge Control dialog box.
If this window is not already open, click its button (the
button labeled MW) in the tool bar. The button toggles the
dialog box open and closed. The microwave bridge control dialog box will then appear. (See Figure 5-1.)
2.
Switch the microwave bridge to Tune mode. The
bridge status indicator shows the three states or modes for
the microwave bridge, Stand By, Tune, and Operate.
(See Figure 5-1.) In Stand By the power to the microwave source is shut off. When you switch to Tune, the
source turns on and you produce a frequency sweep that
allows you to see the dip of your cavity. Switching to
Operate causes power only at the resonant frequency to
be transmitted to the cavity. When you turn on your spectrometer, it should be in Stand By mode, which is indicated by Stand By appearing in the Microwave Bridge
Control menu. (See Figure 5-1.) If you have been acquir-
Manually Tuning a Microwave Bridge
AFC & Diode
Meter
Microwave
Bridge
Control
Button
Tune
Button
Frequency
Slider
Bias
Slider
Signal
Phase
Slider
Figure 5-1
Attenuation
Display
Iris
Buttons
The Microwave Bridge Control dialog box.
ing spectra already, your bridge will probably be in Operate mode. Click the Tune button in the dialog box to
change to the Tune mode.
3.
Yo u may notice that
LEVELED
and
U N C A L I B R AT E D
appear in the bridge status indicator. Do not be
alarmed
by
the
UNCALIBRATED indicator; this is normal
during Tune.
5-2
Set the microwave attenuator to 25 dB. The microwave attenuation is set by clicking the arrows on either
side of the attenuation display. (See Figure 5-1.) The
arrows on the left side change the attenuation in 10 dB
steps; the arrows on the right side change the attenuation
in 1 dB steps.
Manually Tuning a Microwave Bridge
There are two types of
microwave sources. The
letter G in the microwave bridge designation
(i.e ER 041 XG) on the
front panel identifies a
Gunn source. The letter
K designates a klystron
source. Perhaps the surest method to identify
the type of source is by
comparing the mode
pattern with either
Figure 5-2
or
Figure 5-3.
EMX User’s Manual
4.
Observe the mode pattern on the display monitor. (Gunn Diode Microwave Sources) This mode
pattern is a display of the microwave power reflected
from the microwave cavity and the reference arm power
as a function of the microwave frequency. The mode pattern should resemble one of the mode tuning patterns in
Figure 5-2. If the mode pattern amplitude is too small,
increase the microwave power in 1 dB steps by decreasing
the attenuation. If the mode pattern amplitude is too large,
decrease the microwave power in 1 dB steps by increasing
the attenuation.
5.
Observe the mode pattern on the display monitor. (Klystron Microwave Sources) This mode pattern is a display of the microwave power reflected from
the microwave cavity and the reference arm power as a
function of the microwave frequency. The mode pattern
should resemble one of the mode tuning patterns in
Figure 5-3. If the mode pattern amplitude is too small,
increase the microwave power in 1 dB steps by decreasing
the attenuation. If the mode pattern amplitude is too large,
decrease the microwave power in 1 dB steps by increasing
the attenuation.
5-3
Manually Tuning a Microwave Bridge
Figure 5-2
Mode tuning patterns for a Gunn
diode microwave
source.
a)
b)
c)
d)
e)
f)
a) Off resonance.
b) Slightly off resonance
c) On resonance,
phase 180° off.
d) On resonance,
phase 90° off.
e) On resonance,
correct phase,
undercoupled.
f) On resonance,
correct phase,
overcoupled.
g) On resonance,
correct phase,
critically coupled.
g)
5-4
Manually Tuning a Microwave Bridge
Figure 5-3
Mode tuning patterns for a klystron
microwave source.
a)
b)
c)
d)
e)
f)
a) Off resonance.
b) Slightly off resonance
c) On resonance,
phase 180° off.
d) On resonance,
phase 90° off.
e) On resonance,
correct phase,
undercoupled.
f) On resonance,
correct phase,
overcoupled.
g) On resonance,
correct phase,
critically coupled.
g)
EMX User’s Manual
5-5
Manually Tuning a Microwave Bridge
6.
Tune the microwave source. Adjust the Frequency
slider bar to locate and center the mode pattern “dip” on
the display monitor. Clicking the left or right arrows will
step the parameter value downwards or upwards. Clicking
to the left or right of the square steps the parameter value
downward or upward faster than when using the arrows.
Keeping the mouse button pressed repeats the action automatically. The value of the parameter is indicated graphically by the position of the square in the slider bar. You
can also vary the parameter by clicking and dragging the
square. The “dip” corresponds to the microwave power
absorbed by the cavity, and thus, is not reflected back to
the detector diode. By centering the “dip” on the display
monitor, the microwave source is set to oscillate at the
same frequency as the cavity resonant frequency.
7.
Clean the sample tube to be inserted into the
cavity. Wiping the outside of the sample tube with tissue
paper is usually adequate. It is vital to avoid contaminating the microwave cavity as paramagnetic contaminants
may result in spurious EPR signals or distorted base lines
in your EPR spectra.
The resonant frequency
of a Bruker ER 4102ST
cavity is usually
approximately 9.8 GHz.
A cryostat will drop the
frequency to approximately 9.4 GHz.
5-6
Manually Tuning a Microwave Bridge
8.
Insert the sample tube carefully into the cavity.
(See Figure 5-4.) Make sure you have the appropriate
collet size for your sample tube size. The tube should be
slightly loose before you tighten the collet nut. The bottom of your sample should rest in the indentation on the
pedestal. This ensures that your sample is centered horizontally. If you have a small sample (less than 2 cm in
length), you should visually judge how far the tube should
go into the cavity in order to vertically center the sample
in the cavity. You can adjust the sample position by loosening the bottom collet nut and moving the pedestal up
and down. Make sure that the pedestal is not in the cavity,
as it can give an EPR signal. Tighten the top collet nut to
firmly hold the sample tube in place and the bottom collet
to firmly hold the pedestal.
Sample
Tube
Collet and
Collet Nut
Pedestal
Cavity
Figure 5-4
EMX User’s Manual
Cutaway view of a Bruker ER 4102ST cavity.
5-7
Manually Tuning a Microwave Bridge
Steps 10 and 11 assume
you have bias in the reference arm. (You usua lly do! ) If the Bias
slider
bar
(See
Figure 5-1.) is all the
w a y t o t h e l e f t s i de ,
move it towards the middle to ensure sufficient
bias. Otherwise, leave it
be.
5-8
9.
Retune the microwave source. Repeat the procedure
of Step 6. You may notice a shift in the frequency, width,
and depth of the cavity “dip” when you insert the sample.
This is an indication that the microwave field patterns in
the cavity are perturbed by the sample and tube. Lossy
and conductive samples will appreciably perturb the field
patterns, resulting in large shifts in the resonant frequency.
Highly conductive samples tend to increase the resonant
frequency by decreasing the effective cavity volume.
Lossy samples will decrease the resonant frequency
because of their large dielectric constants.
10.
Tune the signal (reference) phase. (Gunn Diode
Microwave Sources) While the “dip” is in the center
of the display, adjust the Signal Phase slider bar (See
Figure 5-1.), until the depth of the dip is maximized and
the “dip” looks somewhat symmetric. (See Figure 5-2.)
We shall fine-tune this phase later, but this procedure gets
us close to the correct phase.
11.
Tune the signal (reference) phase. (Klystron
Microwave Sources) While the “dip” is in the center
of the display, adjust the Signal Phase slider bar (See
Figure 5-1.), until the shoulders on each side of the “dip”
appear to be approximately the same height and the “dip”
looks somewhat symmetric. (See Figure 5-3.) We shall
fine-tune this phase later, but this procedure gets us close
to the correct phase.
Manually Tuning a Microwave Bridge
EMX User’s Manual
12.
Fine-tune the microwave source frequency. Click
the Operate button in the dialog box to change to the
Operate mode. Adjust the Frequency slider bar until the
needle of the AFC meter is centered. You can locate the
AFC meter by referring to Figure 5-1. Sometimes the
needle may rush off to the right or left edges of the meter.
This happens when the AFC (Automatic Frequency Control) is no longer locked. If this happens, click the Tune
button to return to the Tune mode. Repeat Step 9. and
then try again.
13.
Adjust the bias level. Change the microwave attenuation to 50 dB. Adjust the Bias slider bar (See
Figure 5-1.), until the Diode meter needle is centered.
Yo u can loc ate the D iod e me ter by refer ring to
Figure 5-1. The center corresponds to 200 microamperes
of diode current. Sometimes, particularly when the cavity
has a low Q, the AFC meter may rush off either to the
right or left and lose lock at 50 dB. In most cases, the AFC
will lock again at higher microwave power levels. If not,
switching between Operate and Tune modes and back
again at 30 dB attenuation will lock the AFC once more.
14.
Match the cavity. For maximum sensitivity, we need to
critically couple (or match) the cavity to the waveguide.
Critical coupling results in a maximum power transfer
between the waveguide and the cavity. It also means that
no incident microwaves are reflected back from the cavity. If the cavity and waveguide are truly matched, the
reflected microwave power seen by the detector should
remain constant (i.e. 0) when we vary the attenuation.
This is the criterion we use for critical coupling. You
control the coupling or matching of the cavity by adjusting the iris screw. First, increase the microwave power by
10 dB. (i.e. attenuator setting 40 dB). Click the ↑ or ↓ iris
buttons for the iris screw motor until the diode current
again returns to 200 microamperes. (i.e. The needle is
5-9
Manually Tuning a Microwave Bridge
centered.) Repeat the procedure (-10 dB steps in the attenuator setting and adjust the current to 200 microamperes
with the iris screw) until you have reached an attenuator
setting of 10 dB. You will notice that as you increase the
microwave power, the diode current becomes more sensitive to the position of the iris screw. Another thing you
may notice is that the AFC meter also changes with the
iris screw position. Simply adjust the frequency slider bar
until the needle is centered again. When you have reached
10 dB microwave attenuation, adjust the Signal Phase
slider bar until you achieve a local maximum in the diode
current. You should not have to adjust it very much. Verify that you have achieved critical coupling by changing
the microwave attenuation from 10 dB to 50 dB with virtually no change in the diode current. Repeat the matching
and bias level adjustment procedures if necessary. If you
need to operate at power levels greater than 20 mW (10
dB), set the attenuator to 0 dB and once again adjust the
diode current to 200 microamperes with the iris screw.
The current can sometimes drift because the high microwave power starts to heat the sample. If this happens, wait
a minute or two and readjust the coupling.
5-10
Changing EPR Cavities
Changing EPR Cavities
1.
5.2
Open the Interactive Spectrometer Control dialog box. If this window is not already open, click its button (See Figure 5-5.) in the tool bar. The button toggles
the dialog box open and closed. The Interactive Spectrometer Control dialog box will then appear. (See
Figure 5-6.)
Microwave
Bridge
Control
Button
Figure 5-5
Interactive
Spectrometer
Control
Button
The Interactive Spectrometer Control button.
Figure 5-6
EMX User’s Manual
The Interactive Spectrometer Control dialog box.
5-11
Changing EPR Cavities
Setting the magnetic
field to the minimum
value avoids the risk of
magnetizing your watch
when changing cavities.
2.
Set the modulation amplitude to zero. Enter a value
of 0.00 in the Modulation Amplitude box.
3.
Set the magnetic field to the minimal value. Enter
in a value of 0.00 in the Sweep Width box and a value of
0.00 in the Center Field box.
4.
Close the Interactive Spectrometer Control dialog box. Click the Interactive Spectrometer Control
(the button labeled I) in the tool bar. The button toggles
the dialog box on and off. The Interactive Spectrometer
Control dialog box will then disappear. (See Figure 5-5
and Figure 5-6.)
5.
Open the Microwave Bridge Control dialog box.
If this window is not already open, click its button (See
Figure 5-5.) in the tool bar. The button toggles the dialog
box open and closed. The Microwave Bridge Control
dialog box will then appear. (See Figure 5-7.)
Attenuation
Display
Stand By
Button
Iris
Buttons
Figure 5-7
5-12
The Microwave Bridge Control dialog box.
Changing EPR Cavities
6.
Switch the microwave bridge to Stand By mode.
Click the Stand By button in the dialog box to change to
the Stand By mode. (See Figure 5-7.)
Waveguide
Screws
Iris
Motor
Waveguide
Gasket
Nitrogen
Purge
Port
Iris
Motor
Shaft
Iris
Screw
Modulation
Cable
Figure 5-8
EMX User’s Manual
Connections on the ER 4102ST cavity.
5-13
Changing EPR Cavities
Store the lock nut in a
place where it will not
be lost.
7.
Disconnect accessories. If a variable temperature
dewar assembly is installed, disconnect the coolant transfer line and the thermocouple connections from the cavity.
8.
Disconnect the modulation cable from the cavity.
This is the twinax cable labeled with a white connector
and attached to the front of the cavity. (See Figure 5-8.)
9.
Disconnect the nitrogen purge line from the port
on the waveguide. The port is half way down the
waveguide attached to the cavity. (See Figure 5-8.)
10.
Disconnect the iris motor shaft from the iris
screw. First unscrew the lock nut from the iris screw. Lift
the shaft upwards to disconnect. Move the iris motor to
the side where it is out of the way. (See Figure 5-9.)
Iris
Motor
Shaft
Lock
Nut
Iris
Screw
Figure 5-9
5-14
Disconnecting the iris motor shaft from the
iris screw.
Changing EPR Cavities
11.
Disconnect the cavity. (See Figure 5-8.) While grasping the waveguide attached to the cavity with one hand,
unscrew the four waveguide screws joining the two sections of waveguide. Loosen the waveguide stabilizers
rotating the screws and carefully remove the cavity from
the air gap of the magnet. (See Figure 5-10.) Take care
not to lose the gasket which was between the two wave
guide flanges. Seal the cavity with the solid collets and
put the cavity in a safe clean place.
Figure 5-10
12.
Install the waveguide stabilizers on the new cavity. (See Figure 5-11.) Visually position them just above
the magnet pole caps.
Figure 5-11
EMX User’s Manual
Loosening the waveguide stabilizers.
Installing the waveguide stabilizers.
5-15
Changing EPR Cavities
Steps 14. and 15. are
use d to set the limit
switches in the iris
m o t o r. T h e l i m i t
switches prevent you
from screwing the iris in
too far and thereby
breaking the iris screw.
Make sure you connect
the modulation cable to
the MOD (modulation)
connector and not the
R.S. (Rapid Scan) connector.
13.
Attach the appropriate size collet and pedestal
on the cavity.
14.
Screw in the iris. Manually turn the iris screw
until it is almost all the way in. The iris screw will
stop rotating. It may be a good idea to back the screw out
1/2 turn after it hits the bottom. This will further decrease
your chances of accidentally breaking the iris screw during the tune procedure.
15.
Click and hold the down Iris Button. Activate this
button (See Figure 5-1.) until the iris motor stops; this is
the lower limit of the motor. With the iris motor in its
lower limit, reattach the iris motor drive to the iris screw.
16.
Connect the modulation cable to the cavity.
17.
Reconnect the waveguide sections and tighten
the stabilizers. Do not forget to install the waveguide
flange gasket between the two flanges; make sure it is oriented correctly. (See Figure 5-12.) Position the cavity in
the center of the magnet air gap by moving the bridge on
the table. Carefully tighten the stabilizers. Be careful not
to stress the waveguide when expanding the stabilizers.
Reconnect the nitrogen purge line and adjust the flow rate
for a light flow.
Figure 5-12
5-16
Installing the waveguide gasket properly.
Changing EPR Cavities
18.
Reconnect the iris motor shaft to the iris screw.
The procedure here is like Step 10. performed in reverse.
Reposition the iris screw motor. Screw the lock nut onto
the iris screw. Click and hold the up iris button in the
Microwave Bridge Control dialog box until the iris
screw is approximately half way out.
Experiment
Options
Button
Figure 5-13
The Experiment Options button.
19.
EMX User’s Manual
Read in the calibration file for the cavity. Open the
Experiment Options dialog box in order to read in the
calibration information. If this window is not already
open, click its button (See Figure 5-13.) in the tool bar.
The button toggles the dialog box open and closed. The
Experiment Options dialog box will then appear. Click
on the Change File button. A new dialog box, Open
Calibration File will appear. Select the appropriate calibration file for your cavity and click OK. This will automatically load the calibration data you have selected.
Confirm that the calibration file is the correct one for the
cavity. The calibration file name usually consists of two or
three letters that identify the type of cavity (ST for
ER 4102ST or TM for ER 4103TM) followed by the
serial number of the cavity. This number is located on
either the front or back of the cavity. Clicking Cancel
returns you to the Experiment Options dialog box.
5-17
Changing EPR Cavities
Change
File
Figure 5-14
The Experiment Options and Open Calibration File dialog boxes.
Service engineers often save the calibration files in the
c:\...\acquisit\tpu directory during the installation of the
spectrometer.
5-18
Fine AFC Tuning for Gunn Diode Bridges
Fine AFC Tuning for Gunn Diode Bridges
5.3
The AFC (Automatic Frequency Control) is the circuitry used to
“lock” the microwave source frequency to the resonant frequency of the cavity. In most cases, particularly if the microwave attenuation is less than 40 dB, the AFC works very well
without any need for you to fine-tune it. If you are performing
experiments in which low microwave powers are required, following the instructions in this section will ensure that you will
obtain optimal AFC performance. Please note that this procedure is not required for klystron bridges. You can determine the
type of bridge you have by looking at the model designation on
the front plate of the bridge. A model designation containing a
G, for example ER 041 XG, indicates a microwave bridge with a
Gunn diode microwave source. In contrast, a bridge with a
model designation with a K, such as ER 041 XK, has a klystron
microwave source.
The Fine-tuning Procedure
EMX User’s Manual
5.3.1
1.
Set the FINE AFC potentiometer to zero. The
potentiometer for the AFC can appear in two different
locations on the bridge depending on when your bridge
was manufactured. (See Figure 5-15.)
2.
Tune the microwave bridge. Follow the procedures in
Section 3.4 for automatic tuning or Section 5.1 for manual tuning. The frequency, bias, phase, and iris screw
should be adjusted so that the needles of the AFC and
Diode meters remain centered as you change the microwave attenuation from 0 to 40 dB. (See Figure 5-16 and
Figure 5-17.) Note that there may be a drift at 0 dB
5-19
Fine AFC Tuning for Gunn Diode Bridges
caused by sample heating if you have a lossy sample in
the cavity.
Fine
AFC
Pot.
Model
Designation
Fine
AFC
Pot.
Figure 5-15
Two possible locations for the fine AFC potentiometer.
Figure 5-16
5-20
Properly centered AFC meter.
Fine AFC Tuning for Gunn Diode Bridges
AFC
Meter
Figure 5-17
3.
The AFC needle drifting towards the right.
Increase the microwave attenuation slowly.
Increase the attenuation in 1 dB increments between 50
and 60 dB until you observe a significant deflection of the
needle. (See Figure 5-19.)
Figure 5-19
EMX User’s Manual
Location of the AFC and diode meters.
Switch the microwave attenuation from 40 dB to
50 dB. The AFC meter may drift to the right. (See
Figure 5-18.)
Figure 5-18
4.
Diode
Meter
A significant AFC needle deflection.
5-21
Fine AFC Tuning for Gunn Diode Bridges
5.
Adjust the FINE AFC Potentiometer. Turn the knob
until the AFC needle is once again centered in the AFC
meter (Figure 5-20.).
Adjust the
needle to the
center
Figure 5-20
5-22
Centering the AFC meter.
6.
Verify that the AFC needle remains centered. Vary
the microwave attenuation between 0 and 60 dB. Note
that there may be a drift at 0 dB caused by sample heating
if you have a lossy sample in the cavity. Also, the needle
may rush off to the left or right at low powers because the
AFC loses lock. In most cases, the AFC will lock again at
higher microwave power levels. If not, switching between
Operate and Tune modes and back again at 30 dB attenuation will lock the AFC once more. Then increase the
attenuation more slowly than the previous time. Repeat
Step 2. through Step 6. until the needle remains centered.
7.
Record the microwave frequency and FINE AFC
potentiometer setting. The setting is microwave frequency dependent and reproducible. If you record the setting at that microwave frequency, you need not perform
this whole procedure every time you use low microwave
power levels. Because only the insertion of a cryostat substantially shifts the microwave frequency, you will typically only need a setting for a cavity with and without a
cryostat.
Performing 2D Experiments
Performing 2D Experiments
5.4
Using the WIN Acquisition software you can perform experiments in which a second parameter (i.e., in addition to the magnetic field) can be varied. For example, you can perform a set of
experiments in which the power is increased incrementally over
several successive field scans. Alternatively, you might perform
several consecutive experiments in which the temperature is
ramped either up or down between each field scan. You can then
display the 2D dataset using WIN-EPR. This section will
describe how to utilize the Acquisition software to create a 2D
data set and how to display it in WIN-EPR. The procedure is
more easily described by performing an example experiment
that investigates the response of the strong pitch spectrum to
microwave power.
EMX User’s Manual
1.
Insert the strong pitch sample. Place the strong
pitch sample into the cavity and tune the spectrometer as
described in either Section 3.4 or Section 5.1.
2.
Open the Experimental parameter dialog box. If
this window is not already open, click its button (See
Figure 5-21.) in the tool bar. The experimental parameter
dialog box will then appear.
3.
Change the Y experiment setting. The Y Experiment setting will probably be set to No Y Experiment.
Change this by selecting MW Power Sweep. (See
Figure 5-21.)
5-23
Performing 2D Experiments
Step
Value
Starting
Microwave
Power
Select
Microwave
Power Sweep
Set the Number
of Scans to 5
Figure 5-21
5-24
Sample parameter settings for acquiring a
2D data set.
4.
Set the starting microwave power to 0.2 milliwatts. Change the power in the power setting box to 0.2
milliwatts. This will be the power that is used to acquire
your first spectra. (See Figure 5-21.)
5.
Use a step value of - 5 dB. By using a negative step
value, the power will increase in units of 5 dB between
each scan. (See Figure 5-21.)
6.
Set the number of spectra to be acquired to 5. In
the Resolution in Y box change the setting to 5. This will
program the spectrometer to acquire 5 scans. (See
Figure 5-21.) Click OK to close the window.
7.
Click on Run to acquire your 2D data set. This will
initiate the first of five scans with the power increasing in
Performing 2D Experiments
units of 5 dB between each scan. You will notice the scan
number updating in the box in the upper right corner of
the spectrum window. (See Figure 5-22.)
Current Scan
Display
Figure 5-22
8.
Current scan display
Transfer your 2D data set to WIN-EPR. By clicking
the WIN-EPR button, you will launch the WIN-EPR progra m a nd aut om ati cally loa d y our data set . (S ee
Figure 5-23.)
WIN-EPR
Button
Figure 5-23
Launching the WIN EPR program from Win Acquisition.
9.
EMX User’s Manual
Display your 2D data set. Select 2D Processing
from the WIN-EPR System menu. (See Figure 5-24.)
Your data should automatically appear as seen in
Figure 5 -2 5. If y our data d oes not appear as in
Figure 5-25, make sure the display mode is set to Stack
Plot. (See Figure 5-26.)
5-25
Performing 2D Experiments
Figure 5-24
5-26
Opening a 2D dataset.
Performing 2D Experiments
Figure 5-25
EMX User’s Manual
Stack plot display of 2D dataset.
5-27
Performing 2D Experiments
Figure 5-26
5-28
Setting the display mode to Stack Plot.
Helpful Hints
6
This chapter contains useful and helpful hints to get the most out
of your EMX spectrometer and its hardware. The first half of
this chapter covers advice on what to do if you do not observe an
EPR signal from your sample. The second half of the chapter
concerns itself with optimizing the performance of the EPR
spectrometer for your particular sample and operating conditions. It is assumed that you are familiar with the material presented in Chapter 2 and Chapter 3.
Hints for Finding EPR Signals
6.1
• Make sure that the spectrometer is functioning
properly. If you followed the directions of Chapter 3, this
should not be a problem. There are many common mistakes.
Is the modulation cable connected properly to the cavity and
console? Is the waveguide gasket installed properly? Is
everything turned on? Advice on troubleshooting is presented in the next chapter.
Cryostats shifts the resonant frequency of the
cavity and hence the
frequency of the spectrometer to a lower
value. The field for resonance of your EPR signals will therefore be
lower than you would
expect for a cavity without a cryostat.
EMX User’s Manual
• Scan over the correct magnetic field range. If you do
not sweep over the correct magnetic field range, you will
miss your signals. This mistake occurs quite often when
using a cryostat in the EPR cavity. Consult literature references to determine approximate g-values for the species in
your sample. You can then choose the appropriate magnetic
field for your sample. Most organic radicals will have a
g-value of approximately 2. This corresponds to a field for
resonance of approximately 3480 Gauss at a microwave frequency of 9.8 GHz. Metal ions can have large departures
from g = 2 as well as large zero-field splittings, making it difficult to guess where the resonance might occur. Performing
a wide scan in your initial experiment will maximizes your
probability of finding the EPR signal.
Hints for Finding EPR Signals
• Finding an EPR signal. Sometimes you may have difficulty finding the EPR signal from an unknown sample or a
sample you are not familiar with. Here we provide two examples of parameter sets that are useful for finding EPR signals
from unknown samples that you suspect will consist of either
an organic radical (See Figure 6-1) or a transition metal ion,
(See Figure 6-2) respectively. These parameters are by no
means optimized, but they will serve to help you find the signal. After you find the EPR signal you need to reset the field
center and scan range. (See Section 4.3.) You also need to
optimize your EPR signal using the method described later in
this chapter. If you still cannot find the signal you may have
to adjust parameters such as the microwave power, modulation amplitude, scan time, etc.
Figure 6-1
6-2
Parameters for finding an EPR signal from
an organic radical.
Hints for Finding EPR Signals
Figure 6-2
Parameters for finding an EPR signal from a
transition metal ion.
• Make sure your sample is positioned correctly in
the cavity. Only the central region of the cavity contributes
significantly to the EPR signal. If you place the sample sufficiently out of this region you may not detect a signal.
• Optimize the sensitivity. You may have a very weak signal in which case you will need to optimize your parameter
settings for sensitivity. The chart on the following page summarizes common factors that are important for getting the
optimum sensitivity from your EPR measurements. The
pages that follow the chart provide a more in-depth discussion of these factors.
EMX User’s Manual
6-3
Hints for Finding EPR Signals
Figure 6-3
6-4
Factors to consider when optimizing your EMX for sensitivity.
Optimizing Sensitivity
Optimizing Sensitivity
Instrumental Factors
6.2
6.2.1
• Minimize microphonics. Microphonics are unwanted
mechanical vibrations in the spectrometer. Depending on the
nature and frequency of the microphonics, these vibrations
may generate noise in your EPR spectrum. The most common microphonic sources include the cavity, the sample and
the bridge. Prevent microphonic noise by securing the
waveguide with the waveguide stabilizers. Rigidly secure the
sample in the cavity by tightening the collets on the cavity
sample stack. Do not place objects on the microwave bridge
that may vibrate or are free to move. Avoid placing a frequency counter with a fan on top of the bridge.
For better spectrometer
stability, keep the spect ro m e t e r a w a y f r o m
windows and ventilation ducts.
• Maintain a controlled environment for the best
spectrometer performance. Air drafts past the spectrometer, especially the cavity, may induce temperature fluctuations or microphonics from sample vibration. Large
fluctuations in the ambient temperature may degrade performance by reducing the frequency stability of the cavity. Very
humid environments may cause water condensation. You can
reduce condensation inside the cavity by maintaining a constant purging stream of dry nitrogen gas. Note that excessive
gas flow rates can generate microphonic noise through sample vibration.
• Minimize electrical interference. Noise pick-up from
electromagnetic interference (EMI noise) may be encountered in some environments. You may be able to minimize
EMI noise by shielding or perhaps by turning the noise
source off if generated by equipment near the spectrometer.
There is often less EMI at night.
EMX User’s Manual
6-5
Optimizing Sensitivity
• Allow the spectrometer to warm-up. One hour is usually adequate to achieve a stable operating temperature. For
maximum stability under extreme operating conditions such
as any combination of high microwave power, high magnetic
field modulation amplitudes, and variable temperature work,
allow the system to equilibrate under the same conditions as
the experiment will be performed.
• Carefully follow the procedure for positioning the
sample inside the cavity. This is particularly important
for samples exhibiting a large dielectric loss. Improper sample positioning can perturb the microwave field mode patterns in the cavity, resulting in less than optimum sensitivity.
• Periodically check the iris coupling screw for tightness of fit. A worn iris screw thread will make the iris susceptible to microphonics which can modulate the cavity
coupling.
• Critically couple the cavity. Best cavity performance is
obtained with a critically coupled cavity. Maximum transfer
of power between the cavity and the waveguide occurs under
this condition.
• Optimize the AFC. Adjust the AFC modulation depth to
minimize the noise level observed in the absorption EPR
spectrum at full incident microwave power. Adjustments of
the AFC MOD LEVEL potentiometer, located on the rear of
the microwave bridge, (Figure 6-4) should be made while in
the Operate mode with the sample inserted and the spectrometer tuned as described in Section 3.4. You should make
this adjustment for all experiments limited by signal to noise
considerations. The optimum AFC modulation depth is a
function of the loaded cavity Q. Consequently, slight variations in the optimum setting may be anticipated. If you are
using a finger dewar with a boiling refrigerant such as liquid
6-6
Optimizing Sensitivity
nitrogen, you should turn the AFC modulation level to maximum.
AFC
MOD
LEVEL
Figure 6-4
Location of the AFC MOD LEVEL potentiometer
Cryostats can protect
your cavity from contamination due to sample tube breakage.
EMX User’s Manual
• Insert a cryostat in the cavity. Quartz has a dielectric
constant of 3.8 but a low dielectric loss. Inserting high purity
quartz sleeves, such as the variable temperature dewar, actually concentrates the microwave magnetic field intensity at
the sample. The increased field intensity produces an EPR
signal that has a larger signal to noise ratio than is achieved
in the absence of the dewar insert. If your experiments
approach the sensitivity limit and your samples are nonlossy
you may benefit from the use of the variable temperature
quartz insert dewar, even if the experiment is run at room
temperature.
6-7
Optimizing Sensitivity
Parameter Selection
6.2.2
• Optimize the receiver gain. You need to have sufficient
receiver gain in order to see all the details in your spectrum.
Figure 6-5 shows the results of insufficient as well as excessive receiver gain. If the receiver gain is too low you will see
the effect of digitization in the spectrum (spectrum b),
whereas at high gain the signals will clip due to an overload
in the signal channel (spectrum c). A good way to automatically optimize your receiver gain is to use the set field center
and field range button in the tool bar as described in
Section 4.3.1. When you draw a rectangle around the entire
spectrum, the receiver gain is automatically set such that the
newly acquired spectrum will fill the display completely.
a
b
c
Figure 6-5
6-8
Effect of using gain settings that are either
(a) optimal, (b) too low, or (c) too high on an
EPR spectrum.
Optimizing Sensitivity
• Optimize the conversion time. The conversion time you
select will affect the dynamic range of your experiments. The
conversion time is actually the amount of time the analog-to-digital converter spends integrating at one field position before moving to the next field value in the sweep. If you
need to resolve lines that are very intense as well as lines that
are very weak (i.e, carbon 13 satellites) within the same spectrum you will need to use a sufficiently long conversion time.
If the conversion time is too short the smaller signals will be
lost in the steps of the digitizer. The conversion time you
select will also determine the sweep time. That is, the sweep
time will be equal to the conversion time multiplied by the
number of data points in the spectrum. (See selecting the
number of data points below.)
• Optimize the time constant for the selected conversion time. The time constant filters out noise; however, if
you choose a time constant that is excessively high relative to
your sweep time, you may actually filter out your signal! You
should adjust your time constant to “fit” the conversion time
you have selected. These two parameters are actually very
related because the conversion time will determine the total
sweep time. You need to use a time constant that will be sufficiently long to filter out undesirable noise yet short enough
that you do not distort your signal. Therefore, if you want to
use a longer time constant you will need to increase the scan
time as well. Figure 6-6 shows the effect of progressively
increasing the time constant while maintaining the same
sweep time. All the spectra are at the same scale. A safe rule
of thumb is to make sure that the time needed to scan through
an EPR signal (i.e. one EPR line) is ten times greater than the
length of the time constant. A time constant that is 1/4 that of
the conversion time will guarantee that your spectrum is not
distorted. However, for samples limited by a low signal to
noise ratio, you may want to make the time constant equal to
the conversion time or greater.
EMX User’s Manual
6-9
Optimizing Sensitivity
a
b
c
d
Figure 6-6
Effect of using a progressively longer time
constant (a-d) on an EPR spectrum.
• Selecting the number of data points. The number of
data points is the other parameter that will determine the
appropriate sweep time. A general rule is to make sure that
you have at least 10 data points within the narrowest line that
you are trying to resolve. This means that for EPR signals
with very narrow lines you will need to increase the number
of data points that are collected for a given field sweep. However, if the lines of your EPR signal are sufficiently wide,
increasing the number of data points will not yield any additional information, but will only result in longer sweep times.
With the EMX you can select 512, 1024, 2048, 4096 or 8192
data points. Remember, you will probably want to increase
6-10
Optimizing Sensitivity
the time constant by a factor of two as you double the number
of data points. Figure 6-7 shows the enhancement in resolution achieved by increasing the number of data points.
a
b
Figure 6-7
Expanded view of narrow lines in an EPR
spectrum using 1024 points (a) or 8192
points (b).
• Optimize the field modulation amplitude. Excessive
field modulation broadens the EPR lines and does not contribute to a more intense signal. Figure 6-8 shows the results
of excessive field modulation. You can see how some of the
smaller lines in spectrum a were lost in spectrum b even after
increasing the modulation only slightly. A good “rule of
thumb” is to use a field modulation that is approximately the
width of the narrowest EPR line you are trying to resolve.
Keep in mind that there is always a compromise that must be
made between resolving narrow lines and increasing your
EMX User’s Manual
6-11
Optimizing Sensitivity
signal to noise ratio. If you have a very weak signal, you may
need to sacrifice resolution (i.e., by using a higher field modulation) in order to even detect the signal. However, if you
have a high signal to noise ratio, you may choose to use a
much lower field modulation in order to maximize resolution.
a
b
c
d
Figure 6-8
6-12
Effect of using progressively higher field
modulation (a-d) on an EPR spectrum.
Optimizing Sensitivity
• Optimize the microwave power level. The intensity of
an EPR signal increases with the square root of the microwave power in the absence of saturation effects. When saturation sets in, the signals broaden and become weaker. EPR
signals with very narrow lines are particularly susceptible to
distortion by excessive power. Figure 6-9 shows the result of
excessive microwave power. You should try several microwave power levels to find the optimal microwave power for
your sample. A convenient way to find the optimum power is
to use the 2D experiment routine described in Section 5.4.
a
b
c
Figure 6-9
EMX User’s Manual
Effect of using progressively higher power
(a-c) on an EPR spectrum.
6-13
Optimizing Sensitivity
• Signal averaging. With a perfectly stable laboratory environment and spectrometer, signal averaging and acquiring a
spectrum with a long scan time and a long time constant are
equivalent. Unfortunately, perfect stability is usually impossible to attain and slow variations can result in considerable
baseline drifts. A common cause of such variations are room
temperature changes or air drafts around the cavity. For a
slow scan, the variations cause broad features to appear in the
spectrum as shown in spectrum b of Figure 6-10. You can
achieve the same sensitivity without baseline distortion by
using the signal averaging routine with a small time constant
and shorter scan time. For example, if you were to signal
average the EPR spectrum using a scan time that was significantly shorter than the variation time, these baseline features
could be averaged out. In this case, the baseline drift will
cause only a DC offset in each of the scanned spectra. Spectrum a shows the improvement in baseline stability through
the use of short time scans with signal averaging when the
laboratory environment is not stable.
a
b
Figure 6-10
a) Signal acquired with short time sweeps
and signal averaging.
b) Signal acquired with long time sweep and
long time constant.
6-14
Troubleshooting
7
This chapter lists some common problems you may encounter
with your Bruker EMX EPR spectrometer. Major hardware malfunctions are not covered. We concentrate on problems due to
operator errors, set up errors, or protective circuitry. The material presented in Chapters 2, 3, and 4 is useful in understanding
much of what is discussed in this chapter. Many problems are
easily solved by the user. The flow diagram on this page will
help you diagnose the majority of problems that occur during the
tuning phase of operation. If you fail to find a solution to your
problem after reading this chapter, call your local Bruker EPR
service representative.
Figure 7-1
Flow Chart for diagnosing problems.
EMX User’s Manual
... not ready!
... not ready!
7.1
• If a warning dialog box appears when you first start the
Acquisition program with a message such as Field Controller not ready! or Signal Channel not ready!, you have
probably forgotten to turn the console power supply on.
No Cavity Dip.
• Waveguide gasket installed improperly.
Figure 5-12 for the proper orientation of the gasket.
7.2
See
• Cavity undercoupled or overcoupled. First, look at the
microwave frequency where you normally expect the cavity
to resonate and then adjust the iris screw for better coupling.
This can occur when working with lossy samples such as
aqueous solutions in flat cells or capillaries.
• You need more microwave power. If you are using
insufficient microwave power, it can be difficult to see the
cavity dip. We recommend setting the microwave attenuator
at 25 dB for the best visibility.
• You are not at the correct frequency. By putting the sample
in, you will cause the cavity to resonate at a lower frequency.
Thus, you will usually need to lower the frequency after you
have placed the sample in the cavity in order to see the dip.
7-2
Tuning Error
Tuning Error
7.3
Both the auto-tune and fine-tune procedures of the microwave
bridge controller will terminate with an appropriate error message if a particular parameter cannot be set or optimized. Here
are the possible error messages.
• Tuning Frequency. Both the upper and lower limits of the
frequency range (i.e., 8.9-9.9 GHz) have been reached and no
defined dip has been detected. Check manually if a dip can be
found. A very slight dip (e.g. very lossy sample) may not be
detected by the auto-tune routine.
• Adjusting Ref. Arm Phase. The full 360° range of the
signal phase has not resulted in an optimal phase setting.
• Adjusting Ref. Arm Bias. The system is unable to set the
diode current to 200 microamperes at 50 dB attenuation.
• Adjusting AFC Lock Offset. The system is unable to set
the AFC lock offset to zero. Check the back of the bridge to
make sure the AFC is on. If this error occurs during
fine-tune, try auto-tune.
• Critically coupling cavity. The iris motor has reached
both of its limit switches and has been unable to obtain a
diode current of 200 microamperes. Check if the iris motor is
still connected to the screw and that the limit switches have
been set properly. (See Section 5.2.) If you are using a flat
cell when this happens, it is likely that you need to adjust the
position of the flat cell. It is easier to optimize the cavity dip
if you adjust the flat cell while you are looking at the tuning
picture. If this error occurs during fine-tune, try auto-tune.
EMX User’s Manual
7-3
No Tuning Picture
No Tuning Picture
7.4
• Tune mode delay period not expired (klystron
bridge only). After you turn on the spectrometer, a delay of
approximately three minutes is required before a klystron
will activate as you switch from Stand By to Tune. This
does not apply to Gunn diode bridges.
• Reference microwave power too low (klystron or
Gunn diode bridge). Carefully adjust the Bias slider bar
of the Microwave Bridge Control dialog box until you
observe a tuning mode pattern on the display.
• Microwave bridge controller automatically switches
from Tune to Stand By (klystron or Gunn diode
bridge). There is insufficient cooling for the microwave
source. The protection circuitry will shut the microwave
source off if the temperature rises too high. Make sure that
the valves for the coolant lines leading to the bridge are open.
(See Section 3.2.) Make sure that the heat exchanger is on
and has sufficient water flow.
• Microwave bridge controller automatically switches
from Tune to Stand By. (klystron bridge only). There
is protection circuitry which protects the microwave source
from voltage spikes. To reset the protection circuitry, turn the
console power off for approximately three seconds and turn it
on again. The voltages used in the Gunn diode bridge are not
sufficiently high to require this type of protection circuitry.
7-4
Unable to Critically Couple Cavity
Unable to Critically Couple Cavity
7.5
• Sample position. If too much of a lossy sample is in the
microwave electric field in the cavity, you will not be able to
critically couple the cavity. Move the sample until the coupling becomes better. The sample position is particularly critical for flat cells and capillaries.
• Microwave reference phase. If the microwave reference
phase is not set properly, you will not be able to critically
couple the cavity. Carefully follow the instructions in
Section 3.4 when tuning the spectrometer.
• Iris motor limits improperly set. If the iris motor limits
were improperly set, the iris can not be screwed in sufficiently. Follow the procedure in Section 5.2 to properly
adjust the iris motor limits.
• Iris tip size. When working with lossy samples, it is advisable to use a larger iris tip to increase the coupling range of
the cavity. This is particularly important when working with
flat cells or capillaries. Contact your Bruker service representative for advice.
EMX User’s Manual
7-5
Magnet Power Supply Shuts Down
Magnet Power Supply Shuts Down
7.6
• Insufficient cooling capacity. Make sure that the heat
exchanger is on and that there is sufficient cold water flowing
through it. Either the Ext. or Temp. warning LED's on the
magnet power supply will light up with this fault.
• Hall probe inserted with the wrong polarity. The magnetic field will go to the maximum field.
• Hall probe fallen out of the magnetic air gap. If the
Hall probe has fallen from the pole piece of the magnet, the
power supply may go to the maximum current value.
7-6
Baseline Distortion
Baseline Distortion
7.7
• Linear baseline drifts. The use of very large modulation
fields can produce large eddy currents in the cavity side
walls. These currents can interact with the magnetic field to
produce a torque on the cavity and create a resonant frequency shift. A linear field dependent or modulation amplitude dependent baseline is indicative of such an effect. This
phenomenon should not be observed if the cavity end plates
are properly fitted and torqued. Do not attempt to adjust the
torque on the plates. Contact your local Bruker EPR service
representative.
• Slowly and randomly varying baseline. The use of
high microwave power or large modulation fields can heat
the cavity and the sample. The ensuing thermal drifts in the
coupling of the cavity, as well as the frequency of the cavity,
can result in a fluctuating offset in the signal. Allow the tuned
cavity and sample to come to thermal equilibrium before performing the final tuning of the cavity. Once the cavity is
equilibrated and properly tuned under the equilibrated condition, you can start acquiring a spectrum. Avoid air drafts
around the cavity, as they can randomly change the temperature of the cavity and sample and hence, the baseline of the
spectrum.
EMX User’s Manual
7-7
Baseline Distortion
• Variable temperature operation. Cavity frequency and
coupling instability may be induced during variable temperature operation, especially at very low or very high temperatures. Increase the flow rate of the cavity and waveguide
purging gas as the operating temperature departs further from
room temperature. Wait for the cavity to stabilize at each new
operating temperature before recording the spectrum. Retune
the cavity to compensate for any frequency shift and
re-establish critical coupling at each temperature.
• Background signal. Your cavity, cryostat, sample tube, or
sample may be contaminated. Call your local Bruker EPR
Service representative for advice. Never take the cavity apart
to clean it.
7-8
Excessive Noise Output
Excessive Noise Output
7.8
• Electromagnetic interference. Verify that laboratory
equipment is not a source of electromagnetic interference
(EMI). If possible, turn off all other equipment in the laboratory and observe spectrometer noise output. Determine if
radio, microwave, or TV broadcasting stations are operating
in proximity to the spectrometer. Record the noise level while
operating at various times of the day and night. EMI related
noise will often be reduced at night.
• Power line noise. Check the noise content of the AC
power lines feeding the spectrometer. Line transients or
momentary blackouts will drastically degrade the performance of high gain detection systems such as EPR spectrometers.
• Ground loops. Ground loops are very common and often
difficult to avoid. Disconnect accessory equipment, especially if it is plugged into remote AC outlets and observe the
noise level. Turn off the magnet power supply and observe
the noise level. If the noise level changes during either of
these tests, consult your local Bruker EPR service representative for alternate installation planning.
EMX User’s Manual
7-9
Excessive Noise Output
• Microphonic generated noise. Secure the waveguide
and cavity assembly by using the plastic waveguide stabilizers. Secure the sample firmly in the collet. If you use a cryostat, make sure that the cryostat sits firmly in the cavity.
Make sure that an excessive nitrogen gas flow rate through
the cryostat does not vibrate the sample.
• Worn iris screw. Check for a worn iris coupling screw. An
iris screw that does not fit snugly in the waveguide may generate noise by modulating the cavity coupling. Replace the
worn iris screw with a new one.
• Boiling liquids. If you are using a dewar with a boiling
refrigerant such as liquid nitrogen, you will need to increase
the AFC modulation level.
7-10
Poor Sensitivity
Poor Sensitivity
7.9
• Excessive microwave power. The microwave power
may be set too high, which will cause your sample to saturate. Optimize the power for your sample by recording spectra at a variety of power levels.
• Wrong cavity type for sample. The type of cavity you
use for a particular sample can make a large difference in
sensitivity. Consult the Bruker literature on the full line of
EPR cavities to determine which one is best for your samples.
• Low cavity Q. The cavity Q can be degraded because of
improper sample positioning. Having your sample positioned
in the microwave electric field will reduce the sensitivity by
degrading the cavity Q, especially for samples with high
dielectric loss. This can happen if you are using flat cells or
capillaries. Observe the Q value read-out in the microwave
bridge dialog box when you are adjusting the sample position.
• Cavity not critically coupled. Maximum power is transferred between the cavity and waveguide when the cavity
properly matches the impedance of the waveguide, (i.e., is
critically coupled.). A drastically undercoupled iris will not
transmit power to the cavity and so will not excite EPR transitions. A drastically overcoupled cavity will have a lower Q,
resulting in lower sensitivity. These effects can occur when
using lossy samples such as aqueous solutions or conducting
samples.
EMX User’s Manual
7-11
Poor Sensitivity
• Water condensation. During low temperature operation,
water can condense inside the cavity. Water, being a high
dielectric loss material, will absorb the microwave power in
the cavity and destroy the cavity Q. Avoid condensation by
using a purging nitrogen gas flow through the cavity.
• Signal channel not calibrated. The modulation amplitude and phase of the signal channel may not be properly calibrated. Make sure that you load the proper calibration file
into the data system. Also, make sure that the Calibrated
check button in the Interactive Spectrometer Control dialog box is not un-checked.
• Receiver gain or modulation not optimized. See
Section 6.2.2.
• Sample not positioned properly. Center your sample in
the cavity.
7-12
Poor Resolution
Poor Resolution
7.10
• Microwave power set too high. Saturating microwave
power levels will broaden your resonance line. Verify that the
linewidth is independent of the microwave power level by
recording the spectrum at various power levels.
• Modulation amplitude set too high. Large field modulation amplitudes will broaden your resonance line, particularly as the modulation amplitude approaches the linewidth.
Reduce the modulation amplitude to ensure that the spectrum
is i n de p e n d en t o f th e m o d u l at io n a m pl it u d e . (S e e
Figure 6-8.)
• Modulation frequency set too high. The spectral resolution is limited by the field equivalence of the modulation
frequency used. Reduce the modulation frequency to verify
that the linewidth is independent of the frequency. (See
Figure 2-17.)
• Time constant too long for sweep time. A larger time
constant will begin to filter out the high frequency components of your signal. Consequently, if the sweep rate is too
fast relative to the time constant, the spectrum will appear
distorted and broadened. To avoid this problem make sure
that the time required to sweep through one of your EPR
lines is at least ten times the length of the time constant. (See
Figure 6-6.)
EMX User’s Manual
7-13
Poor Resolution
• Magnetic field inhomogeneities or gradients.
Extremely narrow lines, less than 20 milliGauss, may be limited by magnetic field irregularities. Vary the position of the
cavity in the magnet air gap. If the linewidth changes, check
for magnetic objects in or around the magnet. If possible,
suspend these objects by a string and watch for a deflection
in the same field strength as used in the experiment. Do not
attempt this with the cavity in the magnet. The force of a ferromagnetic object being pulled into the magnet air gap can
cause serious damage to accessories in the air gap.
• Spectrometer not thermally stabilized. Be sure that the
spectrometer has been turned on for several hours. Verify that
the laboratory conditions are within specified limitations, i.e.,
temperature fluctuations, etc.
7-14
Lineshape Distortion
Lineshape Distortion
7.11
• Microwave power too high. The effect of saturating
microwave fields is to broaden the resonance. This is easily
apparent for single structureless lines; however, small splittings may become unresolvable if strongly saturating levels
of microwave power is used. Lower the microwave power
until you obtain a power independent lineshape.
• Modulation amplitude too high. Large field modulation
will broaden the resonance line. Lower the modulation
amplitude to a region where the lineshape is independent of
the modulation amplitude. (See Figure 6-8.)
• Time constant too long for sweep time used. A safe
rule of thumb is that the time required to sweep through an
EPR line should be ten times the length of the time constant.
(See Figure 6-6.)
• Modulation frequency too high. The modulation frequency can determine the resolution of the experiment. The
spectral profile may also change, due to the effect of molecular dynamics, if saturating microwave fields are applied.
These effects are especially pronounced if the motional frequency for the spin dynamics is similar to the applied modulation frequency. The technique of saturation transfer is based
on this mechanism. The spectral profile may change markedly if the modulation frequency is varied while applying
strong microwave fields. (See Figure 2-17.)
• Magnetic field gradients. These may produce highly
asymmetric lineshapes. Reposition the cavity within the magnet air gap to check the magnet for homogeneity. Check for
magnetic objects in or around air gap. Magnetic field inhomogeneity could also broaden the response to obscure splittings by overlapping spectral components.
EMX User’s Manual
7-15
Lineshape Distortion
• Anisotropic g matrix. A highly anisotropic g-matrix naturally produces asymmetric lines.
• Background signal. A strong background signal from
contamination of the EPR cavity or the sample can distort
your EPR spectrum.
• High conductivity. High conductivity exhibited by samples with mobile electrons will result in asymmetric lines
known as Dysonian lineshapes. This results from a mixing of
absorption and dispersion components induced in the sample
itself.
• Lossy samples. If you put large lossy samples in a cavity,
you can also obtain Dysonian lineshapes. Use progressively
smaller capillaries until you obtain a symmetric lineshape.
• Microwave reference phase. The dispersion signal from
easily saturated samples can be very large compared to the
absorption signal. To minimize the contribution of the dispersion signal, carefully adjust the microwave reference phase.
In addition, make sure that the AFC offset is close to zero.
• Magnetic field drifts. Magnetic field drift may produce an
asymmetric or distorted line for samples exhibiting very narrow resonance linewidths. This problem may arise for linewidths less than 20 mG. Use a field-frequency lock system to
eliminate field drift problems.
7-16
Warning Noises
No Signal When Everything Works
7.12
• Check cables. Make sure that all the cables are connected.
Check the modulation cable and the preamplifier cable.
• Sample position. If you have a small sample, make sure
that the sample is centered in the cavity.
• Magnetic field values. Are you using the correct field values to see your EPR signal? If you are using a cryostat,
remember that the microwave frequency drops and hence the
field for resonance will also be lower. Is the Hall probe positioned properly in the magnet?
Warning Noises
7.13
• High pitched noise from the heat exchanger. The
heat exchanger will emit a high pitched noise when it
requires more distilled and deionized water.
• Funny noises from the iris motor. Stop turning the iris
motor immediately. You may be breaking the iris screw.
EMX User’s Manual
7-17