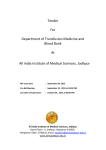
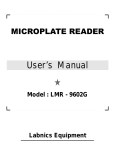
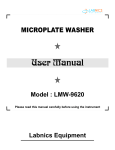
1
DOUBLE BEAM
UV-VIS SPECTROPHOTOMETER
Instruction Manual
Model : LUV-100A
Please read this manual carefully before using the instrument
Labnics Equipment
Table of Content
CHAPTER
1.
1.1
1.2
1.3
1.4
2.
2.1
2.2
2.3
3.
4.
4.1
4.2
4.2.1
4.2.2
4.2.3
4.2.4
4.3
4.3.1
4.3.2
4.4
4.4.1
4.4.2
4.4.3
4.5
4.5.1
4.5.2
4.5.3
4.6
5.
5.1
5.2
5.3
5.3.1
5.3.2
6.
6.1
6.2
6.3
6.4
CONTENT
Preface
Installation
Unpacking
Site Requirements
Installation
Inspection After Installation
Specifications and Main Functions
Basic Parameters of Instrument
Main Specifications
Main Functions
Structure
Operation
Main Menu
Wavelength Scanning Measurement Mode
Parameter Setting
Scanning Measurements
Spectrum Processing
Printing
Photometric Measurement Mode
Parameter Setting
Measurement Running
Quantitative Measurement (Quantitation)
Establishing the Standard Curve
Concentration Measurement
Deleting the Set Standards
Time Scan Mode (Kinetic Measurement Mode)
Parameter Setting
Scan Measurement
Activity Calculations
System Settings
Maintenance
Points for Attention
Measures Taken When Operation of the Instruments is Abnormal
Replacing Lamps
Replacement of Deuterium Lamp
Replacement of Tungsten Lamp
Acceptance of the Instrument
Wavelength Accuracy
Baseline Flatness
100%T noise <O.5%T/3min (at 500nm) :O%T Noise <O.2%T/3min:Appendix A
Service Report
PAGE No.
1
1
2
2
2
2
3
3
3
3
4
4
5
5
5
6
7
8
8
9
9
9
10
11
11
11
12
12
12
13
13
13
14
15
15
16
17
17
17
18
18
19
20
PREFACE
The LUV-100A is a double beam UV-VIS spectrophotometer with scan function. It is widely used in medicine,
environmental monitoring, commodity inspection, food inspection, agricultural chemistry, teaching in colleges and
universities, metallurgy, geology, machine manufacturing, and petrochemical industries. It is also a helpful tool for
analysts to carry out qualitative and quantitative analysis of materials. The main features are as follows:
1.
2.
3.
4.
5.
6.
Fully Automated Operations: automatic change-over between W lamp and D2 lamp, automatic filter
changing, automatic wavelength calibration, auto-controlling W lamp and D2 lamp On/Off, automatic zero and
100% T adjustment.
W lamp and D2 lamp provided with holders, easy replacement of W lamp and D2 lamp.
Friendly interface, abundant operation prompts, convenient and fast operations.
Blue LCD display module with 320 x 240 large screen.
Embedded single-chip micro-processor control system.
Rich and powerful functions:
Main Measurement Modes: WL scan (A, T, E), Photometric measurement (Fixed wavelength
measurement, A, T), Quantitation (Quantitative Measurement, A, C), Time scan (Kinetics
Measurement, A, T).
Powerful Spectrum Processing Functions: Cursor moving and reading, Spectrum zoom,
Spectrum conversion (A-T), Peak-valley picking, Activity calculation, Spectrum printing.
Data Processing Functions: data looking up and data printing etc.
Parameters can be saved for a long time after turning off the instrument.
Spectrum and data can be stored when sudden power failure occurs.
Spectrum and data can be sent to computer via RS-232 interface.
CHAPTER 1. INSTALLATION:Please read the instructions in this chapter carefully before unpacking and installing the instrument.
1.1 Unpacking: While unpacking, please check all parts of the instrument for damage according to the packing list. If any parts
of equipment are missing or damaged, please contact the local dealer immediately.
1.2 Site Requirements:The instrument should be installed in a place that satisfies the following requirements:
1.
Avoid direct sunlight and ensure adequate ventilation.
2.
Do not install the instrument where there may be corrosive gas or excessive dust.
3.
Avoid the place where strong and sustained vibrations occur.
4.
Keep away from devices that generate magnetic or electric fields, or emit high frequency
electromagnetic waves. The instrument should be placed on a stable horizontal weight-bearable
workbench. The back of the instrument should be at least 15cm away from the wall to ensure the
effective ventilation.
5.
Keep away from high-temperature and high-humidity environments.
6.
Room Temperature: 5°C ~35°C.
-1-
7.
8.
9.
10.
Room Humidity: 85%.
Power supply: AC voltage 220V ± 22V (110V ± 10V), Frequency 50Hz ± 1Hz (60Hz ± 1Hz), Total
power consumption: 200W.
Power supply system required by the instrument should be a three-phase and four-line zeroing
protection system.
To ensure the normal and reliable operation of the instrument, it is better to use a purified regulated
power supply.
1.3 Installation:1.
2.
After unpacking, place the instrument on the workbench.
Connecting external cables.
A. Connect the printer interface cable to the corresponding socket on the main unit (if a printer is
equipped).
B. Connect the power cables of the main unit and the printer to an AC outlet.
1.4 Inspection after Installation:WARNING
1. In very cold areas, the instrument should be left alone for 8 hours before turning on the
power to ensure that there is no moisture or condensation inside the instrument and a
temperature balance with the room temperature should be achieved.
2. Before turning on the instrument, examine all cables to ensure correct and secure
connections, the compliance of the power supply with the requirements and the
security of the earthing of the whole system. The instrument can be turned on and
operated when these requirements have been satisfied.
1.
2.
3.
Turn on the printer (If you want to print). For the mini-printer, just connect the power cord.
Turn on the power of instrument (the power switch is at the right side of the instrument). The tungsten
lamp and the deuterium lamp are ignited in sequence (firstly ignites W lamp, after 10 sec. D2 lamp is
ignited). You can hear the click sound of D2 lamp ignition.
The system enter the initialization page after igniting the lamps, initialization starts automatically as
shown in Fig.1
Initializing
W Lamp
D2 Lamp
Filter
Lamp Position
Cell Position
WL Position
Fig 1. Initialization Page
The initialization result is displayed after completing the initialization. If the initialization runs smoothly,
“OK” will be displayed at each item. Press any key (except [RESET] key) to enter the Main Menu. If a
problem is encountered during the initialization, "ERR" will be shown. Press [RESET] key to make the
initialization again. If "ERR" persists after several initialization attempts, please contact your local
dealer for service. Refer to Chapter 4 for the operations of the instrument in details.
-2-
4.
Each time you turn on the instrument, allow the instrument to warm up for 10-30 minutes after
initialisation.
CHAPTER 2. SPECIFICATIONS AND MAIN FUNCTIONS:2.1 Basic Parameters of Instrument:Wavelength Range
Monochromator
Transmittance Range (%T)
Absorbance Range (Abs)
Spectral Bandwidth
Minimum Sampling Interval
Energy Range
:
:
:
:
:
:
:
190 –1100nm
Plane Grating
0%T – 220%T
-0.301A – 3.000A
2nm
0.1nm
0.000V – 9.999V
2.2 Main Specifications:Wavelength Accuracy
Wavelength Reproducibility
Stray Light
Photometric Accuracy
Photometric Reproducibility
Baseline Flatness
Stability
:
:
:
:
:
:
:
0.3nm
≤0.15nm
≤0.1%T (NaI, at 220nm)
0.3%T (0%T – 100%T)
≤0.15%T
0.002A
≤ 0.001A/h (at 500nm, after warming up)
2.3 Main Functions:1.
2.
3.
4.
5.
6.
Self Diagnosis Functions: - The instrument can automatically recognize most of the errors (including
operation error) and gives out prompts or alarms.
Parameters Can Be Saved: - The instrument saves the user-set parameters automatically. The
saved parameters will not be lost after the power is turned off.
Wavelength Scan Measurements (WL Scan):a. Maximum sample collection points: 3000.
b. Maximum scanning speed: 1000nm/min (maximum moving speed 3000nm/min).
c. Minimum sampling internal: 0.1nm.
Fixed Wavelength Measurement Mode (Photometric Measurement):a. Maximum of nine wavelengths can be measured at one time.
Quantitative Measurement Mode (Quantitation):a. First and second order standard curve can be established
b. Concentration direct reading can be made after inputting the curve factors.
c. Providing the analytical methods with single wavelength, double wavelengths and triple
wavelengths
d. Protein/DNA analysis can be made using double wavelengths method.
Kinetics Measurement Mode (Time scan)
a. Time Range: 0 ~ 86400sec. Minimum sampling interval: 1sec.
b. Maximum sampling points: 3000.
-3-
7.
8.
Spectrum Process (Kinetics, Wavelength scan):a. Cursor reading.
b. Spectrum Zoom.
c. Spectrum Conversion.
d. Peak Valley Picking.
e. Spectrum print out.
System Setting:a. Tungsten lamp and deuterium lamp On/Off control.
b. Wavelength re-calibration.
c. Printer type selection.
d. Sample-cell holder selection.
e. Inputting the serial No. of the instrument.
f.
Language selection.
CHAPTER 3. STRUCTURE:Model LUV-100A Spectrophotometer consists of light source, monochromator, sample compartment, detecting
system, motor control, LCD display, keyboard, power supply, micro-processor, RS232 interface and printer port.
The block diagram of the instrument is shown in Fig. 2
Keyboard, Display
Micro Processor
Printer Port
Power Supply
RS232 Interface
Light Source
Main Control
Detecting System
Reference
Monochromator
Sample
Fig 2. Block Diagram of Instrument
CHAPTER 4. OPERATION:Before the operation, please pay attention to the following points :
1. Operation prompt: If a prompt question appears on the screen, press [CE] key to give a negative answer, or
press [ENTER] key to give a positive answer.
2. After entering the function operation, make sure not to press the keys unnecessarily, as this may cause
malfunction of the instrument.
-4-
3.
4.
During measurement running, don't compress the instrument while the sample compartment door must
remain closed.
In the sample compartment, the reference cell and the sample cell should be placed at 90° angle directions,
referring to Appendix C. Pay great attention to the direction of light passing sides of the cells when placing the
cells into the cell holder.
NOTE
The rules of data input are:
1. Only one decimal digit is permitted for wavelength value, T (% T) value and sampling interval.
2. Maximum of three decimal digits are permitted for curve factors K and B, absorbance (A),
concentration (C) and activity coefficient.
3. If a parameter is a range value, input it in the sequence from small to large.
NOTE
1. "Select" type parameter: measurement mode, scan speed, wavelength sampling interval,
switches of W lamp and D2lamp etc. Move the cursor to the corresponding item by pressing the [â
]
and [á
] keys, and select via [ß
] and [à
] arrow keys. If "√
” is used for selecting the items, press
[ENTER] key to select or to delete.
2. "Input & Confirm" type parameter: wavelength range, photometric range, Lamp Changeover
point, etc. Move the cursor to the corresponding item by pressing the [â
] and [á
] keys. Input the
data, which will be displayed on the upper right of the screen. If the entry is incorrect, press [CE] key
to cancel. Otherwise, press [ENTER] to confirm. The newly input data will replace the original data.
3. "Input" type: (WL Num, Std. Num) Move the cursor to the corresponding item by pressing the [â
]
and [á
] keys. And then input the data.
4.1 Main Menu:The main menu is shown in Fig. 3. Press the corresponding numerical keys to enter different operating
modes:Main Menu
WL Scan
Photometric
Quantitation
Kinetics
System Settings
Fig. 3 Main Menu
4.2 Wavelength Scanning Measurement Mode:Wavelength scanning measurement mode can be used for the qualitative analysis of samples. The real-time
spectrum of samples will be displayed on LCD or printed out.
4.2.1 Parameter Setting:In the "WL Scan" menu, press [F1] key to enter the parameter setting menu as shown in Fig. 4
-5-
PARAMETERS
Mode
Scan Speed
Interval
Cell Position
WL From
Y Axis From
Lamp Change
A
Fast
1.0nm
1
200nm to 1100nm
–0.010 to 0.010
340.0nm
Fig. 4 Parameter Setting Page in WL Scan Mode
There are two types of parameter settings:
“Mode", "Scan Speed" and "Interval" are "Select" type parameters, while the rest are all "Input &
confirm" type parameters.
Please pay attention to the following points in parameter settings.
A. Photometric Range:
This parameter refers to the coordinate range displayed on the screen and is not related to the
measurement. If it is selected improperly, the spectrum may not be observed. (The parameter can
be set again by "Spectrum Zoom" function after obtaining the scanned spectrum. The concrete
method will be described later). The photometric measurement range of the instrument is 0%T ~
220%T (or -0.301Abs ~ 3.000Abs). If the setting range is exceeded, an error will be displayed.
B. Sampling interval (Interval):
For complex spectra, smaller sampling intervals should be chosen, as large sampling intervals
may yield distorted spectra. However, excessively small sampling intervals will reduce the scan
speed and range. For scanning the full wavelength range, the minimum sampling interval should
be 0.5nm. Pay attention to select a suitable match of wavelength range and sampling interval.
There are six options for sampling intervals setting: 0.1nm, 0.2nm, 0.5nm, 1.0nm, 2.0nm and
5.0nm.
C. Lamp changeover point (Lamp Change):
Lamp changeover wavelength can be set within the entire wavelength range. Normally lamp
change wavelength should be at 340 nm when measuring the absorbance or the transmittance.
After setting the parameters, press [RETURN] key to enter the wavelength scan main menu.
4.2.2 Scanning Measurements:After setting the parameters, put the reference solution into both reference and the sample cells
and close the sample compartment door. Press [ZERO] key to make the baseline correction. As
complicated sampling computation will be made by the instrument during the baseline calibration,
please wait until "baseline ... " prompt disappears. That shows the baseline correction has been
finished.
After completing the baseline correction, take out the reference solution from the sample cells,
and then put the sample solution to be determined into the sample cell position, close the sample
compartment well, press [F2] key to start measurement.
If the user wants to stop the scan during measurement running, press [CE] key and return to the
wavelength scan main menu ( At this moment, the instrument is making computation. So the key
response may be delayed, it is a normal case).
After the measurement, dynamic display stops, the moment spectrum processing can be performed.
-6-
NOTE: If the baseline measurement (ZERO) has not been preformed before when pressing [F2]
key, a prompt "Press zero first" will appear to ask you to perform baseline correction first. Please
make sure that the reference solution has been put in both the reference and sample cells when
baseline correction is being made.
4.2.3 Spectrum Processing:A.
B.
C.
D.
Cursor Function:
Press".” key, the cursor moves from the left side of the spectrum to the right side, and press [ß
] or
[à
] key to stop and display the corresponding position and data. There are two methods of
moving the Cursor.
a.
Manual: press [ß
] or [à
] key to move one digital point leftwards or rightwards.
b.
Rapid: Pressing numeric keys "0 to 4" corresponds to 5 left-moving speed levels
respectively, while numeric keys "5 to 9" corresponds to 5 right-moving speed levels
respectively. Pressing [ß
] or [à
] key can stop the cursor from moving at any time.
Spectrum Zoom:
After the wavelength measurement, enter the parameter setting page. Modify up-down limits of
Wavelength Range and photometric range. The wavelength range must be in the setting range of
the measurement. Afterwards, return to the wavelength scan menu and press [ß
] or [à
] key to
display the spectrum.
Spectrum Conversion (A-T):
Enter the parameter setting menu, modify the measurement mode, and then return to the
wavelength scan menu. Press [ß
] or [à
] key to display the spectrum after A - T conversion.
Peak-Valley Picking:
1.
Press [F3] key in the wavelength scan main menu to display peak-valley picking page as
shown in Fig. 5
Peak Pick
A
0.001
Meas
Prn
Fig. 5 Pick- Valley Picking Page
2.
3.
On the top of the Peak-Valley Picking page, the threshold sensitivity is displayed following
current working mode. The working mode has been set in parameters page.
The threshold sensitivity is the smallest difference between peak and valley in each group.
Threshold sensitivity is the only standard for peak-valley detection. The threshold should be
selected according to user's requirements. Selecting excessively small values will yield too
many peaks and slow down determination. Excessively large thresholds can result in no
peaks or valleys detection.
-7-
4.
5.
6.
7.
8.
Press numerical keys to input the threshold value. Then press [ENTER] to confirm. The
value can have one or three decimal digit according to the spectrum type.
After inputting the threshold value, press [F2] key to start peak picking. The detected result
will be displayed on the screen if the peaks and valleys are detected. The result includes
peak/valley positions and intensity values.
Four groups of peaks and valleys can be displayed in one page. If several peaks/valleys are
detected, a page display at the lower right of the screen, such as "2-1" will be indicated. The
figure before "-" tells the total number of pages, while that after" -" shows the number of
current page. For example, "2-1" means there are altogether 2 pages displaying the peakpicking results and the current page is the first one. If there are several pages of peak-valley
data, press [ ] or [] key to scroll up and down.
Press [F4] (Print) key to print the peak-valley picking result.
Press [RETURN] key to return to the wavelength scan main menu.
4.2.4 Printing:Press [F4] key to enter the printing state on the wavelength scan page. A prompt line "Printing ... "
appears on the upper right of the screen. If "ERR" is displayed, a problem may occur in the printer or
the printer has not been properly connected. To cancel printing press [CE] key. (Because the system is
busy, key response may be slower than usual). If the printing is abnormal or no spectrum gets prints
out, please verify if the printer selected in "system settings" page is in accordance with the printer
connected.
NOTE
Due to Limitation of the instrument's storage ability, only one spectrum can be stored in the
memory. Therefore, when a new wavelength scan measurement is made, the original spectrum
will be deleted.
4.3 Photometric Measurement Mode:Press the numeric key [2] in the main menu to enter the Photometric Measurement mode (Fig. 6). Multisamples at multi-wavelengths can be measured at the same time in this mode. The maximum wavelength
that can be monitored is nine. Each wavelength corresponds to each sample.
Photometric
Cell
1
2
Abs
T%
Para
Meas
Prn
WL 235.0
WL Num
4
Fig. 6 Main Menu of Photometric Measurement Mode 4.3.1
-8-
4.3.1 Parameter Setting:Press the numeric keys to set the cell numbers and the wavelength numbers. The wavelength is "input
& Confirm" type parameter. If multi-wavelengths determination is made, it is recommended the
wavelength values be set in the sequence from small to large. After parameter setting, press
[RETURN] key to return.
Parameters
Cell Num 7
Lamp Change 340.0
WL Num 4
WL 1
235.0
WL 2
250.0
WL 3
400.0
WL 4
500.0
Fig. 7 Parameter Setting Page in Photometric Measurement Mode
4.3.2 Measurement Running:After setting the parameters, put the reference solution into both reference and the sample cells, press
[ZERO] key to make the baseline correction. After the baseline correction is finished, put the sample to
be determined into the sample cell, close the sample compartment. Then press [F2] key to start the
measurement.
After the measurement, press the [ß
] or [à
] key to look up the measurement results of each
wavelength, or press [F4] key to print out the data.
4.4 Quantitative Measurement (Quantitation):Press [3] key to enter the quantitative measurement menu as shown in Fig. 4-6.
Quantitation
Cell
–1
2
3
Conc
A0.λ
0
A1.λ
1
A2.λ
2
Para
Mea
s
4
5
6
7
Std
Prn
Fig. 8 Quantitative Measurement Menu
-9-
Before quantitative measurement, the standard working curve of absorbance A and concentration C (C = K1 *
A * A + K2 * A + B) should be set up. After a standard curve is set up, the instrument will save the curve formula
automatically. For different kinds of samples and different sample batches, a new standard working curve
should be set up. The user should decide if it is necessary to set up a new curve according to the specific
application.
4.4.1 Establishing the Standard Curve:There are two methods of establishing standard curves:
Parameters
Method
1-WL
K1 Value
0.000
K2 Value
0.000
B Value
0.000
Lamp Change
340.0
WL 0
440.0
C = K1 * A * A + K2 * A + B
Fig.9 Parameter Setting Page in Quantitation Mode
A.
Inputting the factors of the standard curve:a.
Press [F1] key to enter parameter setting page as shown in Fig.9.
b.
There are two types of parameters:
"Select" type:
"Cell Corr." and "Method"
c.
The rest parameters are "Input & Confirm" type.
d.
Input the factors in parameter setting page according to the known curve formula C = K1 * A
* A + K2* A + B. (Among them K1 is the factor of the quadratic term, K2 is the factor of the
first term, B is the constant term or the intercept. When K1 is zero, the curve is a linear one. )
Then input the operating wavelength. The inputting value will be displayed at the upper right
of the screen. Press [ENTER] to confirm.
e.
Press [RETURN] key to return to the quantitation main menu.
B.
Set up the standard curve by measuring standard samples:This method can be performed by first order or second order data regression with up to 24
standard samples.
a)
Press [F3] in the quantitation main menu to enter the standards measurement page, as
shown in Fig. 10 Press [â
] or [á
] key to locate the cursor at the No. of cells in which you
want to put the standards, then press [ENTER] key to select. A "√
” symbol will appear at the
cell No. to show that the cell is selected. Put the standard samples in the corresponding
cells and put the reference in cell No.8, then press [F2] key to start absorbance
measurement. The system will calculate the standard number automatically according to
the measurement times.
- 10 -
Std Data
Cell
–1
2
3
Conc
A0.λ
0
A1.λ
1
A2.λ
2
Data
Mea
s
4
5
6
7
8
Regr
Prn
Fig. 10 Standards Measurement Page
b)
c)
d)
After measuring the absorbance of the standards, press [F1] key to enter concentration
inputting page to input the concentration of the standards. Press [â
] or [á
] key to locate the
cursor at the No. of cells in which you want to put the standards, then press [ENTER] key to
select. A "√
" symbol will appear at the cell No. to show that the cell is selected. Press [à
] key
to move the cursor at "Conc" column and input the known concentration of each standards.
The inputting value will be displayed at the upper right of the screen. Press [ENTER] key to
confirm.
Press [F3] key to select regression order. First and second regression orders can be
selected by pressing [ß
] or [à
] key. Then press [F2] key to get the standard curve.
Press [RETURN] key to return to the quantitation main menu.
4.4.2 Concentration Measurement:In the quantitation main menu, press [â
] or [á
] key to locate the cursor at the No. of cells in which you
want to put the samples, then press [ENTER] key to select. A "√
" symbol will appear at the cell No. to
show that the cell is selected. Put the reference in both sample and the reference cells and then press
[ZERO] key to start baseline measurement. After baseline measurement is completed, put the sample
to be determined in the sample and then press [F2] key to start concentration measurement.
4.4.3 Deleting the Set Standards:In the quantitation main menu, press [F3] key, then [F1] key to enter concentration inputting page. To
clear all the standards, press [CE] key. The system will ask you to confirm deleting. Press [ENTER] to
confirm. Now Press [CE] to cancel. If you want to delete a certain standard, locate the cursor at it, and
then press [ENTER] to delete or recover the data of this standard.
4.5 Kinetics Measurements Mode(Time Scan Measurement Mode):This mode is used to observe a sample's variation with time and to calculate the activity value of the sample in
the selected time period. It is also used to check the stability and the noise of the instrument.
- 11 -
4.5.1 Parameter Setting:a. Press [F1] key to enter the parameter setting menu, the time scan parameters are similar to the
wavelength scan parameters. There are only a few changes: wavelength range changes to time
range, the sampling interval changes to "Input & Confirm" type, and adding the measuring
wavelength (Meas WL) item. The wavelength is an "Input & Confirm" type parameter.
b. In parameter setting, attention should be paid to the following:
The measuring time should well match the sampling interval. For longer measuring time, larger
sampling intervals should be used. If they do not match, an error message will appear on the
screen. The user will need to set them again.
c. After parameter setting, press [RETURN] key to return to the kinetics main menu.
4.5.2 Scan Measurement:Refer to Section 4.2.2 to start scan measurement.
After completing the measurement, perform spectrum processing as described in Section 4.2.3.
CAUTION
The newly scanned time spectrum will overwrite the original one whether it is a time
spectrum or a wavelength spectrum. No warning will be displayed before overwriting.
4.5.3 Activity Calculation:Press [F3] key to enter the Spectrum Process page after completing the measurement, select the
activity calculation to enter the activity calculation page as shown in Fig. 11
Activity Calculation
Time From
To
0.0
1800.0
Coefficient
1.000
Result
x.xxx
Meas
Prn
Fig. 11 Activity Calculation Menu
“Time Range" and "Activity Coefficient" are all "Input & Confirm type" parameters.
After parameters are set, press [F2] key to obtain activity value; press [F4] key to print out parameters
and measured results.
CAUTION
During the activity calculation, new results will overwrite the old. As there is no “Save
Function”, please print out or write them down before hand (activity coefficient can be
saved in memory).
- 12 -
4.6 System Settings:The system setting page is shown in Fig. 12
System Setting
W Lamp
On
D2 Lamp
On
WL Calib
Off
Printer
Cell Num
Serial
Language
PCL5e
8
00000000
English
Fig. 12 System Settings
A.
B.
C.
D.
E.
F.
Press [ß
] or [à
] key to control the tungsten lamp and deuterium lamp On/Off.
WL Calibration: Press [ß
] or [à
] key to set wavelength calibration function on and start wavelength
calibration. Please make sure that the cell holder is empty while performing wavelength calibration.
Printer: To set the type of the printer. "Mini" means the mini printer, which can be order from the
manufacturer; "PCL5e" means laser printer with PCL5e communication protocol.
Cell Number: 8-cell holder and 4-cell long path cell holder can be set as alternatives. After changing a
cell holder, be sure to make necessary setting change here.
Serial Number: It is required when connected with PC.
Language: to set displayed language.
CHAPTER 5. MAINTENANCE:5.1 Points for Attention:1.
2.
3.
4.
5.
6.
7.
All instrument systems must be reliably grounded.
If the stable power system is not provided, a regulated power supply with anti-interference and
purifying capability should be installed to ensure the stable and reliable operation of the instrument.
All of the components and parts on the whole system should never be removed arbitrarily.
The instrument should not be cleaned with organic solvents.
Pay attention to the instrument in areas of high humidity and temperature. The instruments should not
used for a long time in such climatic conditions as should be turned on periodically for drying.
LCD Screen if get damaged once, there is no way to repair it, so be careful while using and don't
extrude and impact it.
If the measurement is made only in the visible range (above 350nm), the deuterium lamp should be
turned off (in System Settings page) after completing the initialization of the instrument in order to
extend its using lifetime.
- 13 -
8.
9.
To improve the operating performance of the instrument, the manufacturer can make some
modifications on the instruments. There may be slight differences between the instrument descriptions
and the actual instrument. Users will not be notified of these modifications.
The instrument is of Class I safety, is designed and tested according to the "JB5517 – 91 Basic safety
requirements for electrical protection of optical instruments". The supplied products are guaranteed for
their safety. To ensure the safe operation, users must comply with the instructions and items for
attention included in this Operating Instruction.
5.2 Measures Taken When the Operation of Instrument is Abnormal:When the instrument is in an abnormal state during operation, the user should carefully observe its behavior
and take a note of it for later use and immediately contact service engineer.
1.
When an error prompt appears on the screen of the instrument, carefully check if there is something
wrong with the operating method, the parameter settings are well matched, the samples are correct,
and the lamp is ignited, etc. If there is no confirmed operating or setting error, attempt operation once
again. If the error persists, contact the vendor for further assistance.
2.
When errors in computer programs are discovered or the system crashes, please check if the installing
conditions are correctly followed as described in the operating manual. If the problem persists, contact
the vendor or a qualified service engineer.
3.
If there is something wrong with the instrument during operation, first refer to the following
troubleshooting table. If the problem cannot be corrected, please contact the vendor or a qualified
service engineer.
Error
No response when switching
on the instrument
W (D2) lamp error during
initialization
Table - 1
Possible Cause
1. The plug may loose.
2. The fuse may be broken.
1. The W (D2) lamp is damaged.
2. There is something wrong with
the power supply circuit of
W (D2) lamp.
Solution
1. Connect the plug well.
2. Replace a new fuse.
Replace with a new W (D2) lamp.
Contact a service engineer.
Error of lamp location, filter
or sample cell
1. The plug may loose.
2. The motor may be damaged.
3. The optical coupler does not
work.
1. Check every plugs and
connections inside instrument
and make sure they are
connected well.
2. Replace with a new motor or
optical coupler.
3. Contact the local dealer.
Wavelength initialization error
1. The light is blocked in the
sample cell.
2. The sample compartment door
was opened during the
initialization.
1. Remove the light-block from
the sample cell.
2. Don't open the sample
compartment door during
initialization.
- 14 -
3. The wavelength shift is too large
or space deviation exceeds the
limitation.
3. Contact the local dealer.
Photometric accuracy and
reproducibility are not
satisfactory
1. The absorbance value of the
sample is too big (>2A).
2. Glass cell is used in UV range.
3. The cell is not clean enough.
4. The sample cell holder is dirty,
etc.
1. Dilute the sample solution.
"Energy is too low" appears.
A prompt "ER" appears
1. A light block is in the sample cell.
2. Glass cells are used in UV range
(below 350nm).
3. The cell is not clean enough.
4. Lamp change wavelength is set
wrongly.
2.
3.
4.
5.
Use quartz cell for UV range.
Clean the cell.
Clean the sample cell holder.
Contact the service engineer.
1.
2.
3.
4.
Remove the blocking element.
Use quartz cells in UV range.
Clean the cells.
Set lamp changeover point
between 340-360nm
5.3 Replacing Lamps:The Deuterium and tungsten lamps are consumable parts having finite lifetime.
If a lamp's operating time has exceeded the normal operating period, the light energy and lamp stability will
deteriorate even if it is still functioning. If the stability and reproducibility of the instrument decreases and this
cannot be traced to vibration, unstable power supply or other reasons listed in Table 5-1, a lamp change is
probably necessary.
The following points should be observed when replacing lamps:1.
When removing the upper cover of the instrument, avoid not pulling the connecting cable on the cover
with force.
2.
Do not touch the optical parts inside the instrument.
3.
If screws drop into the instrument, take them out immediately to avoid short circuits.
4.
During lamp installation, do not touch the lamp window. Fingerprints can contaminate the lamp and
lower the output energy. Lamps can be cleaned with alcohol-soaked absorbent cotton and then dried
with dry absorbent cotton.
5.
When installing the upper cover of the lamp housing and upper cover of the instrument, make sure the
connecting cable of the instrument is not compressed or impeded.
6.
The lamp wiring should be reliably connected and secured, otherwise the performance of the
instrument will be affected.
5.3.1 Replacement of Deuterium Lamp:1. Switch off the instrument and remove the power cord.
2. Remove the upper cover of the instrument according to the following procedure.
I.
Loosen and remove the three screws located at back of the instrument upper cover.
II.
Lift the instrument cover with care and put it at the left side of the instrument. You can see
the lamp housing as shown in Fig. 13
- 15 -
Loosen the two screws
on the W lamp holder
for W lamp replacement
Remove the two
screws for D2 lamp
replacement
Fig.13. Lamp Housing
3.
4.
5.
6.
Detach the upper cover of the lamp housing.
Remove the two screws located on the upper cover of the lamp housing (Be careful! Don't drop
the screws into the instrument. It is not easy to retrieve them). Then take off the upper cover of the
lamp housing. The positions of D2 lamp and W lamp are shown in Fig.13.
Replace the deuterium lamp
Detach the D2 lamp lead-wire plug.
Remove the two holding screws of D2 lamp and then remove the D2 lamp.
Replace a new deuterium lamp onto the holder.
Tighten the two screws to hold the lamp properly.
Plug in the D2 lamp lead-wire plug.
Assemble the upper cover of the lamp housing and the instrument.
Switch on the instrument. If initialization is correct, the replacement of the deuterium lamp is
finished.
5.3.2 Replacement of Tungsten Lamp:1. Set the wavelength at 500nm.( Perform a photometric measurement at 500nm) Switch off the
instrument. Unplug the power cord.
2. Remove the upper cover of the instrument (as described in Section 5.3.1).
- 16 -
3.
4.
5.
6.
Remove the upper cover of the lamp housing (as described in Section 5.3.1).
Replace the tungsten lamp according the following procedures (refer to Fig.5-l)
Detach the W lamp lead-wire plug.
Loosen the two holding screws of W lamp and then remove the W lamp.
Replace a new W lamp onto the holder.
Plug in the W lamp lead-wire plug.
Turn on the instrument. Adjust the vertical position of the W lamp to make the light spot
falling to the centre of the slit. Be careful, the lamp is hot.
Tighten the two holding screws after adjustment.
Assemble the upper cover of the lamp housing and the instrument.
Switch on the instrument. If initialization is correct, the replacement of tungsten lamp is finished.
Note:The wiring of tungsten lamp and deuterium lamp should be done properly. The holding
screws on the wires should be tightened.
CHAPTER 6. ACCEPTANCE OF THE INSTRUMENT:Check the following items after warming up the instrument for 30min.
6.1 Wavelength Accuracy (±0.3nm):Setting parameter in wavelength scanning mode
Working Mode
E
Sampling Interval
0.1nm
Measuring Speed
Fast
Wavelength Range
480nm ~ 670nm
Cell position
1
Photometric Range
0.000~0.600
Sample Cell
empty
Lamp Change WL
700nm
Measure the spectrum of deuterium lamp. Use the cursor to observe the maximum value between two
characteristic peaks. The results should satisfy the requirements of 656.1nm ± 0.3nm and 486.0nm ± 0.3nm.
6.2 Baseline Flatness (±0.002A):Setting parameters in wavelength scanning mode
Working Mode
A
Wavelength Range
200nm ~ 1100nm
Photometric Range
-0.010A - 0.010A
Sampling Interval
1nm
Sample and Reference Cells
Empty
- 17 -
Perform the wavelength scan measurement. The maximum deviation of the scanned spectrum should be in
accordance with the requirement of the baseline flatness.
6.3 100%T noise <O.5%T/3min (at 500nm) :Set parameters in time scan mode
Working Mode
T
Wavelength
500nm
Photometric Range
99.5%T~100.5%T
Sampling Interval
1s
Sample and Reference Cells
Empty
Perform the kinetic scan for 180 seconds; the maximum peak-to-peak value of the spectrum should satisfy
the stipulated requirement. It is 100% T noise of the instrument.
6.4 O%T Noise <O.2%T/3min:Insert the light block into the sample optical path. Change the photometric range to 0%T~0.3%T. The rest
parameters should remain the same with item 3 as described above. The value determined will be 0% T
noise. It should satisfy the stipulated requirement.
Appendix A
Reference Table of Terms and Abbreviations
Terms and Abbreviations
Explanation
Abs, A
Absorbance
T%,%
Transmittance
Conc., C
Concentration (content), unit is decided by standard sample.
E
Energy (normally energy of light source), used only when accepting the
instrument
WL
Wavelength (unit: nm)
M, min
Minute (time unit)
S, s
Second (time unit)
Series Interface (port)
Used to communicate with computer. COM1 must be used.
Spectrum bandwidth
In theory, monochromatic light is required when carrying out material
analysis. In practice, the instrument cannot produce pure monochromatic
light. Instead, it produces light in a wavelength range with certain
wavelengths at the centre. The width of the range is the spectrum
bandwidth. The smaller the spectrum bandwidth, the higher the analysis
accuracy. For smaller bandwidths, though, stability and reproducibility can
deteriorate. If there is no special requirement otherwise, a wider spectrum
bandwidth is suggested to ensure higher stability and reproducibility.
- 18 -
Standard Curve
The standard curve shows the corresponding relationship between the
(Regression Curve)
measured absorbance and concentration. The standard curve can be set
up by measuring the absorbance of standard samples of known
concentration (normally, the absorbance values of the standards should
be less than 1A) or entering the curve factors directly. Generally,
concentration values of samples to be measured should be in the range of
the standards.
The standard user should be distributed evenly across the entire
concentration range.
Appendix B
LUV-100A Sample Compartment Descriptions
8
7
6
5
4
3
2
1
Direction of
optical path
Direction of
optical path
Reference
- 19 -
SERVICE REPORT
Tel.No.:
Customer’s Address :
Fax No.:
Weekly Off.:
Dept.:
Contact Person / Designation :
Time
Date
From
To
System
Configuration
Date :
Model
SR. No.
Serial No.
Status : OK
Installation
Not OK
Warranty
Demonstration
Maintenance
Contract
Repairs
Application
Billable
Calibration
Validation
Courtesy
Nature of Problem :
Observation & Action Taken :
Customer’s Remarks :
Parts Replaced :
Parts Recommended / Action Required : Yes
No
Service Engineer’s Name & Signature
Requisition Number :
Customer’s Name, Signature, Date & Stamp
Page ____ Of ____
- 20 -