1
®
TM
DIAGNOSTIC
ENGINE ANALYZER
63
CONTENTS
Charging Starting
INTRODUCTION ..................................... 1
Amps, Auxiliary Volts ................... 13
SPECIFICATIONS .................................. 1
Ignition Primary
Coil Oscl, Driver, Dwell, .............. 14
OPERATING FEATURES
Display ................................................ 2
Spark Burn / Cylinder
Control Panel ..................................... 2
Burn MilliSeconds ....................... 16
Printer................................................. 2
Burn Slope .................................. 17
Leads and Sensors ............................ 3
Timing Light......................................... 3
Power Balance / Cylinder
Automatic & Manual .................... 18
SETTING UP FOR TESTS
Hookup Guidelines.............................. 4
Cranking Analysis
Basic Setup Steps .............................. 5
Cranking History ........................... 20
Electronic Compression ............... 24
DOING TESTS
Control & Test Keys ............................ 6
PRINTING REPORTS
Auto-Test Sequence.......................... 28
Sensor Test
Visual Inspection Checklist ............... 29
Ohms/diode .................................. 8
O2 Sensor ..................................... 8
ANALYZER SERVICE .......................... 30
Position Sensor .............................. 9
Wiggle Scope ................................. 9
REFERENCE INFORMATION .............. 27
Ford & GM Codes ....................... 10
Fuel Injection
Duty, Hertz & mSec ......................11
Hard Start
Ignition Energy ............................ 12
TYPICAL READINGS ........................... 32
MAGNETIC PROBE TESTS ................. 33
DIESEL TIMING TESTS ....................... 33
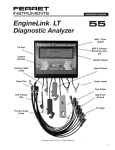
OPERATOR'S MANUAL
FERRET 63
DIAGNOSTIC ENGINE ANALYZER
48 CHARACTER
LCD DISPLAY
ANALYZER
COVER
NOT
SHOWN
TIMING LIGHT
ADVANCE DIAL
2/4 STROKE
SWITCH
HANDLE
COVER
LATCH
TEST
KEYS
CONTROL
KEYS
PRINTER
AUXILIARY
CLIP
red
12 VOLT
BATTERY
CLIPS
PRIMARY
COIL CLIP
green
© Copyright 1994, Ferret Instruments, Inc.
AMP
PROBE
SPARK
PICKUP
OPTIONAL EQUIPMENT
854 - Magnetic TDC Detector
754 - Diesel Injection Detector
INTRODUCTION
SPECIFICATIONS
The Engine Analyzer is a time saving instrument for
troubleshooting automotive ignition, fuel injection and
electrical power systems. It provides computer controlled
measurements that are usually only found on diagnostic
ʻscopes. Measurement methods have been engineered
to reduce hookup effort and give speedy test results.
TEST
ACCURACY
RANGE
Volts, Battery ................. 1% ......... 8 to 18 Battery Volts
Volts, Aux. [10 meg] ...... 1% .......................0 to 20 Volts
Amps, Inductive ............. 3% .............. 0 to +/- 600 Amps
Tachometer .................... 1% ........... 100 to 10,000 RPM
Fuel Injector................ 0.2mS .................... to 63 mSec
Pulse frequency ........... 1% ........................... to 250 Hz
The analyzer is designed for use on 2,3,4,5,6,8,10 and
12 cylinder as well as 2 and 3 rotor, distributor ignition, 2
and 4 stroke, 12 volt automotive engines.
Coil Energy .................. 5% ..... to 90 milliVolt-Seconds
Coil Oscillations
................. to 10 Oscillations
Spark Burn Time ........ 0.2mS ........ to 9.9 milliSeconds
Spark burn slope ..........................................+/- 99 units
Test duration .....................................................Seconds
Cranking ............................................RPM, Volts, Amps
Alternator ...............................................Amps & Ripple
Battery .................................................................... CCA
It has a large LCD display with 2 lines of 24 characters
showing numbers, words and symbols. All test keys display related multiple simultaneous measurements.
Diagnostic messages are given when the analyzer detects combinations of signals which suggest an engine
defect.
A built-in printer records the screen being shown or
prints the data saved from tests. The printout is formatted to make easy before-and-after repair comparisons.
Print options include a vehicle identification form, and
a vehicle equipment visual checklist report to help give
complete repair information to the vehicle owner.
Timing Advance ........... 1.5° .............. to 60.0 Degrees
Dwell, Ignition .............. 0.5° ..........Degrees, %, mSec
Points/Driver Res. ........ 0.1v .......................to 2.5 Volts
Dwell Variation ...................................... to 90.0 Degrees
Timing Variation .................................... to 90.0 Degrees
Cylinder Power Balance .......................% RPM Change
Relative Compression .................. Cranking Amps Peak
For time-efficient testing, an Auto-Test Sequence leads
the user through all of the tests for a complete printed
test report.
Ohms ............................ 5% ................... 1 to 50K ohms
Diode ........................................................ Forward Volts
Position Sensor ........................................ Glitch catcher
O2 Sensor ........................................... Volts & crossings
Wiggle Scope ................................. HI/LO from 3.5 volts
Test leads include a Timing-Advance Strobe Light, an
Inductive Amps Probe, an Inductive Spark Pickup, a 2
clip signal lead set, a power lead set, and an extension
harness, each of which are plug-in field replaceable.
DIMENSIONS
Size ............140 x 350 x 470 mm .......5.5" x 14" x 18.5"
Leads ..................................1.7 m ......................... 5 feet
Extension Harness .............2.5 m ......................... 8 feet
Operation ................... 4° to 44°C ............ 35°F to 120°F
Storage .................... -20° to 60°C ........... -20°F to 130°F
Weight .................................. 8 kg ....................... 18 lbs.
Power Requirement.................................12 Volt Vehicle
Battery
The measurement capabilities of this analyzer were selected to serve the diagnostic needs of the professional
automotive service technician. Because of the complexity and variety of the tests, the user must refer to
the vehicle specific diagnostic manuals to be assured
that correct conclusions are reached. This manual is
limited to describing the features of the analyzer and its
application requirements.
WARNING
It can be hazardous to operate both a moving car and
the analyzer. Get someone to drive the car while you
read the display.
-1-
OPERATING FEATURES
DISPLAY
HOUSING
The 2 by 24 character LCD dot matrix display provides a
versatile screen for the display of multiple sets of meter
outputs as well as data arrayed by cylinder. Contrast can
be adjusted with the SETUP key. A cast acrylic window
protects the display.
AUXILIARY
AUXILIARY
AUXILIARY
AUXILIARY
SENSOR
TEST
FUEL
INJECTION
HARD
START
CHARGING
STARTING
02
TPS
AMP ZERO
MSEC, % DUTY, HZ
SETUP
IGNITION
VOLTS
SELECT
AMPS
VOLTS
The case is designed to be a convenient to use protective enclosure. Rounded corners and the plastic base
were chosen to help guard mechanical and electrical
contact with the battery, engine, and car body parts. In
use, place the unit on a cart, in the engine compartment,
or inside the car. The compartment under the control
panel is made to store the leads and harness.
PER CYLINDER
PER CYLINDER
PER CYLINDER
IGNITION
PRIMARY
SPARK
BURN
CRANKING
ANALYSIS
POWER
BALANCE
COIL
MODULE
DWELL VARIATION
SECONDARY
MSEC
SLOPE
COMPRESSION
BAT. STARTER ALT.
% RPM DROP
AUTO
MANUAL
MESSAGE
PAPER
ADVANCE
PRINT
DISPLAY
PRINT
AUTOTEST
START
CONTROL PANEL
THE TEST KEYS on the top row activate readouts or
initiate tests which require actions by the user to arrange
engine and vehicle test conditions.
A MEMBRANE KEYBOARD controls the analyzer. It is a
pressure sensitive lamination of metalized plastic sheets
with small spaces between contacts. It is very durable
but can be harmed by chemical solvents or punctured by
sharp objects.
BOTTOM ROW KEYS select test options, start action,
and make adjustments.
A BEEPER inside the analyzer indicates contact with
keys and signals warnings.
PRINTER
The printer will capture any displayed data or message
during non-sequenced testing if PRINT DISPLAY is
pressed, and at the end of the sequenced tests it will
print the resulting data and messages from the PRINT
AUTOTEST - Print Data command. If only some of the
data saving tests have been done since power-up, they
will be the only ones printed. PRINT REPORT offers an
AutoTest option to complete a full set of printed tests in
the shortest possible time.
moves the paper feed 2 lines. If it does not feed, lift the
printer cover for better access and try again.
See the Printing Reports section (p28) for more details.
USE BLUE OR
BLACK THERMAL
PAPER 2.25"
(58mm) WIDE.
The PAPER ADVANCE key is used to feed a new roll of
paper into the printer. Once the paper is in place it may
be pulled through to extend the end of a report before
tearing it off. Do not pull the paper backwards through
the mechanism.
To remove cover
press fingers at
both ends and lift
inside edge.
.43" (11mm)
minimum hole.
Only the outside surface of the paper roll is sensitized
for printing, so it must feed from the bottom of the roll
into the mechanism. Getting the paper started is easiest
if the leading edge is cut cleanly. Push it into the slot 2
to 3 cm and press PAPER ADVANCE. Each key press
Paper
Roll
Cover Retainers
Keep dust out of the printer
to prevent accelerated lead
screw wear.
-2-
LEADS AND SENSORS
12 VOLT BATTERY CLIP LEAD SET
This is a multiconductor cable which draws power from
the battery and senses the voltage. It should be the first
set of lead clips connected.
NO
TAG
BLACK
INDUCTIVE AMPS PROBE
The Hall effect Amps Probe senses DC current in wires
without having to disturb connections and without introducing any voltage drop. Up to 20 mm (.75”) diameter
cables may be read. A distinctive arrow is marked on
both sides which indicates the direction of positive current flow for a positive analyzer readout. Materials in
the probe are selected for enduring performance. If
damaged, a new probe may be plugged into the analyzer
without additional service.
RED
–
12 VOLT
+
AMP PROBE
EXTENSION HARNESS
A set of 4 identical cables are sheathed to form a harness to extend the leads enough to reach from a carʼs
interior to the engine. They have color markers for lead
coordination. The long tailed end connects to the analyzer connector. Take care between door panels that it
does not get pinched enough to shear. Any of the leads
may be plugged directly into the analyzer without the
extension.
GREEN
TAG
INDUCTIVE SPARK PICKUP
Cylinder synchronization and tachometer input are the
function of this lead. Features of this easy to use 8mm
wire spark current sensing pickup are dependable spark
pulse detection, ruggedness and plug-in replacement.
The unique design has an easy grip handle and a latching jaw mechanism for durability. The housing is made
of glass fiber reinforced plastic with high temperature
strength and solvent resistance.
RED
TAG
NO. 1
COIL PRIMARY / AUXILIARY LEAD CLIPS
Both clips have a prod tip and an insulation penetrating
pin cluster so they are adaptable to many connections.
The wires are neoprene insulated copper. The red clip
is used for auxiliary tests. The green clip lead, is always
connected to coil primary TACH.
SPARK
PICKUP
RED
YELLOW
TAG
AUXILIARY
GREEN
COIL PRIMARY
TIMING-ADVANCE STROBE LIGHT
ADVANCE DIAL
KNOB
The Timing Light may be used when a spark signal and
power from the analyzer leads are present. Advance settings are controlled and read directly from the calibrated
dial. The 2/4 stroke switch changes the dial calibration
by a factor of 2 for the ignition type.
To measure an engine's spark advance, clean the crank
wheel marks for good visibility and run the engine with
the appropriate test conditions. Turn the advance dial to
about the expected reading, press the light's trigger while
shining the light at the wheel marks, and then adjust the
knob so the marks appear aligned to TDC. The dial setting is the spark advance angle in degrees of crank shaft
rotation.
ENGINE
CRANK
WHEEL
The two trigger buttons control flash brightness. Operation of the analyzer is not affected by the Timing Light so
it may be unplugged any time.
TIMING
MARKS
-3-
2/4 STROKE
ENGINE
SWITCH
HI / LO
FLASH
TRIGGERS
HOOKUP GUIDELINES
SETTING UP FOR TESTS
BATTERY
CLIPS
Color labels for matching the cable connections between
the analyzer and the clips are marked on the panel just
above the connectors. Mismatched connections will
prevent the leads from working, but will not cause harm
under normal conditions.
SPARK
PICKUP
AMP
PROBE
COIL /
AUXILIARY
Take care to find a secure footing and safe lead routing
away from exhaust manifolds and fan belts.
AUXILIARY
red
EXTENSION
HARNESS
SPARK PICKUP
AMP
PROBE
Face Label Side
Toward Plug End
COIL PRIMARY
green
B+
BATTERY
CLIP
LEAD
Make Firm
Battery Connections
and Wiggle Clips
for Clean Contacts.
BLACK
+
–
–
NO. 1
SPARK
PLUG
Put Amp Probe
Around Either
Battery Cable
12 VOLT BATTERY CLIP LEAD SET
These clips must have a solid connection to the battery
terminals. Reliable analyzer operation depends upon a
continuous power source. Intermittent power will reset
the analyzer to its start-up state. It is possible to draw
power from other points in the vehicle wiring, but the
measurements may be misleading because wiring resistance may interfere with the tests.
12-VOLT
BATTERY
RED
+
IGNITION COIL PRIMARY CLIP LEAD
This green clip connects to the ignition coil primary winding minus terminal, sometimes labeled “TACH”. It is the
signal source for all of the ignition measurements, and it
is necessary for ignition suppression.
INDUCTIVE SPARK PICKUP
The best hookup arrangement is to place the pickup
around the spark plug wire, as far from the spark plug as
possible, and with the “Spark Plug” labeled side pointing toward the spark plug end of the wire. Be sure the
pickup magnetic cores are touching.
AUXILIARY CLIP LEAD
This red clip does not have a specific connection for the
basic hookup. It is the input for Auxiliary Volts, Ohms/
Diode readings, Wiggle Scope, and Sensor/Fuel Injector
Pulses. See SENSOR TEST test descriptions for connection locations.
Placing the pickup far from the spark plug keeps it away
from the hot exhaust manifold, and improves performance, because spark current impulses are “cleaner”
near the distributor.
WARNING
Do not run engine with the Auxiliary lead connected
to engine sensors while the spark pickup and coil
primary leads are connected to the ignition. The analyzer leads can couple ignition noise into the engine
computer and disrupt engine operation.
When the pickup is not being used, LEAVE THE JAWS
IN THE OPEN position. The magnetic cores are made of
ferrite ceramic and when kept apart they are more likely
to not break if the pickup is dropped.
-4-
NDUCTIVE DC AMP PROBE
The reading range is 000 to +/-600 amps DC in 1 amp
steps. Starter and alternator output current measurement
is the primary application. It also allows the measurement
of vehicle accessory currents. Placing the probe on the
battery cable, while the engine is off, and then watching
the change when operating switches allows checking
many loads rapidly. Use AMP ZERO to restore the reading to zero before putting the probe around any wires.
PLACE AROUND WIRES
TO MEASURE AMPS
WHEN ZEROING
REMOVE FROM WIRES
(or turn current off)
SETUP STEPS
1. CONNECT ONLY THE BATTERY CLIPS. The Battery Clips must go to the engineʼs 12 volt battery terminals, red clip to plus, black clip to minus. The model
description will be displayed momentarily.
3. Then the Amp Probe reading is zeroed.
The analyzer may give you a choice of languages. Once
a language is selected it cannot be changed until the
analyzer power is disconnected.
The probe should not be around any wires when you
press START. When complete, the analyzer will automatically go to the HARD START test.
2. DO THE SETUP. The display will automatically switch
to the Setup function. The SETUP key is only used to
change settings. Use SELECT for selecting choices.
Press START when the correct selection is displayed
which will advance the analyzer to the next Setup item.
4. HOOKUP THE REMAINING LEADS.
Now see that all analyzer leads are connect, and then
run the engine.
Remove AMPPROBE from CAR
then START
If there is not yet an active signal into the coil primary
clip it will show:
There are 4 selections of contrast for the display. More
"=" makes the display darker
SELECT:====
LCD Contrast
Check Connections!
-Run EngineThe data screen will appear when inputs are active.
then START
356 RPM
IgEgy 38
This is when the operator tells the analyzer about the
engine.
5. PRESS ANY TEST KEY.
If the HARD START test screen shows normal readings indicating that the analyzer hookup is working, we
suggest that you do a general ingine review using the
AUTOTEST at the PRINT AUTOTEST key.
SELECT: Elect./ 4S Sroke
Ignition
then START
The ignition type and engine strokes selection are combined. The combinations are of Electronic or Points
Contact, and 2 or 4 Stroke.
SELECT:
CYLINDERS
msg Bat 10.34
Aux>POS- 1.34
If the analyzer resets on its own check that the Battery clips have good connections. Also, if the engine
has metallic secondary ignition wires, try replacing
the coil to distributor wire for the test with a 10 K to
20 K ohm resistance wire.
4 CYL
then START
Selections are 2,3,4,5,6,8,10,12 CYLinders, and 2 or 3
ROTors.
SELECT: mSec
Dwell Scale
then START
Select DEGrees, mSeconds, or % (percent)
-5-
DOING TESTS
AUXILIARY INPUT TEST KEYS
FUEL INJECTION helps to trouble shoot EFI, PFI, TBI,
and Computer Controlled Carburetor engines. The Duty
Cycle test reads Hertz (Frequency) and Duty Cycle
(Dwell) for use on solenoid equipped carburetors. Also
use for checking pressure, flow, Hall effect, and other
sensors that are specified by these measurements. The
Fuel Injection test measures the milliSeconds of voltage
drive to an injector. See page 11.
Typical features of the tests are the RPM and the Battery
Volts readouts.
1057 RPM
Contrast
msg
Bat 13.84
then START
The RPM reading in the upper left of the display gets the
signal input from the Inductive Spark Pickup. Scaling is
determined by the setup selections.
Use HARD START to find the problem area on a no start
engine. Ignition Energy indicates the ignition's strength.
Auxiliary Volts is used to confirm that voltage is present
at the ignition. RPM and Battery Voltage are used to
measure the performance of the cranking system. Special diagnostics pick out problems with the spark plugs,
wires, cap and rotor. See page 12.
The Battery Volts reading in the upper right display corner
comes from the Battery Clips.
SENSOR TEST has the following sensor and signal
tests. The Ohmmeter can be used for resistance checks
of spark plug wires or components. The Diode test measures forward and reverse diode voltage. The Oxygen
Sensor test measures the activity level of the O2 Sensor
voltage. The Throttle Position Sensor test is a computer
aided test to find intermittent TPS sensors. The Wiggle
Test, and GM & Ford Code tests will help you retrieve
trouble codes from some computer controlled engines.
See pages 8-10.
AUXILIARY
AUXILIARY AUXILIARY
CHARGING STARTING measures cranking speed, voltage regulator setting, starter draw, accessory draws, and
alternator output. The Auxiliary Volts is great for voltage
drop tests. Diagnostics monitor the alternator for excessive amps ripple indicating a bad diode or stator. See
page 13.
AUXILIARY AUXILIARY
AUXILIARY AUXILIARY
AUXILIARY
SENSORSENSOR FUEL FUEL HARD HARD
CHARGING
IGNITIONIG
CHARGING
TEST TESTINJECTION
PRIMARY
START START
STARTING
INJECTION
P
STARTING
02
TPS
HZ % DUTY,
IGNITION
02MSEC,
TPS% DUTY,
MSEC,
HZ
VOLTS
IGNITION
AVOLTS
MPS
VOLTS
AMPS
COIL
MO
DUL
COIL
DVOLTS
WELL VARIATIO
DWE
SETUP SETUPSELECT
AMP ZERO
MESSAGE
AMP ZERO
M
STARTSTART
SELECT
CONTROL KEYS
When there are choices in a test, SELECT steps through
the selection. The last displayed choice is made active
by pressing START.
This lower row of keys select test choices, look up messages, restart tests, and operate the printer.
Pressing AMP ZERO subtracts whatever the amps reading was so that the reading becomes zero. If amps fails
to work, read the Amp Probe Check procedure in this
manualʼs Service section.
START takes the operation to the next test step. It
continues an operation after some conditions have been
prepared by the operator.
START also clears Min and Max readings on Spark Burn
and Fuel Injection tests.
SETUP is used to input information about the engine
being tested, and provides four levels of display contrast
adjustment.
-6-
ENGINE DYNAMICS TEST KEYS
CRANKING ANALYSIS has two test sequences to measure Relative Compression, Cranking Volts, Cranking
Amps, Cranking RPM, Alternator Amps, and the CCA of
the battery. The Compression test finds cylinders with
low relative compression, and shows it on the printout
bar graph. See pages 20-23.
These keys measure engine power cycle functions to
find causes of rough running. “PER CYLINDER” tests
store the gathered data in memory for after-test review
and printout. This permits seeing trend and cylinder differences in the engine data.
The sequenced tests in the next column have pauses to
display instructions. Press START for the next step after
an instruction has been completed.
POWER BALANCE performs an Automatic or Manual
Power Balance test to locate low power cylinders. Each
spark plug is turned off one at a time and the RPM drop
is measured. The greater the drop in RPM, the stronger
the cylinder. Cylinders with a small drop should be tested
further to determine the problem. A Power Balance bar
graph is produced with the printed report. See page
18.
IGNITION PRIMARY is used to find bad ignition coils and
modules using the measurements of Oscillations, Ignition
Coil Energy, Dwell, and Driver Voltage. Use the Dwell
and Timing Variation tests to find loose timing chains,
worn distributor shafts and bearings. See page 14.
Ignition suppression is used in CRANKING ANALYSIS
and POWER BALANCE. The analyzer can suppress the
usual inductive discharge distributor ignition, but will not
work on capacitive discharge and multicoil ignitions. A
compatibility check is done by the analyzer before it will
apply suppression. If the check finds it incompatible, the
user will be notified to manually disable either the ignition
or fuel system.
SPARK BURN easily finds defects with spark plugs,
sparkplug wires, distributor cap, and rotor. It measures
the Minimum, Average, and Maximum Spark Burn Time
for each cylinder. Spark Slope is measured to indicate
a lean or rich fuel mixture. A Burn Time Range bar graph
is produced with the printed report. See pages 16-17.
RY AUXILIARY
PER CYLINDER
PER CYLINDER
PER CYLINDER
PER CYLINDER
PER CYLINDER
PER CYLINDER
CHARGING
IGNITION SPARK SPARKCRANKING
CRANKING
ING
IGNITION
POWERPOWER
PRIMARY BURN BURN ANALYSIS
ANALYSIS
BALANCE
STARTING
NG
PRIMARY
BALANCE
MPS
VOLTS
COIL
E
COMPRESSION% RPM DROP
% RPM DROP
SECONDARYCOMPRESSION
COIL
M
ODULE MODUL
SECONDARY
DWELL VARIATION
AA
UN
TO
VOLTS
BAT.ALT.
STARTERAUALT.
MSEC
SLOPE
DWELL VARIATION
TO
M
UAL MANUAL
BAT. STARTER
MSEC
SLOPE
PAPER PAPER PRINT PRINT
PRINT PRINT
MESSAGE
STARTMESSAGE
RT
DISPLAY
ADVANCEDISPLAY
AUTOTEST
ADVANCE
AUTOTEST
PAPER ADVANCE feeds 2 lines of paper for each
press.
Press MESSAGE when "msg" appears in the middle of
the display. This means a diagnostic check detects an
out of limit condition. Repeated presses of MESSAGE
will step through all the diagnostic messages and finally
back to the test. Messages may appear intermittently if
the condition is on the threshold of being a problem.
PRINT DISPLAY prints what is on the display.
PRINT AUTOTEST prints test reports and is the AutoTest entry key. The Auto-Test will run all of the engine
dynamics tests in an automatic sequence. At the conclusion of the data report, you can also print the visual
inspection checklist. See pages 28-29.
Messages suggest causes of problems, but do not
prove the suggested item is bad.
-7-
“SENSOR TEST” KEY
Use SELECT and START to choose tests for measuring
ohms or diode volts, measuring oxygen
AUXILIARY
AUXILIARY
AUXILIARY
AUXILIARY
sensor
voltage and
crossings, checking
FUEL
HARD
CHARGING
SENSOR
for
irregular throttle
position STARTING
sensors
START
INJECTION
TEST
(TPS), watching for intermittent voltage
MSEC, the
% DUTY,
HZ
IGNITION
AMPS
VOLTS
02
TPS
with
Wiggle
Scope, VOLTS
and reading
fault
OHMS
RESISTANCE
/ SELECT
DIODE VOLTS
AMP ZERO
SETUP
START
The resistance of a device is measured by connecting
the red Auxiliary Clip to one of the deviceʼs terminals and
contacting the other device terminal to the battery/engine
ground. A continuity beeper sounds when readings are
below 25 ohms, and “OVER” shows for greater than 50K
ohms. (Ground = chassis)
flash codes from Ford and GM engine control computers.
PER CYLINDER
PER CYLINDER
CYLINDER
The red AuxiliaryPER
Clip
is the signal
input.
IGNITION
PRIMARY
SPARK
BURN
CRANKING
ANALYSIS
POWER
BALANCE
COIL
MODULE
DWELL VARIATION
SECONDARY
MSEC
SLOPE
COMPRESSION
BAT. STARTER ALT.
% RPM DROP
AUTO
MANUAL
MESSAGE
PAPER
ADVANCE
PRINT
DISPLAY
PRINT
AUTOTEST
3
MEASURE
TO
GROUND
1
OPEN
2
SELECT: OHMS to GROUND
TEST
then START
GROUND
Prior to using ohms the analyzer must do an open/ground
lead test which checks the low and high range ends.
Disconnect AUX lead
then START
METER PROCEDURE
"DIODE" voltage in the forward and reverse directions
can also be read by changing the test with SELECT.
STEP 1: Infinite resistance is checked.
Connect AUX to GND
then START
OHMS to GND
DIODE
STEP 2: Ground zero calibration is done.
Note that resistance is measured by applying the carʼs
battery voltage through a 1000 ohm resistor in the analyzer, so that up to 15 milliamps may pass through the
tested device. An advantage of this current is that LEDs
can be checked for light output, and diode forward and
reverse voltages can be checked at a more normal operating level.
Responses are given to guide the calibration process. If
the carʼs battery voltage drifts during the test the calibration may also drift. Press START to redo the recalibration procedure.
OHMS to GND
OHMS
Bat 12.45
12.45v
Bat 12.45
0
STEP 3: Read resistance to ground.
OHM-
OXYGEN LAMBDA SENSOR
The red Auxiliary Clip has a 10 megohm input for this
test. The display shows the average sensor output voltage, the number of times the voltage crosses the 0.45
level per second, and whether the immediate voltage
indicates rich or lean by the R/L display.
a steady fast idle are in the 1 to 3 range. Low rates may
indicate a damaged O2 sensor. Multiports usually cross
count fastest and carbureted engines the slowest.
Oxygen Sensor
0.83 v
0.0 Crossings/Sec
R/L
Connect at sensor harness plug or ECM. Do not penetrate wire insulation where moisture could cause electrical leakage to ground.
Typical cross count readings for warm engines running at
-8-
THROTTLE POSITION SENSOR
DETECT ON
0.84 v
Move SLOWLY to W.O.T
This is a computer aided test to check for skips in a
position sensor signal sweep. When a position sensor
on a throttle or air flow vane is moved from the rest position to the top, the output voltage should move just like
the position shaft. The voltmeter reading for this test
updates rapidly so that small irregularities are not likely
to be missed.
With the "DETECT ON" display, make a smoothly increasing sweep during 3 to 7 seconds to the top position. The test ends automatically when the voltage stops
changing. Findings are reported when the test ends.
SELECT : POSITION SENSOR
TEST
then START
Possible Problem
1.93v
Press START
If glitches were detected, the corresponding voltage levels will be reported. Recheck the sensor for intermittent
faults near the reported problem voltages.
If no irregularities were detected it will show:
Press START.
CONNECT Aux to TP Sensor
Engine OFF; Key ON
Then connect Auxiliary Clip to the output wire and press
START.
No GLITCHES Found;
Press START
If the test was run too fast or slow it will show:
Using the following voltmeter display, check that the output responds to a typical range of 1 to 4 volts when the
position sensor shaft is turned.
Too FAST; Retest Slower
0.84 v
Press START
for test:
In the TP Sensor test the analyzer detects abrupt voltage
changes that an intermittent sensor contact would make.
Be ready to smoothly turn or press the position sensor
through its full sweep. Press START.
Too SLOW; Retest Faster
WIGGLE SCOPE
The Wiggle Scope display can be selected to see a line
trace of slow or intermittent voltage changes. It has a 10
megohm input impedance.
SELECT:
TEST
Wiggle Scope can be used to watch for regular or intermittent pulses on wires for accessories, sensors, lamps,
solenoids, slow computer codes, or other on/off electrical
signals. The shortest step is about 1/10th second on the
fastest scan.
WIGGLE SCOPE
then START
This display is like a chart recorder that is written at the
left of the screen and flows off the right end. It shows
voltage levels and changes above or below 4 volts
sensed by the Auxiliary Clip.
WIGGLE SCOPE Scan 2 Sec
ˇˇ/\|/T\/__\/----------The number following "SCAN" is the time for the signal
to sweep across the display. SELECT can choose a 2,
4, 8 or 16 second sweep.
Level changes during an interval are shown different
ways: an / or \ shows a simple change, a T or its inverse
means there was a change but the start and end were
the same, ||| shows that there were many changes.
-9-
FORD SLOW CODES
Ford has different engine test modes for reading codes
such as:
The Code Reader can be selected to count and display
fault code pulse trains from Ford engine computers.
KEY-ON ENGINE-OFF
ENGINE-RUNNING
OUTPUT CYCLING (engine off)
WIRE WIGGLE
SELECT: FORD SLOW CODES
TEST
then START
Press START.
STI and STO are used on other shapes of Ford connectors throughout the world.
Hook AUX CLIP to
car's fault code OUTPUT
EXAMPLE: Fordʼs QUICK TEST: Hook the red Auxiliary
Clip to the STO pin in the Ford Self Test Connector, and
connect a separate wire to the STI pin (be prepared to
switch the loose end to ground). Because some engine
code tests require the technician to operate brakes,
steering, and throttle it is most convenient to place the
analyzer and STI-to-ground connection next to the driving controls.
Hook the red Auxiliary Clip to the Self Test Output pin.
Press START.
Read by following the Ford service manual instructions
for voltmeter connections to the Self Test Connector.
Readings are similar to a Ford STAR tester.
Have the Fordʼs engine key off, then turn the key on, and
ground the STI connection. Wait at least 15 seconds for
the code pulses to be read and shown on the display. An
“11” is the usual end of codes.
SELF TEST INPUT
(STI)
ACTUATING
CONNECTION
FORD
SELF TEST
CONNECTORS
(USA)
SIGNAL
RETURN
(GROUND)
FORD SLOW CODE
11
11
The last code read will show at the top with the first six
along the bottom line. Repeated codes are not saved.
Once the screen is filled the analyzer will continue counting and displaying, but no more codes are saved.
SELF TEST OUTPUT (STO)
CONNECT TO ANALYZER RED AUXILIARY
For regular ECM trouble shooting we suggest that a scan tool with connector adaptors, code translating
software, and data stream readouts be used.
GM LAMP CODES
Only six codes are saved on the screen. Once the
screen is filled the analyzer will continue counting and
displaying, but no more are saved.
The specific vehicle service manual is required to perform
this test. The usual procedure is to connect the Auxiliary
Clip to pin D of the ALDL connector, which is the “Service
Engine Soon” lamp terminal.
To clear the screen for a retest, press START and then
SELECT.
Hook AUX Clip to
car's fault code OUTPUT
SELECT:
START:
Press START.
Have the engine stopped with the ignition on, and enter
the diagnostic mode by bridging Test Terminal pin B to
pin A or ground.
GM LAMP CODES
12
to ERASE codes
to KEEP codes
TEST TERMINAL
GROUND
"SERVICE ENGINE
SOON" LAMP
12
D
B
A
GM ALDL CONNECTOR (USA)
Use trouble codes by following the vehicle service
manual instructions.
TYPICAL SINCE 1982
-10-
“FUEL INJECTION” KEY
AUXILIARY
AUXILIARY
SENSOR
TEST
FUEL
INJECTION
02
TPS
AMP ZERO
AUXILIARY
MSEC, % DUTY, HZ
AUXILIARY
Injector
solenoidCHARGING
pulses and sensor
sigHARD
IGNITION
PRIMARY
STARTING
nal START
frequency are
read by these
tests
through the red Auxiliary Clip. COIL
MODULE
IGNITION
VOLTS
AMPS
VOLTS
DWELL VARIATION
FUEL
INJECTOR
CRANKING
SPARK
PER CYLINDER
STARTcarburetors, or
Use Solenoid Duty on mixture controlled
frequency output sensors such as some pressure and
air flow sensors. Also use this test to check Hall-effect
switches. "Hz" should go up and down directly with
changes in RPM, and "DUTY" should be constant within
a few %. "DUTY" is usually about 50%.
MESSAGE
MSEC
SLOPE
PAPER
(mS DUTY)
(% DUTY)
(Dg M/C)
15°
DECELERATION
30°
50%
PULSE
mSec
LEAN
45°
75%
50°
Bat 14.06
6.5Max
1.7mS
B+
GND
Shortest
Pulse
REGULATED CURRENT INJECTOR SIGNAL
OFF
ON
25%
PULSE
DRIVER
SIGNAL
When engine RPM is run up and down quickly, "Min" and
"Max" hold the shortest and longest milliSeconds pulse
widths while the center reading shows what is presently
happening. START is used to reset the "Min" and "Max"
readings. Up to 63 milliSeconds can be measured.
The "M/C" display changes to "LEAN" if the readings are
over 50, and "RICH" if less than 10.
10°
PRINT
PRINT
640 RPM
0.8Min
The lower left reading shows averages of the longest and
shortest duty. If the numbers match, the duty is steady.
If there is a difference, the signal pulse width is varying which may mean that there is active control (closed
loop), or if it should not vary it could be a defective signal
source or connection.
0°
0°
MANUAL
The detector is made to read the time that current flows
in a solenoid by watching the voltage drop from the 12V
battery level.
SELECT changes the scaling of the "DUTY" reading for
either:
BAT
GND
AUTO
Connections are reversed
on different engines.
640 RPM
Bat 14.06
28>31 % DUTY Rate 10 Hz
VARYING
BAT. STARTER ALT.
Hook
the AuxiliaryDISPLAY
Clip to the injector
driver wire.
ADVANCE
AUTOTEST
SELECT: Solenoid Duty
TEST
then START
RICH
POWER
Press
FUEL INJECTION
Fuel Injector milANALYSISand SELECT
BALANCE
BURN
liSecond
readings.
COMPRESSION
% RPM DROP
SECONDARY
BATTERY
VOLTS
The term "DUTY" means the portion of time that the signal is switched to ground, which is when power is applied
to solenoids, etc. Duty is not shown for signals over 60
Hz. Frequency up to 250 Hz can be read.
ACCELERATION
PER CYLINDER
SELECT: Fuel Injector
TEST
then START
SOLENOID
DUTY & HERTZ
SETUP
SELECT
milliSeconds
Percent
degrees / 60
PER CYLINDER
60° DG M/C
100% DUTY
MIXTURE CONTROL CARBURETOR DWELL RANGE
-11-
ILIARY
UEL
CTION
% DUTY, HZ
TUP
“HARD START” KEY
If there is a problem with the engine ignition or analyzer
hookup,
the analyzer will give messages
AUXILIARY
AUXILIARY
PER CYLINDER
of
the
likely
causes.
Use this testSPARK
before
HARD
CHARGING
IGNITION
other
tests to confirm
that the ignition
PRIMARY
START
STARTING
BURN
hookup is working
byMODseeing
that
the
COIL
ULE
SECONDARY
IGNITION
VOLTS
AMPS
VOLTS
DWELL VARIATION
MSEC
SLOPE
RPM
and
Ignition
Energy readings
are
normal. See the next page for using Auxiliary Volts to search out connection problems.
PAPER
MESSAGE
SELECT
START
ADVANCE
IGNITION
ENERGY
The signal comes from the ignition coil primary minus
[TACH] terminal through the green Coil Primary Clip
connection. The engine must be cranking or running to
produce a readable signal.
As the figure shows, Ignition Energy strength is the voltSPARK
BURN
TIME
PRINT
DISPLAY
PRINT
AUTOTEST
Investigate the following messages further using SPARK
BURN.
Plugs GAP Narrow ?
? Coil - Distributor ?
or Plugs: Wide GAP?
Shorted
? Coil - Distributor ?
COIL
IGNITION ENERGY
AREA
Check the following messages further using IGNITION
PRIMARY.
BATTERY
VOLTAGE
POINTS
GROUND
RESISTANCE High
COIL PRIMARY-DRIVE Bad?
COIL PRIMARY (TACH) SIGNAL
age times the spark duration milliSeconds, as measured
at the coil primary. This indicates the coil "kick" in millivoltSeconds (mVS) and is displayed as "IgEgy".
356 RPM
IgEgy 38
If "msg" appears, press MESSAGE. The following mesPER CYLINDER
PER CYLINDER
sages
may be set
after the engine has been cranked or
CRANKING
POWERThese are suggested problems
run
several
seconds.
ANALYSIS
BALANCE
indicated by the combination of signal measurements.
COMPRESSION
% RPM DROP
BAT.
STARTER
AUTO
M
ANUAL
Refer
to ALT.
the vehicle
specific
service manual for tests
to confirm the suggested defects. Visual inspection
and direct component measurement should be used to
confirm that there is an actual problem.
msg Bat 10.34
Aux>POS- 1.34
"IgEgy" is proportional to the primary energizing current
and the quality of the ignition coil inductance. Typical
standard ignition coils produce 25 to 40 mVS. High
energy ignitions have 40 to 60 mVS. Readings below
20 mVS suggest that an inadequate ignition charge is
being delivered by the coil. Low coil current may be the
reason, caused by a bad primary connection, bad drive
module, worn points, low dwell time, low battery voltage,
or an open ballast resistor bypass switch. Use IGNITION
PRIMARY to check the coil drive voltage, dwell, and coil
oscillations.
-12-
“CHARGING STARTING” KEY
AUXILIARY
HARD
START
NITION
VOLTS
SELECT
Use this set of tests for general electrical troubleshooting
AUXILIARY
PER CYLINDER
PER CYLINDER
of starter, alternator
and load currents,
along
with connection
losses.
CHARGING
IGNITION
SPARKvoltageCRANKING
STARTING
PRIMARY
ANALYSIS
BURN are Inductive
The
special measurements
COIL
MODULAuxiliary
E
COMPRESSION
SECONDARY
Amps
and
Volts.
DWELL VARIATION
AMPS
VOLTS
BAT. STARTER ALT.
MSEC
SLOPE
PAPER
PRINT
INDUCTIVE
MESSAGE
START AMPS
ADVANCE
DISPLAY
Before hooking up the Amp Probe see that the reading is
zero. Press AMP ZERO to eliminate zero offsets.
AUXILIARY
VOLTS
PER CYLINDER
It receives
the
signal from the red Auxiliary Clip, and is
POWER
referenced
BALANCE to either the positive or negative vehicle battery
terminal
through the analyzer Battery Clip leads. The
% RPM
DROP
AUTO
MANUAL
range
is
0 to 20 volts, has 0.01 volt resolution, and has a
10 megohm input impedance to the black Battery Clip.
Press
SELECT to change the "Aux>POS" or "Aux>NEG"
PRINT
AUTOTEST
reference
noted on the display.
1057 RPM msg Bat 13.84
0 AMPS Aux>NEG 10.34
AUX>POS
AUX>NEG
">NEG"
AUXILIARY VOLT
REFERENCE
BLACK
"AMPS" uses the signal from the Inductive Amp Probe.
By placing the pickup around a wire the DC current within
a +/- 600 ampere range can be measured. Resolution
is 1 ampere. An automatic diagnostic check tests for
ripple in the current when it is over 20 amps. If ripple is
high, indicating an alternator with a bad diode or stator,
a message "msg" notifies the user:
GND
12 VOLT
Using the "Aux>GND" reference, it works just as if the
voltmeter had a black clip hooked to the battery negative
terminal.
AMPS RIPPLE ?Alternator?
ALTERNATOR OUTPUT VOLTAGE DROP TEST
AUX>GND
AUX>POS
">POS"
AUXILIARY VOLT
REFERENCE
Charging systems will not keep a battery charged if
the alternator output connections are bad. The following is a basic wiring test for a common defect.
1. Connect the Auxiliary Clip to the alternator output
terminal, and SELECT the "Aux>POS" reference.
RED
2. Run the engine at about 1500 RPM and switch
the headlights and heater blower on high.
12 VOLT
3. If more than 0.5 volt is seen, the voltage drop is
too high and the connection between the alternator output and battery positive is bad.
POS
The "Aux>POS" reference is useful for voltage drop measurements of wiring resistance between battery positive
and connections to accessory loads or from the alternator output. Readings will be negative to all points on the
vehicle wiring except on the alternator output wire when
it is generating current.
4. Then connect the Auxiliary Clip to the alternator
case and SELECT the "Aux>NEG" reference. If
more than 0.2 volt is seen with the engine, lights
and blower still running as before, there is a bad
ground connection to the alternator.
5. Repair any defects found before proceeding.
-13-
“IGNITION PRIMARY” KEY
LIARY
RGING
RTING
VOLTS
ART
Use to check the input power and response of the ignition
coil. SELECT
the two screens
to
PER CYLINDER
PER CYLINDER
PER CYLINDER
see
all measurements
including
Coil
IGNITION
CRANKING
POWER
SPARK
PRIMARY
BURNEnergy ANALYSIS
Ignition
("IgEgy"), Coil BALANCE
OscillaCOIL
MODULE
COMPRESSION
% RPM DROP
tions
("Osc"), Driver
Module On Voltage
SECONDARY
BAT. STARTER ALT.
DWELL VARIATION
AUTO
MANUAL
MSEC
SLOPE
("Drvr"), Ignition Dwell ("DWL"), and the
Variation of dwell and timing in degrees
("VARIES").
MESSAGE
PAPER
PRINT
PRINT
DISPLAY
The signal is takenADVANCE
from the coil primary
terminalAUTOTEST
with the
green Coil Primary Clip.
957 RPM msg Bat 13.84
Osc 3 IgEgy 38 Drvr 0.8v
DWELL
Readings in degrees and percent are useful for setting
mechanical points. MilliSeconds are useful for checking
electronic HEI type ignitions, which take a fixed time to
charge the coil with current. A typical HEI reads about 3.5
mS up to 3000 RPM, and more while cranking.
Use SETUP and SELECT to choose whether dwell is
displayed by degrees (DEG), percent(%), or milliSeconds
(mS). If dwell is displayed in degrees it is scaled according to the number of cylinders selected in SETUP.
This analyzer measures dwell according to the interval
that points are closed, or the transistor driver is fully on.
The coil amps dwell hold time which sometimes follows
amps buildup is not included in these readings.
IGNITION ENERGY (See HARD START page12)
COIL OSCILLATIONS
This is an indicator of liveliness in the ignition coil. Shorts
in coil insulation or in connected components usually
dampen the oscillations so they are reduced or eliminated.
SELECT the display showing "VARIES" which reads
RPM, Dwell, Dwell Variation, and Timing Variation.
Points driven ignition coils usually show 4 to 8 oscillations, which are more than electronic ignitions which do
1 to 4. Some Chrysler ignition modules begin dwell immediately after the spark burn time so they normally donʼt
show any oscillations.
Variation gauges the engineʼs control stability.
DRIVER MODULE / POINTS VOLTAGE
"Drvr" is the voltage during the dwell time. For mechanical points it should be less than 0.3 volts. Electronic
modules typically have 0.5 to 1.5 volts. Ignitions made
alike should compare within 0.2 volts. In this test a high
voltage indicates a failing (high resistance) coil driver
output transistor, bad points, or a high resistance connection to ground.
DWELL VARIATION
This is the difference in degrees between the longest and
shortest dwell period. It could be from an unstable coil
drive module. Mechanical sloppiness in the distributor
shaft bearings and cam shaft drive is the prime cause. At
higher speeds on point contact ignitions the problem can
be floating contacts from weak springs and poor lubrication. Readings should be less than 3 degrees.
957 RPM msg DWL 3.3mSec
Dwl 0.6 VARIES Tmg 2.9
TIMING VARIATION
This is the difference in engine shaft degrees of the
longest and the shortest time between ignition firings.
Variations in timing are associated with defective engine
operation. On pre-computer engines variation meant
looseness in the mechanical drive from the crankshaft to
the points cam. This is still generally true for distributor
located ignition sensors, but sometimes timing is intentionally varied by engine computers.
IGNITION CYCLE INTERVAL
SPARK
BURN
TIME
SPARK
LINE
BATTERY
INTERMEDIATE
SECTION
COIL
OSCILLATIONS
DWELL
SECTION
MEASURED
DWELL
DWELL
VARIATION
DRIVER
VOLTAGE
DWELL
HOLD
(HEI
TYPES)
Irregular idle RPM from O2 feedback fuel metering can
cause an apparent timing variation. Operating the engine at higher RPM should reduce the variation to under
3 degrees. The point to be alert to is the erraticness of
timing variation which points to sloppiness in the gears,
bearings and chains leading to the ignition timing sensor.
Confirm timing variation with a Timing Light triggered from
the coil-distributor wire by watching the paired marks.
GROUND
COIL PRIMARY SIGNAL
-14-
Read variation from 1000 to 3000 RPM with the RPM
held steady.
BURN TIME READINGS and PRIMARY PARADE WAVEFORM
This figure illustrates the spark plug readings that this engine analyzer extracts from an ignition waveform, and then
shows on the display. Tha analyzer would also give two
diagnostic messages:
GAP Wide, Seq #1
PLUG foul? CAP track?
seq #4
The No. 1 cylinder, in the first position of the waveform
has a gap in the spark plug wire which causes the short
burn time. The next two cylinders are normal. The last
cylinder has a fouled spark plug, as is seen by the much
more negative spark line slope.
The signal shown is of a current limited electronic ignition
on a 4 cylinder engine running at 2500 RPM.
12
Slope
mSec
SPARK
mSec
0.8
-20
18
7
1.5
1.6
0.8 1.6 1.5 2.0
SPARK
Slope
2.0
12
7
18 -20
See the BURN TIME key test explanation on the next
page.
COMPARING READINGS TO AN OSCILLOSCOPE
Ignition oscilloscopes are primarily designed for measuring
the sparks, the important ignition factor to check is the
time that the spark is exposed to the fuel mixture in each
cylinder.
For each spark, KV and the spark burn duration have a
trade-off relationship, where if one gets longer the other
must get shorter. This is why either measurement may
be used to evaluate ignition performance.
This analyzer excels in automatically measuring and
displaying spark burn durations for individual cylinders.
Because it measures each and every spark, both the
averages, the longest (Max) and the shortest (Min) burn
times are saved in analyzer memory and used for comparisons of the cylinders by the analyzer diagnostics as
well as by the user.
This is in contrast to the usual oscilloscope traces that
require recollection of the spark events to be from the
users memory after interpreting the readings from each
-15-
kilovolts. While high voltages are the means which start
cylinder's trace. Reading individual spark plug burn times
from an oscilloscope trace can be difficult because the
scale line is usually along the bottom of the screen and
the stacked raster pattern covers the whole screen. Additionally, many scopes don't even have a millisecond
scale, and the screen sweep is only given in engine
degrees for setting or checking ignition contacts.
This analyzer is made to investigate the essential ignition performance factors. It measures the coil's Ignition
Energy response to see that a strong spark is possible
without having to open a sparkwire. The analyzer reads
the total operating range of spark durations while the
engine is idling and accelerating. The numerical results
can be watched live as well as from the printed report to
see if long enough fuel igniting spark is delivered under
all conditions.
TION
MARY
MODULE
VARIATION
SAGE
“SPARK BURN” KEY
BURN TIME
This is the duration of a spark in milliSeconds. It is affected by the energy available to push the spark current
through the plug circuit. If there is little resistance to
block the current it will go longer, more resistance and
it will burn out quicker. The usual time is about 1.5 milliSeconds (mS) with 0.8 to 2.3 milliSeconds the typical
range limits.
Measures secondary spark events. Continuous operation
ofPERallCYLINDER
the spark plugs
can be watched
PER CYLINDER
PER CYLINDER
with
this
test.
The
Average,
Minimum,
CRANKING
POWER
SPARK
Maximum,
cylinder data can
ANALYSIS and Slope
BALANCE
BURN
beCOMPRESSION
chosen with SELECT.
"Min" holds
% RPM DROP
SECONDARY
BAT. STARTER ALT.
AUTO
MANUAL
MSEC
SLOPE
the shortest milliSeconds,
and "Max"
holds the longest. Diagnostic messages
will be set by the analyzer if symptoms appear regularly,
but will
go away if the
symptoms are
reduced. The meaPAPER
PRINT
PRINT
ADVANCE
surements
for this DISPLAY
test come fromAUTOTEST
the ignition coil primary
signal that “reflects” the coil secondary events.
Some ignitions may be designed for longer or shorter
spark durations. Compare similar engines if in doubt.
Short Burn Time is caused by breaks in secondary ignition wires, wide sparkplug gaps, worn plug and rotor
electrodes, high circuit resistances, and very lean fuel
mixtures.
Spark Burn Analysis has an entry instruction:
Briefly Open Throttle
do not exceed 2500 RPM
Long Burn Time comes from narrow or fouled plug gaps,
distributor or insulation shorts, rich fuel mixture, and low
cylinder compression. Usually long times seen with the
"Max" data set show intermittent misfires from shorted
secondary insulation in the cap, rotor, wires, or plugs.
The "briefly open throttle" procedure captures the operating limits burn times. The analyzer checks for excessive
open throttle RPM and may inform the user to redo the
"open throttle" step. Such as;
TEST INVALID
REDO WITH LOWER RPM
A reduction in burn times, with snap acceleration, is only
caused by the change within the plug gap from burning
fuel and pressure. So this test is an ideal check for worn
out spark plugs.
If this happens, press START and then "briefly open
throttle", but do not let the RPM get so high.
Open the throttle momentarily for engine acceleration to
check the Burn Time reserve. The Min Burn Time display shows the shortest times measured when an engine
works against its own inertia. Compare these times to
0.8 milliSeconds for the reserve.
The first data display shows the Spark Burn milliSeconds
and Spark Slope averages of all the cylinders.
956 RPM
IgEgy 38
SPARK 1.5mS
Slope - 7
Problems with other parts like wire breaks, wide rotor
gaps and high secondary resistance are most easily detected at a moderate and steady RPM such as between
1000 and 2000 since they are not affected by the cylinder
pressures.
Press SELECT to change between the average, minimum, maximum, and slope spark plug data displays.
SPARK
1.3 0.9 1.5 1.4
mSec msg1.9 1.7 Bank B
The "mSec" screen gives the average reading from each
spark plug. Use it to watch individual cylinders as engine
operation is varied. The "Min" screen is used to find cylinders with short reserves. The "Max" screen is used to
find insulation failures and fouled plugs.
COIL WIRE
RESISTANCE
AND GAPS
CAP CRACKS
To clear the "Min" and "Max" numbers press START.
When more than 8 cylinders are displayed there will be
a "Bank A" or "Bank B" shown for the first half or second
half of the firing sequence.
Compare each cylinderʼs average Burn Time to the others. A 0.3 difference from the displayed average is significant. When comparing Slopes, a consistent difference
of 20 above or below the measured average should be
investigated further.
BROKEN COIL
PLUG WIRES
RESISTANCE
AND GAPS
ROTOR GAP
EROSION AND
CORROSION
WORN TIPS
LEAN MIX
IN GAP
IGNITION SECONDARY CIRCUIT
-16-
BURN TIME SLOPE
Slope tells about the fuel mixture at the end of burn time.
Lean makes the voltage rise (plus) and rich makes it fall
(minus) during the end of the spark.
DIAGNOSTIC MESSAGES
Messages are caused by odd combinations of Spark
Burn Time and Slope. Follow up on these suggestions
with visual inspection and component testing.
It is recommended that messages about multiple cylinders be ignored until single cylinder messages have been
looked into. Since most of the messages are based upon
comparisons of each cylinder to the others, it is possible
that one bad cylinder may make the others look relatively
out of line. Additionally, an open arcing spark plug wire
can cause test effects that trigger many messages. Retest after each repair.
SPARK
-20 -18 - 5 -11
Slope msg 9
6
BURN
TIME
BURN
TIME
FALLING
SLOPE
(Minus)
RISING
SLOPE
(Plus)
The following displays pick out individual cylinders from
the firing sequence and suggest possible problem
causes:
GAP Narrow
Seq. # 5 6
COIL PRIMARY WAVEFORMS
When a spark has a slope more than 20 counts over the
overall averages and burn time is short, look for a wide
or worn plug gap. If burn time is normal, the cause may
-----------------------be: a lean fuel mix, a manifold
or EGR leak, a low fuel
ENGINE DATA REPORT
pressure regulator, or a cylinder
valve leak.
------------------------
Additional problem categories include:
WIRE
RESISTANCE High, PLUG Foul ? ,
CAP Track ?, GAP Wide ? , FUEL Lean?
When the slope is 20 counts ====CRANKING
less than
theHISTORY====
overall
averSEC
RPM BATT
AMPS
age, look for a richer fuel mix1 or high resistance
13.33 151spark
326 a 11.88
wire. On multiport fuel injection2 engines
leaking129
injector
3
306 11.57 122
will be likely to cause a consistently
lower
slope 116
than the
4
301 11.35
5
300 11.17 114
other cylinders.
The next messages relate to all spark plugs together:
Plug GAP Narrow?
Shorted
?Coil - Distributor?
7
292 11.03 113
9
291 10.85 112
11 +30289
10.76
112Good
Most engines have slopes in the
to -30
range.
13
288 10.70 112
engines usually have all the
values
within
about
10
15
288 10.66 111
counts either side of average.
Keep in mind that these
-----------------------readings are highly variable CRANKING
becauseVOLTS
they are 10.66
affected
CRANKING AMPS
111
by the fuel burning. The key -----------------------is to look for the obviously
CRANKING RPM
288
different cylinders.
ALTERNATOR AMPS
38
-----------------------BATTERY CCA EST.
487
RECOVERY SECONDS
23
------------------------
When PRINT DATA is
used the Spark Burn
test data will be printed
and graphed. The graph
spans "MIN" to "MAX"
and has a mark at the
"AVE" data value. The
readings are in firing order from top to bottom.
?Coil-Distributor?
or Plugs: Wide GAP?
Fuel Rich?
Additionally if Ignition Energy is very low it will show:
COIL PRIMARY DRIVE Bad?
Note, if the Spark Pickup is not working the spark plug
data will not be available. A message will show:
==SPARK BURN ANALYSIS==
RPM
IGEGY
BATTERY
772
43
14.13
IN FIRING ORDER
AVE
MAX SLOPE
2.0
2.1
10
2.0
2.2
10
2.0
2.1
15
2.0
2.1
17
MIN
0.9
1.1
1.0
0.9
0
1
2
3
no SPARK PICKUP Signal
Diagnostic messages from this analyzer are based upon
a range of Burn Time that is typical for most engines.
There are however, some engines which are designed
differently and have performance ranges that may appear to be abnormal to the analyzer so that it will produce
messages indicating a possible defect. Compare the
measured values to readings from similar engines or
specifications from the engine service manual to confirm
that the messages apply.
4 MS
BURN TIME RANGE
====IGNITION PRIMARY====
850 RPM
BAT 14.01
OSC 2 IGEGY 43 DRVR 0.8V
847 RPM
DWL 3.6MSEC
DWL 0.3 VARIES TMG 4.8
-17-
“POWER BALANCE” KEY
-----------------------The idle speed motor may have
to be unplugged if the
ENGINE DATA REPORT
test is done at idle. Disconnecting
the coolant tempera-----------------------ture sensor will usually cause the computer to operate in
====CRANKING
HISTORY====
open-loop fuel control as if the
engine were
cold. Where
SEC
RPM BATT
AMPS
the oxygen sensor is easily reached
it
can
be
1
13.33unplugged
151
to lockup the fuel control. Timing
can
fixed by
2
326usually
11.88be 129
122 pulldisconnecting the MAP sensor3 hose,306
or as11.57
on Fords,
4
301 11.35 116
ing the timing test plug. EGR5 valves
should
be disabled
300
11.17
114
by removing and plugging the7 vacuum
to the
valve.
292hose
11.03
113
291
112 can
On some engines there is a 9running
test10.85
mode that
11
289 10.76 112
be set through the diagnostic
which 112
lets the
13 connector
288 10.70
test run without interaction effects.
Refer
to the111
engine
15
288
10.66
service manuals for details. ------------------------
This test measures each cylinder's contribution relative to
the others by turning off the spark plugs
CYLINDER
PER CYLINDER
one at a time and measuring the drop
NKING
POWER
in RPM. The more decrease seen, the
ALYSIS
BALANCE
more a cylinder must have been conPRESSION
% RPM DROP
AUTO
MANUAL
ARTER ALT.
tributing. A comparison of an engineʼs
entire set of readings is necessary because of engine to engine variations. If a cylinder shows
only PRINT
1/3 of the drop of the average cylinder it should be
RINT
AUTOTEST
PLAY
checked
further with the other analyzer tests. Low power
cylinder problems are associated with spark plugs and
wires, piston rings, valves and valve springs, vacuum
leaks, fuel unbalance, head gaskets, and EGR problems.
If a cylinder test produces a higher RPM it may be from
crossed spark plug wires, an open intake valve, leaking
EGR, or an engine computer effect.
The test relies upon steady timing, fixed air-fuel feed and
a constant amount of engine drag during the test to make
CRANKING VOLTS
10.66
CRANKING AMPS
111
After the test, carefully restore
the disengaged parts.
-----------------------CRANKING
RPM
Service codes may have to be
cleared,
but they will288
usuALTERNATOR AMPS
38
ally clear automatically after-----------------------50 to 100 starts.
BATTERY CCA EST.
487
RECOVERY
23
The results of this test, if compared
to SECONDS
the Cranking Amps
------------------------
and Spark Burn tests, can provide additional clues to the
cause of poor cylinder performance.
==SPARK BURN ANALYSIS==
RPM
772
CYCLE 3
RPM START
*
*
CYLINDER
SEQUENCE
1
2
*
3
END
RPM
BATTERY
14.13
A manual cylinder selection version of the test is provided to check for engine noise changes
when
power is
IN FIRING
ORDER
MIN
AVE
MAX SLOPE
removed from a particular cylinder.
SUPRESSION CYCLES
RPM
IGEGY
43
0.9
1.1
1.0
0.9
WARNING
2.0
2.0
2.0
2.0
4
2.1
2.2
2.1
2.1
10
10
15
17
This test causes unburned fuel to be passed into the
0
1
2
3
4 MS
exhaust. Catalytic converters burning this fuel will
become hotter. Repeating the test frequently may
cause excessive heat under the car.
RPM DROPS FROM SPARK SUPPRESSION
" " shows recovery times
*
valid comparisons between all of the cylinders.
When PRINT DATA is used the Power Balance test data
BURN TIME RANGE
will be printed and graphed. The % RPM graph shows
====IGNITION
PRIMARY====
the percentage drop by cylinder.
Weak cylinders
will
RPMcylinders
BAT
show up as a very short bar. 850
Strong
will14.01
show
OSC 2 IGEGY 43 DRVR 0.8V
up as a long bar.
A steady drag on the engine can improve the test results.
Turning the heater fan on high and headlights on bright is
usually the best method. Particular attention should be
directed to eliminating loads that can turn on or off in the
middle of the test such as the air conditioner compressor
and radiator fan motor.
847 RPM
DWL 3.6MSEC
DWL 0.3 VARIES TMG 4.8
TEST
==== POWER BALANCE ====
ORDER START END
%DROP
1
852
767
10
2
849
764
10
3
858
764
11
4
848
763
10
PROCEDURE
Operating the engine above the controlled idle RPM will
minimize the effects of idle compensators and put the
engine at a smoother operating point. RPMʼs of 1000 to
2500 are suitable for the test. Listen to the sound of the
engine as suppression is applied. The initial RPM drop
tells if power is strong.
BASIC TEST
You should have completed the analyzer
SETUP Steps, and used
IGNITION PRIMARY
to check the leads to
engine hookup. Press
POWER BALANCE to
begin. The following
screens will appear:
On non-computerized engines the timing, fuel mix and
idle setting do not vary with time. However, active control
systems may have to be put in open-loop mode to keep
the timing and fuel mixture fixed.
-
0%
10
20
30 +
% RPM DROP
=ELECTRONIC COMPRESSION=
ORDER AMPS %MAX %LOW
1
120
99
1
2
120
99
1
2
3
119
98
4
121
100
0
-18-
80
90
100%MAX
(POWER BALANCE)
Press START
TEST VARIATIONS
The analyzer will check for signals from the ignition. Both
a Spark Pickup and Coil Primary TACH signal from an Inductive discharge ignition with a distributor are necessary.
If the signals do not match, the analyzer may show:
Use SELECT to choose between the automatic sequence
test, "Auto-", and the manual cylinder selection "Manual".
Then press START.
==== POWER BALANCE ====
-RUN with Engine Warm-
Check Connections!
-Run Engine-
Refer to the vehicle service manual.
SELECT:
TEST
or other indications of problems.
Autothen START
If the test was run once already, the operator will be
asked to press SELECT for a new test, and thus erase
the past saved data, or to press START to review the
previous test results.
Allow the RPM to appear and stabilize before pressing
START.
SELECT:
START:
Disable Engine Control
Turn FAN & LIGHTS ON HI
run NEW TEST
view OLD DATA
A throttle position holding tool should be used. The analyzer will not work over 3000 RPM for 8 cylinder engines,
nor 6000 for 4's. Others are proportionately limited.
1262 RPM
Bat 14.15
Set RPM at 1000 to 2000
In "Manual", pressing START shows the "Manual Kill"
display with a firing order sequence number. Use SELECT to choose a cylinder and press START to have it
suppressed for 5 seconds.
In "Auto-", pressing START begins the automatic ignition
suppression cycling of 5 seconds applied and 5 seconds
recovery.
1280 Start RPM DROP
1088 End Manual Kill#
1280 Start RPM DROP
1088 End Auto-Kill #
Repeat the test using SELECT and START.
Results are not saved in memory.
%
1
Press MESSAGE if "msg" is present.
After each suppression cycle the RPM % Drop is shown
along with the ending RPM. When all have been tested
it will show:
PWR-BAL
13
% DROPmsg 2
%
1
Low power occurs from a drop less than 1/3 of the average.
9 - 3 12
11 Bank A
Low POWER Cylinder
Seq. #
5
The cylinder power drop data is arranged by the firing
order sequence (top: 1,2,3,4; bottom: 5,6,7,8).
RPM may increase if a cylinder had been firing too
soon.
RPM INCREASED
Seq. #
3
If more than 8 cylinders are tested the data will be shown
in sets called "Bank A" and "Bank B".
Press START to see each set displayed.
The following message indicates that during the test the
last cylinder "Start RPM" had changed too much from the
first. Too much change suggests that the test should be
rerun to see if it gives the same results. Try to find the
cause of the change.
RPM SETTING Drifted
-19-
YLINDER
ARK
URN
ONDARY
SLOPE
PER
ANCE
“CRANKING ANALYSIS” KEY
CRANKING HISTORY TEST
CRANKING HISTORY
An
power system test of the
PER CYLINDER
PERelectrical
CYLINDER
engine
is the primary feature of this seCRANKING
POWER
ANALYSIS
BALANCE
quenced
procedure. Performance meaCOMPRESSION
% RPM DROP of the alternator, battery, and
surements
AUTO
MANUAL
BAT. STARTER ALT.
starter allow comparison to ratings.
DISCHARGE
15 SECONDS
14V
VOLTS
12V
This test records battery voltage and amps while the
PRINT
starter
cranks the PRINT
engine for 15 seconds, then there
is aDISPLAY
wait to checkAUTOTEST
battery recovery time, followed by a
measurement of the charging current when the engine
is started.
CHARGING
RECOVERY
MEASUREMENT
TIME
10V
CRANKING
VOLTS
The Cranking Analysis test procedure for a standard
engine follows the basic test procedure in the left-hand
column below. Test variations are described in the righthand column for nonstandard vehicles and conditions.
OPERATOR
ACTIVITY
CRANK
ENGINE
WAIT
FOR
BATTERY
RUN
ENGINE
CHARGING
AMPS
CHARGE
DISCHARGE
WARNING
CRANKING AMPS
THE ENGINE MAY START DURING THE TEST.
STEP ONE
BASIC TEST
TEST VARIATIONS
You should have completed the analyzer SETUP steps,
including the check for good readings with HARD
START.
If the test has been done before, it will show:
Press CRANKING ANALYSIS” to begin.
Running a new test will erase the old data when the new
data recording begins.
SELECT:
START :
CRANKING ANALYSIS
Engine Warm, Brakes Set.
Bat
Recharge BATTERY
Press START.
12.04
The test will stop if the battery is below 12.30V indicating
a discharged, weak, or loaded battery.
Using SELECT, there is a choice of the complete
“Cranking History” test or doing the “Electronic Compression” test.
SELECT: Compression
TEST
then START
SELECT “Cranking History”, press START.
Keep the car doors closed during the test to reduce battery drain.
Switch ACCESSORIES OFF!
Close Doors, then START
Press START.
run NEW TEST
view OLD DATA
-20-
STEP TWO
BASIC TEST
(CRANKING HISTORY)
The user should operate the starter by the usual vehicle
operator controls. With the automatic suppression, ignition will be held off.
Crank ENGINE 15 Seconds
The engine may start if ignition compatibility has not been
established. Allow it to run for a minute until the situation
is resolved.
is shown momentarily, then;
RPM
8 AMPS
Bat 12.34
Not Cranking?
If the green Coil Primary Clip is not getting a signal, or if
the ignition does not have a distributor, and has not been
disabled, the engine may start and the test will be interrupted with the display:
Data logging will begin when cranking current is sensed.
Or press START to proceed immediately.
394 RPM
182 AMPS
TEST VARIATIONS
Alternately, a remote starter switch may be used, but
power must be on the ignition or cranking RPM will not
be measured.
Bat 10.34
3 Sec
No PRIMARY TACH pulses
If the ignition cannot be automatically suppressed because it has more than one coil, or is not the usual
inductive discharge type, then the user must manually
disable the engine.
—— Continue test on next pages ——
No PRIMARY TACH pulses
Disable FUEL or IGNITION
Use the recommended method to disable the engine for
compression cranking tests from the vehicle service manual. This will usually be by unplugging the power wire
or fuse to the fuel injectors or ignition coils. Additionally,
unless there is a simulated Coil Primary TACH signal,
RPM cannot be read. When ready, press START.
If the battery voltage falls below 9.6 volts during the test,
it is too low to continue and one of the following messages will be shown:
TEST ABORTED
AMPS high, check STARTER
TEST ABORTED
?Battery CONNECTIONS?
The test will stop and the operator should check the battery-starting system accordingly.
-21-
STEP THREE
BASIC TEST
(CRANKING HISTORY)
If the engine was manually disabled, it should be restored
during the recovery period. A reminder will be shown
after recovery.
After the 15 second test the display will show:
STOP CRANKING
IGNITION OFF
Bat 10.14
Sec
Restore FUEL or IGNITION
When the operator stops cranking, a waiting period
begins which checks the voltage recovery time of the
battery. Good batteries will spring back in 1 or 2 seconds. Worn out or undercharged batteries need over
10 seconds to recover. Make sure all battery drains
such as dome lamps are off during this test. Keep doors
closed.
BASIC TEST
Press START when completed.
STEP FOUR
(CRANKING
HISTORY)
When battery voltage has recovered or 30 seconds has
passed, the ignition will be enabled and the display will
show:
TEST VARIATIONS
If battery charging is not sensed this step may be passed
by pressing START.
RPM
Bat 12.34
Run Engine over 1500 RPM
The operator should quickly bring the engine to a speed
where the alternator can charge at a full rate (1500 to
2000 RPM), and before there has been enough charge
added for the battery to recover to the regulated voltage.
After a few seconds the display will beep and momentarily show:
TEST COMPLETE
STEP FIVE
BASIC TEST
(CRANKING HISTORY)
To compensate the measurement of battery CCA rating
(SAE Cold Cranking Amps), the operator can SELECT
one of three temperature ranges that best matches the
battery electrolyte.
TEST VARIATIONS
This choice will not be asked if recovery was over 30
seconds.
Temperature choices and Fahrenheit equivilents
are:
SELECT: Battery Temp.
DEG. C= over 15
Celsius
-10° to 0°
0° to 15°
SELECT degrees Celsius from: -10 to 0, 0 to 15, or over
15.
Press START to continue:
-22-
Fahrenheit
10° to 30°
30° to 60°
STEP SIX
(CRANKING HISTORY)
BASIC TEST
Display the results and data using START and MESSAGE.
The seconds of cranking data have the following display
form:
306 RPM
122 AMPS
AMPS RIPPLE ?Alternator?
Bat 11.57
3 Sec
If a battery has a slow recovery or will not accept charging, the CCA performance will not be measured and a
message will show:
Pressing MESSAGE repeatedly will show the following
measurements taken during cranking.
Cranking Volts
Cranking AMPS
10.66
111
Cranking RPM
Alternator AMPS
288
38
BATTERY CCA est.
RECOVERY SECONDS
487
23
TEST VARIATIONS
If the battery charging current had excessive ripple, indicating an alternator with bad diodes or stator, a message
will show:
CCA not CALCULATED
RECOVERY too SLOW
The message display readings are taken from different
times in the test sequence. The Cranking volts, Amps,
and RPM are the 15th second cranking measurements.
During the 1500 RPM period alternator amps are read
before the battery is recharged. The estimate of battery
CCA (Cold Cranking Amps) is taken from the cranking
amps and volts and should correspond to the SAE rating
label on the battery. Multiply DIN and BS ratings by 1.5
to approximate SAE. A CCA reading 20% below the battery rating shows weakness.
Leave the messages by pressing START or any test
key.
Use CHARGING STARTING next if any of the test results
suggest battery, starter, or alternator problems.
-----------------------ENGINE DATA REPORT
------------------------
When PRINT REPORT
is used the Cranking History data is printed and
graphed.
====CRANKING HISTORY====
SEC
RPM BATT
AMPS
1
13.33 151
2
326 11.88 129
3
306 11.57 122
4
301 11.35 116
5
300 11.17 114
7
292 11.03 113
9
291 10.85 112
11
289 10.76 112
13
288 10.70 112
15
288 10.66 111
-----------------------CRANKING VOLTS
10.66
CRANKING AMPS
111
-----------------------CRANKING RPM
288
ALTERNATOR AMPS
38
-----------------------BATTERY CCA EST.
487
RECOVERY SECONDS
23
-----------------------==SPARK BURN ANALYSIS==
RPM
IGEGY
BATTERY
772
43
14.13
IN FIRING ORDER
AVE
MAX SLOPE
2.0
2.1
10
2.0
2.2
10
2.0
2.1
15
2.0
2.1
17
MIN
0.9
1.1
1.0
0.9
0
-23-
1
2
3
4 MS
BURN TIME RANGE
====IGNITION PRIMARY====
WARNING
“CRANKING ANALYSIS” Key
THE ENGINE MAY START DURING THE TEST.
ELECTRONIC COMPRESSION
The cranking-amps-per-cylinder readings of this test give
an indication of engine cylinder compression uniformity.
This is possible because starter motor amperage is
related to the cranking torque, and the cranking torque
varies as cylinders go into compression and then spring
back .
The Cranking Peak-Amps per cylinder test procedure for
a standard engine is as follows in the left-hand column.
When there are test complications, variations may appear
which are described in the right-hand column.
If all peak amps readings from this test are within a 5%
range, compression is probably within the typical specification of 75% of the highest gauge reading. If at least
one amps reading is more than 8% lower than the highest, it is likely that there is a problem.
When a leaky cylinder springs back less than a sealed
one, the cranking amps of the following cylinder will read
higher than it would otherwise. The test is pretty good for
catching 20% to 70% compression cylinders, but totally
dead cylinders may not show well because they have
neither compression or springback torque. Totally dead
cylinders will usually be apparent by the engine sound
anyway.
STEP ONE
Press CRANKING ANALYSIS to begin.
Using SELECT, there is a choice of "Cranking History"
or running only the "Compression" test.
Engines with 4 cylinders have a good readings-to-cylinder
correspondence. Six cylinder engines have a readings
overlapping effect, and 8's overlap so much that the lowest amps reading may correspond to bad compression in
the preceding cylinder. This can make the interpretation
of these readings complicated.
The way to interpret this test is to first look for a uniform
PEAK
AMPS
190
200
SELECT:
TEST
1
2
Compression
then START
Press START.
190
The following display will appear:
CRANKING ANALYSIS
Engine Warm, Brakes Set.
LOW
AVERAGE
AMPS
CYLINDER
SEQUENCE
165
SELECT "Compression" test.
3
Press START.
4
Switch ACCESSORIES off!
Close Doors, then START
CRANKING PEAK AMPS WAVEFORM
set of readings which indicates that compression is not
a likely engine problem. Then look for at least one cylinder which is notably low, thus suggesting doing a gauge
compression test so that the actual pressures/cylinder
are measured before extensive work is prescribed. In
between these decisions is the gray area where the
decision to go to the gauge test must be made with the
weight from other engine symptoms such as corresponding weak performance in the Power Balance test, an
indication of lean burn for a cylinder in the Spark Burn
test, poor emissions output, a noisy valve, a popping or
spitty exhaust pulsation, a steady jerking as engine load
increases, or other mechanical signs.
Close Doors, then START.
-24-
-----------------------ENGINE DATA REPORT
------------------------
STEP TWO
====CRANKING HISTORY====
(COMPRESSION)
SEC
RPM BATT
AMPS
1
13.33 151
2
326 11.88 129
3
306 11.57 122
With a beep, the display will show:
If previous use of the analyzer has verified that the igni4
301 11.35 116
tion can be suppressed and that the Spark Pickup is
5
300 11.17 114
7
292 11.03 113
working, the ignition will be suppressed immediately.
9
291 10.85 112
Otherwise when cranking begins the engine may run
11
289 10.76 112
13
288 10.70 112
momentarily for signal verification.
15
288 10.66 111
-----------------------CRANKING
VOLTS
Crank the engine with the ignition
key on
and the10.66
engine
If a coil primary signal cannot be sensed the test will
CRANKING AMPS
111
intake manifold throttle held wide
open. With automatic
abort. Check connections using HARD START and then
-----------------------CRANKING
RPM
288
suppression the ignition will be
held off.
retry.
ALTERNATOR AMPS
38
-----------------------CCA EST. current
487 is
Data saving will not begin BATTERY
until cranking
RECOVERY SECONDS
23
sensed. While waiting for amps
and primary TACH sig------------------------
BASIC TEST
TEST VARIATIONS
Crank ENGINE
8 Seconds
Hold THROTTLE Wide OPEN
no SPARK PICKUP Signal
nals from cranking, the analyzer will show:
RPM
8 AMPS
==SPARK BURN ANALYSIS==
RPM
IGEGY
BATTERY
772
43
14.13
no PRIMARY TACH pulses
Bat 12.34
IN FIRING ORDER
Not MIN
Cranking?
AVE
MAX SLOPE
0.9
2.0
2.1
10
0.9
2.0
2.1
17
Once started, the display during
test will
1.1 the2.0
2.2 constantly
10
1.0
2.0
2.1
15
show:
0
1
2
3
The operator may bypass starter current sensing for very
small or unusual engines, and start saving data immediately by pressing START.
4 MS
Crank ENGINE
8 Seconds
Hold THROTTLE Wide OPEN
A timed data gathering process begins here. It relies
upon a good electrical system and a steady cranking
BURN TIME RANGE
speed to get consistent results. Holding
the throttle wide
PRIMARY====
open ensures that the cylinders====IGNITION
get a full charge
of air to
850 RPM
BAT 14.01
compress. Over 80% throttle also
puts
many
computer
OSC 2 IGEGY 43 DRVR 0.8V
controlled engines in a reduced fuel mode so less fuel
847 RPM
will be dumped into the exhaust
during the DWL
test.3.6MSEC
DWL 0.3 VARIES TMG 4.8
Checks are done when cranking begins to verify that the
battery has enough voltage, and that the RPM is neither
too slow nor fast for reliable data measurements. Interruption displays indicate possible problem causes.
Compression Test Aborted
RPM too high to test
==== POWER BALANCE ====
If the engine diesels during cranking,
the test data
may
ORDER START END
%DROP
not be reliable.
1
852
767
10
2
3
4
849
858
848
764
764
763
—— Continue test on
next
page
——
0%
10
20
The graph shows the
results of the relative
compression test. The
cylinder with the highest relative compression
will have a 100% bar.
The weakest cylinder will
have the shortest bar.
If during the test, the battery voltage falls below 9.6 volts
it is too low to continue and one of the following will be
shown:
10
11
10
TEST ABORTED
?Battery CONNECTIONS?
30 +
TEST ABORTED
AMPS high, check STARTER
% RPM DROP
=ELECTRONIC COMPRESSION=
ORDER AMPS %MAX %LOW
1
120
99
1
2
120
99
1
2
3
119
98
4
121
100
0
80
90
TEST ABORTED
?CABLES or STARTER?
The test will stop and the operator should check the battery-starting system.
100%MAX
% OF PEAK AMPS CRANKING
-25-
STEP THREE
(CRANKING PEAK-AMPS)
BASIC TEST
TEST VARIATIONS
The saved measurement data is first analyzed for consistency. If it is too irregular the display may show a blank
and there will be the following messages:
WARNING
THE ENGINE MAY START DURING THE TEST
Engine Data Unsteady
RESULTS UNUSABLE
At test completion the ignition will be enabled momentarily to sense the Spark Pickup on cylinder plug #1. The
display will show:
This may be caused by a battery that weakens during the
test, or it could be from a type of engine starter that has
interfering vibrations.
STOP CRANKING
If the spark plug signal is absent the data results will not
be synchronized with the engine, but can still give an
indication of cylinder compression uniformity.
Stop cranking.
Cylinders not in Sync.
No SPARK PICKUP Signal
As soon as the spark is detected the engine should
stop.
The analyzer looks at the data to check for irregularities,
followed by this display which shows peak amps for each
cylinder.
AMPS pk 190 200 164 188
/CYL msg194 182
If "msg" appears, press MESSAGE. In this test MESSAGE also displays the last Cranking Analysis messages. Passing the last saved message or pressing START
returns the display to showing test data.
If there is a cylinder with 10% lower amps this message
will be shown:
Low COMPRESSION Likely
Check with Gauge
Press START to see the percent lower-than-the-highestcylinder amps. Readings over 10% indicate an unusual
cylinder.
AMPS
LOW
%
msg
5
3
0
9
18
6
The display is arranged by firing sequence.
(top: 1,2,3,4; bottom: 5,6,7,8).
If more than 8 cylinders are tested the data will be shown
in sets called "Bank A" and "Bank B", which are the first
and second halves of the firing sequence. Press START
to see both.
Note that the temperature and friction of the engine affect the amperage. A very hot or cold engine, or one
that has new piston rings and bearings may draw higher
than normal starter current, thus tending to cover up the
compression variations in the current.
Pressing START additionally displays the last Cranking
History data. The displays recycle.
Some users have found that some engines needing an oil
change can show large variations in peak amps. Normal
peak-amps are restored with fresh oil.
-26-
REFERENCE INFORMATION
TESTING ENGINES THAT MAKE RADIO
INTERFERENCE NOISE:
Engines that have metallic (non-resistance) wires going to
the ignition distributor usually radiate radio interference. If
severe enough it can cause the engine analyzer operation to be disrupted. This usually causes it to return to
Setup or to display strange characters. If you have these
problems the interference will have to be reduced.
Placing resistance in the distributor to coil wire will help.
Substitute a 10K to 20K ohm length of wire, or use a
plug-in resistance adaptor while testing the engine.
GREEN
COIL PRIMARY
SPARK PICKUP
NO. 1
SPARK
PLUG
Test for severe radio noise by seeing if the analyzer
works better with the spark pickup disconnected. Sometimes noise is caused by bad sparkwire insulation and
dirt which can allow sparks to track along the outside of
a wire.
-27-
YLINDER
PER CYLINDER
NKING
LYSIS
POWER
BALANCE
RESSION
RTER ALT.
% RPM DROP
AUTO
MANUAL
INT
PLAY
PRINT
AUTOTEST
PRINTING REPORTS
The printed report brings all of the saved
data together in a condensed form that
is easy to review for signal trends and for
comparing cylinder performance tests.
-----------------------ENGINE DATA REPORT
-----------------------====CRANKING HISTORY====
SEC
RPM BATT
AMPS
1
13.33 151
2
326 11.88 129
3
306 11.57 122
4
301 11.35 116
5
300 11.17 114
7
292 11.03 113
9
291 10.85 112
11
289 10.76 112
13
288 10.70 112
15
288 10.66 111
-----------------------CRANKING VOLTS
10.66
CRANKING AMPS
111
-----------------------CRANKING RPM
288
ALTERNATOR AMPS
38
-----------------------BATTERY CCA EST.
487
RECOVERY SECONDS
23
------------------------
Data is saved from the Cranking, Power
Balance and Spark Burn tests. PRINT REPORT includes
as many of these tests as have been done. Data will not
be printed if none of these tests have been done.
Measurements from the test keys on the left side of the
panel depend on test circumstances, so the printout
is done with PRINT DISPLAY, which makes it easy to
record the effects of test variations, such as when RPM
changes voltage or dwell.
==SPARK BURN ANALYSIS==
RPM
IGEGY
BATTERY
772
43
14.13
AUTO-TEST PROCEDURE
Although tests may be done in any order by using the
test keys, the Auto-Test feature has been provided as
the fastest way to gather all of the information for a complete printed engine dynamics report. The sequence
starts ith Cranking History, does the Spark Burn Analysis,
takes the Ignition Primary readings, does the Power Balance test, and finishes with the Electronic Compression
test. To have good measurements, all of the usual test
conditions have to be followed according to the screen
instructions.
0
1
2
3
4 MS
BURN TIME RANGE
====IGNITION PRIMARY====
850 RPM
BAT 14.01
OSC 2 IGEGY 43 DRVR 0.8V
To use the Autotest, pressing PRINT AUTOTEST, and
SELECT. Then proceed through the steps following the
instruction screens.
SELECT:
START :
IN FIRING ORDER
AVE
MAX SLOPE
2.0
2.1
10
2.0
2.2
10
2.0
2.1
15
2.0
2.1
17
MIN
0.9
1.1
1.0
0.9
847 RPM
DWL 3.6MSEC
DWL 0.3 VARIES TMG 4.8
==== POWER BALANCE ====
ORDER START END
%DROP
1
852
767
10
2
849
764
10
3
858
764
11
4
848
763
10
Do AUTO-TEST
Print DATA
-
If "Print DATA" is chosen, the printed report will include
the last test readings and messages, if any. Thus if the
Auto-Test had already been done, and then SPARK
BURN was used, a "Print DATA" command would printout
the same data as before except for the new burn times.
0%
10
20
30 +
% RPM DROP
=ELECTRONIC COMPRESSION=
ORDER AMPS %MAX %LOW
1
120
99
1
2
120
99
1
2
3
119
98
4
121
100
0
Disconnecting power will erase all stored readings.
80
90
100%MAX
% OF PEAK AMPS CRANKING
-28-
VISUAL CHECKLIST
At the end of report printing there is the option to add
a list of visual inspection items. This is usually done to
help inform the car's owner of any defects that should
be repaired.
Use SELECT to choose one of the three printed line endings. The initial setting for each line is “N/A” which means
Not Applicable, and it bypasses printing the item. “OK”,
“LOW”, and “BAD” are endings that print along with the
list item and indicate what inspection showed it to be.
SELECT: VISUAL CHECKLIST
START : Print ID FORM
REPORT IDENTIFICATION
The "ID FORM" option is a report identification footer.
This provides a standard method to neatly mark the test
record with the car, its odometer reading, and the date.
You can bypass the form printout by pressing any test
key.
The footer entries are then written on the report.
-29-
ANALYZER SERVICE
When power is applied to the analyzer it does a selfcheck and will indicate a problem if one is found. Also
during operation, checks are done to verify that necessary test signals are working. If a test will not work or
the analyzer indicates abnormal operation, the leads
associated with the test should be checked as described
below before sending it in for service.
If the analyzer will not respond to the keys, disconnect
power and try again. Be attentive to the connectors in
the battery cable. Wiggle them to detect intermittent
connections. Apply 12 volt battery to power leads for all
checks. The analyzer does not have any user serviceable internal parts.
BATTERY POWER LEAD CHECK
AMP PROBE CHECK
Press CHARGING STARTING to be able to read the
Amps display. Be sure that the probe is away from wires
and magnets. Press AMP ZERO. It will not operate if
the current sensed is over 20 amps during a zero check.
Wait a few seconds and watch that the reading is 0+/-1.
Wiggle the connectors to check for intermittent connections which would show that the probe cable has failed.
If the amps reading is zero it should be okay. If instead
of a reading the following display appears, the probe or
analyzer has failed.
If the display does not appear after 10 seconds when
hooked to a 12-volt battery try the following substitution:
Plug the Coil Primary/Auxiliary Lead into the analyzerʼs
12-volt battery panel connector. Connect the red Auxiliary Clip to the 12-volt battery plus, and the green Coil
Primary clip to minus. Be sure the battery is good. If
the analyzer display appears, the analyzer works, so the
power lead must have a bad connection. If the display
does not appear after 10 seconds the analyzer probably
needs service.
AMP ZERO Bad:
2 AMPS
See OPERATORS MANUAL
The Black clip goes to the three center conector contacts,
and the Red clip goes to the end contacts.
Press START to continue. Unplug the amp probe from
the analyzer and press AMP ZERO. If the amps reading does not become 0 +/-1 the analyzer needs service.
Otherwise the amp probe needs replacement.
COIL PRIMARY LEAD CHECK
Press IGNITION PRIMARY. Do the following test while
watching the analyzer "Drvr" reading: using a 1.5 volt
flashlight cell (AA, C, or D): touch the cell minus terminal
to the black Battery Power Clip; touch the green Coil
Primary Clip to the flashlight cell plus terminal. If the
reading is 1 to 2 volts the lead is okay. If —-v shows,
the cell is backwards but the lead is okay. If there is no
response the lead is open.
EXTENSION HARNESS CHECK
There are four identical 5-wire cables within the Extension Harness. First connect them all in series so that
at one end there is a pair of free ends. To put them in
series, on one end of the harness put red to yellow and
green to blank, then on the other end put green to yellow and use the remaining red and blank ends for the
analyzer and test lead connections.
AUXILIARY VOLTMETER CHECK
Press CHARGING STARTING. Use SELECT and read
the "Aux>NEG" voltage. Touch the red Auxiliary Clip to
the analyzer red Battery Clip. The "Aux>NEG" reading
should match the "Bat" reading within 0.05. Also touch
the red Auxiliary Clip to the black Battery Clip to see a
reading of 0.00 within 0.05. If there is any response the
lead is good. If the readings are not correct the analyzer
needs service.
Check the cables by plugging the series linked harness
from the battery power lead set to the corresponding
analyzer connector. The display must turn on. Press
CHARGING STARTING to see that the battery voltage
reading is normal. Wiggle the connectors to check for
intermittent connections. If the display does not come
on or the reading is too low, some wires are open and
the test should be tried with each separate cable in the
harness to find the bad one.
TIMING LIGHT CHECK
Triggering the Timing Light depends upon pulses from
the spark pickup. To make the light flash without hooking
it up to an engine, set up the "SPARK PICKUP CHECK"
on the next page to get trigger pulses to the pickup. Then
press the light's trigger buttons to see if it will flash.
-30-
SPARK PICKUP CHECK
With this test the analyzer is put in a special test mode
that produces simulated spark pulses to test the Spark
Pickup. At the same time some other internal function
self-tests are done.
SPARK PICKUP SELF TEST
Refer to the connection diagram when doing the following steps. There must not be any connections other than
the following:
1638 RPM
PULSES
GREEN
Press START.
If a wire is not hooked up properly, or broken it will
show:
BAD Connection
FIX and START to RETEST
Press START to retry the test. If the hookup is okay one
of the clip wires is probably open. Verify by doing the
“COIL PRIMARY LEAD CHECK” and the “AUXILIARY
VOLTMETER CHECK”. If the wires check okay the
analyzer is probably broken.
RED
4X
THROUGH
BLACK
COIL PRI & AUX CONNECTED
4 times thru SPRK PICKUP
RED
If the connections are good but the spark pickup is not
working it will show:
12 VOLT
1638 RPM output OKAY
no SPARK PICKUP Signal
Hold MESSAGE key
during power up.
1. Pass the green Coil Primary Clip wire four times
through the Spark Pickup opening such that the clip end
comes out the spark plug label side. Close the pickup
jaw.
2. Connect the green Coil Primary Clip to the red Auxiliary Clip.
3. Connect the analyzer red BatterY Clip to 12 volt battery plus.
4. Press and hold MESSAGE while connecting the analyzer black Battery Clip to battery minus.
5. If all connections and operations are correct the display will show:
REPLACEMENT PARTS
PART NUMBER
Coil Primary/Auxiliary Clip Lead ....................W004-93
Battery Clip Lead ...........................................W004-02
Extension Harness, 8' ...................................W000-04
Inductive Spark Pickup ...................................X008-01
Inductive Amp Probe, 5' .................................X000-02
Timing Light ....................................................X006-01
Printer Paper, Pk. of 3 rolls ............................H013-01
Paper Spindle ................................................ G016-09
Printer Cover ................................................. G016-08
-31-
Try wiggling the pickup lead terminations and check the
core contacts for a gap or breaks. Double check the direction of the coil Primary Clip wire through the pickup.
If the pickup is working the “no SPARK PICKUP Signal”
line will go away leaving only the “1638 RPM output
OKAY” to show that all is working.
With this arrangement the pulses in the test lead may be
used to check the calibration of other secondary ignition
tachometers. More turns may be needed in other pickups to sense the pulses. (4 stroke scale, 1% accuracy)
6. Leave the self test mode by pressing any test key.
Test Key
Measurement
Typical Readings
Interpretation
HARD
START
Battery Volts
(Engine Off)
12.4 to 12.8 Volts
Checks battery state of charge. Below 12.3V, charge
is low, or load may be on.
Ignition Energy
(Cranking)
More than 20 mVSec
Shows that there is coil energy available to start
the engine.
Battery Volts
(Engine Running)
13.2 to 15.2 Volts
Shows the voltage regulator setting and
if the alternator functions.
Amps Ripple
(Engine Running)
None
If alternator has a bad diode or stator a message will
appear.
Ignition Energy
(Engine Running)
35-55 mVSec
Checks for faulty coils, and driver modules.
Dwell
(Engine Running)
60% w/ Ballast
3 to 4 mSec current limited
Adjust as necessary.
Checks ignition modules.
Dwell Variation
(Engine Running)
3.0° or less
Checks primary ignition system performance.
Test from Idle to Cruise RPM.
Timing Variation
(Engine Running)
3.0° or less
Shows ignition timing irregularity if too high.
Driver Voltage
(Engine Running)
Electronic less than 1.5V
Points less than 0.3V
Shows coil driver module, and module ground
resistance if too high.
Coil Oscillations
(Engine Running)
Electronic
Points
Checks for shorts in coil insulation or connected
components.
Burn Time Average
(Engine at Idle)
0.8 to 2.3 mSec
Checks condition of secondary ignition system
Finds open or grounded spark plug wires.
Burn Time Minimum
(Accelerate Engine)
more than 0.8 mSec
Shows worn or wide gap plugs if less.
Burn Time Maximum
less than 2.3 mSec
Finds grounded plugs or wires. Locates ignition misfires.
Burn Slope
-30 to +30
Lean mix or wide plug gap if 20 greater than average.
Rich mix or high resistance plug if 20 less than average.
Cranking Volts
9.6 to 12 Volts
Checks battery and starter condition performance.
Cranking Amps
100 to 300 Amps
High amps, possible bad starter.
Low amps, possible bad connections, or bad battery.
Cranking RPM
Over 150 RPM
Checks starter performance.
Alternator Amps
50 to 100 Amps
Compare alternator output to specs.
Battery CCA est.
300 to 600 CCA
Compare to Battery Spec's
If 20% lower than the rating on the battery,the
battery is weak and may be ready for replacement.
Amps Peak
Less than 5 percent
Probably low compression, if more than 8%.
CHARGING
STARTING
IGNITION
PRIMARY
SPARK
BURN
CRANKING
ANALYSIS
1 to 4 Osc
4 to 8 Osc
POWER
BALANCE
%RPM drop when each 5 to 15% within 2:1 ratio The higher the number the stronger the cylinder. A
cylinder is shut off
negative number means the engine speed increased.
FUEL
INJECTION
Port Injection
0.4 to 20 mSec
Measures on-time of the injector drive.
Solenoid Duty
30° to 60° M/C, 10 Hertz
Checks function of mixture control solenoid.
SENSOR
TEST
Throttle Position Sensor
0.5 to 5V with no glitches
Checks function of throttle position sensor.
Oxygen Sensor
0.45V & over 1 Cross./Sec. Checks activity of the oxygen sensor.
Ohmmeter
1 to 50K Ohm
Measures resistance to ground.
Diode Volts
0.5 to 0.7 Volts
Measures diode forward voltages.
Note: Use repair manuals and compare similar engines to obtain actual specifications.
Typical readings shown apply to most normal vehicles.
DIESEL TIMING & RPM
The analyzer also provides diesel engine RPM and injection timing tests. The necessary input signals come from
the optional Ferret 854 Magnetic TDC Detector, and from
a No.1 cylinder Diesel Injection Detector. See instructions provided with the optional detectors.
SELECT: Diesel/ 4Stroke
Ignition
then START
The analyzer SETUP has a diesel ignition selection.
If selected, analyzer operation is limited to the following tests. Press any test key to find these tests.
SELECT:
TEST
then START
MAG PROBE TESTS
TDC signals can be detected from timing probes mounted
on engines. The TDC detector is designed to work with
timing wheels having either notches or pins. When the
magnetic probe is aligned with a wheel mark the detector sends a pulse to the engine analyzer and flashes an
indicator lamp on the detector. To operate, plug the TDC
Detector into the analyzer timing connector, and connect
the magnetic probe to the Detector.
Mag RPM, V & A:
Reads RPM from the Mag Probe signal, and displays battery volts, aux. volts, and the amp probe sensed current.
The test calls for selection of the number of wheel dents:
(pins or notches) Choose 1 & VW, 2, 3, or 4. Magnetic
Probe RPM readings work from cranking to 6000 RPM.
Mag Probe Timing:
The display shows No.1 cylinder RPM, timing advance
degrees, and the selected Offset. The test reads the ignition timing angle between the No.1 cylinder pulse and
the mag probe pulse with the offset angle subtracted.
The test selections for mag probe offset are: 20°, 0°,
10°, 15°, & VW. Timing measurements work from idle
to 6,000 RPM.
Injct RPM, V & A
Mag RPM, V & A
Mag Probe Timing
Ohms to Ground
DIESEL INJECTION DETECTOR TESTS
Connect the injection detector pulse sensor around the
No.1 cylinder fuel line, and connect the detector to the
Analyzer Spark Pickup input. For the most reliable measurements SELECT Diesel in the analyzer SETUP.
XXXX RPM
ADV xxx
START to save. 20 Offset
Up to five readings can be saved and printed as data.
Injct RPM, V & A:
The “Injector RPM” test reads RPM from the No.1
cylinder injection detector input, and displays battery volts, aux. volts, and the amp probe current.
The screen is like the “Charging Starting” test.
XXXX RPM
XXX AMPS
Bat 13.76
Aux>Gnd 10.43
Diesel Strobo Timing:
Diesel Timing can also be measured with the strobo timing light when the No.1 cylinder signal is provided by the
Diesel Injection Detector. The light can be used without
selecting a specific test.
OHMS TO GROUND
This is the same “Sensor Test” key function.
-33-
This test is also available for spark ignition engines.
Press the SENSOR TEST key to SELECT the test.
Without the TDC Detector connected this test may show
strange readings. More detailed instructions are enclosed with the 854 Magnetic TDC Detector and Diesel
Injection Detector.
SAFETY PRECAUTIONS
— Read All Instructions Before Using The Analyzer —
•
Always wear eye protection when testing vehicles. Be extra careful near
batteries and moving parts. Do not lay tools on a battery.
•
Battery gas is highly explosive.
a. If a battery explodes flush the acid away from persons skin with
generous amounts of water. Follow up with a neutralizing solution
of baking soda and then more water.
Treat clothing, vehicle parts, and equipment similarly. Any acid
traces inside equipment must be removed by generous rinsing. Dry
equipment and place in a warm 50°C (120°F) oven until thoroughly
dry.
b. Never use a wrench on the ungrounded battery terminal until the
grounded one has been disconnected. Contact between the vehicle
body metal and the hot terminal can cause sparks to ignite gas or
even weld tools into a battery short circuit.
c.
Keep the space around a battery well ventilated.
d. Do not make sparks or allow flames near batteries.
•
Before working on a vehicle set the brakes and block the wheels.
Beware of automatic parking brake releases.
•
Keep your work area well ventilated and free of exhaust.
Engine exhaust contains deadly poisons.
•
Avoid electrical shocks caused by getting close to live ignition wires or
touching the coil TACH terminal. A personʼs reaction near a live engine
can be more damaging than the shock.
•
Keep spark producing devices at least 0.5m (18”) above the floor to
reduce the hazard of igniting gasoline vapor.
•
Do not let test leads wind up in a moving fan or pulley.
away.
E016-09B
Route leads
Printed in USA