1
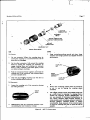
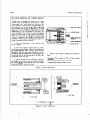
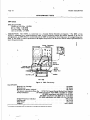
. ) ,
, . ~t '
.'
"
'J".,
, '.'
~l'
r
•
\
",
"<1
I
~'.
".'
•
~
•
"
.
,
•
~
•
'I
'
~."
•
.'
, - .. '
•
'.
~
•
•
,
•
>
,
• J• '
•
28. Rellectometer Application. For information
about rel1ectometer systems and measurements.
see flP Application Note Index, copies of which
are available upon request.
29. Harmonic Frequency Comparison Measurement Application. The detector "an be used as a
mixer in harrnonic-Irequency comparison measurements (see liP Application Note Index for further
information ).
30. PERFORMANCE TESTS
31. The following paragraphs suggest methods to
USe for testing detector specifications. For these
tests refer to the manuals of the equipment involved
for operating instructions.
32. Frequency Response Test
a. Using signal sources covering 10 Mill to
13 Glb with a 10 dB isolating attenuator and a
power meter, connect power sensor to attenuator,
Adjust RF power level to ·20 dBm input to power
sensor.
b.
nal
Without changing Rf' power level of sigdisconnect power sen"or.
SOlUTP,.
c. Connect detector to attenuator. ;\leasure
de voltag.. output from detector and record rneasurement.
d. Change frequency of signal source and reo
peat step; a through".
e. Since the detector follows a square-law
response at this power level, it; output is propertional to power (P d B = 10 log Vol. Total variation
of detector readings should meet specifications [see
Table 1) for all frequencies of ioterest across the
band.
NOTE
~llt~t:ip!e mismatch errors cmY~lld by ettenuator SWR, power meter SlrR. and deteclor SWR shouid bc tahen into aecount, us
well a.i the accuru(.'y of the uulicator WH'C
to fW?nJure- the- de't~ctor·s Otltpu~.
•
~
"
•
'
•
•
Page 5
Model 423A/8410..\
Connect output of CW generator to power meter.
Measure adjusted levels (set in step b) of CW generator output. The peak power of the pulse en. rlope
observed in step a is equal to the output power of
the CW generator.
•
33. High level Sensitivity Test
a. Using si, nal sources covering 10 ;',lIIz to
18 Gllz and a de voltmeter or osci.ioscope as the
indicator, connect detector to signal source. Ad
just Rf' power lew I for a 100 mV detected output
from detector.
4
b.
Disconruct detector from signal source
-md measure RF output level. The Rf' output
level should be <;; 0.35 roW.
c. Repeat 5 .eps a and b for all frequencies
of interest across I he band.
34. low Level Ser<itivity Test
a. Using a ;.jgnal source (covering 100 MIl'l
to 1 Gllz), a 10 dB attenuator, and a power meter.
connect attenuator to signal source and power sensor to attenuator. Adjust R F power level for
'-20 dBm output from attenuator. Verify the ambient temperature.
b. Disconnect power sensor from attenuator
and connect detector. Measure dc voltage output
from detector. The output should be > ·1.0 m V
at 25" C. The sensitivity slope is typically
-0.01[; dBte from O"C to +55'C.
NOTE
Multiple mismatct: error:; caw;cd b~' attenualor SWR. power meier SWR, and delector SWR so ,ld be taker: into acco!Jnt. G•.,
uel! as u<.'cu,'acy vi indicator u.'ied to nlt'a:;!lre detector:~ outpu t.
35. Malch Test (SINR)
30. To verify the detector's SWR specifications,
use any system whose measurement accuracies for
SWR (residual SW/O are known.
37. ADJUSTMENTS
38_ The detectors have no internal adjustments.
:39. REPLACEABLE PARTS
-10. The succeeding paragraphs contain information pertaining to replaceable parts [see Table 2l
and the ordering of replaceable parts for the
;',lodels 423,\, 8·170'\. and 11523'\.
·11. To order a replacement part. address order or
inquiry to the nearest Hewlett-Packard office (see
•
•