1
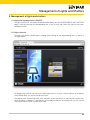
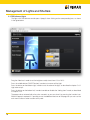
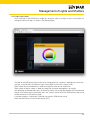
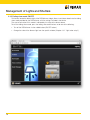
Manuale utente - User instructions
VIMAR By-web
2
Contratto di licenza Vimar con l'utente finale
Contratto di licenza Vimar con l’utente finale
VIMAR SPA con sede in Marostica (VI), Viale Vicenza n. 14 (http://www.vimar.com), unica proprietaria del
software denominato “Software WebServer”, con il presente contratto concede in licenza d'uso il programma
sopraindicato.
VIMAR SPA declina ogni responsabilità per eventuali danni provocati dall'uso improprio del programma sopracitato, in particolare per danni diretti o indiretti a persone, cose e/o animali attinenti a perdite economiche che si
verifichino in relazione all'uso del software.
VIMAR si riserva di apportare in qualsiasi momento, senza alcun preavviso, modifiche atte a migliorare la funzionalità del suddetto software. È vietata qualsiasi modifica, traduzione, adattamento e creazione di applicazioni
basate sul software sopraindicato, senza il preventivo consenso scritto di VIMAR.
L'utente dovrà verificare la rispondenza del programma alle proprie esigenze interpretando criticamente i risultati
per verificare le conseguenze delle scelte progettuali realizzate.
Tutti i rischi concernenti i risultati e le prestazioni del programma sono assunti dall'utente.
VIMAR SPA mantiene la proprietà esclusiva del software.
È vietato effettuare copie non autorizzate del programma.
Non è consentito all’utilizzatore modificare, tradurre, adattare, decompilare, disassemblare o creare applicazioni
derivate dal programma.
L'Utilizzatore si impegna a non eliminare dal software alcuna informazione relativa al Copyright.
Il programma è protetto dalle leggi sul Copyright in vigore in Italia e previste dai trattati internazionali, pertanto,
qualunque attività realizzata in contrasto con quanto sopra espresso sarà perseguita nelle opportune sedi.
Microsoft, Windows, Vista, Xp, Seven, Media Center, Internet Explorer sono marchi registrati di Microsoft Corporation negli Stati Uniti e/o in altri paesi.
Apple, Mac, Mac OS, iMac, MacBook, iPhone, iPod Touch, iPad, Safari sono marchi di Apple Inc., registrati negli
U.S.A. ed altri Paesi.
Mozilla, Firefox sono marchi registrati di Mozilla.
Google Chrome è un marchio commerciale di Google Inc.
Linux è un marchio registrato di Linus Torvalds negli Stati Uniti e/o in altri paesi.
VIMAR SPA
Viale Vicenza, 14
36063 Marostica VI - Italy
http://www.vimar.com
1
2
Indice
1. Introduzione……………………………………………………………………………………………………………
1.1 Cos'è VIMAR By-web……………………………………………………………………………………………
1.2 Accesso in rete locale……………………………………………………………………………………………
1.3 Layout generale……………………………………………………………………………………………………
4
4
4
7
2. Ambienti e funzioni………………………………………………………………………………………………… 8
2.1 Premessa………………………………………………………………………………………………………… 8
2.2 Menu ambienti…………………………………………………………………………………………………… 8
2.3 Menu funzioni……………………………………………………………………………………………………… 8
2.4 Pagine in visualizzazione griglia………………………………………………………………………………… 9
2.5 Pagine in visualizzazione mappa………………………………………………………………………………… 11
3. Gestione luci e tapparelle…………………………………………………………………………………………… 13
3.1 Luci e attuazioni on/off…………………………………………………………………………………………… 13
3.2 Luci dimmerate…………………………………………………………………………………………………… 13
3.3 Luci dimmerate RGB……………………………………………………………………………………………… 14
3.3.1 Impostazione colore luci…………………………………………………………………………………… 15
3.3.2 Attivazione/disattivazione modalità fading show………………………………………………………… 16
3.4 Tapparelle e movimentazioni…………………………………………………………………………………… 17
4. Gestione scenari…………………………………………………………………………………………………… 18
4.1 Esecuzione di scenari…………………………………………………………………………………………… 18
4.2 Modifica di uno scenario………………………………………………………………………………………… 19
5. Gestione clima……………………………………………………………………………………………………… 22
5.1 Controllo termostati……………………………………………………………………………………………… 22
5.2 Programmazione settimanale…………………………………………………………………………………… 26
6. Controllo carichi……………………………………………………………………………………………………… 28
6.1 Pagina controllo carichi…………………………………………………………………………………………… 28
7. Gestione programmi eventi………………………………………………………………………………………… 31
7.1 Premessa………………………………………………………………………………………………………… 31
7.2 Configurazione di un evento……………………………………………………………………………………… 31
7.3 Programmazione temporale di un evento……………………………………………………………………… 32
8. Antintrusione………………………………………………………………………………………………………… 36
8.1 Premessa………………………………………………………………………………………………………… 36
8.2 Gestione delle parzializzazioni…………………………………………………………………………………… 36
8.3 Eventi……………………………………………………………………………………………………………… 39
8.4 Allarmi……………………………………………………………………………………………………………… 39
9. Diffusione sonora…………………………………………………………………………………………………… 40
9.1 Premessa………………………………………………………………………………………………………… 40
9.2 Gestione ricevitori………………………………………………………………………………………………… 40
9.3 Ingresso RCA……………………………………………………………………………………………………… 42
9.4 Radio FM………………………………………………………………………………………………………… 43
9.5 Docking Station…………………………………………………………………………………………………… 44
9.6 I R ………………………………………………………………………………………………………………… 47
10. Consumo energetico……………………………………………………………………………………………… 49
10.1 Premessa………………………………………………………………………………………………………… 49
10.2 Visualizzazione grafica………………………………………………………………………………………… 49
10.3 Dettagli…………………………………………………………………………………………………………… 53
11. Messaggi di sistema……………………………………………………………………………………………… 54
12. Videosorveglianza………………………………………………………………………………………………… 55
13. Multimedia video touch screen 10in (cod. 21553)…………………………………………………………… 56
3
Introduzione
1. Introduzione
1.1 Cos'è VIMAR By-web
VIMAR By-web è un Web Server che permette di gestire il proprio impianto domotico By-me attraverso
un PC, notebook, tablet o touch-screen, nonché dispositivi mobili purché dotati di un browser in grado
di visualizzare pagine web. Per dispositivi mobili iPhone e iPod touch è disponibile inoltre un'applicazione
scaricabile da iTunes, che consente un accesso più rapido alle funzionalità di By-web.
La gestione dell'edificio può essere effettuata sia localmente che da remoto, purchè sia disponibile una
connessione permanente ad internet.
Questo manuale illustra come utilizzare le funzionalità di By-web ed è pertanto destinato agli utenti finali;
il manuale presuppone che By-web sia stato correttamente configurato dall'installatore, secondo quanto
riportato nel “MANUALE INSTALLATORE”. Il manuale fa riferimento ad una configurazione di esempio
tipica; le schermate grafiche del proprio By-web potranno differire in base alla specifica personalizzazione
effettuata dall'installatore.
Il Web Server Vimar By-web non è compatibile con il browser Microsoft Internet Explorer 8 e
precedenti.
1.2 Accesso in rete locale
E' possibile utilizzare VIMAR By-web utilizzando un qualunque dispositivo dotato di browser web collegato alla rete locale dell'edificio, anche attraverso connessione senza fili. Nelle pagine seguenti di questo
manuale si fa riferimento ad un collegamento con PC/MAC attraverso browser Google Chrome.
Per accedere a By-web è sufficiente aprire una finestra del browser e digitare nella barra degli indirizzi
l'indirizzo IP assegnato dall'installatore al Web Server all'interno della propria rete locale; l'indirizzo di
fabbrica del dispositivo è:
http://192.168.0.110
NOTA: chiedere al proprio installatore l'indirizzo da utilizzare per collegarsi a By-web; si consiglia di
inserire tale indirizzo nei preferiti del proprio browser in modo da non doverlo digitare tutte le volte.
4
Introduzione
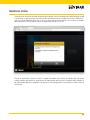
Dopo alcuni secondi viene mostrata la seguente finestra:
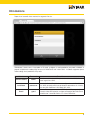
Selezionare l'utente con cui accedere a By-web, e digitare la corrispondente password; chiedere al
proprio installatore le credenziali di accesso al Web Server ed i relativi diritti. La tabella seguente riporta
l'elenco degli utenti predefiniti di By-web:
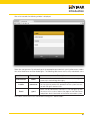
Utente
Password
Descrizione
Amministratore
admin
Utente amministratore dell'impianto domotico. Ha i diritti di creare
utenti e gestirne i diritti.
Installatore
poweruser
Utente dedicato all'installazione e configurazione del Web Server.
Ha i diritti per poter effettuare qualunque operazione sul sistema,
ma non può modificare i diritti degli altri utenti.
Guest
guest
Utente di base per connessioni da PC. Ha i diritti per poter visualizzare lo stato dell'impianto, navigare nelle pagine del Web Server
ed effettuare i comandi di base sul sistema domotico.
5
Introduzione
Nella parte inferiore della finestra di inserimento delle credenziali di accesso è presente il checkbox "Resta
connesso".
L'abilitazione del checkbox prevede la memorizzazione di alcuni dati che consente di rendere più veloci i
successivi accessi al Web Server se sono soddisfatte le seguenti condizioni:
• L'indirizzo IP del client da cui si effettua l'accesso non è cambiato.
• Le credenziali dell'utente che effettua l'accesso non sono cambiate.
• Alla fine della precedente connessione al Web Server è stato chiuso il browser web senza uscire dalla
sessione del Web Server tramite il pulsante "Logout".
Il primo accesso al Web Server, dopo aver abilitato il checkbox, prevede un tempo aggiuntivo per la
memorizzazione dei dati richiesti.
Gli accessi successivi al primo, se sono soddisfatte le condizioni suddette, non prevedono la
visualizzazione della finestra di login per l'inserimento delle credenziali di accesso al Web Server e
l'accesso alle funzionalità del Web Server risulta più veloce.
Se si esce dal Web Server utilizzando il pulsante "Logout", alla successiva connessione sarà riproposta la
finestra di inserimento delle credenziali di accesso e saranno memorizzati nuovamente i dati dell'utente.
Le schermate riportate nel seguito di questo manuale si riferiscono ad un accesso con l'utente
“Amministratore”.
6
Introduzione
1.3 Layout generale
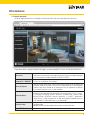
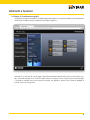
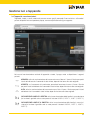
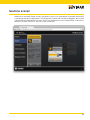
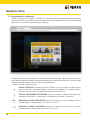
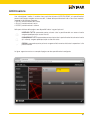
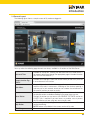
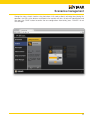
La figura seguente mostra un esempio di schermata di By-web una volta effettuato l'accesso:
Si possono notare i seguenti elementi di pagina, sempre disponibili in tutte le sezioni del Web Server:
Data e ora
Disponibili in alto a sinistra, mostrano la data e l'ora del Web Server.
Qualora non siano corretti, provvedere ad allinearli attraverso l'apposita pagina
in amministrazione (vedere “MANUALE INSTALLATORE”).
Ambiente o funzione
corrente Es: “BAGNO”
Disponibile in alto a destra, mostra in ogni momento la sezione in cui ci si trova,
sia essa un ambiente o una funzione.
Menu principale
Sempre visibile nella parte sinistra della pagina; permette di accedere alle
principali sezioni di By-web; in alcuni casi la selezione di una voce comporta
l'apertura per alcuni secondi di un sotto-menu con cui selezionare l'ambiente
o la funzione specifica a cui si vuole accedere.
Pulsante Menu
Sempre disponibile in basso a destra, mostra un menu contestuale che
presenta le possibili operazioni disponibili in base alla pagina in cui ci si trova.
È possibile attraverso questo pulsante accedere alla sezione delle
IMPOSTAZIONI GENERALI oppure effettuare il LOGOUT (operazione
necessaria se si vuole accedere con un altro utente oppure impedire l'accesso
a By-web dal PC o dispositivo che si sta utilizzando).
Pulsante Help
Mostra un aiuto in base alla sezione in cui ci si trova ed all'operazione che si
sta effettuando.
NOTA: funzione non disponibile nella versione attuale di By-web.
Logo VIMAR
Permette in ogni momento di tornare alla pagina principale.
7
Ambienti e funzioni
2. Ambienti e funzioni
2.1 Premessa
VIMAR By-web permette di “navigare” attraverso le funzioni del proprio impianto domotico secondo due
distinti criteri: la navigazione per AMBIENTI permette di gestire le funzioni in base alla loro ubicazione
nell'edificio, mentre la navigazione per FUNZIONI consente l'accesso diretto a tutte le funzioni della
medesima tipologia, a prescindere dalla loro dislocazione nell'edificio.
L'elenco degli AMBIENTI viene personalizzato dall'installatore in base alla struttura dell'edificio e dell'impianto domotico; esso può contenere anche pagine costituite da insiemi di funzioni non necessariamente
legate ad un ambiente dell'edificio, come ad esempio una pagina di ”preferiti”. Viceversa, l'elenco delle
FUNZIONI non può essere modificato.
2.2 Menu ambienti
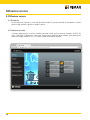
Premendo il pulsante “AMBIENTI” del menu principale viene mostrato un sotto-menu contenente l'elenco
degli ambienti disponibili; selezionare la voce desiderata per accedere alla pagina corrispondente.
Il menu secondario si chiude automaticamente dopo alcuni secondi, oppure alla pressione della voce
desiderata, in modo da lasciare libera l'area di pagina sottostante. Nel caso di configurazioni con un
numero elevato di ambienti, sono disponibili in cima ed al fondo del menu due pulsanti freccia, con cui
scorrere l'elenco.
Le pagine relative agli ambienti possono essere configurate in modalità “GRIGLIA” o “MAPPA”; per ulteriori
dettagli, si rimanda alle sezioni successive di questo capitolo.
2.3 Menu funzioni
Premendo il pulsante “FUNZIONI” del menu principale viene mostrato un sotto-menu contenente l'elenco
delle tipologie di funzioni disponibili nel proprio impianto domotico; ognuna di queste voci permette di
visualizzare tutte le funzioni di una stessa tipologia:
Illuminazione
Accensione e spegnimento di luciON/OFF, regolazione di luci dimmerate,
controllo di prese comandate, etc...
Tapparelle
Azionamento di tapparelle e tende motorizzate, apertura/chiusura di varchi
etc...
Clima
Gestione della termoregolazione delle diverse zone climatiche di riscaldamento
e/o condizionamento.
Scenari
Esecuzione e personalizzazione delle scene con cui effettuare comandi multipli
sull'impianto domotico.
Controllo carichi
Monitoraggio dei consumi e gestione del controllo dei carichi.
Audio
Gestione della diffusione sonora
Eventi
Gestione dei programmi eventi e della relativa pianificazione temporale.
Le pagine relative alle funzioni prevedono esclusivamente la visuale “GRIGLIA”; per ulteriori dettagli, si
rimanda alle sezioni successive.
8
Ambienti e funzioni
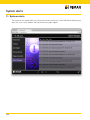
2.4 Pagine in visualizzazione griglia
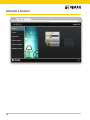
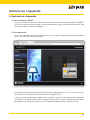
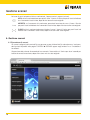
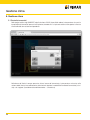
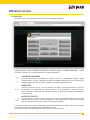
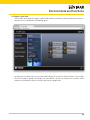
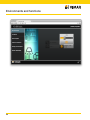
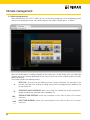
Le pagine di funzioni o di ambienti in modalità griglia prevedono la visualizzazione delle funzioni domotiche
sotto forma di tabella, come esemplificato nella figura seguente:
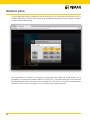
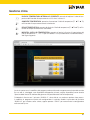
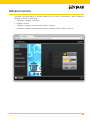
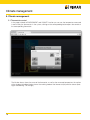
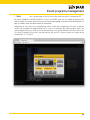
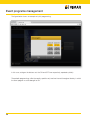
Facendo click sull'icona di una funzione è possibile comandarla direttamente (nel caso di funzioni semplici, come ad esempio le luci ON/OFF) oppure aprire un “popup” con cui gestirla; per ulteriori dettagli,
si rimanda al capitolo successivo di questo manuale, che prende in esame tutte le diverse tipologie di
funzioni e illustra come gestirle.
9
Ambienti e funzioni
10
Ambienti e funzioni
2.5 Pagine in visualizzazione mappa
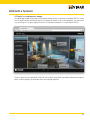
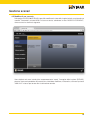
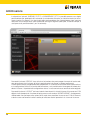
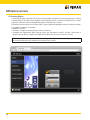
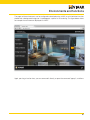
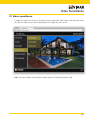
Le pagine degli ambienti possono essere configurate per essere visualizzate in modalità MAPPA, ovvero
con le singole funzioni posizionate sopra un'immagine di sfondo, sia essa una fotografia, una planimetria
o un rendering 3D. La figura seguente mostra un esempio di ambiente in visualizzazione MAPPA:
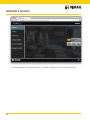
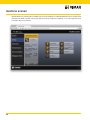
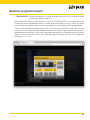
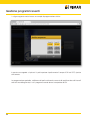
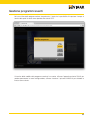
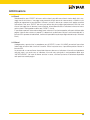
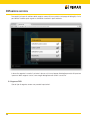
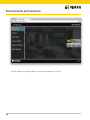
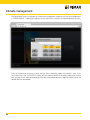
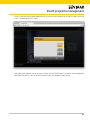
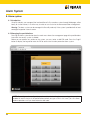
Anche in questo caso, premendo l'icona di una funzione è possibile comandarla direttamente oppure
aprire il relativo “popup” di comando, come nell'esempio seguente:
11
Ambienti e funzioni
Per ulteriori dettagli sulle specifiche funzioni, si rimanda al capitolo successivo di questo manuale.
12
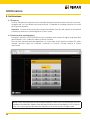
Gestione luci e tapparelle
3. Gestione luci e tapparelle
3.1 Luci e attuazioni ON/OFF
Le luci e le attuazioni di tipo ON/OFF possono essere comandate direttamente dalle pagine di AMBIENTI
e FUNZIONI semplicemente premendo sull'icona corrispondente; in ogni momento l'icona mostra lo stato
di accensione della funzione corrispondente.
3.2 Luci dimmerate
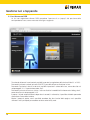
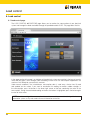
Le luci con regolazione dimmer prevedono l'apertura di un “popup” alla pressione della corrispondente
icona, come mostrato nella figura seguente:
Trascinando la barra di scorrimento è possibile impostare la regolazione da 0% a 100%, mentre il pulsante
nella parte bassa del popup permette di accendere o spegnere la luce.
Il popup si chiude automaticamente dopo alcuni secondi; in alternativa, è possibile chiuderlo premendo
nuovamente l'icona della funzione. Mentre il popup è aperto non è possibile accedere alle altre funzioni
della pagina, ma è possibile utilizzare il menu principale per accedere ad altre sezioni di By-web.
13
Gestione luci e tapparelle
3.3 Luci dimmerate RGB
Le luci con regolazione dimmer RGB prevedono l'apertura di un “popup” alla pressione della
corrispondente icona, come mostrato nella figura seguente:
Trascinando la barra di scorrimento è possibile impostare la regolazione della luminosità da 0% a 100%.
Premendo il pulsante centrale (pulsante ON/OFF) è possibile attivare o disattivare la luce.
Premendo il pulsante in basso a destra è possibile impostare il colore della luce, come descritto nel
sottoparagrafo “3.3.1 Impostazione colore luce”.
Premendo il pulsante in basso a sinistra si attiva o disattiva la modalità di funzionamento “fading show”,
come descritto nel sottoparagrafo 3.3.2.
Il popup si chiude automaticamente dopo alcuni secondi; in alternativa, è possibile chiuderlo premendo
nuovamente l'icona della funzione.
Mentre il popup è aperto, non è possibile accedere alle altre funzioni della pagina, ma è possibile
utilizzare il menu principale per accedere ad altre sezioni di By-web.
14
Gestione luci e tapparelle
3.3.1 Impostazione colore luce
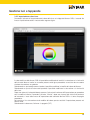
Premendo il pulsante di impostazione del colore della luce, nel widget del dimmer RGB, si accede alla
finestra “impostazione colore” mostrata nella seguente figura:
Il colore della luce del dimmer RGB è impostabile modificando la tonalità, la saturazione e la luminosità
della luce del dimmer tramite lo strumento presente nella figura precedente e costituito da una corona
circolare che contiene un quadrato.
Selezionando un punto della corona circolare è possibile modificare la tonalità del colore del dimmer.
Selezionando un punto all’interno del quadrato è possibile modificare la saturazione e la luminosità
della luce.
Dopo aver ottenuto il colore desiderato, premere il pulsante di conferma dell’impostazione per procedere
con la modifica richiesta. Premendo il pulsante “Annulla”, dopo aver risposto alla richiesta di conferma
del comando, si esce dalla finestra di impostazione del colore del dimmer RGB e si torna alla pagina
precedente.
Nel caso in cui sia stata confermata la modifica del colore, questo sostituirà l’impostazione presente nel
dimmer RGB.
Selezionando il colore nero, il dimmer si spegnerà (OFF).
15
Gestione luci e tapparelle
3.3.2 Attivazione/Disattivazione modalità fading show
Il pulsante in basso a sinistra del widget del dimmer RGB consente di attivare o disattivare la modalità
fading show prevista dal dispositivo dimmer RGB, con le impostazioni presenti nel dispositivo.
Lo stato di attivazione di tale modalità è evidenziata dallo stato del pulsante suddetto.
Per uscire dalla modalità fading show premere il pulsante attivazione/disattivazione fading show, oppure
eseguire una delle seguenti operazioni:
• Spegnere il dimmer RGB tramite il pulsante centrale (pulsante ON/OFF).
• M
odificare il colore della luce del dimmer dall’apposita finestra (sottoparagrafo 3.3.1 Impostazione
colore luce).
16
Gestione luci e tapparelle
3.4 Tapparelle e movimentazioni
Tapparelle, tende e varchi motorizzati possono essere gestiti premendo l'icona relativa e utilizzando i
pulsanti disponibili nel corrispondente popup, come esemplificato nella figura seguente:
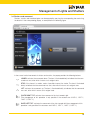
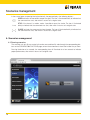
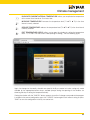
Nel caso di movimentazione verticale di tapparelle e tende, il pupup mette a disposizione i seguenti
pulsanti:
ABBASSA: attiva la movimentazione del serramento verso il basso. L'icona si illumina per pochi
istanti ad indicare che il comando è stato inviato, dopo di che torna allo stato originale.
ARRESTA: se il serramento è in movimento, permette di arrestarne la corsa. L'icona si illumina
per pochi istanti ad indicare che il comando è stato inviato, dopo di che torna allo stato originale.
ALZA: attiva la movimentazione del serramento verso l'alto. L'icona si illumina per pochi istanti
ad indicare che il comando è stato inviato, dopo di che torna allo stato originale.
INCLINAZIONE LAMELLE A DESTRA: attiva la movimentazione delle lamelle in verso destrorso
(La funzione è gestibile solo se sono presenti l'attuatori 01852.2, 14527.1, 16967.1, 20527.1).
INCLINAZIONE LAMELLE A SINISTRA: attiva la movimentazione delle lamelle in verso sinistrorso (la funzione è gestibile solo se sono presenti l'attuatori 01852.2, 14527.1, 16967.1,
20527.1).
17
Gestione scenari
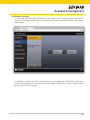
Nel caso di varchi ad apertura/chiusura orizzontale, il popup mostra i seguenti pulsanti:
APRI: attiva la movimentazione per aprire il varco. L'icona si illumina per pochi istanti ad indicare
che il comando è stato inviato, dopo di che torna allo stato originale.
ARRESTA: se il serramento è in movimento, permette di arrestarne la corsa. L'icona si illumina
per pochi istanti ad indicare che il comando è stato inviato, dopo di che torna allo stato originale.
CHIUDI: attiva la movimentazione per chiudere il varco. L'icona si illumina per pochi istanti ad
indicare che il comando è stato inviato, dopo di che torna allo stato originale.
4. Gestione scenari
4.1 Esecuzione di scenari
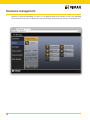
Gli scenari configurati nella centrale By-me possono essere richiamati da By-web attraverso i corrispondenti pulsanti disponibili nella pagina FUNZIONI SCENARI oppure negli ambienti in cui l'installatore li
ha collocati.
Alla pressione del pulsante di comando di uno scenario, l'icona relativa si illumina per alcuni secondi per
indicare la corretta esecuzione, dopo di che torna nel suo stato originale.
18
Gestione scenari
4.2 Modifica di uno scenario
Dalla pagina FUNZIONI SCENARI è possibile modificare lo stato delle singole funzioni associate ad uno
scenario. Premendo il pulsante MENU in basso a destra, selezionare la voce “MODIFICA SCENARIO”;
viene mostrata la schermata seguente:
Come indicato nel menu laterale (che temporaneamente “copre” l'immagine della funzione SCENARI),
premere l'icona corrispondente allo scenario che si desidera modificare; in alternativa, utilizzare il pulsante
“ANNULLA” in basso per tornare alla visualizzazione normale.
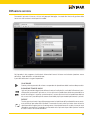
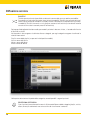
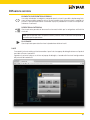
19
Gestione scenari
Selezionando uno scenario per la modifica, esso viene eseguito (in modo da portare tutte le funzioni nello
stato previsto dallo scenario stesso), per poi mostrare la schermata seguente, in cui sono presenti tutte
le funzioni ad esso associate:
20
Gestione scenari
Modificare lo stato delle singole funzioni utilizzando i pulsanti in By-web oppure azionandoli direttamente
in campo (durante questa operazione i LED dei pulsanti associati allo scenario lampeggiano, per aiutarne
l'identificazione) quindi premere il pulsante “SALVA” per confermare la nuova configurazione. In alternativa,
premere il pulsante “ANNULLA” per non salvare le modifiche
21
Gestione clima
5. Gestione clima
5.1 Controllo termostati
Nelle pagine relative agli AMBIENTI ed alla funzione CLIMA è possibile vedere la temperatura misurata in
tempo reale dai termostati presenti nell'impianto; facendo click sul pulsante relativo viene aperta la finestra
di controllo del termostato corrispondente:
Nella barra del titolo è sempre presente, oltre al nome del termostato, la temperatura misurata; nella
sezione della finestra immediatamente sottostante è riportata la modalità di lavoro del termostato (a sinistra) e la stagione (riscaldamento/condizionamento – sulla destra).
22
Gestione clima
In base alla modalità di lavoro corrente, la finestra di controllo del termostato prevede i seguenti pulsanti:
MODALITA': permette di modificare la modalità di lavoro del termostato. Viene mostrato un
elenco di modalità possibili in cui portare il termostato; l'elenco dipende dalla modalità corrente.
Selezionando una voce da tale elenco viene aggiornata la finestra di controllo del termostato per
consentire la regolazione dei parametri previsti dalla nuova modalità.
IMPOSTAZIONI DI ZONA: permette di cambiare la stagione del termostato (riscaldamento o
condizionamento) e l'unità di misura.
NOTA: cambio unità di misura non disponibile nella versione attuale di By-web.
AUMENTA SETPOINT: quando previsto, permette di aumentare la temperatura di setpoint per
la modalità corrente di un decimo di grado.
NOTA: se il termostato è in modalità AUTOMATICO, premendo questo pulsante la modalità
viene cambiata in “MANUALE A TEMPO”.
RIDUCI SETPOINT: quando previsto, permette di diminuire la temperatura di setpoint per la
modalità corrente di un decimo di grado.
NOTA: se il termostato è in modalità AUTOMATICO, premendo questo pulsante la modalità
viene cambiata in “MANUALE A TEMPO”.
AUMENTA TEMPO: quando previsto (modalità a tempo) permette di aumentare la temporizzazione di un'ora.
RIDUCI TEMPO: quando previsto (modalità a tempo) permette di ridurre la temporizzazione
di un'ora.
GESTISCI PROGRAMMA: quando il termostato è in modalità AUTOMATICO, permette di
accedere alla finestra di gestione del programma settimanale della zona climatica di cui il termostato fa parte.
Per ulteriori dettagli, si rimanda alla sezione successiva del presente capitolo.
Nel caso di termostati con gestione fan-coil, sono disponibili inoltre i seguenti pulsanti:
AUMENTA VELOCITA' VENTOLE: aumenta la velocità delle ventole. Impostazioni possibili:
VELOCITA' 1, VELOCITA' 2, VELOCITA' 3, AUTO.
RIDUCI VELOCITA' VENTOLE: riduce la velocità delle ventole.
23
Gestione clima
La figura seguente mostra un esempio di finestra di gestione di un termostato con gestione fan¬coil, in
modalità “MANUALE A TEMPO” (che prevede tutte le regolazioni da parte dell'utente: setpoint, temporizzazione e velocità delle ventole):
Nelle impostazioni dei setpoint di temperatura e del tempo (nelle modalità di funzionamento che lo
prevedono, e comunque diverse dalla modalità “AUTOMATICO”), è possibile velocizzare l’inserimento dei
dati editando direttamente il campo numerico: facendo click con il mouse sul campo di testo del dato da
modificare viene visualizzato un popup in cui è possibile inserire il dato desiderato.
24
Gestione clima
Fintanto che la finestra di controllo del termostato è aperta, nessun comando viene effettivamente inviato
al termostato; in ogni momento è quindi possibile chiudere la finestra, mediante il pulsante “ANNULLA”,
senza salvare le modifiche effettuate: in tal caso viene chiesta una conferma, che consente di chiudere
definitivamente la finestra oppure salvare le modifiche prima della chiusura.
Viceversa, premendo il pulsante “SALVA” sempre disponibile nella finestra di controllo del termostato
(tranne quando sono aperte le sotto-finestre di impostazione della zona o di selezione della modalità) è
possibile rendere effettive le modifiche; By-web invia i comandi opportuni al termostato e chiude la finestra
di controllo.
25
Gestione clima
5.2 Programmazione settimanale
Quando il termostato è in modalità “AUTOMATICO” è possibile impostare la programmazione settimanale
della zona climatica corrispondente attraverso l'apposito pulsante; viene aperta la finestra di controllo della
pianificazione settimanale, come nell'esempio seguente:
All'apertura della finestra viene effettuata una lettura della pianificazione per il giorno corrente, durante la
quale non è possibile effettuare alcuna operazione; dopo alcuni secondi (in base a quanti intervalli prevede
la programmazione corrente) viene mostrato il profilo giornaliero.
La finestra prevede i seguenti pulsanti:
IORNO SEGUENTE: permette di passare al giorno successivo rispetto a quello correnteG
mente visualizzato. Il passaggio al giorno successivo può richiedere alcuni secondi di attesa,
durante i quali viene caricata la programmazione dalla centrale By-me.
UPLICA PROGRAMMA GIORNALIERO: permette di copiare il programma del giorno corD
rentemente visualizzato in un altro giorno, selezionabile da un elenco a scomparsa.
INTERVALLO ORARIO PRECEDENTE: permette di spostare il cursore indietro nel tempo,
nell'ambito delle 24 ore giornaliere, di 20 minuti in 20 minuti.
INTERVALLO ORARIO SUCCESSIVO: permette di spostare il cursore avanti nel tempo,
nell'ambito delle 24 ore giornaliere, di 20 minuti in 20 minuti.
26
Gestione clima
UPLICA TEMPERATURA INTERVALLO CORRENTE: permette di replicare il valore di temD
peratura dell'intervallo di tempo corrente sui 20 minuti successivi.
UMENTA TEMPERATURA: permette di aumentare il livello di temperatura (T1 T2 T3)
A
nell'intervallo di tempo correntemente selezionato.
RIDUCI TEMPERATURA: permette di diminuire il livello di temperatura (T3 T2 T1) nell'intervallo di tempo correntemente selezionato.
ODIFICA LIVELLI DI TEMPERATURA: permette di aprire la finestra di impostazione dei
M
livelli di temperatura T1, T2 e T3 per la modalità in uso (riscaldamento o condizionamento) –
Vedi figura seguente.
Anche in questo caso, le modifiche alla programmazione settimanale vengono memorizzate nella centrale
By-me solo al salvataggio, reso disponibile dall'apposito pulsante sempre disponibile (tranne durante
l'apertura delle finestre di selezione del giorno o di impostazione dei livelli di temperatura).
Chiudendo la finestra con il pulsante “ANNULLA”, viene chiesta una conferma qualora siano presenti modifiche al programma rispetto alla configurazione in centrale; ribadire la pressione del pulsante
“ANNULLA” per chiudere senza salvare, oppure premere “SALVA” per memorizzare la configurazione
nella centrale By-me.
27
Controllo carichi
6. Controllo carichi
6.1 Pagina controllo carichi
La pagina FUNZIONI CONTROLLO CARICHI permette di monitorare i consumi del proprio impianto
elettrico e gestire i carichi controllati dall'apposito modulo 01855.
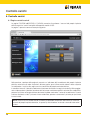
La pagina si presenta come nell'esempio seguente:
Nella porzione superiore della pagina è presente un indicatore dell'assorbimento del proprio impianto
elettrico, sotto forma di valore numerico e di barra grafica; quest'ultima cambia colore in base a quanto
l'assorbimento si avvicina alla soglia massima consentita dal proprio contratto elettrico.
In condizioni normali, il dato di assorbimento istantaneo viene letto circa ogni minuto da By-Web e aggiornato a video; qualora si desideri accelerare tale lettura per monitorare repentini variazioni di assorbimento,
premere il pulsante nell'angolo inferiore destro del riquadro contenente il valore di assorbimento. Durante
la lettura accelerata sul bus il pulsante rimane evidenziato; premere nuovamente il pulsante per ripristinare
lo stato iniziale.
NOTA: la lettura ravvicinata del dato di assorbimento potrebbe comportare rallentamenti o malfunzionamenti del proprio impianto domotico, in quanto By-web introduce un elevato numero di informazioni
sul bus.
28
Controllo carichi
Nella parte inferiore della pagina sono presenti i carichi gestiti dall'apposito modulo; il colore dell'icona
indica se il carico sia acceso o spento. Premendo su tale icona viene mostrato un popup di dettaglio,
come esemplificato nella figura seguente:
29
Controllo carichi
Questo pup-up permette di visualizzare la modalità di gestione del carico e di forzarlo ad ON, attraverso
l'apposito pulsante: lo stato viene aggiornato di conseguenza come nella figura seguente.
Premendo nuovamente il pulsante, lo stato del carico tornerà alla condizione antecedente la forzatura.
30
Gestione programmi eventi
7. Gestione programmi eventi
7.1 Premessa
VIMAR By-web permette di gestire i programmi evento configurati dall'installatore nel proprio impianto
domotico By-me, e disponibili nella centrale By-me nell'apposita sezione del menu.
7.2 Configurazione di un evento
La pagina EVENTI nella sezione FUNZIONI di By-web riporta l'elenco di tutti gli eventi disponibili nella
centrale By-me; per ognuno di essi viene mostrato direttamente nella pagina lo stato di esecuzione, se
attivo (icona di colore giallo) o in pausa (icona grigia):
31
Gestione programmi eventi
Facendo click sull'icona di un programma evento, viene aperta la relativa finestra di configurazione, come
mostrato nella figura seguente:
Premendo il pulsante “PAUSA”, il programma evento viene sospeso (l'icona passa in stato grigio); l'operazione viene immediatamente recepita dal sistema.
7.3 Programmazione temporale di un evento
In base alla configurazione realizzata dall'installatore, un programma evento può essere associato ad una
pianificazione oraria; la pianificazione può essere di tipo:
• SETTIMANALE:permette di impostare gli intervalli orari nei quali il programma evento viene impostato ad ON e a OFF per ogni giorno della settimana
• PERIODICO:permette di impostare due intervalli orari nell'arco della giornata, in cui il programma evento deve essere impostato ad ON e OFF
• CICLICO: consente di specificare un ciclo di durata negli stati ON e OFF, ripetuti dalla centrale
32
Gestione programmi eventi
• TEMPORIZZATO:permette di impostare un tempo di durata nello stato di ON al termine del quale
l'evento viene posto in stato OFF
Nelle pianificazioni orarie di tipo PERIODICO, CICLICO e TEMPORIZZATO, è possibile velocizzare
l’inserimento dei dati editando direttamente il campo numerico: facendo click con il mouse sul campo
di testo del dato da modificare viene visualizzato un popup in cui è possibile inserire il dato desiderato.
In base al tipo di programmazione oraria (tipo che non può essere variato da By-web), viene mostrata
una diversa finestra di gestione della programmazione stessa: la figura seguente riporta ad esempio la
programmazione settimanale, in tutto simile a quella del termostato, con la sola differenza che gli intervalli
sono di 10 minuti (invece di 20 minuti), e che è possibile impostare solo gli stati ON e OFF in luogo delle
temperature T1, T2 e T3.
33
Gestione programmi eventi
La figura seguente mostra invece un esempio di programmazione ciclica:
In questo caso agendo sui pulsanti si può impostare rispettivamente il tempo di ON e di OFF, ripetuto
ciclicamente.
La programmazione periodica, a differenza di quella settimanale, consente di specificare due soli intervalli
orari nell'arco della giornata, in cui il programma evento deve essere portato ad ON.
34
Gestione programmi eventi
Nel caso infine della programmazione temporizzata, l'utente ha la possibilità di impostare il tempo al
termine del quale l'evento viene riportato allo stato di OFF:
Al termine della modifica del programma orario di un evento, utilizzare l'apposito pulsante SALVA per
rendere permanente la nuova configurazione; utilizzare viceversa il pulsante ANNULLA per chiudere la
finestra senza salvare.
35
Antintrusione
8. Antintrusione
8.1 Premessa
Vimar By-web permette di gestire tutte le funzionalità del proprio impianto di antintrusione By-me attraverso pagine web, sia in rete locale che attraverso internet, in modo del tutto analogo a quanto visto sinora
per la gestione domotica.
Attenzione: Il sistema antintrusione può essere gestito mediante Vimar By-web soltanto se nell'impianto
è presentente almeno un tastierino digitale o un touch screen.
8.2 Gestione delle parzializzazioni
Premendo il pulsante ANTINTRUSIONE dal menu principale viene mostrata la pagina di gestione delle
parzializzazioni in cui è suddiviso il proprio sistema di sicurezza.
Prima di poter effettuare qualunque operazione sul sistema deve essere inserito un codice PIN valido.
Premere il pulsante “Login” per visualizzare il tastierino in cui inserire il PIN per l’accesso al sistema
antintrusione.
NOTA: in base alla configurazione effettuata dall'installatore, l'utente con cui si ha effettuato l'accesso
potrebbe essere abilitato a vedere lo stato delle parzializzazioni prima di aver digitato un PIN. In questo
caso, non è comunque possibile effettuare operazioni prima di aver inserito un codice valido.
36
Antintrusione
Una volta digitato il codice, il tastierino viene sostituito dal menu ANTINTRUSIONE, e le parzializzazioni
presenti nella pagina vengono rese accessibili; il colore delle parzializzazioni indica il loro stato corrente,
secondo la convenzione seguente:
• GRIGIO: parzializzazione non inserita
• GIALLO: parzializzazione inserita
• ROSSO: parzializzazione in allarme
Nella parte inferiore della pagina sono disponibili inoltre i seguenti pulsanti:
INSERISCI TUTTO: premendo questo pulsante tutte le parzializzazioni non ancora inserite
vengono predisposte per essere inserite
DISINSERISCI TUTTO: premendo questo pulsante tutte le parzializzazioni attualmente inserite
(o in allarme) vengono predisposte per essere disinserite
E
SEGUI: premendo questo pulsante vengono effettivamente effettuate le operazioni sulle
parzializzazioni
La figura seguente mostra un esempio di pagina con due parzializzazioni configurate:
37
Antintrusione
In alternativa ai pulsanti “INSERISCI TUTTO” e “DISINSERISCI TUTTO” è possibile premere una singola
parzializzazione per predisporla all'inserimento (se attualmente disinserita) o al disinserimento (se attualmente inserita o in allarme). Una freccia del colore corrispondente allo stato desiderato viene mostrata
nella parte sinistra del pulsante, come evidenziato nella figura seguente (nella quale, a titolo di esempio, è
stata premuta la parzializzazione 1 per l'inserimento):
Premendo il pulsante “ESEGUI” viene attivata un'animazione che porta progressivamente la freccia colorata ad occupare tutto il pulsante (di tutte le parzializzazioni che hanno un'azione predisposta).
Durante questo tempo, vengono effettuate le operazioni sul sistema di antintrusione necessarie a realizzare la configurazione richiesta; al termine dell'animazione, se le parzializzazioni rimangono del colore desiderato il sistema si è portato nella configurazione attesa, in caso contrario esse tornano al colore originale.
Premendo il pulsante “LOGOUT” dal menu laterale viene forzata l'uscita dal sistema di sicurezza con il PIN
digitato; viene riproposta la situazione del primo accesso alla sezione “ANTINTRUSIONE”. Analogamente,
selezionando una qualunque altra sezione di By-web viene cancellato l'accesso con il PIN di sicurezza,
e dovrà essere nuovamente inserito il codice per effettuare ulteriori operazioni sul sistema di sicurezza.
38
Antintrusione
8.3 Eventi
Selezionando la voce “EVENTI” dal menu antintrusione è possibile consultare lo storico degli ultimi messaggi ricevuti dal sistema; i messaggi sono presentati dal più recente al meno recente, e suddivisi in più
pagine per agevolarne la consultazione. Utilizzare i pulsanti in basso per scorrere tra le pagine; premere
nuovamente sulla voce “EVENTI” del menu per tornare alla prima pagina (particolarmente utile nel caso
di nuovi messaggi ricevuti durante la consultazione, fatto evidenziato da un indicatore luminoso nel menu
antintrusione in corrispondenza della voce “EVENTI” stessa).
E' possibile esportare l'intero elenco degli eventi attraverso il pulsante apposito nella parte inferiore della
pagina; l'elenco viene salvato sul proprio PC, dopo alcuni secondi necessari per il caricamento dei dati, in
formato CSV separato da tabulazione, facilmente importabile in qualunque foglio elettronico (es: Microsoft
Excel).
8.4 Allarmi
Analogamente a quanto visto in precedenza per gli EVENTI, la voce “ALLARMI” permette di consultare
l'elenco dei soli allarmi del sistema di sicurezza. Anche in questo caso, è possibile esportare l'elenco in
formato CSV.
La presenza di un nuovo allarme viene evidenziato non solo con un indicatore visivo nella corrispondente
voce del menu, ma anche con un indicatore visivo nel menu principale in corrispondenza della voce
“ANTINTRUSIONE”. Nel caso di allarme acustico in corso, utilizzare il pulsante di tacitazione disponibile
nella parte bassa della pagina.
39
Diffusione sonora
9. Diffusione sonora
9.1 Premessa
By-web permette di gestire il sistema di diffusione sonora By-me consentendo di comandare i ricevitori
presenti negli ambienti e gestire le sorgenti sonore.
9.2 Gestione ricevitori
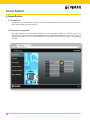
I ricevitori audio presenti nei diversi ambienti possono essere gestiti attraverso la pagina “AUDIO” del
menu “FUNZIONI”; in alternativa, in base alla configurazione effettuata dall'installatore, è possibile gestirli
direttamente dagli AMBIENTI in cui si trovano, come nell'esempio seguente:
40
Diffusione sonora
Premendo il pulsante relativo al ricevitore audio (“AUDIO CUCINA” nell'esempio) si apre un popup di
dettaglio attraverso cui è possibile:
• Accendere / spegnere il ricevitore
• Regolare il volume
• Cambiare la sorgente sonora (pulsante in basso a destra)
• Controllare la sorgente sonora correntemente in ascolto (pulsante in basso a sinistra).
41
Diffusione sonora
Premendo il pulsante di selezione della sorgente sonora (in basso a destra nel popup di dettaglio) si ha la
possibilità di stabilire quale segnale multimediale ascoltare in quell'ambiente:
In base alla sorgente in ascolto, il pulsante in basso a sinistra nel popup di dettaglio permette di impostare
i parametri della sorgente stessa, come meglio dettagliato nelle sezioni successive.
9.3 Ingresso RCA
Questo tipo di sorgente sonora non prevede impostazioni.
42
Diffusione sonora
9.4 Radio FM
La radio FM può essere gestita attraverso la finestra di dettaglio seguente:
Il display centrale mostra la frequenza selezionata, il livello del segnale e – laddove disponibile – il nome
RDS della stazione FM; è possibile effettuare le seguenti operazioni:
SCANSIONE FREQUENZA
I pulsanti permettono di selezionare la stazione successiva / precedente rispetto a quella
correntemente in ascolto. Dopo pochi secondi, non appena individuata la nuova stazione FM,
vengono aggiornati i dati nel display (frequenza, qualità del segnale ed RDS)
MEMORIZZA
Premere questo pulsante e, successivamente, una delle 8 memorie disponibili sui due lati
del pannello, per memorizzare la stazione corrente. Se è disponibile un nome RDS, esso
verrà assegnato in automatico alla memoria. Premere un qualunque pulsante per annullare la
memorizzazione
MODIFICA ETICHETTA
Premere questo pulsante e, successivamente, una delle 8 memorie per cambiare il nome della
memoria stessa. Al termine, premere nuovamente il pulsante di MODIFICA per salvare il nuovo
nome; qualunque altro pulsante annulla l'operazione di modifica
Una volta memorizzata una o più stazione nelle 8 memorie disponibili, è possibile richiamarla in qualunque
momento semplicemente premendo il corrispondente pulsante.
Per chiudere la finestra di gestione della radio, utilizzare i pulsanti in basso.
43
Diffusione sonora
9.5 Docking Station
Il sistema di diffusione sonora BY-ME consente di comandare e di gestire tracce sonore presenti in iPhone
e iPod di Apple. È possibile infatti collegare, tramite docking station, un dispositivo mobile (iPod - iPhone)
e gestirne i contenuti sonori accedendo alla pagina Audio del menu funzioni.
Premendo il pulsante relativo al ricevitore audio si apre un popup di dettaglio attraverso il quale è possibile:
• Accendere o spegnere il ricevitore;
• Regolare il volume;
• Cambiare la sorgente sonora (pulsante in basso a destra)
• Accedere alle impostazioni della Docking station per controllare la playlist, attivare e disattivare la
riproduzione del brano, scegliere la modalità di riproduzione (pulsante in basso a sinistra).
Nota: anche nel caso della gestione audio da docking station è possibile accedere ai popup di dettaglio
del ricevitore audio dal menu ambienti oltre che dal menu funzioni.
44
Diffusione sonora
Premendo il pulsante in basso a sinistra nel popup di dettaglio, si accede alla finestra di gestione delle
tracce musicali contenute nel dispositivo mobile.
Nel riquadro in alto vengono visualizzate le informazioni inerenti al brano musicale da riprodurre: nome
dell'artista, titolo dell'album e titolo del brano;
è possibile effettuare le seguenti operazioni:
PLAY/PAUSE
Questo pulsante permette di avviare o sospendere la riproduzione della traccia audio prescelta.
SCANSIONE TRACCE AUDIO
I pulsanti permettono la gestione dei brani contenuti nella playlist scelta dall'utilizzatore, è possibile quindi, premendo il pulsante a sinistra attivare la riproduzione del brano precedente a
quello attualmente in ascolto, contrariamente il tasto a destra attiverà la riproduzione del bra
no successivo. È possibile quindi scorrere i brani della playlist premendo ripetutamente i pulsanti.
REPEAT
Tramite questo pulsante è possibile programmare la ripetizione dell'ascolto delle tracce contenute nell'album prescelto dall'utilizzatore. Premendo una sola volta il pulsante viene attivata la
ripetizione della singola traccia, di conseguenza al termine del brano in ascolto, la traccia verrà
riprodotta nuovamente. Premendo una seconda volta il pulsante è possibile ripetere l'ascolto
di tutte le tracce all'interno dell'album.
45
Diffusione sonora
SHUFFLE
Tramite questo pulsante è possibile ascoltare le tracce audio senza un ordine prestabilito.
Premendo una sola volta il pulsante viene attivata la modalità "Shuffle" che consente di ascoltare le tracce contenute nell'album in modo casuale. Premendo una seconda volta il pulsante,
la modalità "Shuffle" interverrà su tutti gli album contenuti nell'archivio (la funzione di ascolto
casuale utilizza tutte le canzoni presenti nell'archivio).
Dal popup di dettaglio del ricevitore audio, premendo il pulsante in basso a sinistra , si accede alla finestra
di archivio musicale.
Nel riquadro in alto vengono visualizzate diverse categorie, per ogni categoria vengono visualizzate le
relative informazioni:
Playlist: nome della playlist (se presenti nel dispositivo mobile)
Artista: nome dell'artista
Album: nome dell'album
Brano: nome del brano.
Nella parte sottostante al riquadro delle categorie, sono disponibili i seguenti pulsanti:
SELEZIONA CATEGORIA
Questi pulsanti permettono di muoversi all'interno dell'elenco delle categorie (playlist, artista,
album, brano) e selezionarle una ad una al fine di visualizzarne i contenuti
46
Diffusione sonora
ELEMENTO PRECEDENTE/SUCCESSIVO
Una volta selezionata la categoria, premendo questi pulsanti è possibile selezionare gli elementi all'interno della categoria stessa. Se per esempio viene attivata la playlist, agendo sui
pulsanti in questione possiamo visualizzare la playlist precedente e successiva a quella attualmente visualizzata.
DESELEZIONA CATEGORIA
Questo pulsante permette di tornare alla schermata iniziale per la navigazione nell'archivio
musicale.
Nota: questa opzione non è sempre attiva ed il pulsante viene visualizzato solo quando è
consentita questa operazione.
PLAY/PAUSE
Questo pulsante permette di avviare la riproduzione dei brani scelti.
9.6 IR
Premendo il pulsante relativo al ricevitore audio si apre il classico popup di dettaglio attraverso il quale è
possibile utilizzare i controlli IR.
Agendo sul pulsante in basso a sinistra nel popup di dettaglio, si accede alla finestra di configurazione
dei pulsanti del controllo IR.
47
Diffusione sonora
I pulsanti che vengono visualizzati hanno la seguente configurazione di default:
PLAY/STOP
Questi pulsanti permettono l'attivazione e la disattivazione della traccia audio.
PAUSA
Il comando consente di sospendere la riproduzione dell'audio, se si desidera attivare
nuovamente la traccia è necessario premere nuovamente il pulsante Play.
TRACCIA PRECEDENTE/SUCCESSIVA
I pulsanti permettono la scansione delle tracce audio, agendo sul comando di sinistra verrà
attivata la riproduzione del brano precedente a quello attualmente in ascolto, contrariamente
il tasto a destra attiverà la riproduzione del brano successivo.
SORGENTE AUDIO
Il pulsante permette la scelta della sorgente audio da utilizzare per la riproduzione sonora.
Nota: Le funzionalità associate ai pulsanti della finestra del controllo IR del Web Server dipendono
dalla configurazione del sistema By-me, effettuata dall'installatore.
48
Consumo energetico
10. Consumo energetico
10.1 Premessa
By-web offre la possibilità di analizzare e gestire i consumi dell'edificio attraverso la funzione ENERGY
GUARD, accessibile dal menu principale selezionando la voce “CONSUMO ENERGETICO”.
ENERGY GUARD tiene sotto controllo i consumi energetici e li analizza in base all'utilizzo dell'energia nei
diversi orari del giorno e nel diversi periodi, confrontandoli con i periodi antecedenti e con i vincoli del
proprio contratto energetico, segnalando tempestivamente eventuali situazioni di consumo eccessivo.
Per poter operare correttamente, ENERGY GUARD deve conoscere alcune informazioni relative al contratto energetico; per ulteriori informazioni sulla configurazione dei parametri di funzionamento di ENERGY
GUARD, si rimanda all'apposito capitolo del MANUALE INSTALLATORE.
10.2 Visualizzazione grafica
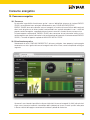
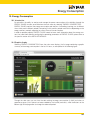
Selezionando la voce “CONSUMO ENERGETICO” dal menu principale, viene proposta la prima pagina
contenente una sintesi grafica dei consumi energetici nelle ultime 24 ore, come esemplificato nella figura
seguente:
Attraverso il menu laterale è possibile visualizzare i dati relativi ai consumi energetici (in kWh), alle emissioni
di gas serra (se questa funzione è stata abilitata dall'installatore) ed ai costi, mentre i pulsanti nella parte
in basso a destra della pagina consentono di cambiare il periodo di riferimento:
49
Consumo energetico
GIORNO
Vengono visualizzati i dati delle ultime 24 ore, evidenziando quelli del giorno
corrente (a partire dalla mezzanotte)
SETTIMANA
Vengono visualizzati i dati degli ultimi 7 giorni, evidenziando quelli a partire dal
lunedi della settimana corrente
MESE
Vengono visualizzati i dati delle ultime 5 settimane, evidenziando quelli a partire
dal primo giorno del mese in corso
ANNO
Vengono visualizzati i dati degli ultimi 12 mesi, evidenziando quelli a partire dal
primo Gennaio dell'anno corrente
In base al tipo di dato ed al periodo prescelto, ENERGY GUARD estrae i dati dallo storico e mostra tre
distinti grafici, che contengono diversi livelli di informazione.
NOTA: basandosi sulla raccolta di dati dell'impianto domotico, ENERGY GUARD potrebbe non offrire
una analisi completa dei consumi in assenza di informazioni, soprattutto nei primi periodi di utilizzo
di By-web.
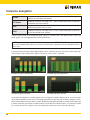
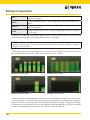
Il grafico a barre nella metà inferiore della pagina mostra i valori di consumo, emissione o costo relativi agli
ultimi periodi, in base all'intervallo – giorno, settimana, mese o anno – prescelto:
Esempio di grafico settimanale
Esempio di grafico mensile
Esempio di grafico giornaliero
Esempio di grafico annuale
La porzione di sfondo più scura del grafico mette in evidenza la media calcolata, per lo stesso intervallo,
nei periodi antecedenti; nel caso di visualizzazione giornaliera e contratto a fasce orarie, vengono visualizzate le medie nelle diverse fasce orarie. La parte di ogni barra del grafico eccedente la media viene evidenziata
in colore arancione, per mettere in evidenza come in quel dato intervallo di tempo si sia superata la media
(o, nel caso di contratti a soglia, il consumo medio per rimanere nei limiti previsti dal contratto).
50
Consumo energetico
Nel caso di contratti a fasce orarie, i consumi (o emissioni / costi) nelle diverse fasce orarie vengono evidenziati con un diverso grado di verde; in caso di eccedenza rispetto alla media, l'eccedenza è sempre
rappresentata con il colore arancione a prescindere dalla fascia oraria. Nel caso di contratto a soglia,
viceversa, viene evidenziato con un grado di verde più scuro il superamento della soglia rapportata al
periodo di riferimento.
In caso di superamento della soglia mensile di consumo, vengono evidenziati tutti gli intervalli successivi
a tale superamento con un indicatore rosso di avviso.
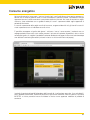
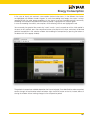
È possibile sovrapporre al grafico del giorno / settimana / mese / anno corrente il confronto con un
analogo periodo nel passato; a tale scopo, premere il pulsante di confronto disponibile in alto a sinistra
nell'area del grafico, e scegliere il periodo di confronto desiderato nell'apposita finestra di selezione dopo
aver abilitato il confronto (premendo il pulsante in basso a sinistra nella finestra di popup):
I periodi di confronto disponibili dipendono dall'intervallo di visualizzazione prescelto. Una volta identificato il periodo di riferimento, confermare attraverso il pulsante di conferma in basso a destra; il pulsante
INDIETRO a sinistra permette invece di chiudere la finestra senza apportare modifiche al periodo di
confronto.
51
Consumo energetico
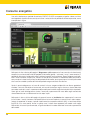
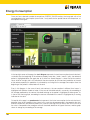
Una volta selezionato un periodo di confronto, ENERGY GUARD sovrappone al grafico a barre una linea
corrispondente al profilo di consumo (o emissione / costo) relativo al periodo di confronto prescelto, come
esemplificato in figura:
Nella parte in alto a destra della pagina il diagramma a pila rappresenta il consumo (o emissione/costo)
complessivo sostenuto dall'inizio del periodo di riferimento (giorno / settimana / mese / anno corrente); il
periodo di riferimento è evidenziato sotto il grafico a barre da una linea bianca. Sopra il diagramma è riportato il valore numerico complessivo, mentre sul lato destro è presente un'indicazione della previsione di
consumo (o emissione/costo) al termine del periodo di riferimento; questa previsione è stimata ipotizzando
che il consumo medio a partire dall'inizio del periodo venga mantenuto fino alla fine.
Anche in questo diagramma, nel caso di contratti a fasce, vengono evidenziati con diverse gradazioni
di colore i consumi nelle diverse fasce orarie; nel caso di contratto a soglia, viceversa, viene evidenziato
con colore verde più scuro il superamento della media prevista dalla soglia contrattuale riferita al periodo.
Come già nel caso del diagramma a barre, l'eventuale superamento nel mese della soglia contrattuale
viene evidenziato con un indicatore di avviso sopra la pila.
Nella parte in alto a sinistra della pagina è presente invece un tachimetro che rappresenta il consumo
(o l'emissione / costo) istantaneo, rilevato dall'ultima lettura nell'impianto; in questo caso il valore rappresentato è rapportato al tempo, e quindi rispettivamente una potenza elettrica (kW), un'emissione oraria
(kgCO2/h) o un costo orario. Anche in questo caso il valore viene rapportato alla media o alla soglia
contrattuale, in base al tipo di contratto, e il grafico evidenzia in colore arancione l'eventuale superamento
della media.
52
Consumo energetico
10.3 Dettagli
Selezionando l'apposita voce nel menu dell'ENERGY GUARD, è possibile consultare i dettagli relativi
all'analisi dei consumi. Anche in questo caso, i dati possono essere visualizzati in base alla tipologia –
consumo, emissione di CO2 o costo – ed in base al periodo – giorno, settimana, mese, anno – utilizzando
i pulsanti nella parte bassa della pagina ed il menu laterale stesso.
La pagina contiene nella parte iniziale una sezione di sintesi, contenente la stima di consumo (o emissione / costo) nel periodo selezionato; in base al tipo di contratto, vengono riportati i dati per ogni fascia
oraria, oppure suddivisi tra “fascia base” (ovvero al disotto della soglia contrattuale mensile) e “extra”
(ovvero sopra la soglia contrattuale), oltre al totale. Viene inoltre riportata la percentuale di ripartizione tra
le diverse fasce.
Immediatamente sotto la pagina riporta la media calcolata nel periodo di riferimento, su un periodo la cui
durata dipende dalla visualizzazione corrente: media oraria nel caso di visualizzazione giornaliera, media
giornaliera nel caso di visualizzazione settimanale etc... anche in questo caso con il dettaglio per fascia.
La pagina riporta poi il dettaglio, anche in questo caso con il dettaglio per fascia oltre al totale, delle letture
effettuate, secondo il seguente criterio:
VISUALIZZAZIONE
LETTURE
GIORNO
Ultime 24 ore
SETTIMANA
Ultimi 20 giorni
MESE
Ultime 20 settimane
ANNO
Ultimi 20 mesi
Laddove il dato supera la media (o la soglia, nel caso di contratti a tariffa fissa) viene evidenziato con un
pallino, in modo da richiamare immediatamente l'attenzione alle situazioni nelle quali il consumo è stato
superiore alle aspettative.
Laddove i dati superano lo spazio disponibile nella pagina, è possibile scorrerli utilizzando i pulsanti disponibili nella barra inferiore della pagina, che riporta anche il numero di pagine in cui sono suddivisi i dati.
È possibile tornare alla visualizzazione grafica in ogni momento utilizzando il pulsante “MODALITA'
GRAFICA” del menu laterale, sempre disponibile mentre si consulta ENERGY GUARD.
53
Messaggi di sistema
11. Messaggi di sistema
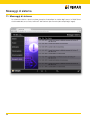
La schermata relativa a questa sezione permette di controllare lo storico degli accessi al Web Server
visualizzando data, ora, utente, indirizzo IP dell’utente e tipo di evento (ad esempio login, logout).
54
Videosorveglianza
12. Videosorveglianza
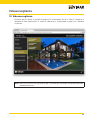
Attraverso questa sezione è possibile accedere alla visualizzazione dei flussi video IP configurati e
selezionare la fonte (telecamera IP o canale di videoserver) a seconda delle immagini che si desidera
visualizzare.
Nota: Nella stessa finestra non possono essere visualizzate più telecamere contemporaneamente
(scheda del browser).
55
Multimedia video touch screen
Nota per gli utilizzatori di Google Chrome.
Per visualizzare le immagini di una telecamera che fornisce un flusso video RTSP seguire la seguente
procedura :
1. Selezionare la voce di menu VIDEOSORVEGLIANZA.
2.Selezionare la telecamera RTSP desiderata. Nella parte destra della barra dell’indirizzo di Google
Chrome compare il simbolo
di avviso.
3. Cliccare sul simbolo e accettare il caricamento dello script non sicuro. Questo permette l’utilizzo, da
parte di Google Chrome, del plug-in per la visualizzazione dei flussi video RTSP.
4. Il browser ricarica la pagina iniziale del Web-Server.
5. Selezionare la voce di menu Videosorveglianza.
6. Selezionare la telecamera RTSP desiderata.
7. L’immagine della telecamera RTSP sarà visualizzata dopo l’avvio del plug-in da parte del browser.
Questa operazione richiede alcuni secondi.
La procedura descritta deve essere eseguita solo la prima volta che si accede ad una telecamera RTSP
dopo l’apertura del browser Google Chrome e fino a quando il browser rimarrà aperto.
Dopo aver visualizzato una telecamera RTSP, per i successivi accessi alla visione di telecamere RTSP sarà
sufficiente eseguire solo i passi 5, 6, 7 della procedura (la conferma, da parte dell’utente, di apertura dello
script resterà valida fino a quando il browser Google Chrome sarà chiuso).
13. Multimedia video touch screen 10in (cod. 21553)
Per utilizzare il Web Server da 21553 basta lanciare l’applicazione Domotica.
Il login verrà effettuato in automatico (si rimanda al manuale installatore per ulteriori istruzioni).
Da 21553 è comunque possibile loggarsi anche con un altro utente diverso da quello predefinito;
effettuando un logout apparirà la classica schermata con tutti gli utenti presenti sul Web Server e se entro
dieci secondi non viene effettuato il login con uno di questi utenti il 21553 si loggherà in automatico con
l’utente predefinito
Da 21553 non è permesso:
• Esportare l’elenco riguardante gli Allarmi ed Eventi SAI
• Esportare lo storico dei dati dell’Energy Guard
• Esportare l’elenco dei Messaggi di Sistema
• Modificare la posizione dei widget per gli ambienti aventi come Template “Mappa”
Dalla versione software 1.4.08 il Multimedia Video Touch Screen 10in, presenta una sezione dedicata
alla gestione delle telecamere.
Se un 21553 dotato di tale versione (o successiva) si connette ad un Web Server con versione
1.5 (o successiva) nel menu principale, non è visualizzata la voce “Videosorveglianza” perché la
gestione delle telecamere avviene dall’apposita sezione dell’applicativo del 21553.
La voce di menu Videosorveglianza viene comunque visualizzata se si accede al Web Server da un client
diverso da 21553.
56
57
Vimar End-User License Contract
Vimar end-user license contract
VIMAR SPA located in Marostica (VI), Viale Vicenza n. 14 (http://www.vimar.com), sole owner of the software
named “Software WebServer”, through this contract grants the license of use of the aforementioned program.
VIMAR SPA shall not be held liable for any damage caused by improper use of the aforementioned software, in
particular for direct or indirect damage to persons, property, and/or animals due to economic loss that may occur
as a result of the use of the software.
VIMAR SPA reserves the right to make any changes to improve the function of the aforementioned software without
advance notice. It is prohibited to modify, translate, adapt, or create applications based on the aforementioned
software, without previous written consent from VIMAR.
The user must verify the suitability of the program to his needs, and interpret the results to verify the consequences
of the choices of design made.
All risks concerning the results and performance of the program are assumed by the user.
VIMAR SPA holds the exclusive property right of the software.
Unauthorized duplication of the program is prohibited.
It is expressly forbidden to modify, translate, fit, change, disassembly in any way or to create by-products from the
software.
The user is to be held responsible not to eliminate any information of the software relevant to the Copyright.
The software are protected under the Copyright laws in force in Italy and foreseen by the International treaties,
therefore, any activity realized in contrast with what is stated above, will be prosecuted at the right place.
Microsoft, Windows, Vista, Xp, Seven, Media Center, Internet Explorer are registered trademarks of the Microsoft
Corporation in the United States and/or other countries.
Apple, Mac, Mac OS, iMac, MacBook, iPhone, iPod Touch, iPad, Safari are trademarks of Apple Inc., registered
in the U.S. and other countries.
Mozilla, Firefox are registered trademarks of Mozilla.
Google Chrome is a trademark of Google Inc.
Linux is a registered trademark of Linus Torvalds in the United States and/or other countries.
VIMAR SPA
Viale Vicenza, 14
36063 Marostica VI - Italy
http://www.vimar.com
58
Index
1. Introduction…………………………………………………………………………………………………………… 60
1.1 What is VIMAR By-Web………………………………………………………………………………………… 60
1.2 Access to local network………………………………………………………………………………………… 60
1.3 General Layout…………………………………………………………………………………………………… 63
2. Environments and functions……………………………………………………………………………………… 64
2.1 Introduction………………………………………………………………………………………………………… 64
2.2 Environments Menu ……………………………………………………………………………………………… 64
2.3 Functions Menu ………………………………………………………………………………………………… 64
2.4 Pages in grid view………………………………………………………………………………………………… 65
2.5 Pages in map view……………………………………………………………………………………………… 67
3. Management of lights and shutters……………………………………………………………………………… 69
3.1 Lights and implementations ON/OFF…………………………………………………………………………… 69
3.2 Lights dimmed…………………………………………………………………………………………………… 69
3.3 RGB dimmer Lights……………………………………………………………………………………………… 70
3.3.1 Light color setup…………………………………………………………………………………………… 71
3.3.2 Fading show mode ON/OFF……………………………………………………………………………… 72
3.4 Shutters and movement………………………………………………………………………………………… 73
4. Scenarios management…………………………………………………………………………………………… 74
4.1 Running scenarios……………………………………………………………………………………………… 74
4.2 Editing a scenario………………………………………………………………………………………………… 75
5. Climate management……………………………………………………………………………………………… 78
5.1 Thermostats control……………………………………………………………………………………………… 78
5.2 Weekly programming …………………………………………………………………………………………… 82
6. Load control………………………………………………………………………………………………………… 84
6.1 Load control page ……………………………………………………………………………………………… 84
7. Event programs management……………………………………………………………………………………… 87
7.1 Introduction………………………………………………………………………………………………………… 87
7.2 Setting an event…………………………………………………………………………………………………… 87
7.3 Time programming of an event………………………………………………………………………………… 88
8. Alarm System………………………………………………………………………………………………………… 92
8.1 Introduction………………………………………………………………………………………………………… 92
8.2 Managing the partitions………………………………………………………………………………………… 92
8.3 Events……………………………………………………………………………………………………………… 95
8.4 Alarms……………………………………………………………………………………………………………… 95
9. Sound System………………………………………………………………………………………………………… 96
9.1 Introduction………………………………………………………………………………………………………… 96
9.2 Receivers management ………………………………………………………………………………………… 96
9.3 RCA Input………………………………………………………………………………………………………… 98
9.4 FM Radio………………………………………………………………………………………………………… 99
9.5 Docking Station………………………………………………………………………………………………… 100
9.6 IR……………………………………………………………………………………………………………… 103
10. Energy Consumption……………………………………………………………………………………………
10.1 Introduction……………………………………………………………………………………………………
10.2 Graphic display ………………………………………………………………………………………………
10.3 Details…………………………………………………………………………………………………………
105
105
105
109
11. System alerts …………………………………………………………………………………………………… 110
12. Video surveillance ……………………………………………………………………………………………… 111
13. Multimedia video touch screen ……………………………………………………………………………… 112
59
Introduction
1. Introduction
1.1 What is VIMAR By-Web
VIMAR By-Web is a Web Server that allows you to manage your own By-me home automation through
a PC, notebook, tablet or touch screen, as well as mobile devices provided with a browser capable of
displaying web pages. For iPhone and iPod touch mobile devices, there is a special application available
for download from iTunes, which allows faster access to the By-web functionality.
The management of the building can be performed both locally and remotely, as long as it provides a
permanent connection to the Internet.
This manual explains how to use the functionality of By-web and is therefore bound to end users; the manual assumes that By-web has been properly configured by the installer, as reported in the "INSTALLATION
INSTRUCTIONS". The manual refers to a typical example of configuration; the graphic screen of the user's
own By-web may differ depending on the specific customizations made by the installer.
The Vimar By-Web Web Server is not compatible with browser Microsoft Internet Explorer 8 and
earlier.
1.2 Access to local network
It is possible to use VIMAR By-web with any device with a Web browser connected to the local network
of the building, including through wireless connection. The following pages of this manual refer to a
connection with PC/MAC using the Google Chrome browser.
To access By-web, simply open a browser window and type in the IP address assigned by the installer to
the Web Server within the local network, the default address of the device is :
http://192.168.0.110
NOTE: Ask your installer for the address to use to connect to By-web; you should add that address
to your browser's favorites so you do not have to type it every time.
60
Introduction
After a few seconds the following window is displayed:
Select the user to access By-web and type in the appropriate password; ask your installer access credentials to the Web Server and the related rights. The following table shows the list of By-web default users:
User
Password
Description
Administrator
admin
Home automation system administrator user. Has the rights to
create users and manage their rights.
Installer
poweruser
User dedicated to installing and configuring the Web Server. He
has the rights to perform any operation on the system, but cannot edit the rights of other users.
Guest
guest
Basic user for connections from the PC. Has the rights to view
the status of the system, browse the pages of the Web Server
and perform basic commands on the home automation system.
The screens shown later in this manual refer to a log in as "Administrator".
61
Introduction
At the bottom of the window for entering the login credentials is the "stay connected" checkbox.
Ticking the checkbox enables to store data, which allows faster subsequent access to the Web Server, if
the following conditions are met:
• The IP address of the client where the access is taking place has not changed.
• The credentials of the user who logs in have not changed.
• At the end of the previous connection to the Web Server, the web browser has been shut down without
quitting the web server session via the "Logout" button.
The first access to the Web Server after enabling this checkbox, provides additional time for storing the
requested data.
If the above conditions are met, the login window for entering the login credentials to the Web Server is
not displayed at the next access, and access to the web server functionality is faster.
If you exit the Web Server using the "Logout" button, the window for entering the login credentials will
appear at the next login, and the user data will be stored again.
62
Introduction
1.3 General Layout
The following figure shows a sample screen of By-web once logged in:
You may notice the following page elements are always available in all sections of the Web Server:
Date and Time
Available at the top left, showing the date and time of the Web Server. If
not correct, adjust them through the appropriate page in the administration
(see "INSTALLER MANUAL").
Environment or
current function E.g.:
"BATH"
Available at the top right, shows the section where you are at any time, be
it an environment or a function.
Main Menu
Always visible on the left side of the page; allows you to access the main
sections of By-web; in some cases, selecting an item involves opening a
sub-menu for a few seconds where you can choose the environment or
the specific function you want to access.
Menu Button
Always available at the bottom right, displays a context menu that shows
the possible actions available according to the page where you are.
Through this button you can access the GENERAL SETTINGS section or
LOGOUT (this is required if you want access as another user, or prevent
the PC or device you are using from accessing By-web).
Help Button
It displays a guide depending on the section where you are and the task
you are performing.
NOTE: feature not available in the current version of By-web.
VIMAR Logo
Allows to return to the main page at any time.
63
Environments and functions
2. Environments and functions
2.1 Introduction
VIMAR By-web allows you to "browse" through the functions of your home automation system using two
separate criteria: browsing by ENVIRONMENTS allows you to manage the functions according to their
location in the building, while browsing by FUNCTIONS allows direct access to all the functions of the
same type, irrespective of their location in the building.
The list of ENVIRONMENTS is customized by the installer according to the structure of the building and
home automation system; it may also contain pages consisting of sets of functions not necessarily connected to an environment of the building, such as, for example, the "favorites". Conversely, the list of
FUNCTION cannot be changed.
2.2 Environments Menu
Pressing the "SETTINGS" button in the main menu shows a sub-menu containing the list of available
environments; select the desired item to access the corresponding page. The sub-menu will close automatically after a few seconds, or after selecting the desired item, in order to free the page. In the case of
configurations with a high number of environments, two arrow buttons are available at the top and bottom
of the menu, with which scroll through the list.
The pages relating to the environments can be configured in "GRID" or "MAP" view; for further details,
please refer to the following sections of this chapter.
2.3 Functions Menu
Pressing the "FUNCTIONS" button in main menu shows a sub-menu listing the types of functions available
in your home automation system; each of these items allows you to view all the functions of the same type:
Lighting
Turning lights on and offON/OFF, adjusting of lights dimmed, controllable
outlets, etc...
Blinds
Operation of motorized blinds and curtains, opening/closing gates etc ...
Climate
Management of different climatic zones heating and/or air conditioning.
Scenarios
Implementation and customization of scenarios with which to perform multiple
commands on the home automation system.
Load control
Energy monitoring and management of load control.
Audio
Management of sound system (RCA audio input and FM radio tuner)
Events
Management of event programs and related scheduling.
The pages relating to functions involve only the "GRID" view; for further details, please refer to the
following sections.
64
Environments and functions
2.4 Pages in grid view
The functions or environments pages in grid mode provide visualization of home automation functions in
tabular form, as exemplified in the following figure:
By clicking on a function icon, you can command it directly (in the case of simple functions, such as lights
ON/OFF), or open a "popup" to manage it; for more details, see the next chapter of this manual, which
examines all the different types of functions and how to manage them.
65
Environments and functions
66
Environments and functions
The pages of the environments can be configured to be displayed as a MAP, or with individual functions
placed over a background image, be it a photograph, a plan or a 3D rendering. The figure below shows
an example of an environment displayed as a MAP:
Again, pressing a function icon, you can command it directly, or open the command "popup", as follows:
67
Environments and functions
For more details on specific functions, see the next chapter of this manual.
68
Management of Lights and Shutters
3. Management of lights and shutters
3.1 Lights and implementations ON/OFF
The lights and ON/OFF activations can be controlled directly from the ENVIRONMENTS and FUNCTIONS
pages, simply by pressing the corresponding icon; at any time the icon shows the status of the corresponding function.
3.2 Lights dimmed
The lights with dimmer control open a "popup" when clicking on the corresponding icon, as shown in
the figure below:
By dragging the scroll bar you can set the adjustment from 0% to 100%, while the button at the bottom
of the popup allows you to turn the lights on or off.
The popup closes automatically after a few seconds, or you can close it by pressing the function icon.
While the popup is opened, it is possible to use the additional features of the page, but you can use the
main menu to access other sections of By-web.
69
Management of Lights and Shutters
3.3 RGB dimmed lights
The lights with RGB dimmer control open a "popup" when clicking on the corresponding icon, as shown
in the figure below:
Drag the slider bar, in order to set the brightness adjustment from 0% to 100%.
Press the middle button (ON/OFF button), in order to turn on or off the light.
Press the button on the bottom right, in order to set the color of the light, as described in chapter "3.3.1
Light color setup".
Press the button on the bottom left, in order to enable or disable the “fading show” mode, as described
in chapter 3.3.2.
The popup closes automatically after a few seconds, or you can close it by pressing the function icon.
While the popup is opened, it is possible to use the additional features of the page, but you can use the
main menu to access other sections of By-web.
70
Management of Lights and Shutters
3.3.1 Light color setup
Press the button in the RGB dimmer widget for setting the color of the light to access the window for
setting the color of the light, as shown in the following figure:
The color of the RGB dimmer light can be set by changing the hue, saturation, and brightness of the dimmer light, using the tool in the previous figure, consisting of a circle with a square inside.
Select a point on the horizontal bar, in order to change the color tone of the dimmer.
Select a point inside the square, in order to change the saturation and brightness of the light.
After obtaining the desired color, press the button to confirm the setting and proceed with the requested
change. After confirming the command, press the "Cancel" button to exit the RGB dimmer color setup
window and return to the previous page.
If the color change is a confirmed, it overrides the previous RGB dimmer setup.
Select the black color to switch off the dimmer (OFF).
71
Management of Lights and Shutters
3.3.2 Fading show mode ON/OFF
This button, located on bottom right of the RGB dimmer widget, allows to activate or deactivate the fading
show mode provided by the RGB dimmer, with the settings included in the device.
The state of activation of this mode is indicated by the state of the button above.
To exit the fading show mode, press the fading show on/off button, or do one of the following:
• Turn off the RGB dimmer via the middle button (ON/OFF button).
• Change the color of the dimmer light from the specific window (Chapter 3.3.1 "Light color setup").
72
Management of Lights and Shutters
3.4 Shutters and movement
Shutters, curtains and motorized gates can be operated by pressing the corresponding icon and using
the buttons in the corresponding popup, as exemplified in the following figure:
In the case of vertical movement of shutters and curtains, the popup provides the following buttons:
LOWER: activates the movement down. The icon is illuminated briefly to indicate that the command was sent, after which it returns to its original state.
STOP: if the frame is in motion, makes it possible to arrest the stroke. The icon is illuminated
briefly to indicate that the command was sent, after which it returns to its original state.
LIFT: activates the movement up. The icon is illuminated briefly to indicate that the command
was sent, after which it returns to its original state.
SLATS RIGHT TILT: activates the movement of the slats towards right
(The management of this operation is only possible if the actuators are 01852.2, 14527.1,
16967.1, 20527.1).
SLATS LEFT TILT: activates the movement of the slats towards left (the management of this operation is only possible if the actuators are 01852.2, 14527.1, 16967.1, 20527.1).
73
Scenarios management
In the case of gates to opening/closing horizontally, the popup displays the following buttons:
OPEN: activates the movement to open the gate. The icon is illuminated briefly to indicate that
the command was sent, after which it returns to its original state.
STOP: if the frame is in motion, makes it possible to arrest the stroke. The icon is illuminated
briefly to indicate that the command was sent, after which it returns to its original state.
CLOSE: activates the movement to close the gate. The icon is illuminated briefly to indicate that
the command was sent, after which it returns to its original state.
4. Scenarios management
4.1 Running scenarios
The scenarios set up in By-me control unit can be accessed from By-web through the corresponding buttons on the SCENARIOS FUNCTIONS page, or from the environments where the installer has put them.
Pressing the button of a scenario, the corresponding icon will illuminate for a few seconds to indicate
proper performance, after which it returns to its original state.
74
Scenarios management
4.2 Editing to Scenario
From the page SCENARIOS FUNCTIONS you can change the status of each function associated with
a scenario. Pressing the MENU button at the bottom right, select "CHANGE SCENARIO"; the screen is
shown below:
As indicated in the side menu (which temporarily "covers" the image of the SCENARIOS function), press
the icon corresponding to the scenario you want to change; or, alternatively, use the "CANCEL" button
below to return to normal viewing.
75
Scenarios management
Selecting a scenario to be edited, this one is run (in order to bring all the functions to the status provided
for the scenario itself), then the following screen is displayed, where are all the functions associated with it:
76
Scenarios management
Change the status of each function using the buttons in By-web or directly activating them (during this
operation, the LEDs of the buttons associated to the scenario will flash, to help with identification) and
then press the "SAVE" button to confirm the new configuration. Alternatively, press "CANCEL" to not
save changes
77
Climate management
5. Climate management
5.1 Thermostats control
In the pages related to ENVIRONMENT and CLIMATE function you can see the temperature measured
in real time by the thermostats in the system; clicking on the corresponding button opens the control of
the corresponding thermostat:
The title bar always shows the name of the thermostat, as well as the measured temperature; the section
of the window immediately below shows the working mode of the thermostat (left) and the season (heating/air conditioning - on the right).
78
Climate management
Depending on the current operating mode, the control window of the thermostat provides the following
buttons:
MODE: allows you to change the working mode of the thermostat. This button displays a list
of possible modes to set the thermostat; the list depends on the current mode. Selecting an
item from this list updates the control window of the thermostat to allow adjustment of the
parameters specified in the new mode.
LOCAL SETTINGS: allows you to change the season of the thermostat (heating or cooling) and
the unit of measurement.
NOTE: the unit of measurement cannot be changed in the current version of By-web.
INCREASE SETPOINT: when required, allows to increase the setpoint temperature for the
current mode of a tenth of a degree.
NOTE: If the thermostat is in AUTO mode, pressing this button changes the mode to "TIMED
MANUAL".
DECREASE SETPOINT: when required, allows to decrease the setpoint temperature for the
current mode of a tenth of a degree.
NOTE: If the thermostat is in AUTO mode, pressing this button changes the mode to "TIMED
MANUAL".
INCREASE TIME: when required (timed mode), it increases the timing of an hour.
DECREASE TIME: when required (timed mode), it decreases the timing of an hour.
MANAGE PROGRAM: when the thermostat is in AUTO mode, allows you to access the weekly
program management window of the climate zone which the thermostat is part of.
For more details, see the next section of this chapter.
In the case of thermostats with fan-coil management, are also available the following buttons:
INCREASE FANS SPEED: increases the speed of the fans. Possible settings: SPEED 1,
SPEED 2, SPEED 3, AUTO.
DECREASE FANS SPEED: decreases the speed of the fans.
79
Climate management
The figure below shows an example of a thermostat management window of with fan¬coil management,
in "TIMED MANUAL" mode (which requires all user adjustments: setpoint, timing and speed of the fans):
From the temperature and time set point settings (for the operating modes that require it, and, in any
case, other than in the "AUTOMATIC" mode), you can speed up data entry by directly editing the numeric
field: clicking the text field corresponding to the data to be edited displays a pop-up window where the
desired data can be entered.
80
Climate management
As long as the control window of the thermostat is open, no commands are actually sent to the thermostat; at any time you can then close the window by clicking "CANCEL", without saving the changes
made: in this case you are asked to confirm, which allows you to permanently close the window or save
the changes before closing.
Conversely, pressing the "SAVE" button, always available in the control window of the thermostat (except
when the sub-windows for the area setting or mode selection are open) you can make the changes;
By-web sends the appropriate commands to the thermostat and closes the control window.
81
Climate management
5.2 Weekly programming
When the thermostat is in "AUTO" mode, you can set the weekly program on the corresponding climate
zone with the appropriate button; the control window of the weekly schedule opens, as follows:
When the window opens, a reading schedule for the current day is made, during which you cannot do
anything; after a few seconds (depending on how many intervals the current schedule requires) the daily
profile is displayed.
The window includes the following buttons:
EXT DAY: to access the day following the one currently displayed. The transition to the
N
next day may take a few seconds of waiting, during which the programming is loaded by the
By-me control unit.
DUPLICATE DAILY SCHEDULE: allows you to copy the schedule for the day currently displayed to another day, selectable from a dropdown list .
REVIOUS TIME INTERVAL: moves the cursor back in time, within 24 hours, of 20 minutes
P
each time.
NEXT TIME INTERVAL: moves the cursor forward in time, within 24 hours, of 20 minutes
each time.
82
Climate management
UPLICATE CURRENT INTERVAL TEMPERATURE: allows you to replicate the temperature
D
of the current time interval on 20 minutes later.
INCREASE TEMPERATURE: increases the temperature level (T1 T2 T3) in the time
interval currently selected.
REDUCE TEMPERATURE: reduces the temperature level (T3 T2 T1) in the time interval
currently selected.
DIT TEMPERATURE LEVELS: allows you to open the window for setting the temperature
E
levels T1, T2 and T3 for the current mode (heating or cooling) - See the following figure.
Again, the changes to the weekly schedule are stored in the By-me control unit when saving only, made
available by the appropriate button always available (except during the opening of the windows for
choosing the day or setting the temperature levels).
Closing the window with the "CANCEL" button, prompts to confirm if changes were made to the program
in relation to the central configuration; press the "CANCEL" button again to exit without saving, or press
"SAVE" to save the configuration in the By-me control unit.
83
Load control
6. Load control
6.1 Load control page
The LOAD CONTROL FUNCTIONS page allows you to monitor the consumption of your electrical
system and manage the loads controlled through the provided module 01855. The page looks like this:
In the upper portion of the page is an indicator of the electrical system consumption in the form of numeric
value and bar graph, which changes color according to how much the consumption approaches the
maximum limit allowed by your electricity contract.
Under normal conditions, the instantaneous consumption data is read every minute from By-web
and updated on the screen; if you want to accelerate this reading to monitor sudden changes in
the consumption, press the button in the lower right corner of the box containing the value of the
consumption. During the accelerated reading on the bus the button is highlighted; press the button again
to reset to initial values.
NOTE: the close reading of the consumption data could cause delays or malfunctioning of the home
automation system, as By-web sends too much information to the bus.
84
Load control
At the bottom of the page are the loads managed by the provided module; the color of the icon indicates
if the load is on or off. Clicking on this icon shows a popup with the details, as exemplified in the
following figure:
85
Load control
This pup-up allows you to see the load management mode and force it to ON with the specific button:
the status is updated accordingly as shown below.
Pressing the button again, the load status will return to the condition prior to the forcing.
86
Event programs management
7. Event programs management
7.1 Introduction
VIMAR By-web lets you manage the event programs configured by the installer in the By-me home
automation system, and available in the By-me control unit in the specific section of the menu.
7.2 Setting an event
The EVENTS page in the FUNCTIONS section of By-web contains a list of all events available in the By-me
control unit; for each of them, the execution status is shown directly in the page, if active (yellow icon) or
paused (gray icon):
87
Event programs management
Clicking on the icon of an event program opens its configuration window, as shown in the figure below:
Pressing the "PAUSE" button, the program event is pending (the icon switches to gray); the operation is
immediately implemented by the system.
7.3 Time programming of an event
Depending on the configuration made by the installer, an event program may be associated with a time
schedule; the schedule can be of the following types:
• WEEKLY:allows you to set the time intervals in which the event program is set to ON and
OFF for each day of the week
• PERIODIC:allows you to set two time intervals throughout the day, in which the event program
must be set to ON and OFF
• CYCLIC:lets you specify a life cycle in the ON and OFF statuses, repeated by the control
unit
88
Event programs management
• TIMED:sets a time duration in the ON status after which the event is switched to OFF
For hourly schedules of the RECURRENT, CYCLIC, and TIMED type, you can speed up data entry by
directly editing the numeric field: clicking the text field corresponding to the data to be edited displays a
pop-up window where the desired data can be entered.
Depending on the type of time programming (which cannot be changed from By-web), a different
window for managing the programming itself is shown: for example, the following figure shows the
weekly programming, very similar to that of the thermostat, with the only difference that the intervals are
10 minutes (instead of 20 minutes), and that only the ON and OFF statuses can be set in place of the
temperatures T1, T2 and T3.
89
Event programs management
The figure below shows an example of cyclic programming:
In this case, acting on the buttons sets the ON and OFF time respectively, repeated cyclically.
The periodic programming, unlike the weekly, specifies only two time intervals throughout the day, in which
the event program must be brought to ON.
90
Event programs management
Finally, in the case of the timed programming, the user has the possibility to set the time after which the
event is restored to the OFF status:
After editing the program time of an event, please use the SAVE button to make the new configuration
permanent; otherwise, use the CANCEL button to close the window without saving.
91
Alarm System
8. Alarm system
8.1 Introduction
Vimar By-web lets you manage all the functionalities of its By-me alarm system through Web pages, either
locally or via the internet, in a similar way to what we saw so far for the home automation management.
Warning: The alarm system can be managed via Vimar By-web only if the system is provided with at least
one digital keypad or a touch screen.
8.2 Managing the partializations
Pressing the Alarm system button from the main menu shows the management page of the partializations
into which the security system is divided.
Before you can perform any action on the system, you must enter a valid PIN code. Press the "Login"
button to display the keypad to enter the PIN to access the intrusion prevention alarm system.
NOTE: Depending on the configuration performed by the installer, the user you logged on may be
enabled to see the status of the partializations before you type a PIN. In this case, you still cannot
perform operations until you have entered a valid code.
92
Alarm System
After entering the code, the keypad is replaced by the ALARM SYSTEM menu, and the partializations on
the page are made available; the color of the partializations indicates their current status, according to
the following convention:
• GREY: partialization not included
• YELLOW: partialization included
• RED: partialization on alert
At the bottom of the page are also available the following buttons:
DD ALL: pressing this button all the partializations not yet submitted are prepared for being
A
added
REMOVE ALL: pressing this button all partializations currently inserted (or on alert) are prepared for being removed
R
UN: pressing this button will actually perform operations on partializations
The figure below shows an example of a page with two configured partializations:
93
Alarm System
As an alternative to the buttons "ADD ALL" and "REMOVE ALL" you can press a single partialization to
prepare it for being added (if currently off) or removed (if on or on alert). An arrow of the color corresponding to the desired status is shown at the left of the button, as shown in the following figure (in which, by
way of example, partialization 1 was pressed for being added):
Pressing "RUN" activates an animation that progressively leads the colored arrow to occupy all the button
(of all the partializations that have an action prepared). During this time, operations on the alarm system
are carried out to achieve the required configuration; at the end of the animation, if the partializations are
of the desired color, the system is configured as expected, otherwise they return to the original color.
Pressing the "LOGOUT" button from the side menu exits the security system with the PIN entered; the
situation is returned to that of the first access to the "ALARM SYSTEM" section. Similarly, selecting any
other section of By-web, access with the security PIN is cleared, and you must re-insert the code to
perform additional operations on the security system.
94
Alarm System
8.3 Events
By selecting "EVENTS" from the alarm system menu you can see the history of the last messages received
from the system; the messages are presented from most recent to oldest, and split into several pages
for easier reference. Use the buttons below to scroll between pages; press on "EVENTS" again to return
to the home page (especially useful in case of new messages received during the consultation, fact highlighted by a light in the alarm system menu under "EVENTS").
It is possible to export the entire list of events through the appropriate button at the bottom of the page;
the list is saved on your PC, after a few seconds required to load the data in tab-separated CSV format,
easily imported in any spreadsheet (e.g. Microsoft Excel).
8.4 Alarms
Similarly to what was seen previously for the EVENTS, "ALARM" can only refer to the list of alarms security
system. Again, you can export the list in CSV format.
The presence of a new alarm is highlighted not only by a visual indicator in the corresponding menu item,
but also by a visual indicator in the main menu of "ALARM SYSTEM". In the case of an acoustic alarm in
progress, use the mute button available in the lower part of the page.
95
Sound System
9. Sound System
9.1 Introduction
By-web lets you manage the By-me sound system allowing to control the receivers present in the environments and manage the sound sources.
9.2 Receivers management
The audio receivers in the different environments can be managed through the "AUDIO" page in the
"FUNCTIONS" menu, or, alternatively, depending on the configuration performed by the installer, you can
manage them directly from the ENVIRONMENTS in which they are located, as shown in the following
example:
96
Sound System
Pressing the button corresponding to the audio receiver ("KITCHEN SOUND" in the example) opens a
detail popup through which you can:
• Turn on / off the receiver
• Adjust the volume
• Change the sound source (button at bottom right)
• Check the sound source currently listening (button at bottom left).
97
Sound System
Pressing the select button of the sound source (bottom right of the detail popup) you can determine which
multimedia signal to hear in that environment:
Based on the listening source, the button on bottom left of the detail popup allows you to set the
parameters of the source itself, as detailed in subsequent sections.
9.3 RCA Input
This type of sound source does not require any settings.
98
Sound System
9.4 FM Radio
The FM radio can be managed through the detail window below:
The central display shows the selected frequency, the signal level and - where available - the RDS name
of the FM station; you can then do the following:
FREQUENCY SCAN
The buttons allow you to select the next / previous station to the current one listening. After
a few seconds, once identified the new FM station, data is updated in the display (frequency,
signal quality and RDS)
RECORD
Press this button and, subsequently, one of 8 memory units available on the two sides of the
panel, to store the current station. If there is an RDS name, it will be automatically assigned to
the memory. Press any button to cancel the storage
EDIT LABEL
Press this button and then one of the 8 memory units to change the name of the unit itself.
When finished, press the EDIT button again to save the new name; any other button cancels
the edit operation
After storing a station in one of the 8 or more memory units available, you can retrieve it at any time, simply
pressing the corresponding button.
To close the radio management window, use the buttons below.
99
Sound System
9.5 Docking Station
The BY-ME sound system allows you to control and manage sound tracks on iPhones and iPods by
Apple. You can connect, via docking station, a mobile device (iPod - iPhone) and manage its audio
content by going to the Audio page in the functions menu.
Pressing the button corresponding to the audio receiver opens a detail popup through which you can:
• Turn on or off the receiver;
• Adjust the volume;
• Change the sound source (button at bottom right)
• Access the Docking station settings to control the playlist, turn on and off the track play mode, select
the play mode (button at bottom left)
Note: Even when managing the audio from the docking station you can access the detail pop-up of
the audio receiver from the environments menu as well as from the functions menu.
100
Sound System
Pressing the button at the bottom left of the detail pop-up, you can access the management window of the
tracks contained in the mobile device.
The top panel displays information about the song to be played: artist name, album title and song title; it is possible to perform the following operations:
PLAY/PAUSE
This button allows you to start or pause the chosen audio track.
SCAN AUDIO TRACKS
The buttons allow the management of the songs in the playlist chosen by the user, you can
then press the left button to activate playback of the track previous to the one currently being
listened to; on the other hand, the right button will activate the next song playback.
You can then scroll through the songs in the playlist by repeatedly pressing the buttons.
REPEAT
This button can be used for programming the repeated playback of the tracks in the album
selected by the user. Pressing the button once activates the repetition of the single track, so
at the end of the current track, the track will be
played again. A second press of the button allows to listen to all tracks in the album again.
101
Sound System
SHUFFLE
Using this button you can listen to audio tracks in casual order.
Pressing the button once you activate the "Shuffle" mode that lets you play the tracks in the
album randomly. A second press of the button activates the "Shuffle" mode to all the albums
in the archive (the Shuffle mode applies to all songs in the archive).
From the detail pop-up of the audio receiver, pressing the button on bottom left
, you can access
the music archive window.
The top pane displays different categories, each category displays the following information:
Playlist: playlist name (if present in the mobile device)
Artist: artist name
Album: album name
Track: track name.
At the bottom of categories pane are available the following buttons:
CHECK CATEGORY
These buttons let you move through the list of categories (playlist, artist, album, song) and
select them one by one in order to view their content.
102
Sound System
PREVIOUS/NEXT ITEM
Once the category is selected, pressing these buttons you can select the items within the
same category. For example, if the playlist is activated, pressing these buttons can display the
playlist before and after the one currently displayed.
UNCHECK CATEGORY
This button lets you return to the home screen for browsing music in the archive.
Note: this option is not always enabled and the button appears only when this operation
is allowed.
PLAY/PAUSE
This button allows you to start or pause the chosen audio track.
9.6 IR
Pressing the button corresponding to the audio receiver opens the classic detail popup through which
you can use the IR controls.
Pressing the button at the bottom left of the detail pop-up, you can access the management window of
the buttons of the IR control.
103
Sound System
The buttons displayed have the following default configuration:
PLAY/STOP
These buttons allow the activation and deactivation of the audio track.
PAUSE
The command allows to pause the audio, if you want to reactivate the track you must press
the Play button again.
PREVIOUS/NEXT TRACK
The buttons allow to scan the audio tracks; the command on the left plays back the track
previous to the one currently being listened to; on the other hand, the right button will activate
the next song playback.
AUDIO SOURCE
This button lets you choose the audio source to be used for the playback.
Note: The functions associated with the buttons in the IR control window of the webserver depend
on the configuration of the By-Me system, performed by the installer.
104
Energy Consumption
10. Energy Consumption
10.1 Introduction
By-web offers the ability to analyze and manage the power consumption of the building through the
ENERGY GUARD function, accessible from the main menu by selecting "ENERGY CONSUMPTION".
ENERGY GUARD monitors the energy consumption and analyzes it according to energy use in different
times of day and in different periods, comparing it with previous periods and with the depending on the
energy contract, promptly reporting any cases of excessive consumption.
In order to operate properly, ENERGY GUARD needs to know some information about the energy contract; for more information on configuring the operating parameters of ENERGY GUARD, please refer to
the specific section of the INSTALLER MANUAL.
10.2 Graphic display
Selecting "ENERGY CONSUMPTION" from the main menu displays the first page containing a graphic
summary of the energy consumption in the last 24 hours, as exemplified in the following figure:
Through the side menu you can view the data relating to energy consumption (in kWh), emissions of
greenhouse gases (if this feature has been enabled by the installer) and costs, while the buttons at the
bottom right of the page allow to change the reference period:
105
Energy Consumption
DAY
Displays data from the last 24 weeks, highlighting the ones of the current day
(starting at midnight)
WEEK
Displays data from the last 7 days, highlighting the ones from Monday of this
week
MONTH
Displays data from the last 5 weeks, highlighting the ones from the first day
of the current month
YEAR
Displays the data from the last 12 months, highlighting the ones from January
1 of this year
According to the data type and period chosen, ENERGY GUARD extracts data from the history and
shows three distinct graphs, which contain different levels of information.
NOTE: based on the data collected in the home automation system, ENERGY GUARD could not
provide a complete analysis of the consumption in the absence of information, especially in the early
periods of use of By-web.
The bar graph in the lower half of the page shows the values of consumption, emissions and cost for the
past periods, based on the interval - days, weeks, months or years - chosen:
Example of weekly chart
Example of monthly chart
Example of daily chart
Example of yearly chart
The darker portion of the background of the graph shows the average calculated for the same interval,
in previous periods; in the case of daily display and hourly rate contract, the averages are displayed in
different time frames. The part of each bar of the graph exceeding the average is highlighted in orange,
to emphasize how at that given time interval the average has been exceeded (or, in the case of threshold
contracts, the average consumption to stay within the limits set by the contract).
106
Energy Consumption
In the case of hourly rate contracts, consumption (and emissions/costs) in the different time frames
are highlighted with different shades of green; in case of exceeding the average, the surplus is always
represented with the color orange regardless of time frame. In case of threshold contract, conversely,
exceeding the threshold compared to the reference period is highlighted with a darker green.
In case of exceeding the monthly consumption, all the following intervals are highlighted in red.
You can overlay the graph of the current day / week / month / year in comparison with a similar period in
the past; for this purpose, press the comparison button at the top left in the chart, and select the desired
period of comparison in the selection window after enabling the comparison (by pressing the button at
the bottom left of the popup window):
The periods of comparison available depend on the interval selected. Once identified the reference period,
confirm through the confirmation button on bottom right; the BACK button on the left, instead, allows of
closing the window without making changes to the comparative period.
107
Energy Consumption
Once you have selected a period of comparison, ENERGY GUARD overlays the bar graph with a line
corresponding to the consumption (or emission / cost) profile for the period chosen for comparison, as
exemplified in the figure:
At the top right corner of the page, the stack diagram represents the total consumption (or emission/cost)
sustained since the beginning of the reference period (current day / week / month / year); the reference
period is highlighted below the graph bar by a white line. Above diagram is shown the total numerical
value, while on the right side is an indication of the consumption (or emission/cost) prediction at the end
of the reference period; this prediction is estimated by assuming that the average consumption since the
beginning of the period is maintained until the end.
Even in this diagram, in the case of hourly rate contracts, the consumption in different time frames is
highlighted with different shades of color; in the case of threshold contract, conversely, the exceeding of
the average predicted by the contract threshold referring to the period is highlighted in darker green. As
in the case of the bar graph, exceeding the contract threshold of the month is highlighted by a warning
indicator on the stack.
On top left of the page is a speedometer that represents the instant consumption (or the emission/cost),
detected since the last reading in the system; in this case the value represented is compared to the time,
and then respectively the electrical power (kW), time emission (kgCO2/h) or hourly rate. Also in this case
the value is compared to the average or contract threshold, based on the type of contract, and the graph
shows in orange any exceeding of the average.
108
Energy Consumption
10.3 Details
Selecting the appropriate item in the ENERGY GUARD menu, you can see the details of the analysis
of consumption. Again, the data can be displayed according to type - consumption, CO2 emissions
or cost - and time - days, weeks, months, years - using the buttons at the bottom of the page and the
same side menu.
The page contains a summary section at the beginning, with an estimate of consumption (or emission /
cost) in the selected period; according to the type of contract, the data is displayed for each time frame,
or divided between "level frame" (i.e. below the monthly contract threshold) and "extra" (i.e. above the
contract threshold), in addition to the total. It also shows the breakdown percentage of the various bands.
Just below, the page shows the average calculated over the reporting period, a period whose duration
depends on the current view: hourly average in the case of daily display, daily average in the case of week
view, etc... also in this case with details for the frame.
The page then returns the detail, also in this case with the detail by frame in addition to the total, of the
readings carried out, according to the following criterion:
DISPLAY
READINGS
DAY
Last 24 Hours
WEEK
Last 20 Days
MONTH
Last 20 Weeks
YEAR
Last 20 Months
Where the data exceeds the average (or threshold, in the case of fixed price contracts) it is highlighted with
a dot in order to draw immediate attention to situations where the consumption was higher than expected.
Where the data exceeds the available space on the page, you can scroll it using the buttons in the bottom
bar of the page, which also shows the number of pages into which the data is divided.
You can return to the graphical display at any time by using the "'GRAPHIC MODE" button in the side
menu, always available while examining ENERGY GUARD.
109
System alerts
11. System alerts
The screen on this section allows you to check the history of all access to the Web Server displaying the
date, time, user, user IP address and type of event (e.g. login, logout).
110
Video Surveillance
12. Video surveillance
Through this section you can access the display of the configured IP video streams and select the source
(IP camera or video server channel) depending on the images you want to view.
Note: The same window cannot display multiple cameras simultaneously (browser tab).
111
Multimedia video touch screen
Note for Google Chrome users.
To view images from a camera providing an RTSP video stream follow these steps:
1. Select VIDEO SURVEILLANCE.
2. Select the desired RTSP camera.
On the right side of Google Chrome's address bar, the
warning symbol is displayed.
3. Click on the symbol and accept the loading of the non-secure script.
This permits the use, by Google Chrome, of the plug-in for viewing RTSP video streams.
4. The browser reloads the Web-Server home page.
5. Select "Video surveillance".
6. Select the desired RTSP camera.
7. The RTSP camera image will be displayed after starting the plug-in by the browser.
This may take a few seconds.
The procedure should be performed only the first time you are accessing an RTSP camera after opening
the Google Chrome browser, and as long as the browser remains open. After viewing an RTSP camera,
for subsequent access to the RTSP cameras it will be sufficient to perform steps 5, 6, 7 of the procedure
(the confirmation, by the user, of the script opening will remain valid until the Google Chrome browser is
closed).
13. Multimedia video touch screen 10in (cod. 21553)
To use the Webserver from 21553 just run the home automation application.
The login will be done automatically (see the installer manual for more instructions).
From the 21553 you can still login with a user other than the default one; upon logout, the classic screen
appears with the all users on the WebServer and if none of these users are logged in within ten seconds,
the 21553 will automatically log in with the default user
From the 21553 you cannot:
• Export the list on the Alarms and Events SAI
• Export the data history of the Energy Guard
• Export the list of System Messages
• Change the position of the widgets for environments with "Map" Templates
Starting from software version 1.4.08, the Multimedia Video Touch Screen 10in has a section
dedicated to the management of the cameras.
If a 21553 provided with that version (or later) connects to a Web Server with version 1.5 (or later),
the main menu does not display the "video surveillance" entry, because the camera management
takes place from the special section of the 21553 application.
The "Video surveillance" menu entry is still displayed if you access the web server from a client
other than the 21553.
112
113
Viale Vicenza, 14 - 36063 Marostica Italy
Tel. +39 0424 488 600 - Fax 0424 488 188
http://www.vimar.com
49400412C0 01 1307
VIMAR - Marostica - Italy