1
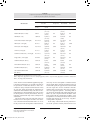
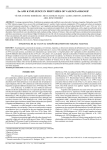
Nutr Hosp. 2015;31(6):2561-2570
ISSN 0212-1611 • CODEN NUHOEQ
S.V.R. 318
Original / Ancianos
Impact of the consumption of a rich diet in butter and it replacement
for a rich diet in extra virgin olive oil on anthropometric,
metabolic and lipid profile in postmenopausal women
Hazel Ester Anderson-Vasquez1,2,4, Pablo Pérez- Martínez4,5, Pablo Ortega Fernández1,3
y Carmina Wanden-Berghe6,7
Universidad del Zulia, 2Laboratorio de Investigación y Desarrollo en Nutrición. 3Instituto de Investigaciones Biológicas, Venezuela.
Universidad de Córdoba, Doctorado en Nutrición y Metabolismo. 5Unidad de Lípidos y Ateroesclerosis. IMIBIC/Hospital
Universitario Reina Sofia, Universidad de Córdoba, and CIBER Fisiopatologia Obesidad y Nutricion (CIBEROBN), Instituto de
Salud Carlos III, España. 6Hospital General Universitario de Alicante. 7Universidad CEU Cardenal Herrera (Elche), España.
1
4
Abstract
Objective: to analyze the impact of the substitution of a
rich diet in saturated fats with a rich diet in monounsaturated fats on anthropometric, metabolic and lipid profile
in postmenopausal women.
Material and methods: a prospective, longitudinal and
comparative study where 18 postmenopausal women
participated in two periods of dietary intervention of
28 days each one: 1) (SAT diet) consumed butter. Caloric formula (CF) = 15% protein, 38% fat. [20% saturated fat (SFA), 12% monounsaturated fat (MUFA) and
47% carbohydrates and 6% polyunsaturated (PUFA)].
b) Period MONO: with extra virgin olive oil (EVOO).
CF = 15% protein, 38% fat (<10% SFA, 22% PUFA and
6% MUFA) and 47% carbohydrates. Size and body composition, glucose, insulin, HOMA, TC, HDL-C, LDL-C,
VLDL-C, TG, TC/HDL-C, LDL-C/HDL-C, TG/HDL-C
and non-HDL-C/HDL.C were measured; dietary Anamnesis/24 hours, daily food record. ANOVA and Bonferroni statistical analysis (SPSS 20) was applied.
Results: the age was 56 ± 5 years, BMI 29.8 ± 3.1 kg/m2,
waist circumference: 93.2 ± 10.1 cm, waist/hip ratio:
0.86 ± 0.14, waist/height: 0.59 ± 0.06 and 38.6 ± 4% body
fat (NS). Lipid profile: SAT diet increased TC (p <0.001),
LDL-C (p <0.002) and non HDL-Cholesterol (p <0.000),
HDL-C increased in MONO diet (p <0.000). SAT diet:
TC/HDL-c ratio, Non col HDL-c/HDL-c, LDL-c/HDL-c
(p <0.000) and TG/HDL-c (p <0.000). In MONO diet decreased TC/HDL-c (p <0.015) and TG/HDL-c (p <0.016).
Correspondence: Carmina Wanden-Berghe
Universidad CEU Cardenal Herrera. Elche.
Hospital General Universitario de Alicante
E-mail: [email protected] – [email protected]
IMPACTO DEL CONSUMO DE UNA DIETA RICA
EN MANTEQUILLA Y SU REEMPLAZO POR
UNA DIETA RICA EN ACEITE DE OLIVA VIRGEN
EXTRA SOBRE EL PERFIL ANTROPOMÉTRICO,
METABÓLICO Y LIPÍDICO EN MUJERES
POSTMENOPÁUSICAS
Resumen
Objetivo: analizar el impacto de la sustitución de una
dieta rica en grasas saturadas por una dieta rica en grasas monoinsaturadas sobre el perfil antropométrico, metabólico y lipídico en mujeres postmenopáusicas.
Material y método: estudio prospectivo, longitudinal y
comparativo en el que 18 mujeres postmenopáusicas participaron en dos períodos de intervención dietética de 28
días cada uno: 1) (dieta SAT) consumieron mantequilla.
Fórmula calórica (FC) = 15% de proteínas, 38% grasas.
[20% grasas saturadas (AGS), 12% grasas monoinsaturadas (AGM) y 47% carbohidratos y 6% poliinsaturadas
(AGPI)]. 2) Periodo MONO: con aceite de oliva virgen
extra (AOVE). Fórmula calórica = 15% de proteínas,
38% grasas (<10% AGS, 22% AGM y 6% AGPI) y
47% carbohidratos. Se midieron dimensión y composición corporal, glicemia, insulina, HOMA, CT, HDL-C,
LDL-C, VLDLC, TG, CT/HDL-C, LDL-C/HDL-C/ TG/
HDL-C y CT no HDL-C/HDLC. Anamnesis dietética/24
horas, registro diario de alimentos. Para el análisis estadístico se aplicó ANOVA y BONFERRONI (SPSS 20).
Resultados: la edad fue de 56 ± 5 años, IMC: 29,8 ± 3,1
kg/m2, circunferencia de cintura (CCi): 93,2 ± 10,1 cm,
circunferencia cintura/cadera (IC/C): 0,86 ± 0,14, relación cintura/estatura (ICE): 0,59 ± 0,06 y 38,6 ± 4 % de
grasa corporal (%GC) (NS). CCi, Dieta SAT al Inicio:
55,6% = RCV, final = 66,7%, dieta MONO = 55,6%. Perfil lipídico: dieta SAT aumentaron CT (p<0,001), LDL-C
(p<0,002) y colesterol NO HDL-c (p<0,000), HDL-C aumentó en dieta MONO (p<0,000). Dieta SAT: Rel. CT/
HDL-c, Col No HDL-c/HDL-c, LDL-c/HDL-c (p<0,000)
y TG/HDL-c (p<0,000). En dieta MONO disminuyeron
CT/HDL-c (p<0,015) y TG/HDL-c (p<0,016).
Recibido: 28-I-15.
1.ª Revisión: 3-III-15.
Aceptado: 7-III-2015.
2561
030_8732 impacto del consumo_INGL.indd 2561
06/05/15 10:46
Conclusions: the SAT diet increased cardiovascular
risk, while the MONO diet decreased the risk to develop the metabolic syndrome components and choronary
heart disease.
Conclusiones: la dieta SAT aumentó el riesgo cardiovascular, mientras que la dieta MONO disminuyó el riesgo de desarrollar los componentes del síndrome metabólico y enfermedades coronarias.
(Nutr Hosp. 2015;31:2561-2570)
(Nutr Hosp. 2015;31:2561-2570)
DOI:10.3305/nh.2015.31.6.8732
DOI:10.3305/nh.2015.31.6.8732
Keywords: Postmenopause. Cholesterol dietary. Olive
oil. Butter. Diet therapy.
Palabras clave: Menopausia. Perfil lipídico. Aceite de oliva. Mantequilla. Intervención dietética.
Abbreviations:
SFA: Saturated fatty acids.
MUFA: Monounsaturated fatty acids.
PUFA: polyunsaturated fatty acids.
EVOO: extra virgin olive oil.
WC: Waist circumference.
TC: Total cholesterol.
TC/HDL-C: Total cholesterol/HDL-C ratio.
Col No HDL: Colesterol no HDL.
DIET SAT: Diet with butter.
DIET MONO: Extra virgin olive oil diet.
CVD: Cardiovascular Diseases.
CVRF: Cardiovascular risk factor.
CVR: Cardiovascular risk.
HDL-C: High density lipoproteins.
BMI: Body Mass Index.
W/Hip I: Waist Hip Index.
W/Height I: Waist Height index.
LDL-C/HDL-C: LDL-C/HDL-C ratio.
LDL-C: Low Density Lipoproteins.
PMW: Postmenopausal Women.
No HDL-C/HDL/C: no HDL-C/HDL-C Ratio.
TG: Triglycerydes.
TG/HDL-C: Triglycerydes/HDL-C Ratio.
VLDL-C: Very Low Density level Lipoproteins.
important to obtain information in determining the
nutritional status as well as their influence on the cardiometabolic risk5.
On the one hand, another important aspect is the
lipid profile6-8. Postmenopausal women have a lipid
profile characterized by high concentrations of total
cholesterol, LDL-C and TG and low HDL-C called
dyslipidemia atherogenic8. It is considered that the
Castelli atherogenic index and LDL-C / HDL-C ratio
are good predictors of the clinical benefit degree on
lipids intervention, although studies have been conducted mainly in pharmacological therapies9. Acevedo M et al showed in their study that the TC / HDL-C
ratio and cholesterol no-HDL-C were the best associated, among different lipoprotein markers, to subclinical atherosclerosis. The HDL cholesterol proved
to be the best protector of carotid thickness10.
In Venezuela women over 45 years accounted for
17.05% of the total female population for 1995 and
projection for 2035 is 35.76%, with a life expectancy
of 74.73 years old. The age for menopause comprises
between 48.7 ± 4.6 years, this indicates that consequent alterations of endocrinological, biological and
clinical processes of this gonadal cessation, will accompany them for a third of their lives11. This aspect
reflects the great importance of the study and management of environmental factors that influence their
lifestyle, specifically food. However, few studies of
dietary intervention on lipids in this cycle of life is
conducted in the region.
From the nutrition point of view, epidemiological
studies have highlighted the role of vegetable fats in
the cardiovascular disease (CVD), neurodegenerative and cancer prevention12,13. Lopez et al14 analyzed
the association between dietary patterns and the presence of cardiovascular risk factors (CVR) in the
National Health and Nutrition Examination Survey
(NHANES) 2001-2002, These authors evaluated
1,313 women, and founded a significant association between dietary patterns and increased CVR.
Cardiovascular protection decreases with age after
menopausia15, so it is possible that dietary intervention of monounsaturated fatty acids instead of saturated fatty acids in healthy diet, can induce different
effects on metabolic risk factors in postmenopausal
women16.
When it comes to foods rich in saturated fatty acids
(SFA) and its effect on CVR factors, it is butter where
Introduction
Menopause is the permanent suspension of menstrual function caused by reduced estrogen secretion,
due to the loss of follicular function1 which brings
the end of the reproductive life of women, so bodily
changes and biochemical characteristics occur that
bring on a number of risk factors associated with
obesity abdominal and insulina resistance2; which includes hypertension, diabetes and dyslipidemia that
increase cardiovascular disease favoring higher mortality in this cycle of life3. Early, natural or surgical
menopause is associated with endothelial dysfunction and increases 3 times the risk of coronaria artery
disease4.
In this period of life, decreased circulating levels
of estrogen brings about changes in the size and body
composition, favoring weight gain of adipose tissue
and increased fat distribution in the abdominal area2.
Currently there are various models, methods and techniques for anthropometric assessment, where it is
2562
030_8732 impacto del consumo_INGL.indd 2562
Nutr Hosp. 2015;31(6):2561-2570
Hazel Ester Anderson-Vasquez et al.
06/05/15 10:46
palmitic and stearic fatty acids predominate. These two
SFA have the greatest potential impact on LDL-C17.
The Health of Nurses, after tracking 80,082 women
for 14 years, has estimated that an increase of 2% of
caloric intake of SFA produces a 28% increased risk of
coronary heart disease 18,19.
On the other hand, aliments rich in monounsaturated fats (MFA), the main representative being extra
virgin olive oil (EVOO), which has a higher anti-atherogenic capacity, improves metabolic syndrome, facilitates glucose control, blood pressure and has beneficial effects on platelet function, thrombogenesis and
fibrinolisis20.
According to the above stated, the present research
aimed to determine the impact of two dietary interventions in order to measure effects on anthropometric,
metabolic and lipid profile before and after consumption of a diet high in saturated fat (diet SAT), compared
to its replacement on a diet rich in monounsaturated
fatty acids (diet MONO) supplied to a group of postmenopausal women, to generate dietary interventions
aimed at improving the quality of life of women during
this cycle of life.
Study design
It is a prospective, longitudinal, experimental
and comparative research. It consisted of 18 postmenopausal women (PMW) selected according to
the inclusion criteria and subjected to two dietary
interventions. Menopause was defined according to
published criteria1,6. In the pre and post intervention periods, a menu was provided with a similar fat
composition to be consumed in each diet. The Shaw
et all21 criteria for dietary intervention protocol was
used.
Study population
From a universe of 100 PMW attending the Outpatient Nutrition Clinic, from March 2011 to March
2012; after explanation of the protocol, 18 patients
who met the following criteria were selected: a) Between 50 and 65 years old. b) Being postmenopausal.
c) Not having evidence of chronic disease, including
liver, kidney, thyroid or heart dysfunction. d) Not
following a low calorie diet. e) Not receiving drugs
that could affect lipid metabolism. f) Has not received hormone replacement therapy; and g) Agreeing in
writing to participate in the study. This research was
approved by the Ethics Committee of the Laboratory
for Research and Development in Nutrition, School of
Nutrition and Dietetics, Faculty of Medicine, University of Zulia.
030_8732 impacto del consumo_INGL.indd 2563
Anthropometric Assessment
The measurements were performed by a specialist
in Clinical Nutrition, previously trained and standardized in anthropometry. Women were assessed only with
the minimum of clothes, no shoes or accessories. The
technical error of measurement was within the range
of values considered adequate: weight: 0.00 g, size:
0,01cm and triceps skinfold (PTr) 0.1 mm. Skinfolds
were measured with a Lange® grease caliper (Cambridge Scientific Instruments, Cambridge, MD) with a
measuring range of 0-60 mm, graduation 0.3 mm and
a constant pressure of 10 g/mm2. Scales INNER-Scan
Body Composition Monitor by Tanita, Ironman TMBC554-3901 was used to determine body composition. For perimeters a 150 cm long anthropometric
measuring tape was used. The measures of size and
body composition22 were taken according to the criteria of the WHO23 .
Biochemical Evaluation
Materials and methods
Impact of the consumption of a rich diet in
butter and it replacement for a rich diet in
extra virgin olive oil...
Methodology
The sampling was performed at the Laboratory
for Research and Development in Nutrition, after
an overnight fast of 12 hours in a conditioned room
where patients remained seated and relaxed. Then it
was proceeded to attain the right antecubital vein,
collecting 5 ml of blood in dry tube, samples were
taken at baseline and 28 days after that at the end of
each period; then it was proceeded to determine the
levels of glucose, insulin, TG, TC, HDL-C, LDL-C,
VLDL-C.
Insulin was determined by ELISA (DRG Instruments GmbH, Germany, Division of DRG International, Inc.) and blood glucose by the enzymatic colorimetric method of Glucose Oxidase (Human Gesellschaft
für Biochemica und Diagnostica mbh). With both data
it was proceeded to calculate HOMA-IR (Homeostasis Model Assessment) index, using the parameters of
insulin and basal glucose following formula: IR (HOMA-IR) = Insulin fasting (uU / mL) × fasting glucose
(mmol /L)/22.524.
Different concentrations of lipids were analyzed
using commercial colorimetric methods (Human Gesells Chaftfür Biochemical und Diagnostica mbh).
LDL-C cholesterol was calculated using the Friedewald formula: LDL-C=CT (HDL-C + TG/5)24. It
was used as a reference for the lipid profile ATP III25
criteria. Regarding lipoprotein9 ratios were determined
as follows:
–– For the atherogenic index Castelli26 equals relation to TC/HDLC-C, the following were taken as
cutoff points: <4.5 lower risk, from 4.5 to 7 moderate risk and >7 high risk.
Nutr Hosp. 2015;31(6):2561-2570
2563
06/05/15 10:46
–– For the LDL-C/HDL-C index <3 was taken as the
cutoff point.
–– For the relation CHOLESTEROL No HDL/
HDL-c, <4.5 was taken as the cutoff.
–– For the TG/HDL-C ratio, > = 3.0 was used as the
cutoff.
Dietary Assessment
During the initial dietary assessment27 was performed by applying the 24-hour recall28 in a standardized
manner to identify the habits and preferences of the
participants taking into account two nonconsecutive
days (usual day and not usual), emphasis was placed
on the amounts and types of food as well as specials
preparations, recording measurements and ingredients
used. During the execution of the study to assess diets
compliance, their homes were visited and 3 phone
calls were made weekly. To calculate the contribution
of energy and nutrients a computer program with data
from the Table of Food Composition of Venezuela29
was used.
Dietary intervention
All volunteers participated in two dietary intervention periods of 28 days each one, isocaloric in
relation to their usual previous consumption in order
to keep their weight stable. There was no washout
period. At the beginning and end of each dietary intervention period the respective biochemical tests
were performed. PMW consumed the SAT diet which
comprises 15% protein, 47% carbohydrate (CHO)
and 38% fat (20% SFA, 12% MUFA, and PUFA 6%)
and the MONO diet which comprised 15% protein ,
47% CHO, 38% fats (<10% SFA, 22% MUFA and
PUFA 6%). Cholesterol intake was less than 300 mg/
day for the two periods of dietary intervention. With
the results of dietary assessment it was proceeded to
calculate the average caloric formula and the drafting
of the regimes used in different periods according to
the type of fat used.
The diet was made based on 7 rotating menus previously established with an isocaloric formula which
providing for the SAT DIET 1926 kcal, 80.7 g fat;
while where provided for the MONO diet 1951 kcal
and 82.7 g of fat. Both regimens provided 79 g protein
and 222 g carbohydrate. These diets were consumed
by patients at home. The participants in the first stage
received the SAT diet where they consumed 50 g of
butter a day as a source of saturated fat, which they
smeared on white bread or corn products; subsequently, they received the OLIVA diet, which included 50 cc
of EVOO, which was consumed in soup (added raw)
or tablespoons.
2564
030_8732 impacto del consumo_INGL.indd 2564
Statistical analysis
For the statistical treatment of the data, the statistical program package SPSS (Statistical Package for
Social Sciences) version 17,029 was used. Descriptive
Statistics were used to represent the results as mean
± standard deviation and change percentages for the
control diet in tables. The Kolmogorov – Smirnov test
was used to compare the normal distribution of the variables. The Levene test was used in the contrast of
the homogeneity test. To determine the effect of the
different diets on the studied variables, the analysis of
variance (ANOVA) was used in comparing arithmetic
means and post hoc, Bonferroni was applied. p <0.05
was considered as the significant statistical value.
Results
Women studied were of 56±5 years old, with a range
between 50 and 64. Table 1 shows the anthropometric variables of body dimension, it appears that at the
beginning of the SAT diet, BMI was 29.8±3.1 kg/m2,
waist circumference (WC), 93.2±10.1 cm, waist/hip
circumference (W/HC) of 0.86±0.14 and waist/height
relationship (W/HR) of 0.59±0.06. Also, regarding
the body composition, the subjects presented a body
fat percentage of 38.6±4%. There were no significant
differences in anthropometric measurements between
the two diets. However, while analyzing the effects of
the anthropometric indicators of cardiovascular disease risk, it was found that the cardiovascular disease
risk had increased during the consumption of the SAT
diet for all indicators; which then decreased during the
period of the MONO diet consumption.
In table 3 a metabolic and lipidic profile is presented
for both periods. Regarding the metabolic profile, glycemia and the HOMA-IR index significantly increased
during the SAT diet, while not presenting any modifications at the end of the MONO period. Regarding
the lipidic profile, it was observed that during the SAT
diet there was a significant increase in TC (p <0.001),
LDL-C (p <0.002) and observed the no cholesterol
HDL-c (p <0.000). Additionally, no significant changes were observed in the VLDL-C, nor TG on any of
the dietary interventions. Nevertheless, while percentage comparing it was found that during the MONO
period the TG and VLDL-C decreased by 7.4% and
7.2%, respectively.
When it comes to the HDL-C, it was observed
that in the MONO diet the response was significant
(p <0.000). Another aspect evaluated in table 3 were
the lipoproteics indicators where it is evident that the
relation CT/HDL-C and the relation Col No HDL-C/
HDL-C increased the cardiovascular disease risk in the
SAT diet (p <0.000); the same aspect decreased in the
MONO diet (p <0.015 and p <0.016 respectively). The
relation LDL-C/HDL-C increased during the SAT diet
(p <0.000).
Hazel Ester Anderson-Vasquez et al.
06/05/15 10:46
Table I
Comparison of anthropometric variables of participants body size and composition
in the two periods of dietary intervention.
Dietary Intervention Type
Antropometric
Variable
Diet SAT
Diet MONO
BEGINNING
(n=18)
ENDING
(n=18)
(n=18)
Body weight (kg)
72.4±10.3
72.2±10.0
71.9±10.2
BMI (kg/m )
29.8±3.1
29.7±2.9
29.7±2.9
Torax (cm)
103.1±8.9
102.8±9.5
101.7±9.0
Waist circumference (cm)
93.2±10.1
93.3±9.5
93.2±10.1
Hip circumference (cm)
108.0±7.2
107.7±6.3
106.0±6.7
Waist/Hip Circumference
0.86±0.14
0.86±0.15
0.87±0.15
Waist/Height ratio
0.59±0.06
0.59±0.06
0.58±0.05
Thigh circumference (cm)
106.6±5.2
106.6±5.4
106.7±4.9
Media right arm/ Circunferemce (cm)
32.6±3.1
32.6±2.8
32.2±2.8
Right wrist (cm)
16.7±1.3
16.7±1.1
16.5±1.0
Body built
9.2±0.54
9.1±0.46
9.23±0.42
Right thigh circumference (cm)
63.1±3.6
63.7±3.5
62.1±2.5
Right calf circumference (cm)
37.9±2.1
37.8±2.2
37.2±2.4
Biceps skinfold (mm)
11.8±3.2
11.3±2.7
11.2±2.6
Triceps skinfold (mm)
17.1±4.6
19.0±3.0
18.9±3.1
Subscapular skinfold (mm)
22.0±5.2
20.3±4.6
20.3±3.3
Suprailiac skinfold (mm)
26.7±6.4
27.1±3.2
25.4±3.2
Abdominal skinfold (mm)
27.3±5.5
27.0±4.6
25.4±4.3
Total body water (%)
42.7±2.4
42.3±2.3
41.4±2.0
Fat free area (kg)
41.8±3.8
41.2±3.7
40.6±3.8
Body size
2
Body composition
Bone tissue (kg)
2.2±0.1
2.2±0.2
2.1±0.2
Body fat (%)
38.6±4.0
39.2±4.0
40.4±3.5
Body fat (kg)
28.2±6.4
28.5±6.2
29.5±5.8
Visceral fat (%)
9.3±1.9
9.5±1.9
9.8±1.8
Visceral fat (kg)
6.8±2.1
6.9±2.1
7.1±2.1
Values represent the mean ± D. Diet SAT: Butter diet. Diet MONO: Extra virgin olive oil diet.
Table IV represents percentage ratio comparison
in regards of the lipid profile of both types of diets.
Regarding the cholesterol, it was observed that after
the ingestion of butter the cardiovascular disease risk
increased in 77.8% of the patients, said risk decreased
after the consumption of olive oil in 61.1% of the patients. Table 4 also shows that the levels of LDL-C,
after the consumption of butter, increased in all of the
patients, while decreasing during the consumption of
EVOO, and optimal values were observed in 11.1% of
the patients.
Impact of the consumption of a rich diet in
butter and it replacement for a rich diet in
extra virgin olive oil...
030_8732 impacto del consumo_INGL.indd 2565
For a more specific analysis the percentage evaluation of the lipoprotein ratios of cardiovascular disease
risk in every patient was considered. In that sense, table
4 showing the CT/HDL-C relation, it is observed that
during the dietary intervention with butter, the risk of
cardiovascular disease increased in all patients; while
decreasing during the extra virgin olive oil intervention, in such a way that 33.3% presented low risk. In
the same order of ideas, table 4 shows similar results
for the LDL-C/HDL-C relation and the TG/HDL-C.
Furthermore, it is shown that in the NO cholesterol
Nutr Hosp. 2015;31(6):2561-2570
2565
06/05/15 10:46
Table II
Comparison of anthropometric indicators of cardiovascular risk
in the two periods of dietary intervention.
Anthropometric
Indicator
Diet SAT
BEGINNING
(n=18)
Diet MONO
ENDING
(n=18)
(n=18)
Body Mass Index
Normal
5 (27.8%)
4 (22.2%)
4 (22.2%)
Overweight
3 (16.7%)
5 (27.8%)
5 (27.8%)
Obesity
10 (55.6%)
9 (50.0%)
9 (50.0%)
Without risk
8(44.4%)
6 (33.3%)
8(44.4%)
With risk
10 (55.6%)
12 (66.7%)
10 (55.6%)
2 (11.1%)
1 (5.6%)
2 (11.1%)
Waist Circunference
Waist/Hip Index
Low risk
Moderated risk
8(44.4%)
10 (55.6%)
8(44.4%)
High risk
8(44.4%)
7 (38.9%)
8(44.4%)
Without risk
2 (11.1%)
0 (0.0%)
1 (5.6%)
With risk
16 (88.9%)
18 (100.0%)
17 (94.4%)
Waist/Height Index
Diet SAT= butter diet
Diet MONO= extra virgin olive oil diet
HDL-C/HDL-C relation, during the SAT period, the
cardiovascular disease risk increased for 83.3% of the
patients to high risk; however, these values improved
in the MONO diet for 66.7% of the subjects.
Discussion
Despite major advances in the pharmacological management of dyslipidemia in recent decades, nutrition
continues to play a key role in primary and secondary
prevention of CVD. The main objective of this study
was to determine the effect of a dietary intervention
that included the replacement of saturated fatty acids
represented by butter, as base grease of the typical
Western diet based on monounsaturated fatty acids
using extra virgin olive oil, as fat source of the Mediterranean diet, over atherogenic dyslipidemia of PMW;
obtaining as a result that the SAT diet severely increased cardiovascular disease risk, which improved by
receiving the MONO diet.
During menopause, cardiovascular risk factors are
of greater impact due to hormonal changes, age, weight gain, inactivity and altered lipidic profile3. Women
in this study were overweight and fat distribution of
android type, with high cardiovascular metabolic risk
according to the WC, W/Hip and W/Height index,
which can foster the development of insulin resistance
2566
030_8732 impacto del consumo_INGL.indd 2566
Nutr Hosp. 2015;31(6):2561-2570
and its clinical consequences: carbohydrate intolerance and type 2 diabetes, hypertension, dyslipidemia and
coronary disease1,2.
This investigation the studied patients were
overweight with abdominal fat distribution. Similar
results were reported by Meertens et al.30 who evaluated 129 PMW aged 52.52±5.48 years old, they found
a BMI of 28.07±5.78 kg/m2, and WC of 89.16±11.13
cm with similar cardiometabolic risk; either than Rosety-Rodriguez et al31 were aimed at clarifying whether
central obesity measurements assessed by dual X-ray
absorptiometry may predict metabolic syndrome in
1326 Spanish postmenopausal women aged > 45 years
old, during the observation period 537 women, representing 40.5% of the total studied, met the diagnostic
criteria for metabolic syndrome. Also differs from those values reported by Miguel-Soca et al.8 who studied
298 menopausal women aged 59.5±9.7 years finding
a BMI of 30.46±5.23 kg/m2, and WC of 102.16±11.58
cm. Menopause brings with it increased fat due to age
decreases of the basal metabolic rate associated with
a progressive reduction in physical activity, decreased
estrogen controlling leptin and possibly regulating
appetite, inadequate food habits, socioeconomic conditions and genetic8.
The high cardiovascular risk observed in these women justifies the need for studies on the lipid profile
diet effects, that being the main objective of this re-
Hazel Ester Anderson-Vasquez et al.
06/05/15 10:46
Table III
Comparison of metabolic and lipid profile of the participants
in the two periods of dietary intervention.
Dietary Intervention Type
Biochemicals
Diet SAT
Bonferroni
Beginning
(n=18)
Ending
(n=18)
Glycemia (RV: 70-100 mg/dl)
85.0±6.1
Basal Insulin (RV:< 25 UI/l)
Diet MONO
Bonferroni
p<0,005
(n=18)
p<0,005
95.4±11.9
(↑11.7%)
0,008
94.0±10.8
(↓1.5%)
NS
9.5±2.6
11.1±2.3
(16.8%)
NS
10.2±1.8
(↓8.9%)
NS
HOMA (RV: <2,5)
1.99±0.66
2.62±0.77
(↑31.6%)
0,029
2.36±0.67
(↓10%)
NS
Total Cholesterol (RV:<200 mg/dl)
182.7±16.2
223.2±30
(↑22.1%)
0,001
211.7±39.8
(↓5.1%)
NS
HDL-C (RV: <45 mg/dl)
39.3±2.7
40.0±1.9
(↑1.7%)
NS
43.4±1.6
(↑8.5%)
0,000
LDL-C (RV: 100-140mg/dl)
110.1±12.6
149.0±30
(↑35.3%)
0,002
140.9±43.3
(↓5.5%)
NS
VLDL-C (<25 mg/dl)
33.1±1.7
33.6±4.6
(↑1.5%)
NS
31.2±4.2
(↓7.2%)
NS
No HDL-C Cholesterol ( < 140 mg/dl)
143.3±13.7
183.1±13.7
(↑27.7%)
0,000
169.7±37.3
(↓7.4%)
NS
Triglycerides (<150 mg/dl)
164.9±6.4
168.1±23.0
(↑1.9%)
NS
155.8±21.7
(↓7.4%)
NS
CT/HDL-C Rel (RV: 00-4,5)
4.61±0.25
5.5±0.7
(↑19.3%)
0,000
4.8±0.9
(↓12.7%)
0,015
LDL-C/HDL-C Rel (RV: 0,0-3)
2.83±0.22
3.8±0.7
(↑34.2%)
0,000
3.5±0.9
(↓7.8%)
NS
TG/HDL-C Rel (RV:0,0-3)
4.22±0.30
4.20±0.68
(↓0.47%)
NS
3.90±0.87
(↓7.1%)
0,003
Col No HDL-C/HDL-C Rel
(RV: 00-4,5)
3.63±0.20
4.47±0.58
(↑23.1%)
0,000
3.63±0.20
(↓18.7%)
0,016
Values represent the mean ± DE
Diet SAT: Butter diet. Diet MONO: Extra virgin olive oil diet.
HDL-C: High density lipoproteins. LDL-C: Low density lipoproteins, VLDL-C: Very low density lipoproteins, Col HDL-C: cholesterol no
HDL-C , TG: Triglycerides, Rel: Relación.
search. In terms of diet in different population groups,
it has been reported that it is especially important in
the prevention of mentioned diseases12,32 Hu et al.32
conducted a study of 80,082 women between 34 and
59 years old, which showed that the replacement of
saturated fat and unsaturated fatty acids trans for monounsaturated or polyunsaturated fatty acids prevents
the development of coronary heart disease, more significantly compared with only reduce consumption of
saturated fat.
The present study at the end of the SAT period, an
increase in TC at the expense of LDL-C was observed. It has been demonstrated that LDL-C is one of
the key factors in the development of atherosclerosis,
Impact of the consumption of a rich diet in
butter and it replacement for a rich diet in
extra virgin olive oil...
030_8732 impacto del consumo_INGL.indd 2567
since they are more susceptible to oxidation because
they are better able to enter the macrophage monocyte
arterial wall system; the opposite effect occurred when
the extra virgin olive oil was consumed as monounsaturated fatty acids present in this oil are incorporated to the lipoproteic particle15. Concerning HDL-C
was observed, that EVOO diet significantly improved
HDL-C by 8.5% compared with the diet butter. It has
been reported that the concentration of HDL-C is the
best predictor of coronary heart disease risk in women,
and their risk decreases by 3% for every 1 mg/dl increasing HDL-C in plasma32.
In this study, cardiovascular disease predictive index in the 2 periods of dietary intervention for com-
Nutr Hosp. 2015;31(6):2561-2570
2567
06/05/15 10:46
Table IV
Comparison of lipoproteins ratio and cardiovascular risk of the participants
in the two periods of dietary intervention.
Dietary Intervention Type
Diet SAT
Indicator
Diet MONO
BEGINNING
(n=18)
ENDING
(n=18)
(n=18)
17 (94.4%)
4 (22.2%)
7 (38.9%)
High
1 (5.6%)
7 (38.9%)
7 (38.9%)
Very high
0 (0.0%)
7 (38.9%)
4 (22.2%)
Optimum
4 (22.2%)
0 (0.0%)
2 (11.1%)
Intermediate
14 (77.8%)
6 (33.3%)
7 (38.9%)
High limit
0 (0.0%)
6 (33.3%)
4 (22.2%)
High
0 (0.0%)
5 (27.8%)
1 (5.6%)
Very high
0 (0.0%)
1 (5.6%)
4 (22.2%)
Low risk
3 (16.7%)
0 (0.0%)
6 (33.3%)
Moderate risk
15 (83.3%)
17 (94.4%)
12 (66.7%)
0 (0.0%)
1 (5.6%)
0 (0.0%)
Low risk
2 (11.1%)
0 (0.0%)
3 (16.7%)
Moderate risk
16 (88.9%)
5 (27.8%)
7 (38.9%)
0 (0.0%)
13 (72.2%)
8 (44.4%)
Low risk
0 (0.0%)
0 (0.0%)
1 (5.6%)
High risk
18 (100.0%)
18 (100.0%)
17 (94.4%)
Total Cholesterol
Desirable
Low density lipoproteins
Cholesterol total/HDL-C Relationship
High risk
LDL-C/HDL-C Relationship
High risk
Triglycerides/HDL-C Relationship
Colesterol NO HDL-C/HDL-C Relation
Low risk
18 (100.0%)
3 (16.7%)
12 (66.7%)
High risk
0 (0.0%)
15 (83.3%)
6 (33.3%)
Values represent the mean ± DE
Diet SAT: Butter diet. Diet MONO: Extra virgin olive oil diet.
HDL-C: High density lipoproteins. LDL-C: Low density lipoproteins, VLDL-C: Very low density lipoproteins, Col HDL-C: cholesterol no
HDL-C , TG: Triglycerides , Rel: Relationship.
paring the use impact of diet high in SFA and its replacement by a diet rich in MUFA were calculated; in
this sense the Castell index and LDL-C/HDL-C ratio
reflect increased atherogenic lipoproteins (LDL-C),
and the decrease in HDL-C correlating with cardiovascular risk factors such as the components of metabolic
syndrome (MS). Moreover, it has been shown that the
predictive value of TG/HDL-C ratio is high for heart
disease, and there is a direct relationship with hypertension and MS9.
In this line of thought, the results of this work at
the beginning there was no PMW with high CV risk;
2568
030_8732 impacto del consumo_INGL.indd 2568
Nutr Hosp. 2015;31(6):2561-2570
which is why they differ from E Chavez Gonzalez et
al.33 who evaluated the rate of Castell in 112 menopausal study reporting that 9.3% had low risk, 68.6%
moderate risk and 22% high cardiovascular risk. Similarly, regarding the dietary intervention periods, the lipoprotein indicators showed high atherogenic and MS
risk in patients following consumption of a diet rich in
butter; as well as the beneficial effect of consuming a
diet rich in EVOO.
The consumption of olive oil has been widely studied13,15,21. The PREDIMED study with 7,216 subjects
between 55 and 80 years old, including both genders,
Hazel Ester Anderson-Vasquez et al.
06/05/15 10:46
with high cardiovascular risk, concluded that consumption of olive oil, especially extra-virgin variety
was associated with a significantly reduced risk of
cardiovascular events and cardiovascular mortality. It
is important to consider that for every 10 g per day
increase in total consumption of olive oil is associated with a 16% reduction in cardiovascular mortality,
based on the findings in the EPIC-España34 study. No
literature that would allow comparison of lipid profile
dietary intervention periods applying the aforementioned ratios is found.
This study has some limitations. The most important one was the small sample size, due to the high
cost of chemical reagents, its scarcity and high inflation in the country where the study took place. As
well as consumer acceptance of extra virgin olive oil
because it is not part of the food patterns within the
Western diet.
Conclusion
The results of this study indicates that replacing saturated fat butter and extra virgin olive oil improved
atherogenic dyslipidemia, but did not influence the
metabolic profile in these postmenopausal women.
Conflicts of interest
No conflicts of interest.
References
1. Zárate A, Saucedo R, Basurto L, Martínez C. La enfermedad
cardiovascular como amenaza actual para la mujer adulta mayor. Ginecol Obstet Mex.2007; 75: 286-92.
2. Rojas J S, Lopera V J S, Cardona V J, Vargas G N, Hormaza A
M P. Síndrome metabólico en la menopausia, conceptos clave.
Rev. chil. obstet. ginecol. 2014; 79(2) : 121-128.
3. Pinto López E, Rice C and Weddle D O. The relationship
among cardiovascular risk factors, diet patterns, alcohol consumption, and ethnicity among women aged 50 years and older. J. Am Diet Assoc. 2008; 108(2): 248-256.
4. Velázquez-Maldonado Elsy M. Prevención cardiovascular en
la mujer postmenopáusica. Rev. Venez. Endocrinol. Metab.
2009 Jun; 7(2): 3-16.
5. Rosales Ricardo Y. Antropometría en el diagnóstico de pacientes obesos: una revisión. Nutr. Hosp. 2012 Dic; 27(6): 18031809.
6. Arca M, Lena-Vega G, Grundy S. Hypercholesterolemia in
post-menopausal women. JAMA.1994; 27: 453-459.
7. Villasmil E R, Guerra V M, Torres M M, Reyna N, Mejía M J.
Perfil lipídico en mujeres pre menopáusicas y posmenopáusicas. Rev Obstet Ginecol Venez. 2007; 67(2): 107-114.
8. Miguel-Soca PE, Rivas-Estévez M, Sarmiento-Teruel Y, Mariño-Soler AL, Marrero-Hidalgo M, Mosqueda-Batista L. Factores de riesgo de enfermedad cardiovascular en mujeres con
menopausia. Rev Fed Arg Cardiol. 2014; 43(2): 90-96.
9. Millán J, Pintó X, Muñoz A, Zúñiga M, Rubíes-Prat J, Pallardo
L F et al. Cocientes Lipoproteicos: significado fisiológico y
utilidad de los índices aterogénicos en prevención cardiovascular. Clin Invest Arterioscl. 2010; 22(1): 25-32.
Impact of the consumption of a rich diet in
butter and it replacement for a rich diet in
extra virgin olive oil...
030_8732 impacto del consumo_INGL.indd 2569
10. Acevedo M, Krämer V, Tagle R, Corbalán R, Arnaíz P, Berríos
X, Navarrete C. Relación colesterol total a HDL y colesterol no
HDL: los mejores indicadores lipídicos de aumento de grosor
de la íntima media carotidea. Rev Med Chile 2012; 140: 969976.
11. CEPAL América Latina y el Caribe: el envejecimiento de la
población. 1950-2050. Santiago de Chile: Boletín Demográfico. Centro Latinoamericano y Caribeño de Demografía (CELADE); 2003.
12. Carrillo Fernández L, Dalmau Serra J, Martínez Álvarez JR,
Solà Alberich R, Pérez-Jiménez F. Grasas de la dieta y salud
cardiovascular. Nutr. clín. diet. Hosp. 2001; 31(2): 6-25.
13. Pérez-Martínez P, Moreno-Conde M, Cruz-Teno C, Ruano J,
Fuentes F, Delgado-Lista J, Garcia-Rios A et al. Dietary fat differentially influences regulatory endothelial function during
the postprandial state in patients with metabolic syndrome:
from the LIPGENE study. Atherosclerosis. 2010; 209(2): 5338.
14. López EP, Rice C, Weddle DO, Rahill GJ. The relationship
among cardiovascular risk factors, diet patterns, alcohol consumption, and ethnicity among women aged 50 years and older. J Am Diet Assoc. 2008 Feb; 108(2): 248-56. doi: 10.1016/j.
jada.2007.10.043.
15. Rodenas S, Rodríguez-Gil S, Cruz Merinero M, Sánchez-Muniz FJ. Dietary Exchange of an Olive Oil and Sunflower Oil
Blend for Extra Virgin Olive Oil Decreases the Estimate Cardiovascular Risk and LDL and Apolipoprote in AII Concentrations in Postmenopausal Women. Rev. Journal of the American
College of Nutrition. 2005; 24(5): 361–369.
16. Tardivo AP, Nahas-Neto J, Nahas EA, Maesta N, Rodrigues
MA, Orsatti FL. Associations between healthy eating patterns
and indicators of metabolic risk in postmenopausal women.
Nutr J. 2010 Dec 8; 9:64. doi: 10.1186/1475-2891-9-64.
17. Cicerale S, Conlan XA, Sinclair AJ, and Keast RSJ. Chemistry
and Health of Olive Oil Phenolics. Critical Reviews in Food
Science and Nutrition. 2009; 49: 218–236.
18. Sun J, Buys NJ, Hills AP. Dietary pattern and its association
with the prevalence of obesity, hypertension and other cardiovascular risk factors among Chinese older adults. Int J Environ
Res Public Health. 2014 Apr 10; 11(4): 3956-71. doi: 10.3390/
ijerph110403956.
19. Vilela AA, Sichieri R, Pereira RA, Cunha DB, Rodrigues PR,
Gonçalves-Silva RM, Ferreira MG. Dietary patterns associated
with anthropometric indicators of abdominal fat in adults. Cad
Saude Publica. 2014 Mar; 30(3): 502-10.
20. Pérez- Martínez P, López- Miranda J, Delgado-Lista J,
López-Segura F y Pérez - Jiménez F. Aceite de oliva y prevención cardiovascular: más que una grasa. Clin Invest Arterioscl.
2006; 18(5): 195-205.
21. Shaw, D.I., Tierney A.C., McCarthy S., Upritchard J., Vermunt
S., Gulseth H.L. et al. J.A. LIPGENE food-exchange model
for alteration of dietary fat quantity and quality in free-living
participants from eight European countries. British Journal of
Nutrition. 2009; 101(5): 750-759. ISSN 0007-1145.
22. Onis M, Habicht P. Anthropometric reference data for international use: recommendations from a World Health Organization Expert Committee. 1996.
23. ISAK. International Standards For Anthropometric Assessment. International Society for the Advancement of Kinanthropometry. National Library of Australia. 2001: 1-123.
24. Díaz Portillo J, Staff V.V., Fernández del Barrio M.T., Paredes
Salido F. Determinaciones bioquímicas: Utilidad y valoración
clínica Editorial Elsevier, España, 2004. ISBN 8445813684,
9788445813683. 524 pp.
25. Castelli WP. Epidemiology of coronary heart disease: The Framingham Study, Am J Med, 1984; 76: 4-9.
26. ATP III Guidelines At-A-Glance Quick Desk Reference. Third
Report of the Expert Panel on. National Cholesterol Education
Program. National. institutes of Health. National Heart, Lung,
and Blood Institute. NIH Publication. 2001; No. 01-3305:1-6.
27. Palma SG, Puchal A, Vilà M C, Miserachs M, Illan M . Entrevista dietética: Herramientas útiles para la recogida de datos.
Rev Med Univ Navarra. 2006; 50(4): 46-55.
Nutr Hosp. 2015;31(6):2561-2570
2569
06/05/15 10:46
28. Instituto Nacional de Nutrición. Tabla de Composición de Alimentos para uso práctico. Publicación Nº 52. Caracas (Venezuela). Serie Cuadernos Azules. 2001: 15-77.
29. Manual del Usuario de SPSS (2010) IBM_SPSS_Statistics_
Base_20.148151002 SPSS Inc., an IBM Company Headquarters, 233 S. Wacker Drive, 11th floor. Chicago, Illinois 60606.
30. Pavón de Paz I., Alameda Hernando C y Olivar Roldán J. Obesidad y Menopausia. Nutr. Hosp. 2006; 21(6): 633-637.
31. Meertens L, Díaz N, Fraile C, Riera M, Rodirguez A, Rodríguez L y cols . Estado nutricional, indicadores antropométricos
y homocisteína sérica en mujeres posmenopáusicas venezolanas. Rev. chil. nutr. 2011 Sep; 38(3) : 278-284.
2570
030_8732 impacto del consumo_INGL.indd 2570
Nutr Hosp. 2015;31(6):2561-2570
32. Hu FB, Stampfer MJ, Manson JE, Rimm E, Colditz GA, Rosner BA et al. Dietary fat intake and the risk of coronary heart
disease in women. N Engl J Med.1997; 337: 1491–1499.
33. Chávez González E, Romero Romero N, Pardo Morales RV.
Índice aterogénico en pacientes Perimenopáusicas. Archivos de
Investigación Materno Infantil. 2011 mayo-agosto; III (2): 7376. URL:www.medigraphic.org.mx.
34. Guasch-Ferré M, Hu FB, Martínez-González MA, Fitó M,
Bulló M, Estruch R et al. Olive oil intake and risk of cardiovascular disease and mortality in the PREDIMED Study.
BMC Med. 2014 May 13;12:78. doi: 10.1186/1741-701512-78.
Hazel Ester Anderson-Vasquez et al.
06/05/15 10:46