1
Controls and readout
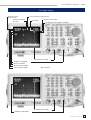
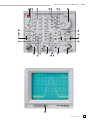
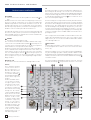
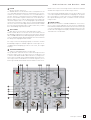
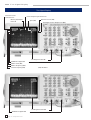
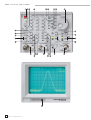
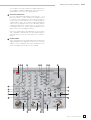
TUNING
The knob TUNING can be used to change all functions with
pushbuttons and associated LEDs in the upper sector of the
front panel. They are: INTENS, FOCUS, TR, CENTER FREQ.,
MARKER, REF.-LEVEL and TG-LEVEL.
5 dB/DIV.
Pushbutton with associated LED – Pressing this pushbutton switches the vertical scale from 10 dB/Div. (LED dark)
to 5 dB/Div. (LED lit) and vice versa, without changing the
reference level setting. With 5 dB/Div. selected, the display
range is 40 dB instead of 80 dB.
Note:
Switching over to 5dB/Div. can cause the noise band to „disappear“ from the screen, but it can be made visible again by
changing the REF.-LEVEL .
ATTN.
Pushbuttons with associated LEDs. – Pressing one of the
pushbuttons switches the attenuator in 10 dB steps from
0 dB to 40 dB resp. from 40 dB to 10 dB. The measuring range
depends on the attenuator setting. If 10dB/div. is set (80dB
scale), the following measuring ranges are available:
Attenuator setting
40 dB
30 dB
20 dB
10 dB
Reference Level approx. Noise Level
+10 dBm
–60 dBm
0 dBm
–70 dBm
10 dBm
–80 dBm
20 dBm
-90 dBm
Pressing and holding the upper pushbutton causes switch
over from 10 dB to 0 dB. Due to the high sensitivity of the input stage, this measure has been taken to protect the input
stage from being set to 0 dB inadvertently.
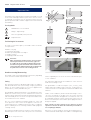
IMPORTANT:
It must be emphasized once again that
the maximum permissible input voltages must not be exceeded. This is of high
impor tance as the
analyzer may only
display a part of the
spectrum and high
signal levels outside
the measuring range
may cause measuring
errors or in worst case destruction of the
input section.
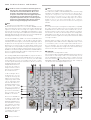
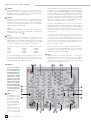
RBW
Pushbuttons with associated LEDs. – The
pushbuttons allow
you to select one of
three IF bandwidths.
A lit LED indicates the
actual bandwidth setting.
With the exception
of ZERO SPAN, the
curve of the selected
IF filter is displayed
40
Subject to change without notice
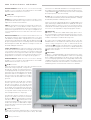
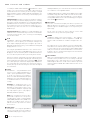
when a signal passes the IF filter causing the beam to be deflected to the screen top, depending on the signal strength. It
depends on the IF bandwidth (RBW=Resolution Bandwidth)
whether two different sine wave signals with minor frequency distance can be displayed separately. For example, two
sine wave signals with 40 kHz signal difference and equal
amplitude can be identified as two different signals if 9 kHz
RBW is selected. With 120 kHz or 1 MHz RBW selected, the
two signals are displayed as one signal only.
A smaller IF bandwidth shows more details, but has the
disadvantage that the building up time is higher. If due to
high SPAN setting there is not enough time for building up,
the spectrum analyzer automatically increases the time for
a SPAN. This becomes visible by a reduced measurement
repetition rate.
If the lowest repetition rate is still not suitable for correct
measurement, the readout displays „uncal“, as under such
circumstances the signal is displayed with too low a level.
For proper measurement the SPAN must then be reduced
until the „uncal“ information is no longer displayed. For the
ease of operation it is advisable to set the signal to the center
before reducing the SPAN.
With the 4 kHz video filter activated, the bandwidth reduces
once again. A smaller bandwidth reduces the noise and offers a higher sensitivity. This becomes evident when switching from 1000 kHz to 9 kHz RBW.
VBW
Pushbutton with associated 4-kHz-LED – Pressing this
pushbutton switches the video filter on or off. In ON-condition
the video filter reduces noise using a low pass filter. Weak
signals, which normally get lost in the noise, may become
visible when activating this function.