1
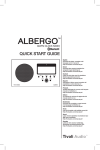
Graphical display.
1. Click Record and select Graph.
2. Select the desired start and end times (Start Time/End Time).
3. Click Search: The display will then update according to the set start and end times.
4. Selecting the type of weather data to be displayed:
-- Temperature shows 4 different variables as a data curve: Outdoor Temperature, DewPoint,
Indoor Temperature and WindChill.
-- Humidity (relative humidity) shows 2 different variables as a data curve: Indoor Humidity and
Outdoor Humidity.
-- Pressure shows 2 different variables as a data curve: Relative Pressure (relative barometric
pressure – compensated for sea-level) and Absolute Pressure (absolute barometric pressure –
barometric pressure based on your present location).
-- Wind Speed shows 2 different variables as a data curve: Windspeed and Gust.
-- Rainfall shows as a data curve.
5. Click Export as image to save as a graphic image. Enter a desired file name, designate a target folder
and click Save .
6. Click Cancel to discontinue.
Zooming in
You can enlarge portions of the graph for a more close-up view by highlighting a portion of the grid using
your mouse.
Wind speed updates
The anemometer collects readings every other second during a single 48-second interval (24 readings). • The average reading will be shown on the display under “Windspeed” (average wind speed).
• The highest measured wind speed of all 24 collected readings will be then be displayed under “Gust”.
Below is an example of how temperature, pressure and humidity readings would be displayed in graphic form.
Temperature
Pressure
Humidity
15
E ngl i s h
8.5 Displaying saved weather data as a graph