1
RETScreen® Combined Heat & Power Project Model
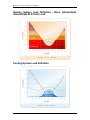
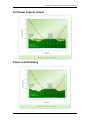
The input parameter at the top (Y axis) contributes the most to the variability of the
financial indicator while the input parameter at the bottom contributes the least. This
"tornado graph" will help the user determine which input parameters should be
considered for a more detailed analysis, if that is required.
The direction of the horizontal bar (positive or negative) provides an indication of the
relationship between the input parameter and the financial indicator. There is a positive
relationship between an input parameter and the financial indicator when an increase in
the value of that parameter results in an increase in the value of the financial indicator.
For example, there is usually a negative relationship between initial costs and the Net
Present Value (NPV), since decreasing the initial costs will increase the NPV.
In some cases, there is insufficient data to properly plot the graph. For example, when the
equity payback is immediate, the result is the "n/a" symbol, and therefore these values
cannot be plotted.
If the user makes any changes to the input range values, or navigates through any of the
other worksheets, the "Click here to calculate risk analysis" button will reappear and the
impact graph, the distribution graph and the bar graph will be crossed out, showing that
the risk analysis calculations have to be updated.
Median
The model calculates the median of the financial indicator. The median of the financial
indicator is the 50th percentile of the 500 values generated by the Monte Carlo simulation.
The median will normally be close to the financial indicator value calculated in the
Financial Summary worksheet.
Level of risk
The user enters the acceptable level of risk for the financial indicator under consideration.
The level of risk input is used to establish a confidence interval (defined by maximum
and minimum limits) within which the financial indicator is expected to fall. The level of
risk represents the probability that the financial indicator will fall outside this confidence
interval.
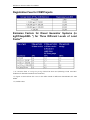
The limits of the confidence interval are automatically calculated based on the median
and the level of risk, and are shown as "Minimum within level of confidence" and
"Maximum within level of confidence."
It is suggested that the user enter a level of risk of 5 or 10%, which are typical values for
standard risk analysis.
CHP.193